Back to Journals » Journal of Pain Research » Volume 9
A preliminary evaluation of the relationship of cannabinoid blood concentrations with the analgesic response to vaporized cannabis
Authors Wilsey B, Deutsch R, Samara E, Marcotte T, Barnes A, Huestis M, Le D
Received 19 May 2016
Accepted for publication 15 June 2016
Published 31 August 2016 Volume 2016:9 Pages 587—598
DOI https://doi.org/10.2147/JPR.S113138
Checked for plagiarism Yes
Review by Single anonymous peer review
Peer reviewer comments 2
Editor who approved publication: Dr Michael Schatman
Barth L Wilsey,1,2 Reena Deutsch,3 Emil Samara,4 Thomas D Marcotte,3 Allan J Barnes,5 Marilyn A Huestis,5,6 Danny Le1,2
1VA Northern California Health Care System, Mather, CA, 2Department of Physical Medicine and Rehabilitation, University of California, Sacramento, CA, 3Department of Psychiatry, University of California, San Diego, La Jolla, CA, 4PharmaPolaris International, Davis, CA, 5Chemistry and Drug Metabolism, IRP, National Institute on Drug Abuse, Baltimore, MD, 6University of Maryland School of Medicine, Baltimore, MD, USA
Abstract: A randomized, placebo-controlled crossover trial utilizing vaporized cannabis containing placebo and 6.7% and 2.9% delta-9-tetrahydrocannabinol (THC) was performed in 42 subjects with central neuropathic pain related to spinal cord injury and disease. Subjects received two administrations of the study medication in a 4-hour interval. Blood samples for pharmacokinetic evaluation were collected, and pain assessment tests were performed immediately after the second administration and 3 hours later. Pharmacokinetic data, although limited, were consistent with literature reports, namely dose-dependent increase in systemic exposure followed by rapid disappearance of THC. Dose-dependent improvement in pain score was evident across all pain scale elements. Using mixed model regression, an evaluation of the relationship between plasma concentrations of selected cannabinoids and percent change in items from the Neuropathic Pain Scale was conducted. Changes in the concentration of THC and its nonpsychotropic metabolite, 11-nor-9-carboxy-THC, were related to percent change from baseline of several descriptors (eg, itching, burning, and deep pain). However, given the large number of multiple comparisons, false-discovery-rate-adjusted P-values were not significant. Plans for future work are outlined to explore the relationship of plasma concentrations with the analgesic response to different cannabinoids. Such an appraisal of descriptors might contribute to the identification of distinct pathophysiologic mechanisms and, ultimately, the development of mechanism-based treatment approaches for neuropathic pain, a condition that remains difficult to treat.
Keywords: cannabinoids, blood concentrations, medical marijuana, analgesia
Introduction
The constituent in cannabis responsible for its psychoactive effects is delta-9-tetrahydrocannabinol (THC). A total of 40 metabolites of this cannabinoid have been identified, of which two metabolites, 11-hydroxy-THC (11-OH-THC) and 11-nor-9-carboxy-THC (THC-COOH), have been extensively investigated. 11-OH-THC is the most important psychotropic metabolite of THC, with a spectrum of activity similar to the parent molecule.1–3 THC-COOH is the most significant nonpsychotropic metabolite of THC. Interestingly, from a forensic point of view, THC-COOH has an unusually long elimination half-life in urine. Urine toxicology tests take advantage of this fact to detect the previous use of cannabis.4
Rigorous pharmacodynamic and pharmacokinetic studies involving THC and its metabolites have been published.3,5–7 THC concentrations are detectable immediately after smoking cannabis.3 Psychotropic effects are perceived almost immediately, reaching a maximum after 15–30 minutes and declining within 3 hours.3 During this early period, THC plasma concentrations are a poor predictor of the extent of psychological effects. In fact, the peak “high” occurs, while plasma concentrations of THC are subsiding.8 This delayed effect can be explained by taking into account the distribution of THC from blood, where concentrations are measured, to the central nervous system (CNS), where psychoactive effects are produced. The pharmacokinetics of THC are characterized by a rapid distribution phase during the first hour after inhalation of cannabis followed by a slower terminal elimination phase with a half-life of ~4 days.9 The distribution phase represents the rapid diffusion of THC from the blood into the tissues,3,10,11 including the CNS, the compartment responsible for the psychoactive effects. The blood and brain concentrations decrease in parallel in both compartments during the elimination phase.12 During this phase, 1–4 hours after inhalation, a correlation between plasma THC concentration and psychoactive effects is discernible.3,5,12,13 This delay in association between plasma concentration and effect is explained by the phenomenon of counterclockwise hysteresis, whereby the psychoactive response to the plasma concentration of THC moves in a counterclockwise direction over time.14 The response for a given plasma concentration is initially low but increases as the drug is distributed out of the plasma to its site of action. When psychoactivity (eg, feel drug) is plotted on the ordinate and drug concentration of THC on the abscissa, a counterclockwise loop is formed over time (Figure 1).7 It is worth noting that the peak change in the feel drug score occurs while plasma concentrations of THC are subsiding.
 | Figure 1 Hysteresis relationship between “feel drug score” and simultaneously obtained plasma THC concentrations in six male subjects following the smoking of a single 3.55% delta-9-THC marijuana cigarette7 Note: Copyright ©1993 Wolters Kluwer. Reprinted with permission from Cone EJ, Huestis MA. Relating blood concentrations of tetrahydrocannabinol and metabolites to pharmacologic effects and time of marijuana usage. Ther Drug Monit. 1993;15(6):527–532. Promotional and commercial use of the material in print, digital or mobile device format is prohibited without the permission from the publisher Wolters Kluwer. Please contact [email protected] for further information. Abbreviation: THC, tetrahydrocannabinol. |
Whether an association between the THC plasma concentration and the change in analgesic response to cannabis has the same type of counterclockwise hysteresis as the psychoactive response is not known. Analyzing the relationship of THC concentrations with the magnitude in changes of pharmacodynamics variables related to analgesia (eg, 0–10 numerical scales of pain intensity, burning, and aching) would help answer this question. Defining those cannabinoids that are associated with changes in pain descriptors would presumably enable optimization of an analgesic effect through selection of hybrid plants with high concentrations of these cannabinoids. The current study sought to provide some insight into this subject.
Materials and methods
Regulatory approvals
The study was overseen by the UC Davis and VA Northern California Institutional Review Boards, the Research Advisory Panel of California, the US Food and Drug Administration (FDA), and the US Drug Enforcement Administration. Following approval by these entities, the National Institute on Drug Abuse (NIDA) provided bulk cannabis for experimental use subject to existing concentrations of THC in their cannabis plant material supply program.15
The protocol was registered with Clinical Trials.gov identifier NCT01555983 as part of a larger study evaluating the analgesic, neuropsychological, and psychomimetic response to vaporized cannabis in patients with spinal cord injury and disease.16
Participants
Participants were enrolled via recruitment from the UC Davis Medical Center Spinal Cord Injury Clinic, IRB-approved recruitment letters, and newspaper advertisements. Subjects with neuropathic pain, as defined by Leeds Assessment of Neuropathic Symptoms and Signs,17 between 18 years and 70 years of age with a pain intensity of 4/10 were included in the study. Participants were excluded if they had current alcohol or substance use (other than medicinal cannabis), history of schizophrenia, bipolar disorder, and serious medical conditions that might affect participant safety (eg, cardiac, or pulmonary disease, hepatic, or renal disease) or were pregnant.
Procedures
Utilizing a crossover design with a randomized sequence
of study drug administration, participants who signed an informed consent were assigned to vaporized cannabis containing placebo and 2.9% and 6.7% THC during three 8-hour visits. The main purpose of the study was to evaluate the efficacy and side profile of these study medications in patients with spinal cord injury and disease. The results were described elsewhere.16 Briefly, this study complemented the earlier investigative work that cannabis is a promising treatment in selected pain syndromes caused by injury or diseases of the nervous system.18–24
Many of the psychoactive side effects were THC concentration dependent, with greater effects seen in the higher dose compared to the lower dose, with both active doses inducing a higher response than placebo. Safety and tolerability data were also evaluated.16 No participant withdrew from the study due to an experimental intervention. One participant felt syncopal and was found to be slightly hypotensive, which responded promptly to his mechanical wheelchair being adjusted from the sitting to the reclining position. There were no study-related serious adverse events.
Details concerning vaporization of cannabis were presented in an earlier publication.24 A cumulative dosing scheme was employed to determine dosing relationships for analgesia.25,26 Sixty minutes after baseline data were obtained, participants inhaled four cannabis puffs, and after 240 minutes they inhaled an additional four to eight cannabis or placebo puffs. The second dosing was purposefully flexible as to the number of puffs permitted; experience showed that clinical trials with adaptable dose designs are almost twice more likely to demonstrate significant differences between medications and placebo than fixed-dose trials.27,28
Blood specimens
An indwelling 19 G intravenous catheter was inserted into an upper extremity upon admission to the UC Davis Clinical Research Center. Blood samples were collected within 5 minutes after the second vaporization session at 240 minutes and during recovery at 420 minutes. Specimens were collected in 6 mL Becton Dickinson ethylenediaminetetraacetic acid K2/gel tubes, stored on ice, and centrifuged for separation into plasma and erythrocytes within 2 hours of collection. Using a Pasteur pipette, the plasma was transferred into 2 mL Fisher polypropylene cryovials (catalog no: 10-500-26), sealed, and stored at -70°C for bulk processing at the conclusion of the study. Plasma samples were shipped overnight with dry ice to the Chemistry and Drug Metabolism Laboratory, Intramural Research Program, NIDA, National Institutes of Health, Baltimore, MD, USA.
Bioanalytical method
Cannabinoids were quantified by a previously validated liquid chromatography–tandem mass spectrometry (LC-MS/MS) method.29 Briefly, blood samples were collected on ice, allowed to clot, and centrifuged to separate plasma within 2 hours of collection. Plasma was deproteinized with acetonitrile, and supernatants were diluted before solid-phase extraction. The eluent was evaporated, reconstituted in mobile phase, centrifuged, and introduced into the LC-MS/MS instrument. Linear ranges were 2–200 µg/L for THC, 11-OH-THC, THC-COOH, cannabidiol (CBD), and cannabinol (CBN). Imprecision (coefficient of variation) was <10.5%, recovery was >50.5%, and bias was within ±13.1% of target for all analytes at three concentrations across the linear range.29
Pain assessments
The Neuropathic Pain Scale (NPS)30,31 assessed the patient’s self-reported pain level at baseline and following consumption of cannabis or placebo. The NPS includes two global pain domains (pain intensity and unpleasantness), six specific pain qualities (sharp, dull, sensitive, hot, cold, and itchy pain), and two spatial qualities (deep and surface pain).32 Each item is composed of an 11-point ordinal scale anchored by 0 (no pain) to 10 (strongest pain imaginable sensation).
The NPS scores were collected immediately after the second dose (at 240 minutes) and 3 hours later (420 minutes) during the recovery phase. For each participant, the percent changes in the NPS scores from baseline were calculated. No specimen was evaluated after the first vaporization session as our earlier experience demonstrated no statistically significant analgesic effect at this early time point.24
In chronic pain studies, a greater consistency in the difference in the pain intensity, 0–10 numeric rating scale score, was demonstrated using the percent change compared to the raw change.33 The calculation of a percent change serves as a way of adjusting for baseline pain. This is an important consideration in situations where baseline pain is variable across patients. Failing to calculate treatment effects as a percent change across the range of baseline values may obscure true differences in group treatment effects within a study. In addition, the use of a proportional measure correlates most consistently with clinically important differences reported on the Patient Global Impression of Change, a 7-point ordinal measure of change (eg, very much worse, much worse, minimally worse, unchanged, minimally improved, much improved, and very much improved).34
Statistical analysis
Unless stated otherwise, significance levels were set at 5% for all testing.
Cannabinoid dose and time effects
Mixed-effects linear regression with a random intercept was performed with terms for dose (2.9% vs 6.7% delta-9-THC) and time (240 minutes vs 420 minutes) for each of the five cannabinoids tested. The model also included the dose with a time interaction term. Each of the four pairs of dose–time combinations were compared with Tukey’s honestly significant difference tests when significant interactions were identified. This multiple comparison method controls for an overall 5% significance level.
Plasma concentrations of THC and metabolites and comparisons among current, ex-, and naïve cannabis users
Plasma concentrations of cannabinoids are descriptively summarized by dose, time, and previous cannabis use (current [within 30 days], former [but not current], and naïve cannabis users). Between groups, comparison was conducted with Kruskal–Wallis tests followed by Steel–Dwass pairwise comparison tests to determine whether significant differences among the subgroups existed. P-values for the Kruskal–Wallis tests and the direction of pairwise significant effects are reported.
Relationship of plasma cannabinoid concentrations and percentage change in NPS items
Linear mixed model regression was performed to test the relationships between plasma cannabinoid concentrations and percent change from baseline of the NPS scores, which were treated as continuous variables. A nonsignificant result for a cannabinoid reflects a repeated measures equivalent of a zero slope for correlation analysis between a cannabinoid and a pain feature. Subjects were treated as a random effect, and the NPS item baseline value was included in each model to adjust for the initial score. The interactions between cannabinoid and time point were tested to determine whether the cannabinoid effect on NPS differed between the second vaporization administration at 240 minutes and recovery at 420 minutes. Unadjusted P-values for the interaction term are reported if significant at the 5% level. If not significant, the interaction term is removed from the model and the unadjusted P-value for the cannabinoid main effect is reported instead. Because of the large number of cannabinoid–NPS item combinations (50 were tested: five cannabinoids × ten NPS items), the Benjamini and Hochberg step-up false discovery rate (FDR)-adjusted P-values are also reported as a control for multiple testing.35 A 5% significance level was prespecified for these adjustments. Whereas an unadjusted P-value shows the probability of concluding that a significant relationship exists between the variables when none exists (ie, a false positive), FDRs estimate the expected proportion of false positives out of just the tests with significant results when multiple testing is performed. Linear mixed effects modeling was also performed to compare percent changes from baseline for each NPS item between doses separately for the second vaporization session and at the end of the visit (recovery).
Results
Demographics
A total of 42 participants were enrolled, among whom 69% were males with a mean age of 46.4 years; 62% were Caucasian, 17% Hispanic, 12% Black, 5% Asian, and 5% other. Of the 42 participants, 17 were current cannabis users, 21 were ex-users, and four had never been exposed to cannabis prior to the study.
Amount of cannabis vaporized
The mean (range) of herbal cannabis vaporized was 45.9 mg (29.9–83.8 mg) during the 2.9% THC sessions and 56.3 mg (15.7–172.9 mg) during the 6.7% THC sessions. These values were derived from the research pharmacy’s accountability record of dispensed and returned cannabis. Thus, they are not precise estimates of inhaled quantities since an unknown amount of vapor escaped into the atmosphere during emptying of the vaporizer bags at the end of each inhalation session. Thus, the nominal dose rather than the actual dose was used for all calculations.
Cannabinoid pharmacokinetics
At the time of the second vaporization administration (240 minutes), the concentrations of THC, the main cannabinoid in the plant, were measurable in all subjects except one. THC concentrations were highly variable with relatively large coefficients of variation and increased proportionately with dose; the median concentrations were 23 µg/L and 47 µg/L for the low and high dose, respectively (Table 1). The major metabolites of THC, namely 11-OH-THC and THC-COOH, were measurable in a large number of subjects especially in the high-dose group. These metabolite concentrations also demonstrated large intersubject variability and increased with dose.
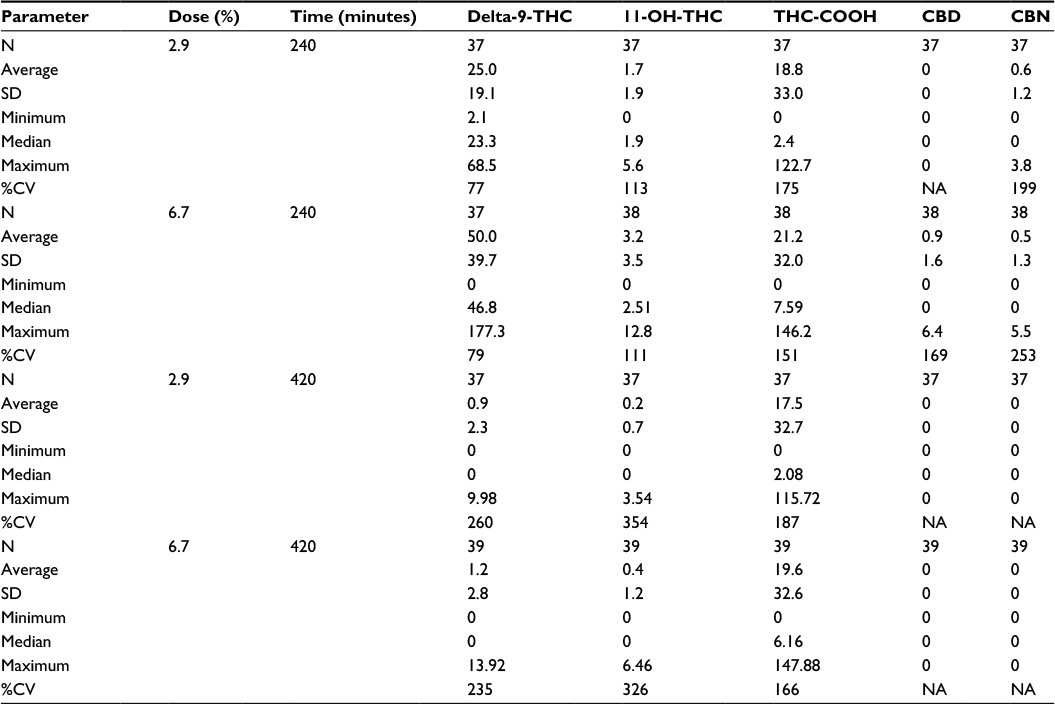 | Table 1 Pharmacokinetic profile of cannabinoids and metabolites (cannabinoid and metabolite concentrations are reported in ng/ml) Notes: 2.9, 2.9% delta-9-THC; 6.7, 6.7% delta-9-THC; 240, 240 minutes (second vaporization administration); 420, 420 minutes (recovery period). Abbreviations: CBD, cannabidiol; CBN, cannabinol; SD, standard deviation; %CV, percent coefficient of variation; THC, tetrahydrocannabinol; 11-OH-THC, 11-hydroxy-THC; THC-COOH, 11-nor-9-carboxy-THC. |
The concentrations of CBD and CBN were below the limit of quantification (2 µg/L) in the majority of subjects and did not exceed 6.5 µg/L in the remaining subjects (details concerning the supply of low CBD and CBN concentrations in cannabis supplied by NIDA Drug Supply Program are given in the “Discussion” section). Three hours after the second vaporization session (420 minutes), the concentrations of THC and 11-OH-THC were below the limit of quantification in the majority of subjects, while THC-COOH concentration was measurable in most subjects. These observations were consistent with the relatively long half-life of THC-COOH compared to THC and 11-OH-THC. Similar to THC, CBD and CBN concentrations were below the limits of quantification in all subjects at 420 minutes.
The four pairs of dose–time combinations (2.9% at 240 minutes, 6.7% at 240 minutes, 2.9% at 420 minutes, and 6.7% at 420 minutes) are presented in Table 2. Using Tukey’s honestly significant difference tests when significant interactions were identified, the direction of dose and time effects are presented in Table 2. Statistically significant dose × time effects were evident (P=0.0003 for THC, P=0.0243 for 11-OH-THC). As expected, THC and 11-OH-THC concentrations were higher with administration of 6.7% THC than with 2.9% THC at 240 minutes. Concentrations subsequently declined over the next 3 hours. As shown in Table 3, THC-COOH concentrations were evident after the second vaporization session (240 minutes) having been metabolized from THC following the first vaporization session (60 minutes). THC-COOH concentrations did not vary significantly from those noted 3 hours later during recovery (P=0.4756). Statistically significant dose × time effects were evident for CBD (P=0.0005) but not for CBN (P=0.7237). As the pharmacokinetics of CBD are similar to those of THC,3 significant dose × time effects were reasonable.
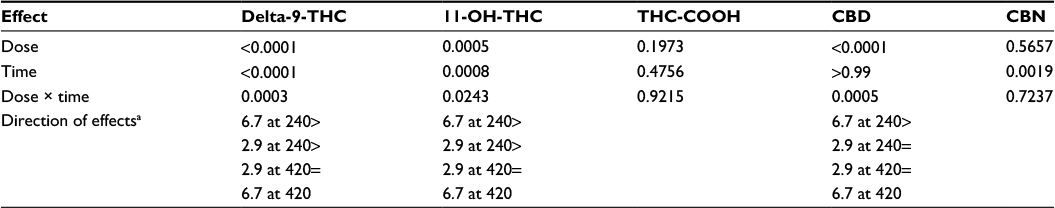 | Table 2 P-values and effects for linear mixed model estimation of plasma levels of delta-9-THC and metabolites Notes: aWhen statistically significant interactions were identified, the direction of effects is provided and presented vertically to provide comparisons of plasma concentrations. Abbreviations: 2.9, 2.9% delta-9-THC; 6.7, 6.7% delta-9-THC; 240, 240 minutes (second vaporization administration); 420 minutes (recovery period); CBD, cannabidiol; CBN, cannabinol; THC, tetrahydrocannabinol; 11-OH-THC, 11-hydroxy-THC; THC-COOH, 11-nor-9-carboxy-THC. |
Plasma cannabinoid and metabolite concentration comparisons among current, ex-, and naïve cannabis users
Summary statistics of the plasma concentrations of the primary active cannabinoid THC, the primary active metabolite, 11-OH-THC, the primary inactive metabolite THC-COOH, and other cannabinoids (CBD and CBN) are presented in Table 3 for current, ex-, and naïve cannabis users. Consistent with the notion that cannabis smoking history plays a major role in cannabinoid detection,3 current users had statistically significant higher concentrations of these cannabinoids than ex-users at one or both of the two time points for THC, 11-OH-THC, and THC-COOH (Table 3). Consistent with its long half-life, the magnitude of the differences between current and ex-users were greatest for THC-COOH at both time points. There were only four naïve cannabis subjects (including one without a vaporization session for 6.7% THC), which likely did not allow for sufficient power to detect significant differences for this subgroup.
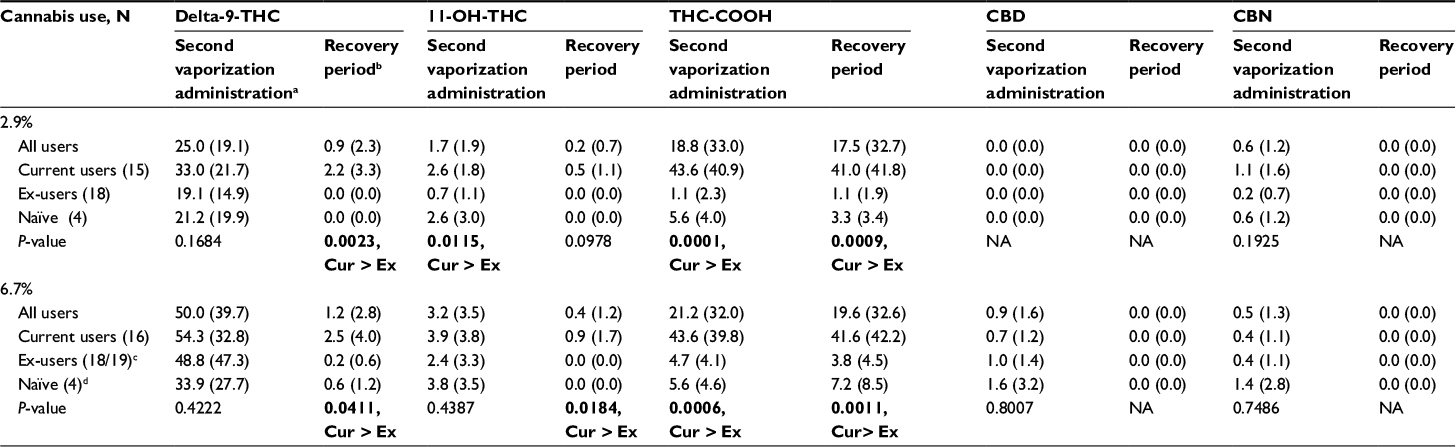 | Table 3 Mean (SD) plasma levels of delta-9-THC and metabolites, and comparisons among current, ex-, and naïve cannabis users Notes: aSecond vaporization administration represents the timing of the blood draw immediately after the second vaporization session which occurred at 240 minutes. bThe recovery period represents blood draw occurred 3 hours later at 420 minutes. cN=18 for the second vaporization administration, N=19 for the recovery period. dN=3 for delta-9-THC for the second vaporization administration. Significant Kruskal–Wallis comparison P-values are in bold; Cur > Ex means that current users had higher levels than ex-users according to Steel–Dwass pairwise comparisons. Abbreviations: CBD, cannabidiol; CBN, cannabinol; Cur, current users; Ex, ex-users; 11-OH-THC, 11-hydroxy-THC; NA, not analyzed due to all zero values; THC, tetrahydrocannabinol; THC-COOH, 11-nor-9-carboxy-THC; SD, standard deviation. |
Relationship of plasma cannabinoid concentrations and percentage change in NPS items
When compared to 2.9% THC cannabis, 6.7% THC cannabis provided more relief as indicated by a greater negative percent change from baseline for all tested parameters (Figure 2). However, statistical significance was attained for only two of the ten items of the NPS. Both burning and itching were reduced significantly more from baseline with the higher active THC dose than for the lower one (P=0.0395 and P=0.0174, respectively). This occurred only after the second vaporization session at 240 minutes and not during recovery at 420 minutes.
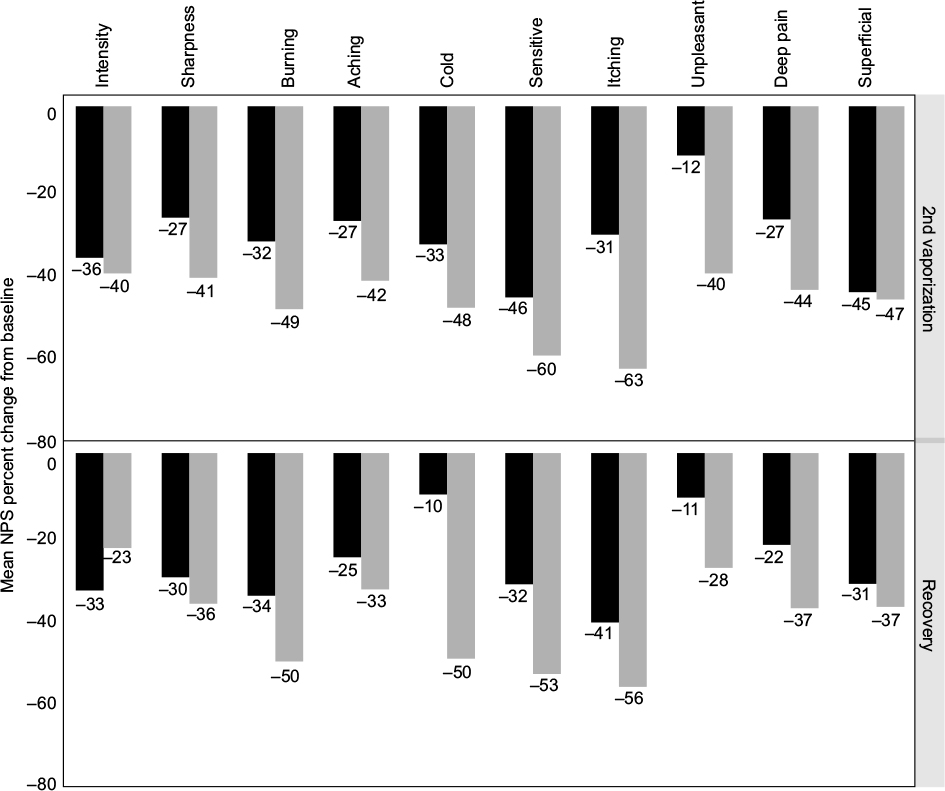 | Figure 2 Average percent changes for NPS comparing 2.9% delta-9-THC cannabis (black bars) to 6.7% delta-9-THC cannabis (gray bars) after the second vaporization and recovery sessions. Abbreviations: NPS, Neuropathic Pain Scale; THC, tetrahydrocannabinol. |
The results of linear mixed effects modeling to test the relationships between mean plasma cannabinoid concentrations and percentage change of the NPS items are presented in Table 4. The interaction with time was significant for the cannabinoid THC-COOH when estimating percent change of itching (P=0.0364). There was a larger reduction in itching for higher THC-COOH values at 240 minutes after the second vaporization (estimated effect size of 73% vs 48% reduction at the 90th vs 10th percentile of plasma THC-COOH concentrations, respectively), but essentially a trivial effect of THC-COOH on itching at recovery at 420 minutes (estimated effect size of 48% vs 55% reduction for 90th and tenth percentiles of plasma concentrations, respectively). Only two cannabinoids in the absence of interaction with time had a significant relationship with percent change of a pain feature. Higher concentrations of the cannabinoid corresponded to more pain relief (beta coefficient [95% confidence interval]): THC-COOH for deep pain (-0.005 [-0.008, -0.001], an effect size of 61% vs 27% reduction for THC-COOH at the 90th and 10th percentiles of plasma concentrations, respectively, P=0.0115). The (-0.004 [-0.007, -0.001] was a 50% vs 25% reduction for 90th and tenth THC percentiles of plasma concentrations, respectively, P=0.0105). Despite individual significance for these three cannabinoid–NPS item combinations, after adjusting for the FDR, significance was not sustained.
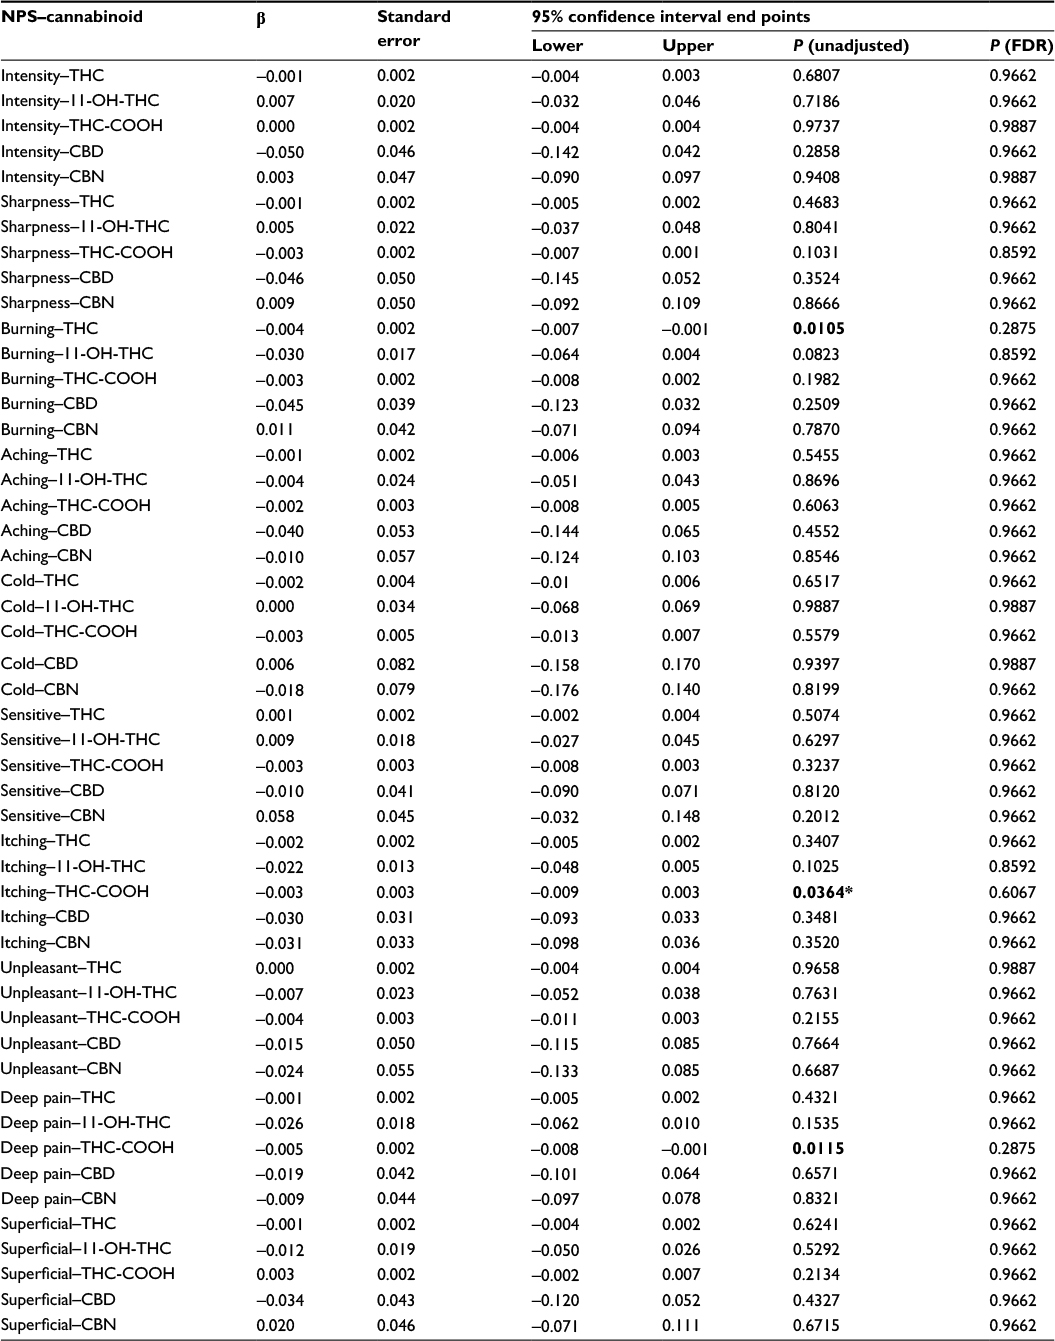 | Table 4 Linear mixed model estimation of the percent change from baseline of NPS items by cannabinoid blood levels, adjusted for baseline scores Notes: Significant unadjusted P-values are in bold. *P-value for interaction term. β, regression coefficient; P (FDR), false-discovery-rate-adjusted P-value. Abbreviations: CBD, cannabidiol; CBN, cannabinol; 11-OH-THC, 11-hydroxy-THC; NPS, Neuropathic Pain Scale; THC, tetrahydrocannabinol; THC-COOH, 11-nor-9-carboxy-THC. |
Discussion
For the most part, a neuropathic pain treatment is constrained by an inability to match an individual patient’s complaint with pain mechanisms to optimize a therapeutic approach. Evidence indicates that self-report verbal pain descriptors, such as those in the NPS, depict important pain dimensions.36 The assessment of patterns of pain symptoms using descriptors might contribute to the identification of distinct pathophysiologic mechanisms and the development of mechanism-based treatment approaches.37 Elucidation of a relationship between a reduction in the magnitude of a descriptor with an increased plasma concentration of a cannabinoid might foster a personalized approach to treatment. This method would be welcomed; despite optimization of current pharmaceutical therapy, neuropathic pain is unrelieved or inadequately treated in 40%–60% of patients.37
In the current study, the relationships between the percentage change of the NPS items and mean plasma cannabinoid concentrations were not significant after an FDR adjustment. Yet, distinct signals were evident that deserve further inquiry. Interactions with time occurred with one cannabinoid for estimating NPS items; changes in itching differed at 240 minutes and 420 minutes. Following a normal dose–response relationship, there was a larger reduction for itching at higher THC-COOH concentrations during the second vaporization session. THC-COOH and THC had significant relationships with the percent change for deep pain and burning, respectively. Inasmuch as THC-COOH possesses anti-inflammatory and analgesic properties,3,38,39 an analgesic effect from this cannabinoid would entail a rational basis. That THC would alleviate burning pain would also be consistent with earlier experimental findings.20 Using the capsaicin intradermal human experimental pain model, significant negative correlations were found between pain perception and THC concentrations. Concordantly, a rodent model was consistent with analgesia resulting from CB1 receptors activation by THC; other constituents of cannabis influenced this effect only minimally.40
Clearly, additional work correlating different cannabinoid concentrations with pain descriptors will be of value. In the future, it would be advisable to plot a pharmacokinetic (plasma concentration) vs pharmacodynamic (change in pain descriptor) relationship for various cannabinoids. This would require additional time points such as those illustrated in Figure 1. To synchronize the timing, one could have participants inhale cannabis ad libitum within 10 minutes so that blood specimens could be obtained at 0.5 hours, 1 hour, 1.5 hours, 2 hours, 2.5 hours, 3 hours, 4 hours, 6 hours, 8 hours, and 12 hours after smoking initiation. Simultaneously, NPS items could be administered. To increase the power of the study, it might be advisable to query only the three descriptors found to have significant effects in the current study (ie, burning, itching, and deep pain). The approximate 0.5-hour time lag resulting from falling concentrations in plasma after smoking and the rise in the CNS concentrations where analgesic effects are produced would not adversely affect the results given the time points chosen. During the redistribution phase, it would be expected that the response (ie, percent change in NPS items) would be proportional to the plasma cannabinoid concentrations, if in fact the cannabinoid being examined were responsible for the analgesic effect being queried.
The samples collected at 240 minutes and during recovery at 420 minutes in the current study permitted the evaluation of plasma concentrations during intervals when plasma THC concentration would have been expected to have reached equilibrium with the CNS. However, the sampling of concentrations only twice was certainly a limitation of the current study. Increasing the time points as described earlier would be expected to provide additional information and would permit pharmacokinetic analyses. For instance, this would allow interactions of THC with other cannabinoids to be evaluated through the determination of maximal plasma concentrations (Cmax), time to reach Cmax (Tmax), and area under the plasma concentration–time curve from administration until the last sampling point (t) equal or above the lower limit of quantification (area under the curve [AUC]0–t) for other cannabinoids. Dissimilarities between these pharmacokinetic values following the presentation of different doses of a cannabinoid (eg, CBD) with identical amounts of THC would indicate an interaction. The optimal circumstance would be where the other cannabinoid augments the analgesic effects of THC without significantly altering its plasma concentration. The combination may then allow for treatment at a lower dose of THC with the occurrence, potentially, of fewer adverse effects.
Thus far, there have been a limited number of studies involving interactions among cannabinoids. The exception to this statement is the combination of THC and CBD. GW Pharmaceuticals plc (Cambridge, UK) manufactures nabiximols, trade name Sativex®, which is an extract of cannabis containing these two cannabinoids in a nearly 1:1 ratio on a milligram basis. Delivered as a mouth spray, Sativex® has been approved in more than 15 countries (including the UK, Spain, Italy, and Germany) for the treatment of spasticity.41 Clinical studies also confirmed that patients with neuropathic pain derive benefit from this medication.42,43 The rationale for integrating these two cannabinoids is straightforward; CBD may counteract some of the negative effects of THC (eg, psychoactivity and anxiety).44–47
CBD does not bind to the known cannabinoid receptors.48 Instead, it acts as an agonist of the transient receptor potential cation channel subfamily V member 1 (TRPV1) receptor where it is of equal potency to capsaicin.44,49 It also inhibits reuptake and hydrolysis of anandamide, one of the naturally occurring cannabinoid receptor agonists.44,49 Although a primary analgesic effect has never been demonstrated clinically, CBD may reduce pain through both its TRPV1 agonist activity and by modulating endocannabinoid levels. As an inhibitor of multiple cytochrome P450 enzymes (eg, CYP1A2, CYP2B6, CYP2C9, CYP2D6, and CYP3A4CBD), CBD may be expected to demonstrate pharmacokinetic interaction with other medications.50–54 However, a modulation of THC’s effects by CBD has not been demonstrated to be due to a pharmacokinetic interaction at therapeutic doses. Specifically, no statistically significant differences in Cmax or in the AUC were found between different doses of Sativex® with identical amounts of oral THC.6
The current study was not able to analyze the effect of CBD (nor CBN) on pain scores as negligible plasma concentrations were detected (Table 1). Presumably, the amount of these cannabinoids in the stock supplies provided by the NIDA at the time this study was initiated was minimal. In the interim, the availability of research grade cannabis plant material available from NIDA (NIDA Drug Supply Program, NIDA, National Institutes of Health Department of Health And Human Services, 6001 Executive Boulevard Bethesda, Maryland 20892-9555) has undergone substantial upgrading in terms of variability.15 THC and CBD can each be provided in low (<1%), medium (1%–5%), high (5%–10%), and very high (>10%) concentrations. NIDA will also offer to prepare cannabis with specific THC and CBD content by mixing batches to meet researcher needs.15 NIDA bulk cannabis contains relatively small amounts of other cannabinoids (eg, cannabichromene, cannabigerol, CBN, and tetrahydrocannabivarin). Only time will tell if these other cannabinoids gain prominence because of beneficial effects and undergo preferential cultivation and harvesting in the future.
NIDA now allows a synthetic, pharmaceutical CBD to be produced under current good manufacturing practice (cGMP) conditions at an FDA-inspected and a Drug-Enforcement-Administration approved facility. The availability of this cGMP product is limited to diseases with an FDA Orphan Drug Designation (ie, conditions affecting fewer than 200,000 patients in the US).55 Insys Therapeutics, Inc. (Chandler, AZ, USA) was granted this designation for its pharmaceutical grade CBD to treat pediatric seizures (eg, Dravet syndrome and Lennox–Gastaut syndrome), pediatric schizophrenia, infantile spasms, glioma, and glioblastoma multiforme.56 Given this restricted list, the use of monotherapy with CBD is not currently an option for a clinical trial evaluating pain treatments. However, the research grade cannabis plant material described earlier which is available from the NIDA Drug Supply Program provides the ability to explore different strengths of CBD to learn more about its potential for the treatment of chronic pain. As most patients in the US grow their own medical cannabis or purchase it from dispensaries,57 it would be appropriate to conduct clinical studies evaluating herbal cannabinoid preparations. Having the ability to evaluate the relationship between plasma concentrations and analgesia will be an obligatory step in this process. Further high-quality studies are needed to assess the impact of different cannabinoids on the analgesic response as well as the interactions among cannabinoids.
Acknowledgments
Research reported in this publication was supported by the UC Center for Medicinal Cannabis Research and the NIDA of the National Institutes of Health under award number R01DA030424. The content is solely the responsibility of the authors and does not necessarily represent the official views of the National Institutes of Health or the Department of Veterans Affairs.
Disclosure
The authors report no other conflicts of interest in this work.
References
Perez-Reyes M, Timmons MC, Lipton MA, Davis KH, Wall ME. Intravenous injection in man of 9 -tetrahydrocannabinol and 11-OH- 9 -tetrahydrocannabinol. Science. 1972;177(4049):633–635. | ||
Lemberger L, Crabtree RE, Rowe HM. 11-hydroxy-9-tetrahydrocannabinol: pharmacology, disposition, and metabolism of a major metabolite of marihuana in man. Science. 1972;177(4043):62–64. | ||
Grotenhermen F. Pharmacokinetics and pharmacodynamics of cannabinoids. Clin Pharmacokinet. 2003;42(4):327–360. | ||
Huestis MA, Mitchell JM, Cone EJ. Urinary excretion profiles of 11-nor-9-carboxy-delta 9-tetrahydrocannabinol in humans after single smoked doses of marijuana. J Anal Toxicol. 1996;20(6):441–452. | ||
Barnett G, Licko V, Thompson T. Behavioral pharmacokinetics of marijuana. Psychopharmacology (Berl). 1985;85(1):51–56. | ||
Karschner EL, Darwin WD, Goodwin RS, Wright S, Huestis MA. Plasma cannabinoid pharmacokinetics following controlled oral delta9-tetrahydrocannabinol and oromucosal cannabis extract administration. Clin Chem. 2011;57(1):66–75. | ||
Cone EJ, Huestis MA. Relating blood concentrations of tetrahydrocannabinol and metabolites to pharmacologic effects and time of marijuana usage. Ther Drug Monit. 1993;15(6):527–532. | ||
Hollister LE, Gillespie HK, Ohlsson A, Lindgren JE, Wahlen A, Agurell S. Do plasma concentrations of delta 9-tetrahydrocannabinol reflect the degree of intoxication? J Clin Pharmacol. 1981;21(8–9 suppl):171S–177S. | ||
Wall ME, Sadler BM, Brine D, Taylor H, Perez-Reyes M. Metabolism, disposition, and kinetics of delta-9-tetrahydrocannabinol in men and women. Clin Pharmacol Ther. 1983;34(3):352–363. | ||
Sticht G, Käferstein H. Grundbegriffe, toxikokinetik und toxikodynamik [Basic concepts, toxicokinetics and toxicodynamics]. In: Berghaus G, Kriiger HP, editors. Cannabis im Straßenverkehr. Stuttgart: Gustav Fischer; 1998:1–11. German. | ||
Rosenbaum S. Basic Pharmacokinetics and Pharmacodynamics: An Integrated Textbook and Computer Simulations. Hoboken, NJ: John Wiley & Sons; 2011. | ||
Chiang CW, Barnett G. Marijuana effect and delta-9-tetrahydrocannabinol plasma level. Clin Pharmacol Ther. 1984;36(2):234–238. | ||
Cocchetto DM, Owens SM, Perez-Reyes M, DiGuiseppi S, Miller LL. Relationship between plasma delta-9-tetrahydrocannabinol concentration and pharmacologic effects in man. Psychopharmacology (Berl). 1981;75(2):158–164. | ||
Pleuvry B. Hysteresis in drug response. Anaesth Intensive Care Med. 2005;6(8):286–287. | ||
NIH [webpage on the Internet]. Marijuana Plant Material Available from the NIDA Drug Supply Program. Available from: http://www.drugabuse.gov/researchers/research-resources/nida-drug-supply-program-dsp/marijuana-plant-material-available-nida-drug-supply-program. Accessed June 6, 2015. | ||
Wilsey B, Marcotte T, Deutsch R, Zhao H, Prasad H, Phan A. An exploratory human laboratory experiment evaluating vaporized cannabis in the treatment of neuropathic pain from spinal cord injury and disease. J Pain. Epub 2016 Jun 7. | ||
Bennett M. The LANSS Pain Scale: the Leeds assessment of neuropathic symptoms and signs. Pain. 2001;92(1–2):147–157. | ||
Abrams DI, Jay CA, Shade SB, et al. Cannabis in painful HIV-associated sensory neuropathy: a randomized placebo-controlled trial. Neurology. 2007;68(7):515–521. | ||
Ellis RJ, Toperoff W, Vaida F, et al. Smoked medicinal cannabis for neuropathic pain in HIV: a randomized, crossover clinical trial. Neuropsychopharmacology. 2009;34(3):672–680. | ||
Wallace M, Schulteis G, Atkinson JH, et al. Dose-dependent effects of smoked cannabis on capsaicin-induced pain and hyperalgesia in healthy volunteers. Anesthesiology. 2007;107(5):785–796. | ||
Wallace MS, Marcotte TD, Umlauf A, Gouaux B, Atkinson JH. Efficacy of inhaled cannabis on painful diabetic neuropathy. J Pain. 2015;16(7):616–627. | ||
Ware MA, Wang T, Shapiro S, et al. Smoked cannabis for chronic neuropathic pain: a randomized controlled trial. CMAJ. 2010;182(14):E694–E701. | ||
Wilsey B, Marcotte T, Tsodikov A, et al. A randomized, placebo-controlled, crossover trial of cannabis cigarettes in neuropathic pain. J Pain. 2008;9(6):506–521. | ||
Wilsey B, Marcotte T, Deutsch R, Gouaux B, Sakai S, Donaghe H. Low-dose vaporized cannabis significantly improves neuropathic pain. J Pain. 2013;14(2):136–148. | ||
Chait LD, Corwin RL, Johanson CE. A cumulative dosing procedure for administering marijuana smoke to humans. Pharmacol Biochem Behav. 1988;29(3):553–557. | ||
Greenwald MK, Stitzer ML. Antinociceptive, subjective and behavioral effects of smoked marijuana in humans. Drug Alcohol Depend. 2000;59(3):261–275. | ||
Khan A, Kolts RL, Thase ME, Krishnan KR, Brown W. Research design features and patient characteristics associated with the outcome of antidepressant clinical trials. Am J Psychiatry. 2004;161(11):2045–2049. | ||
Khan A, Schwartz K. Study designs and outcomes in antidepressant clinical trials. Essent Psychopharmacol. 2005;6(4):221–226. | ||
Schwope DM, Scheidweiler KB, Huestis MA. Direct quantification of cannabinoids and cannabinoid glucuronides in whole blood by liquid chromatography-tandem mass spectrometry. Anal Bioanal Chem. 2011;401(4):1273–1283. | ||
Galer BS, Jensen MP. Development and preliminary validation of a pain measure specific to neuropathic pain: the Neuropathic Pain Scale. Neurology. 1997;48(2):332–338. | ||
Jensen MP, Dworkin RH, Gammaitoni AR, Olaleye DO, Oleka N, Galer BS. Assessment of pain quality in chronic neuropathic and nociceptive pain clinical trials with the Neuropathic Pain Scale. J Pain. 2005;6(2):98–106. | ||
Jensen MP. Review of measures of neuropathic pain. Curr Pain Headache Rep. 2006;10(3):159–166. | ||
Farrar JT, Young JP Jr, LaMoreaux L, Werth JL, Poole RM. Clinical importance of changes in chronic pain intensity measured on an 11-point numerical pain rating scale. Pain. 2001;94(2):149–158. | ||
Farrar JT, Polomano RC, Berlin JA, Strom BL. A comparison of change in the 0-10 numeric rating scale to a pain relief scale and global medication performance scale in a short-term clinical trial of breakthrough pain intensity. Anesthesiology. 2010;112(6):1464–1472. | ||
Benjamini Y, Hochberg Y. Controlling the false discovery rate: a practical and powerful approach to multiple testing. J R Stat Soc Series B Stat Methodol. 1995;57(1):289–300. | ||
Gilron I, Tu D, Holden RR. Sensory and affective pain descriptors respond differentially to pharmacological interventions in neuropathic conditions. Clin J Pain. 2013;29(2):124–131. | ||
Dworkin RH, Jensen MP, Gammaitoni AR, Olaleye DO, Galer BS. Symptom profiles differ in patients with neuropathic versus non-neuropathic pain. J Pain. 2007;8(2):118–126. | ||
Doyle SA, Burstein SH, Dewey WL, Welch SP. Further studies on the antinociceptive effects of delta 6-THC-7-oic acid. Agents Actions. 1990;31(1–2):157–163. | ||
Burstein SH. The cannabinoid acids: nonpsychoactive derivatives with therapeutic potential. Pharmacol Ther. 1999;82(1):87–96. | ||
Varvel SA, Bridgen DT, Tao Q, Thomas BF, Martin BR, Lichtman AH. Delta9-tetrahydrocannbinol accounts for the antinociceptive, hypothermic, and cataleptic effects of marijuana in mice. J Pharmacol Exp Ther. 2005;314(1):329–337. | ||
GW Pharmaceuticals Sativex [homepage on the Internet]. Available from: http://www.gwpharm.com/default.aspx. Accessed June 14, 2016. | ||
Rahn EJ, Hohmann AG. Cannabinoids as pharmacotherapies for neuropathic pain: from the bench to the bedside. Neurotherapeutics. 2009;S6(4):713–737. | ||
Serpell M, Ratcliffe S, Hovorka J, et al. A double-blind, randomized, placebo-controlled, parallel group study of THC/CBD spray in peripheral neuropathic pain treatment. Eur J Pain. 2014;18(7):999–1012. | ||
Russo E, Guy GW. A tale of two cannabinoids: the therapeutic rationale for combining tetrahydrocannabinol and cannabidiol. Med Hypotheses. 2006;66(2):234–246. | ||
Zuardi AW, Shirakawa I, Finkelfarb E, Karniol IG. Action of cannabidiol on the anxiety and other effects produced by delta 9-THC in normal subjects. Psychopharmacology (Berl). 1982;76(3):245–250. | ||
Karniol IG, Shirakawa I, Kasinski N, Pfeferman A, Carlini EA. Cannabidiol interferes with the effects of delta 9-tetrahydrocannabinol in man. Eur J Pharmacol. 1974;28(1):172–177. | ||
Dalton WS, Martz R, Lemberger L, Rodda BE, Forney RB. Influence of cannabidiol on delta-9-tetrahydrocannabinol effects. Clin Pharmacol Ther. 1976;19(3):300–309. | ||
Mechoulam R, Hanus L. Cannabidiol: an overview of some chemical and pharmacological aspects. Part I: chemical aspects. Chem Phys Lipids. 2002;121(1–2):35–43. | ||
Bisogno T, Hanus L, De Petrocellis L, et al. Molecular targets for cannabidiol and its synthetic analogues: effect on vanilloid VR1 receptors and on the cellular uptake and enzymatic hydrolysis of anandamide. Br J Pharmacol. 2001;134(4):845–852. | ||
Zhornitsky S, Potvin S. Cannabidiol in humans – the quest for therapeutic targets. Pharmaceuticals (Basel). 2012;5(5):529–552. | ||
Yamaori S, Kushihara M, Yamamoto I, Watanabe K. Characterization of major phytocannabinoids, cannabidiol and cannabinol, as isoform-selective and potent inhibitors of human CYP1 enzymes. Biochem Pharmacol. 2010;79(11):1691–1698. | ||
Yamaori S, Ebisawa J, Okushima Y, Yamamoto I, Watanabe K. Potent inhibition of human cytochrome P450 3A isoforms by cannabidiol: role of phenolic hydroxyl groups in the resorcinol moiety. Life Sci. 2011;88(15–16):730–736. | ||
Yamaori S, Okamoto Y, Yamamoto I, Watanabe K. Cannabidiol, a major phytocannabinoid, as a potent atypical inhibitor for CYP2D6. Drug Metab Dispos. 2011;39(11):2049–2056. | ||
Yamaori S, Koeda K, Kushihara M, Hada Y, Yamamoto I, Watanabe K. Comparison in the in vitro inhibitory effects of major phytocannabinoids and polycyclic aromatic hydrocarbons contained in marijuana smoke on cytochrome P450 2C9 activity. Drug Metab Pharmacokinet. 2012;27(3):294–300. | ||
MarketWatch [webpage on the Internet]. Insys Therapeutics Receives FDA Orphan Drug Designation for Its Pharmaceutical Cannabidiol as a Potential Treatment for Dravet Syndrome, a Rare Form of Epilepsy. MarketWatch is a subsidiary of Dow Jones, a property of News Corp. Available from: http://www.marketwatch.com/story/insys-therapeutics-receives-fda-orphan-drug-designation-for-its-pharmaceutical-cannabidiol-as-a-potential-treatment-for-dravet-syndrome-a-rare-form-of-epilepsy-2014-07-02. Accessed June 14, 2016. | ||
ZACKS [webpage on the Internet]. Insys’ Cannabidiol Gets another Orphan Drug Designation. Zacks Investment Research. Available from: http://www.zacks.com/stock/news/155288/insys-cannabidiol-gets-another-orphan-drug-designation#sthash.aKGjYEOn.dpuf. Accessed June 14, 2016. | ||
Borgelt LM, Franson KL, Nussbaum AM, Wang GS. The pharmacologic and clinical effects of medical cannabis. Pharmacotherapy. 2013;33(2):195–209. |
 © 2016 The Author(s). This work is published and licensed by Dove Medical Press Limited. The
full terms of this license are available at https://www.dovepress.com/terms
and incorporate the Creative Commons Attribution
- Non Commercial (unported, 3.0) License.
By accessing the work you hereby accept the Terms. Non-commercial uses of the work are permitted
without any further permission from Dove Medical Press Limited, provided the work is properly
attributed. For permission for commercial use of this work, please see paragraphs 4.2 and 5 of our Terms.
© 2016 The Author(s). This work is published and licensed by Dove Medical Press Limited. The
full terms of this license are available at https://www.dovepress.com/terms
and incorporate the Creative Commons Attribution
- Non Commercial (unported, 3.0) License.
By accessing the work you hereby accept the Terms. Non-commercial uses of the work are permitted
without any further permission from Dove Medical Press Limited, provided the work is properly
attributed. For permission for commercial use of this work, please see paragraphs 4.2 and 5 of our Terms.