Back to Journals » ClinicoEconomics and Outcomes Research » Volume 13
A Predictive Model for Progression of Chronic Kidney Disease to Kidney Failure Using a Large Administrative Claims Database
Authors Dai D ![]() , Alvarez PJ, Woods SD
, Alvarez PJ, Woods SD
Received 3 April 2021
Accepted for publication 18 May 2021
Published 4 June 2021 Volume 2021:13 Pages 475—486
DOI https://doi.org/10.2147/CEOR.S313857
Checked for plagiarism Yes
Review by Single anonymous peer review
Peer reviewer comments 2
Editor who approved publication: Professor Giorgio Colombo
Dingwei Dai,1 Paula J Alvarez,2 Steven D Woods2
1Clinical Trial Services, Part of the CVS Health Family of Companies, Woonsocket, RI, USA; 2Managed Care Health Outcomes, Vifor Pharma, Inc., Redwood City, CA, USA
Correspondence: Dingwei Dai
Clinical Trial Services, Part of the CVS Health Family of Companies, 101 Park Ave, 15th Floor, Mail Code F109, New York, NY, 10178-2104, USA
Tel +1 215-775-4262
Email [email protected]
Background: To create an appropriate chronic kidney disease (CKD) management program, we developed a predictive model to identify patients in a large administrative claims database with CKD stages 3 or 4 who were at high risk for progression to kidney failure.
Methods: The predictive model was developed and validated utilizing a subset of patients with CKD stages 3 or 4 derived from a large Aetna claims database. The study spanned 36 months, comprised of a 12-month (2015) baseline period and a 24-month (2016– 2017) prediction period. All patients were ≥ 18 years of age and continuously enrolled for 36 months. Multivariate logistic regression was used to develop models. Prediction model performance measures included area under the receiver operating characteristic curve (AUROC), calibration, and gain and lift charts.
Results: Of the 74,114 patients identified as having CKD stages 3 or 4 during the baseline period, 2476 (3.3%) had incident kidney failure during the prediction period. The predictive model included the effect of numerous variables, including age, gender, CKD stage, hypertension (HTN), diabetes mellitus (DM), congestive heart failure, peripheral vascular disease, anemia, hyperkalemia (HK), prospective episode risk group score, and poor adherence to renin-angiotensin-aldosterone system inhibitors. The strongest predictors of progression to kidney failure were CKD stage (4 vs 3), HTN, DM, and HK. The ROC and calibration analyses in the validation sample demonstrated good predictive accuracy (AUROC=0.844) and calibration. The top two prediction deciles identified 70.8% of patients who progressed to kidney failure during the prediction period.
Conclusion: This novel predictive model had good accuracy for identifying, from a large national database, patients with CKD who were at high risk of progressing to kidney failure within 2 years. Early identification using this model could potentially lead to improved health outcomes and reduced healthcare expenditures in this at-risk population.
Keywords: chronic kidney disease, kidney failure, predictive models, administrative claims data, renin-angiotensin-aldosterone system inhibitors, chronic kidney disease management
Introduction
Chronic kidney disease (CKD) is a significant public health issue that affects approximately 47 million individuals in the United States, nearly 15% of the adult population.1,2 CKD stage 3 alone has the highest prevalence rate, at 6.4%.1 CKD is associated with elevated morbidity, mortality, and healthcare expenditures, due primarily to the high risk of hospitalization, cardiovascular disease, progression to kidney failure, and death.1–5 Similar estimates of disease burden and prevalence have been reported for CKD around the globe.6,7
CKD exacts an enormous economic toll, particularly in later stages of the disease.4 In 2016, fee-for-service (FFS) Medicare spending for all beneficiaries with CKD (and no end-stage renal disease [ESRD]), which compose 12.5% of all FFS Medicare beneficiaries, was reported to exceed $79 billion. This represented more than 23% of all Medicare costs that year.1 On average, each beneficiary without CKD costs Medicare $12,024 per person per year (PPPY), compared to $23,558 PPPY for beneficiaries with CKD.1 However, costs for CKD rose in concert with disease severity: from $19,074 PPPY for CKD stages 1–2, to $29,151 PPPY for CKD stages 4–5, to $78,852 PPPY for ESRD.1 We recently reported similar results in CKD patients with hyperkalemia (HK), who utilize more healthcare resources than CKD patients without HK, leading to more than double the healthcare costs.8
Earlier diagnosis and evidence-based management of CKD are key to slowing its progression and preventing the complications of advanced disease.9 The renin-angiotensin-aldosterone system (RAAS) blockade plays a pivotal role in delaying, and perhaps halting, kidney failure in most types of CKD.9–12 Brenner et al reported that ESRD can be delayed by 2 years in patients with CKD and diabetes mellitus (DM) when a RAAS blockade is induced with the optimal dose of losartan. When a RAAS blockade is induced with losartan, development of ESRD can be delayed by 2 years in patients with nephropathy secondary to type 2 diabetes.10 Paradoxically, CKD is the leading cause of HK and can be exacerbated by the use of guideline-recommended RAAS inhibiting agents, leading to life-threatening cardiac arrhythmias and increased mortality.9,13–17
In light of the above, a predictive model that shows an individual patient’s risk of progression to kidney failure could be useful for initiating timely therapeutic interventions that limit nephrotoxin exposure and prevent further reduction in glomerular filtration rate (GFR).2,9,11,12 Such a model could be helpful in clinical decision-making as well as public health interventions to improve both clinical and cost outcomes of CKD.9,18
Very few existing predictive models for CKD progression possess the ideal characteristics of having good internal and external validity and being clinically useful.19–24 Consequently, risk prediction models are not routinely used in CKD management. The objective of this study was to develop and validate a predictive model to identify patients in a large national health plan who had CKD stages 3 or 4 and were at high risk for progression to kidney failure within 24 months. Such a model based on demographic, comorbidity, and drug utilization information routinely collected in administrative claims data could potentially be used to create a CKD management program.
Methods
Study Design and Data Source
A non-interventional, observational study was conducted using the Aetna administrative claims database. This database contains integrated medical and pharmacy claims, as well as enrollment data, covering more than 15 million current and former Aetna members enrolled in commercial, Medicare Advantage, and prescription drug plans. For this study, both commercially insured and Medicare Advantage populations were examined. A predictive model to identify patients with CKD stages 3 or 4 who were at high risk of progressing to kidney failure within a 24-month period was developed and validated based on a retrospective study cohort of patients with CKD. For each patient, the predictive model used claims from a 12-month baseline period (BY), beginning January 1, 2015, and ending December 31, 2015. We then examined the claims attributed to kidney failure during the 24-month follow-up period (PY; January 1, 2016, through December 31, 2017) that immediately followed the BY. All data handling complied with federal and state requirements; the privacy and security of individually identifiable personal health information, required by Health Insurance Portability and Accountability Act (HIPAA) Standards, were preserved. As this non-experimental study did not require direct patient identification, a Limited Data Set, as defined by the HIPAA Privacy Rule, was used. The study protocol was approved by an independent institutional review board, Sterling IRB, before proceeding.
Study Population
Patients aged 18 years or older on January 1, 2015, with CKD stage 3–4 were identified during BY. Patients were considered to have CKD stages 3 or 4 if they met the following criteria: have either at least one estimated GFR (eGFR) value indicating CKD stage 3–4 by the Modification of Diet in Renal Disease equation (eGFR 15 mL/min/1.73 m2 to <60 mL/min/1.73 m2); or one medical claim with International Classification of Diseases, Ninth/Tenth Revision, Clinical Modification (ICD-9/10-CM) codes (585.3, 585.4, N18.3, N18.4) for CKD stage 3–4.25,27 Patients with a diagnosis of kidney failure or ESRD (ICD-9/10-CM codes: 585.5, 585.6, N18.5, N18.6) for CKD stage 5–6, who had hemodialysis or a kidney transplant procedure during the PY, or were enrolled in an end-of-life care program or hospice during either the BY or PY were excluded. Patients were required to have a minimum of 3 years (BY and PY) continuous enrollment in commercial health plans and/or Medicare Advantage with medical and pharmacy benefits. Half of the individuals in the study cohort were then randomly assigned to the model derivation group, and the other half to the model validation group.
Patient Characteristics
In patients with CKD, characteristics that may have been associated with progression to kidney failure (baseline demographics, clinical characteristics, comorbidities, and drug utilization) were evaluated during the BY. Demographic characteristics included age, sex, geographic region (Midwest, Northeast, South, West), and type of insurance (Medicare or commercial). Clinical characteristics included CKD stage (defined by latest eGFR value or ICD-9/10-CM code) during the BY, CKD stage switch (from stage 3 to stage 4), and most recent episode risk group (ERG) prospective score (using OPTUM Insight’s ERG methodology, which relies on the patient’s underlying medical conditions, the source of which are the ETGs produced by the software, ETG 10.0 version).26 Comorbidities identified by ICD-9/10-CM code included: anxiety, atrial fibrillation, cerebrovascular disease, chronic obstructive pulmonary disease (COPD), chronic thyroid disorders, congestive heart failure, depression, DM, hyperlipidemia, hypertension, ischemic heart disease, malignant neoplasms, obesity, osteoarthritis, osteoporosis, and peripheral artery disease.27 The comorbid HK was identified using previous described method.8,25 Medications taken during the BY were extracted from the National Drug Codes of dispensed medications and categorized by drug class as: angiotensin II receptor blocker (ARB), angiotensin-converting enzyme inhibitors (ACEi), beta-blocker, calcineurin inhibitor, direct renin inhibitors (DRI), mineralocorticoid receptor antagonist (MRA), nonsteroidal anti-inflammatory drug (NSAID), or potassium-sparing diuretic (see specific generic drug names and their drug class in Sharma et al).25 Among the aforementioned, RAAS inhibitors (RAASi) included ACEi, ARB, MRA, and DRI. Patients were deemed to have received optimal dosing of RAASi if they were given the maximum dose recommended by the Food and Drug Administration during the BY, whereas those patients who received any dose less than that were deemed to have received suboptimal dosing.28 Adherence to RAASi was calculated using the proportion of days covered (PDC); patients were considered adherent to RAASi if PDC was ≥0.8.
Outcomes
The primary study outcome was kidney failure during the PY, which was defined as the patient satisfying at least one of the following criteria during the PY: having ≥1 medical claim for stage 5 CKD (ICD-10-CM: N18.5) or ESRD (ICD-10-CM: N18.6); ≥1 medical claim for dialysis therapy or kidney transplantation; an eGFR <15 mL/min/1.73 m2 lab value during the PY.
Descriptive Statistical Analysis
All baseline characteristics were analyzed descriptively. Means (±standard deviation [SD]) and medians (interquartile range [IQR]) were reported for continuous variables, and frequencies (%) were reported for categorical variables. Statistical significance was assessed using either the Student’s t-test, Wilcoxon rank-sum test, Kruskal–Wallis test for continuous variables, or χ2 test for categorical variables.
Model Development
To identify strength and precision for features predictive of kidney failure, models were first developed and tested using only specific feature variables; and then combined feature variables, feature by feature. Last, we combined all five feature variables to generate the final model (Full model). To determine whether any of the predictive variables we used were indeed predictive factors, univariate analysis was performed on each of the 44 predictive variables individually (Supplement Table 1), using the derivation dataset. Variables that achieved statistical significance (p <0.05) were subjected to multivariate logistic regression analysis. A stepwise selection procedure was applied: the probability for entry of a variable was set at 0.01, and for removal of a variable at 0.1; adjusted odds ratios (ORs) were then calculated, along with the associated 95% confidence intervals (CIs). We checked interactions between predictive variables in the model by using a pooled interaction test.29 Multicollinearity was tested using Pearson’s correlation coefficient. The model’s goodness-of-fit was tested using deviance, the Hosmer-Lemeshow test, and log-likelihood.29,30
Model Validation
The models developed at each stage were validated using the validation dataset. The area under the receiver operating characteristic curve (AUROC) was calculated to determine the model’s ability to discriminate between those that progressed to kidney failure during the PY and those that did not. AUROC was computed by a non-parametric method.31 An AUROC of 1 implies perfect discrimination, whereas an AUROC of 0.5 implies that the model performs no better than chance.31,32
Calibration was assessed using a calibration plot of observed vs predicted probability of progressing to kidney failure, among patients grouped by deciles of predicted probability of progressing to kidney failure, as estimated by the model (risk strata decile 1: lowest risk, decile 10: highest risk). Risk accuracy was assessed by determining the mean absolute difference (error) between the predicted and observed (actual) probability of progressing to kidney failure across the 10 risk strata. Two metrics were used to assess performance of risk stratification performance: (1) the mean actual risk (observed probability) found to increase between strata; and (2) the risk ratio between the observed probabilities in the highest and lowest risk strata.
The gain chart measures the extent to which the predictive model exceeds expectations compared to not using a model. Data were sorted in descending order of the probability of progressing to kidney failure as estimated by the model and were binned by deciles. The cumulative rate of progression to kidney failure at each decile was evaluated beginning with the highest-risk decile and descending to the lowest-risk decile. The greater the area between the gain curve and the baseline value (without predictive model, patients randomly selected), the better the model.
All data management, statistical analyses, and predictive modeling were performed using SAS version 9.4 statistical software and SAS Enterprise Miner version 15.1 (SAS Institute, Cary, NC, US). All p values were two-sided, with p <0.05 considered as statistically significant.
Results
Baseline Characteristics
A total of 74,114 patients with CKD stage 3 or stage 4 met the inclusion and exclusion criteria. Among these, 57.2% were female, and the mean age was 74.4 years. Approximately one-third (33.7%) of the BY cohort resided in the Northeast, 41.4% resided in rural areas, and 92.9% were enrolled in a Medicare Advantage plan (Figure 1, Table 1). Table 1 compares the characteristics of study-group patients during the BY who progressed (N=2476; 3.3%) or did not progress (N=71,638; 96.7%) to kidney failure during the PY. Patients who had kidney failure during the PY tended to be younger, female, an urban resident, and had a higher prospective ERG risk score than those who did not have kidney failure. They were also more likely to have comorbid hypertension, hyperlipidemia, diabetes, congestive heart failure, ischemic heart disease, peripheral vascular disease, COPD, and more CKD stage 4 (Table 1).
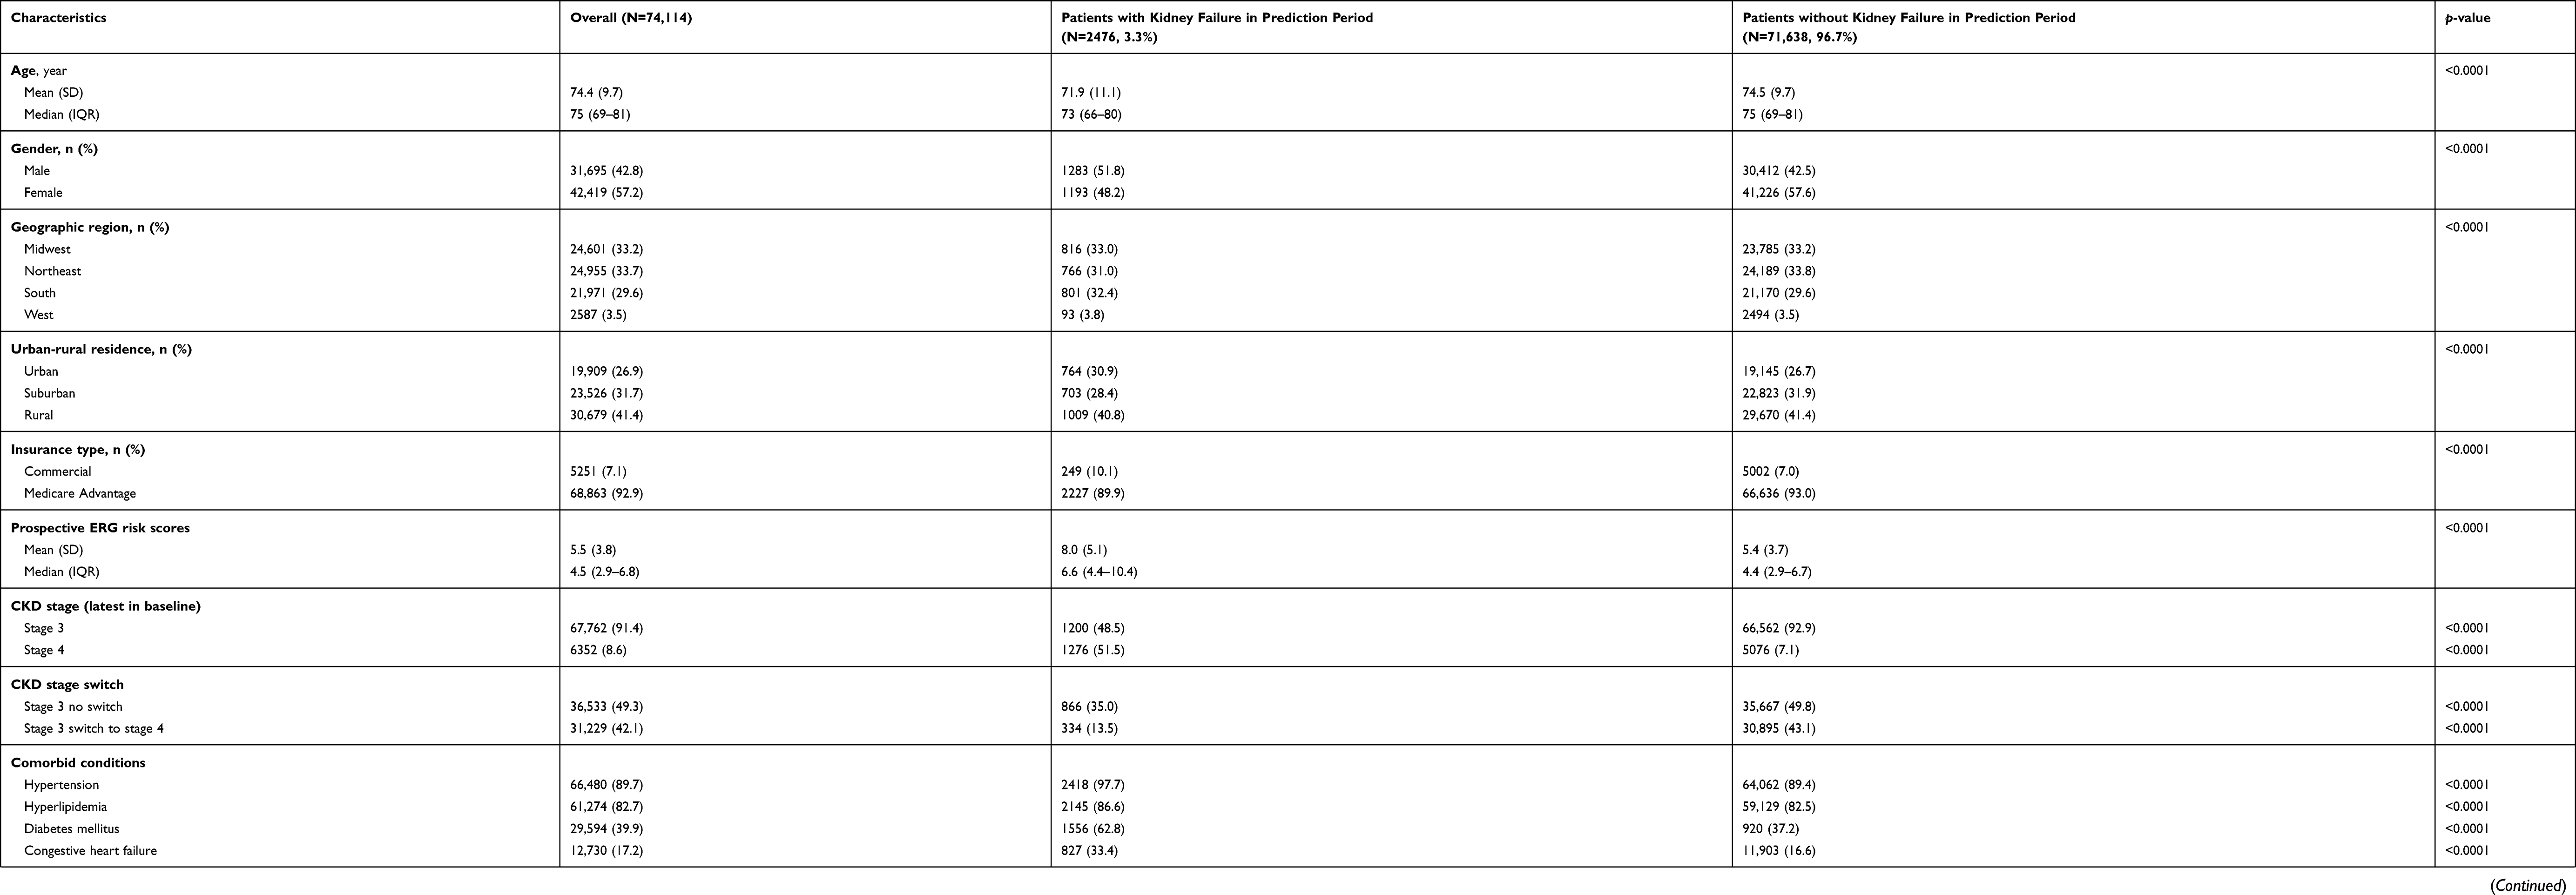 |
Table 1 Baseline Demographic Characteristics of the Study Population, Stratified by Kidney Failure Developed During 1-Year Follow-Up |
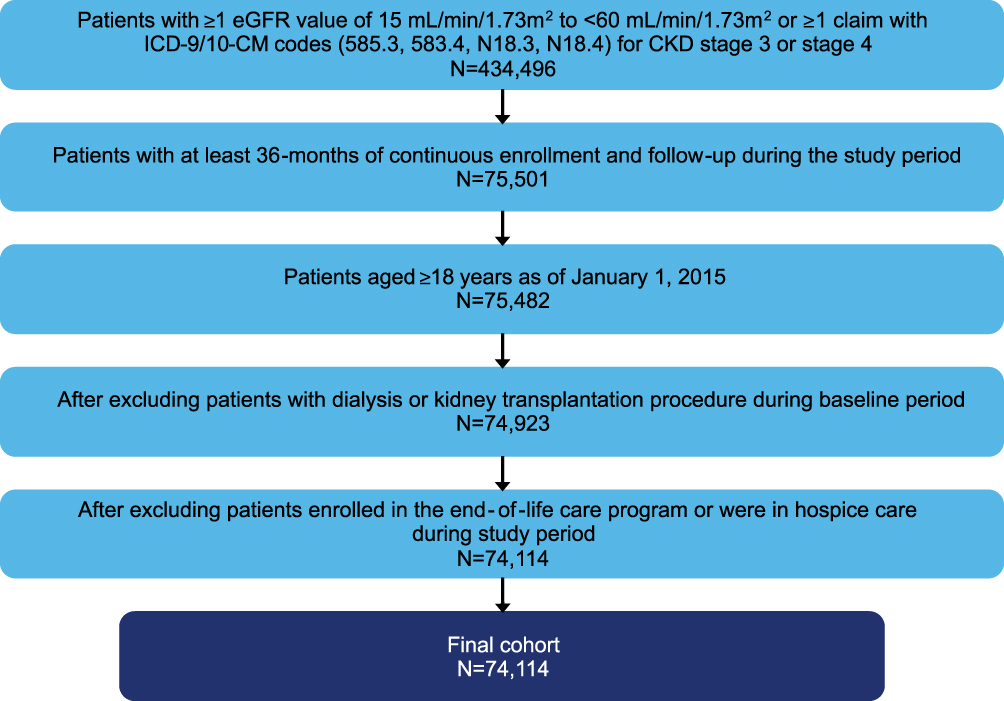 |
Figure 1 Patient attrition. Abbreviations: CKD, chronic kidney disease; eGFR, estimated glomerular filtration rate; ICD-9/10-CM, International Classification of Diseases, Ninth/Tenth Revision. |
Among the 74,114 patients identified with CKD stages 3 or 4 during the BY, 67,762 (91.4%) had CKD stage 3 and 6352 (8.6%) had CKD stage 4 (Table 1). Among patients who had CKD stage 3, 1200 (1.8%) progressed to kidney failure during the PY, an average of 403 days after entering the PY period. Among patients who had CKD stage 4, 1276 (20.1%) progressed to kidney failure, an average of 330 days after entering the PY period. Overall, a total of 3.3% (2476) of patients with CKD stages 3 or 4 after the BY progressed to kidney failure during the PY, an average of 365 days after entering the PY period (Figure 2).
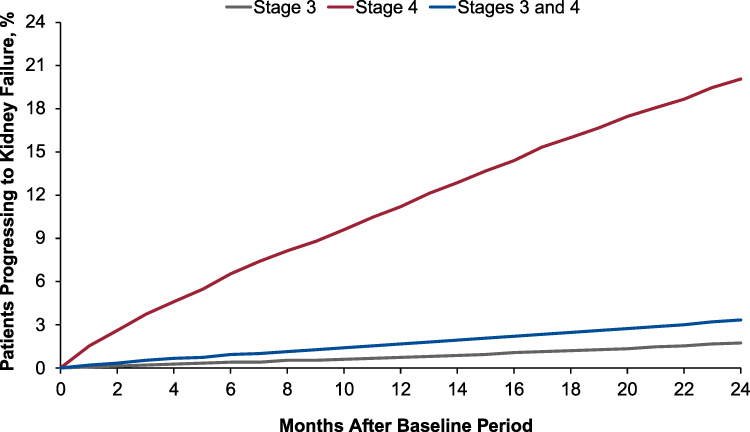 |
Figure 2 Kaplan-Meier curve for percent of patients and time to progress to kidney failure within 2 years follow-up. Among the 67,762 patients with CKD stage 3, 1.77% (1200) progressed to kidney failure, average 403 days after baseline to kidney failure. Among the 6352 patients with CKD stage 4, 20.09% (1276) progressed to kidney failure, average 330 days after baseline to kidney failure. Overall (patients with CKD stage 3 or 4), of a total of 74,114 patients, 3.34% (2476) progressed to kidney failure, average 365 days after baseline to kidney failure. The overall log-rank is p <0.0001 (CKD stage 3 vs stage 4). Abbreviation: CKD, chronic kidney disease. |
In addition, patients who developed kidney failure were more likely to use a RAASi during the BY (70.0% vs 66.2% for the non-kidney failure group, p <0.0001; Table 1). While use of submaximal RAASi dosing was widespread, overall adherence—as measured by PDC ≥80%—was lower among patients who developed kidney failure compared to those who did not (41.7% vs 44.8%, p=0.0029; Table 1).
Prediction Model
Seven predictive models were developed, all of which were compared by their AUROCs during validation (Figure 3). Among the models using only the specific-feature variables, the CKD stage-only model (M2) performed best (AUROC: 0.724), followed by the Comorbidities model (M3, AUROC: 0.701). In contrast, the models based solely on RAASi use (M4) or the Combined Age plus Gender model (M1) yielded poor AUROCs. While the AUROC of some of the combined feature models exceeded the M2 or M3, the Full model yielded the best AUROC (0.844). Thus, using all the predictive feature variables yielded a logistic regression with 12 non-zero coefficients plus an intercept (Table 2), demonstrating good discriminative performance. ORs and 95% CIs for individual parameters in the final logistic regression predictive model are provided in Table 2. After adjusting for covariates, the strongest predictors of progression to kidney failure during the PY were CKD stage 4 vs stage 3 (OR: 15.18, 95% CI: 13.77–16.73), hypertension (OR: 2.59, 95% CI: 1.97–3.42), DM (OR: 1.75, 95% CI: 1.59–1.92), HK (OR: 1.36, 95% CI: 1.21–1.53), and peripheral vascular disease (OR: 1.35, 95% CI: 1.21–1.50).
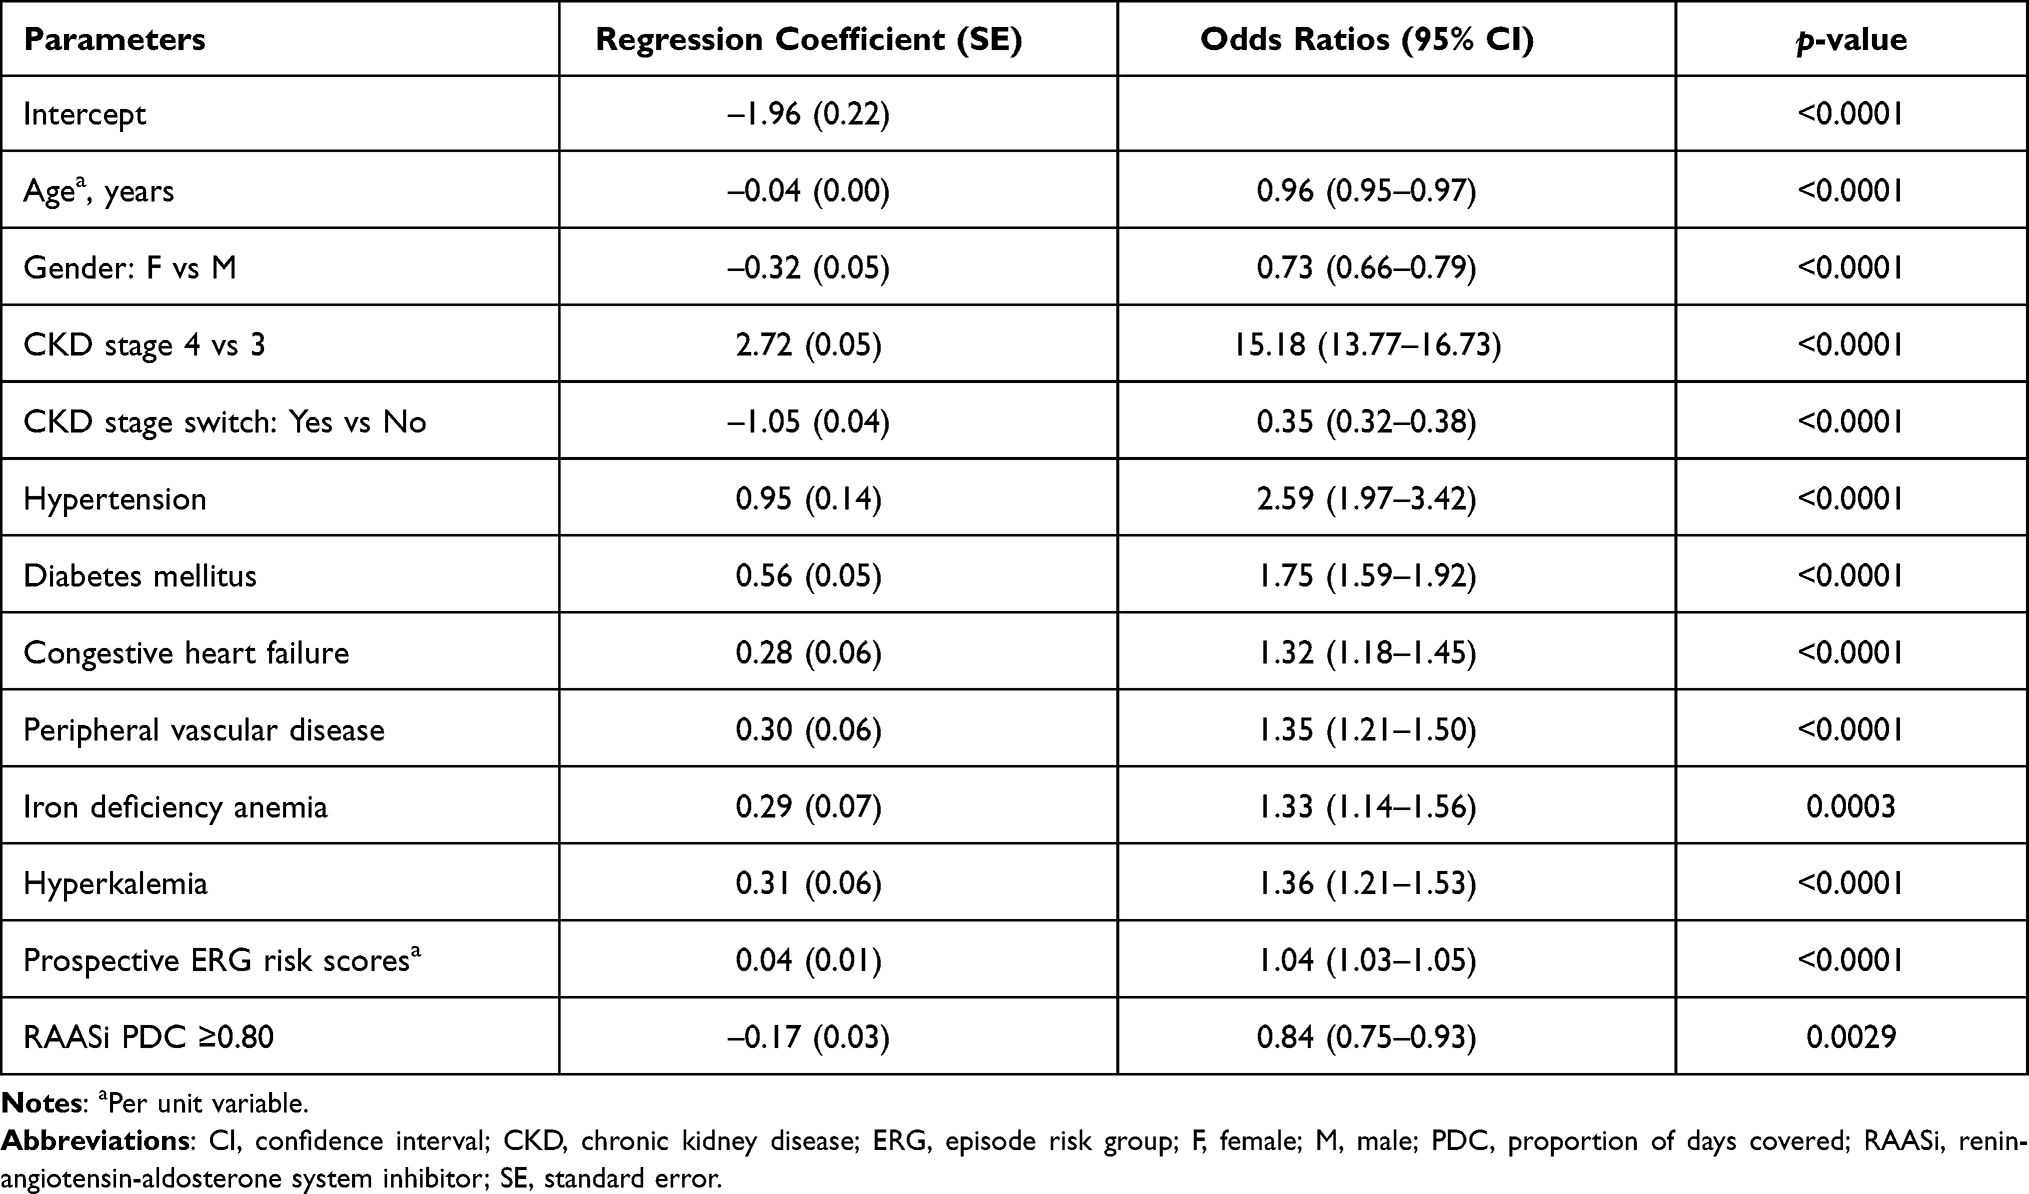 |
Table 2 List of Predictive Variables in the Final Logistic Regression Model |
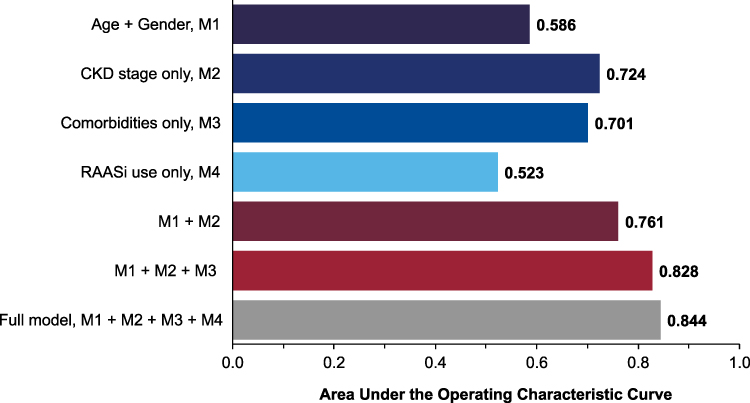 |
Figure 3 Predictive model variation: AUROC. Seven candidate models based on single or combinations of variables. Comparison of seven models by AUROC. Abbreviations: AUROC, area under the receiver operating characteristic curve; CKD, chronic kidney disease; RAASi, renin-angiotensin-aldosterone system inhibitor. |
Figure 4 shows the prediction model’s risk estimation and stratification performance. The model’s estimated average risk of kidney failure across the population closely matched the average actual risk (3.49% vs 3.26%, respectively). The mean absolute error was 2.39%. The risk increases in tandem with stratum such that those in the highest risk stratum had 68.7 times the probability of progressing to kidney failure in 2 years than those in the lowest risk stratum (18.55% vs 0.27%). The second-highest risk stratum had actual risks of 4.38%, significantly higher than the overall mean of 3.34% for the cohort. Model calibration showed that the top 2 prediction deciles (20% of the study population) identified 70.79% of patients who progressed to kidney failure during the PY.
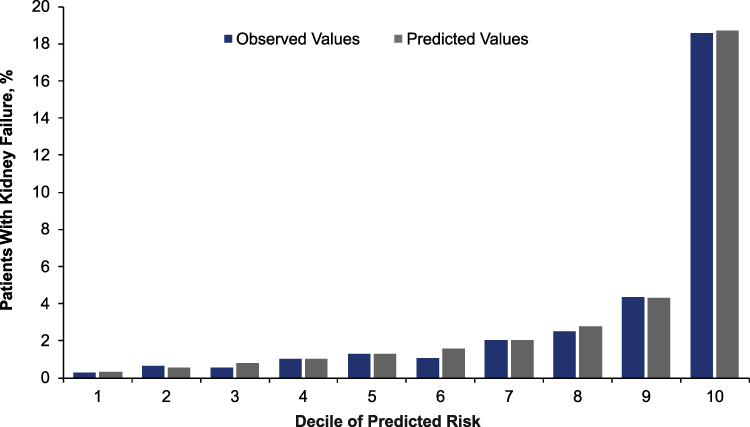 |
Figure 4 Calibration plot of observed vs predicted risk of kidney failure during follow-up period. Observed risk for kidney failure in the testing data within deciles of predictive risk strata. The predicted risk estimated by the model stratifies the population and yields estimates of the average risk of kidney failure (blue bar) within each decile (risk stratum). The estimates are compared to the actual (observed) probability of kidney failure in each decile (gray bar). |
The model somewhat over-predicted deciles 1–8 and was very close for deciles 9 and 10 in patients who progressed to kidney failure. Model gains are shown in Figure 5. For a given decile, gain is the cumulative number of patients correctly identified with kidney failure up to that point, divided by the total number of patients with kidney failure (blue line). For example, for the second-highest decile, the gain was 681/992, or 70.8%. This was much greater than the 20% of target patients who were randomly selected without use of the predictive model (red line).
 |
Figure 5 Cumulative gain chart. The predicted risk stratifies the population and evaluates cumulated rate of actual kidney failure at each decile (blue line) within each decile. Gain chart started from highest-risk decile to lowest-risk decile. The cumulated rate of kidney failure is compared to the rate without predictive model (patients randomly selected) in each decile (red line). |
Discussion
We have developed and internally validated a model to predict 2-year risk of kidney failure among patients with CKD stage 3 or stage 4. We compared five commonly used machine learning algorithms with traditional logistic regression to predict CKD progression and found that the discrimination performance of the logistic regression model was comparable to those of neural network, support vector machine, or random forest, and better than decision tree model (Supplemental Figure 1). In a recent meta-analysis of 71 studies, Christodoulou et al also showed no performance benefit of machine learning over logistic regression for clinical prediction models.35 We therefore selected the logistic regression model because of its general applicability in a clinical or care-management setting.
A recent systematic review of predictive models for CKD progression to kidney failure identified only two studies that met the criteria for clinical utility (ease of use and applicable to clinical decision-making): a risk score developed at Kaiser Permanente Northwest, and a series of predictive models based on the nephrology clinical electronic health record developed at Sunnybrook Hospital, University of Toronto.20–23 The former has been updated and includes eight predictors: age, sex, eGFR, proteinuria/albuminuria, hemoglobin, diabetes, systolic blood pressure, and antihypertensive medication;23 the latter has been extensively validated worldwide and includes eight predictors: age, sex, eGFR, albuminuria, serum calcium, serum phosphate, serum bicarbonate, and serum albumin.21 Both models included three or more laboratory result data predictors, and most of the other currently existing models used laboratory and demographic data to predict CKD progression. However, these laboratory data are not always available. Diagnosis tests/measurements (eg, blood pressure, body weight) and laboratory result data (eg, proteinuria, hemoglobin, and serum albumin) are usually not in the administrative claims databases.
Despite the potential benefits of risk stratification in the CKD population and many models published, risk prediction models are not routinely used in CKD management. Our model uses demographics, comorbidities, and drug utilization data that are obtained routinely in patients with CKD in the enrollment, medical, and pharmacy claims databases, and the variables can be automatically generated and easily integrated into a clinical decision-making system. Similar to the systematic review studies discussed,20–23,33,34 we found that younger age, male sex, advanced stage CKD, hypertension, DM, congestive heart failure, peripheral vascular disease, iron deficiency anemia, and higher prospective ERG risk score predict a higher risk of CKD progression to kidney failure. In addition, we found two new predictors; the presence of HK and poor RAASi adherence are significantly associated with progression of CKD. The RAASi are reno-protective and may slow or even halt the progression of diabetic kidney disease.11,12 Maximized RAAS inhibition, combined with intensified blood-pressure control, amelioration of dyslipidemia, and metabolic control in diabetics in a multimodal approach that includes lifestyle modifications may stabilize renal function and decrease progression among patients with CKD. Our findings contribute to the literature on whether RAASi should be initiated or even continued in patients at risk of HK and/or with worsening kidney function. Ongoing studies will evaluate whether novel potassium binders, such as patiromer or sodium zirconium cyclosilicate,36–39 may offer additional benefits to those with high risk of both CKD progression and HK.8
Despite the dissemination of clinical practice guidelines on kidney disease and DM,40,41 more than one-third of new ESRD patients receive little or no pre-ESRD nephrology care.18 To accelerate the improvement of the quality and outcomes of kidney care, the US Department of Health and Human Services recently launched the Advancing American Kidney Health initiative, targeting early CKD identification and incentivizing evidence-based management of advanced CKD and ESRD.40,41
Our model provides good discriminating performance and adequate calibration: AUROC was 0.844; the numbers of predicted vs observed individuals with kidney failure were well matched in the highest probability deciles; and a cutoff of the top 20% scores captured more than three-fourths of those who progressed to kidney failure. This model has some important implications for case management, clinical practice, comparative effectiveness safety research, and public health policy. First, it could be used in population-based CKD management with autoscoring from an administrative claims database. The risk score could be used to personalize and provide high-quality CKD care. By focusing on patients with a high risk of CKD progression, benefit plans, insurers, and healthcare providers may be able to target more effectively such interventions as patient education, pharmacist outreach, and referrals to nephrology care. Second, for clinicians, the risk scores could be used to triage patients for decisions regarding dialysis modality education, vascular access creation, and preemptive kidney transplantation. Third, the model could be used to select patients based on different risk thresholds for enrollment in traditional clinical trials, pragmatic randomized controlled trials, or cost effectiveness studies of health plan initiatives to identify and manage patients at risk for progression in accordance with evidence-based clinical guidelines.9
Limitations
Our study has a few limitations. First, this is an administrative healthcare claims data analysis. A potential advantage of using administrative claims over clinical data is that the analysis essentially covers an individual’s entire continuum of care. Still, claims data could contain coding errors of omission and incomplete claims information; therefore, we may have underestimated comorbidities and other results. Second, although the classification of CKD based on ICD-10-CM codes and eGFR values are widely used in the literature,8,21–25 we could not differentiate the decreased renal function caused by excessive use of diuretics, NSAIDs, or hospital admissions in this claim-based retrospective study, which may pose a risk of overestimating CKD and underestimating CKD progression. Third, the model has been developed based on claims data from one large US national health plan, and this model have not been validated externally; therefore, the generalizability of our findings to other population remains to be determined. Fourth, our data lack race and ethnicity parameters, and clinical parameters such as smoking status and blood pressure measurement values that could influence CKD progression. In addition, although patients with CKD are at a higher risk of mortality, we did not conduct a competing risk analysis. Consequently, our model may overestimate the risk of kidney failure, especially for the highest-risk patients.19
Conclusion
We have developed a predictive model to identify patients with CKD stage 3 or 4 at high risk for progression to kidney failure over a 24-month period using routinely collected healthcare data from administrative claims data. The model provides an acceptable level of accuracy in identifying both very high- and very low-risk CKD patients for kidney failure in a large US health plan. The model includes 12 predictors: age, gender, CKD stage, CKD stage switch, hypertension, DM, congestive heart failure, peripheral vascular disease, anemia, HK, prospective ERG risk score, and poor RAASi adherence. Although external validation is needed, the findings support the use of claims-based predictive models to better target intervention. Early identification of high-risk patients may enable timely management and lead to improved outcomes and reduce healthcare expenditures.
Acknowledgments
Editorial support services were provided by Impact Communication Partners, Inc. This work was presented at the American Society of Nephrology (ASN) Kidney Week 2019 in Washington, DC. The abstract was published in ASN Kidney Week 2019: CKD: Risk Scores and Translational Epidemiology. Abstract TH-PO382; https://www.asn-online.org/education/kidneyweek/2019/program-abstract.aspx?controlId=3230705 and the International Society for Pharmacoeconomics and Outcomes Research International Meeting, (ISPOR) 2019. Poster PUK23.
Author Contributions
All authors made substantial contributions to conception and design, acquisition of data, or analysis and interpretation of data; took part in drafting the article or revising it critically for important intellectual content; agreed to submit to the current journal; gave final approval of the version to be published; and agree to be accountable for all aspects of the work.
Funding
The analysis reported in this manuscript was funded by Vifor Pharma, Inc. Editorial support was funded by Vifor Pharma, Inc.
Disclosure
DD reports employment by CVS Health Clinical Trial Services, which conducted research funded by Vifor Pharma, Inc.; PJA and SDW report employment by and stock in Vifor Pharma, Inc. The authors report no other conflicts of interest in this work.
References
1. United States Renal Data System. USRDS 2020 annual data report. Available from: https://adr.usrds.org/2020.
2. Gaitonde DY, Cook DL, Rivera IM. Chronic kidney disease: detection and evaluation. Am Fam Physician. 2017;96(12):776–783.
3. Honeycutt AA, Segel JE, Zhuo X, Hoerger TJ, Imai K, Williams D. Medical costs of CKD in the medicare population. J Am Soc Nephrol. 2013;24(9):1478–1483. doi:10.1681/ASN.2012040392
4. Golestaneh L, Alvarez PJ, Reaven NL, et al. All-cause costs increase exponentially with increased chronic kidney disease stage. Am J Manag Care. 2017;23(10 Suppl):S163–S172.
5. Go AS, Chertow GM, Fan D, McCulloch CE, Hsu CY. Chronic kidney disease and the risks of death, cardiovascular events, and hospitalization. N Engl J Med. 2004;351(13):1296–1305. doi:10.1056/NEJMoa041031
6. Yang C, Wang H, Zhao X, et al. CKD in China: evolving spectrum and public health implications. Am J Kidney Dis. 2020;76(2):258–264. doi:10.1053/j.ajkd.2019.05.032
7. Lv JC, Zhang LX. Prevalence and disease burden of chronic kidney disease. Adv Exp Med Biol. 2019;1165:3–15.
8. Sharma A, Alvarez PJ, Woods SD, Fogli J, Dai D. Healthcare resource utilization and costs associated with hyperkalemia in a large managed care population. J Pharm Health Serv Res. 2021;12(1):35–41. doi:10.1093/jphsr/rmaa004
9. Kidney Disease: Improving Global Outcomes (KDIGO) CKD Work Group. KDIGO 2012 clinical practice guideline for the evaluation and management of chronic kidney disease. Kidney Int Suppl. 2013;3(1):1–150.
10. Brenner BM, Cooper ME, de Zeeuw D, et al. Effects of losartan on renal and cardiovascular outcomes in patients with type 2 diabetes and nephropathy. N Engl J Med. 2001;345(12):861–869. doi:10.1056/NEJMoa011161
11. Leon SJ, Tangri N. The use of renin-angiotensin system inhibitors in patients with chronic kidney disease. Can J Cardiol. 2019;35(9):1220–1227. doi:10.1016/j.cjca.2019.06.029
12. Giatras I, Lau J, Levey AS. Effect of angiotensin converting enzyme inhibitors on the progression of nondiabetic renal disease: a meta-analysis of randomized trials. Ann Intern Med. 1997;127(5):337–345. doi:10.7326/0003-4819-127-5-199709010-00001
13. Einhorn LM, Zhan M, Hsu VD, et al. The frequency of hyperkalemia and its significance in chronic kidney disease. Arch Intern Med. 2009;169(12):1156–1162. doi:10.1001/archinternmed.2009.132
14. Kovesdy CP, Matsushita K, Sang Y, et al. Serum potassium and adverse outcomes across the range of kidney function: a CKD prognosis consortium meta-analysis. Eur Heart J. 2018;39(17):1535–1542. doi:10.1093/eurheartj/ehy100
15. Epstein M. Hyperkalemia constitutes a constraint for implementing renin-angiotensin-aldosterone inhibition: the widening gap between mandated treatment guidelines and the real-world clinical arena. Kidney Int Suppl. 2016;6(1):20–28. doi:10.1016/j.kisu.2016.01.004
16. Epstein M, Alvarez PJ, Reaven NL, et al. Evaluation of clinical outcomes and costs based on prescribed dose level of renin-angiotensin-aldosterone system inhibitors. Am J Manag Care. 2016;22(11 Suppl):S311–S324.
17. Bianchi S, Regolisti G. Pivotal clinical trials, meta-analyses and current guidelines in the treatment of hyperkalemia. Nephrol Dial Transplant. 2019;34(Supplement_3):iii51–iii61. doi:10.1093/ndt/gfz213
18. Pereira BJ. Optimization of pre-ESRD care: the key to improved dialysis outcomes. Kidney Int. 2000;57(1):351–365. doi:10.1046/j.1523-1755.2000.00840.x
19. Norouzi J, Yadollahpour A, Mirbagheri SA, Mazdeh MM, Hosseini SA. Predicting renal failure progression in chronic kidney disease using integrated intelligent fuzzy expert system. Comput Math Methods Med. 2016;2016:6080814. doi:10.1155/2016/6080814
20. Johnson ES, Thorp ML, Platt RW, Smith DH. Predicting the risk of dialysis and transplant among patients with CKD: a retrospective cohort study. Am J Kidney Dis. 2008;52(4):653–660. doi:10.1053/j.ajkd.2008.04.026
21. Tangri N, Stevens LA, Griffith J, et al. A predictive model for progression of chronic kidney disease to kidney failure. JAMA. 2011;305(15):1553–1559. doi:10.1001/jama.2011.451
22. Tangri N, Inker LA, Hiebert B, et al. A dynamic predictive model for progression of CKD. Am J Kidney Dis. 2017;69(4):514–520. doi:10.1053/j.ajkd.2016.07.030
23. Schroeder EB, Yang X, Thorp ML, et al. Predicting 5-year risk of RRT in stage 3 or 4 CKD: development and external validation. Clin J Am Soc Nephrol. 2017;12(1):87–94. doi:10.2215/CJN.01290216
24. Kadatz MJ, Lee ES, Levin A. Predicting progression in CKD: perspectives and precautions. Am J Kidney Dis. 2016;67(5):779–786. doi:10.1053/j.ajkd.2015.11.007
25. Sharma A, Alvarez PJ, Woods SD, Dai D. A model to predict risk of hyperkalemia in patients with chronic kidney disease using a large administrative claims database. Clinicoecon Outcomes Res. 2020;12:657–667. doi:10.2147/CEOR.S267063
26. OPTUM Insight. Symmetry episode treatment groups: measuring health care with meaningful episodes of care (White paper). Available from: https://www.optum.com/content/dam/optum3/optum/en/resources/white-papers/Symmetry_ERG_White_Paper_July181.pdf.
27. Quan H, Sundararajan V, Halfon P, et al. Coding algorithms for defining comorbidities in ICD-9-CM and ICD-10 administrative data. Med Care. 2005;43(11):1130–1139. doi:10.1097/01.mlr.0000182534.19832.83
28. Epstein M, Reaven NL, Funk SE, McGaughey KJ, Oestreicher N, Knispel J. Evaluation of the treatment gap between clinical guidelines and the utilization of renin-angiotensin-aldosterone system inhibitors. Am J Manag Care. 2015;21(11 suppl):S212–S220.
29. Harrell FE, Lee KL, Mark DB. Multivariable prognostic models: issues in developing models, evaluating assumptions and adequacy, and measuring and reducing errors. Stat Med. 1996;15(4):361–387. doi:10.1002/(SICI)1097-0258(19960229)15:4<361::AID-SIM168>3.0.CO;2-4
30. Hosmer DW, Lemeshow S. Applied Logistic Regression.
31. Hanley JA, McNeil BJ. The meaning and use of the area under a receiver operating characteristic (ROC) curve. Radiology. 1982;143(1):29–36. doi:10.1148/radiology.143.1.7063747
32. DeLong ER, DeLong DM, Clark-Pearson DL. Comparing the area under two or more correlated receiving operating characteristic curves: a nonparametric approach. Biometrics. 1988;44(3):837–845. doi:10.2307/2531595
33. Everett B, Castel LD, McGinnis M, et al. Economic and clinical outcomes resulting from stage 4 chronic kidney disease case management quality improvement initiative. Prof Case Manag. 2017;22(6):291–298. doi:10.1097/NCM.0000000000000253
34. Provenzano M, Rotundo S, Chiodini P, et al. Contribution of predictive and prognostic biomarkers to clinical research on chronic kidney disease. Int J Mol Sci. 2020;21(16):5846. doi:10.3390/ijms21165846
35. Christodoulou E, Ma J, Collins GS, Steyerberg EW, Verbakel JY, Van Calster B. A systematic review shows no performance benefit of machine learning over logistic regression for clinical prediction models. J Clin Epidemiol. 2019;110:12–22. doi:10.1016/j.jclinepi.2019.02.004
36. Weir MR, Bakris GL, Bushinsky DA, et al. Patiromer in patients with kidney disease and hyperkalemia receiving RAAS inhibitors. N Engl J Med. 2015;372(3):211–221. doi:10.1056/NEJMoa1410853
37. Bakris GL, Pitt B, Weir MR, et al. Effect of patiromer on serum potassium level in patients with hyperkalemia and diabetic kidney disease: the AMETHYST-DN randomized clinical trial. JAMA. 2015;314(2):151–161. doi:10.1001/jama.2015.7446
38. Weir MR, Bushinsky DA, Benton WW, et al. Effect of patiromer on hyperkalemia recurrence in older chronic kidney disease patients taking RAAS inhibitors. Am J Med. 2018;131(5):555–564.e3. doi:10.1016/j.amjmed.2017.11.011
39. Spinowitz BS, Fishbane S, Pergola PE, et al. Sodium zirconium cyclosilicate among individuals with hyperkalemia: a 12-month Phase 3 study. Clin J Am Soc Nephrol. 2019;14(6):798–809. doi:10.2215/CJN.12651018
40. Kidney Disease Outcomes Quality Initiative (K/DOQI). K/DOQI clinical practice guidelines on hypertension and antihypertensive agents in chronic kidney disease. Am J Kidney Dis. 2004;43(5 suppl 1):S1–S290.
41. Kidney Disease: Improving Global Outcomes (KDIGO) Blood Pressure Work Group. KDIGO clinical practice guideline for the management of blood pressure in chronic kidney disease. Kidney Int Suppl. 2012;2(5):337–414.
 © 2021 The Author(s). This work is published and licensed by Dove Medical Press Limited. The
full terms of this license are available at https://www.dovepress.com/terms
and incorporate the Creative Commons Attribution
- Non Commercial (unported, 3.0) License.
By accessing the work you hereby accept the Terms. Non-commercial uses of the work are permitted
without any further permission from Dove Medical Press Limited, provided the work is properly
attributed. For permission for commercial use of this work, please see paragraphs 4.2 and 5 of our Terms.
© 2021 The Author(s). This work is published and licensed by Dove Medical Press Limited. The
full terms of this license are available at https://www.dovepress.com/terms
and incorporate the Creative Commons Attribution
- Non Commercial (unported, 3.0) License.
By accessing the work you hereby accept the Terms. Non-commercial uses of the work are permitted
without any further permission from Dove Medical Press Limited, provided the work is properly
attributed. For permission for commercial use of this work, please see paragraphs 4.2 and 5 of our Terms.