")
Back to Journals » International Journal of General Medicine » Volume 15
A Prediction Model for Chemotherapy-Induced Thrombocytopenia Based on Real-World Data and a Close Relationship Between AST/ALT Ratio and Platelet Count in Patients with Solid Tumors
Authors Song B, Zhou S, Li C, Zheng H, Zhang X, Jin X, Fu J , Hu H
Received 2 August 2022
Accepted for publication 10 October 2022
Published 1 November 2022 Volume 2022:15 Pages 8003—8015
DOI https://doi.org/10.2147/IJGM.S383349
Checked for plagiarism Yes
Review by Single anonymous peer review
Peer reviewer comments 2
Editor who approved publication: Dr Scott Fraser
Bingxin Song,1 Shishi Zhou,2 Chenghui Li,2 Hongjuan Zheng,2 Xia Zhang,2 Xiayun Jin,2 Jianfei Fu,2 Huixian Hu1
1Department of Medical Hematology, Affiliated Jinhua Hospital, Zhejiang University School of Medicine, Jinhua, Zhejiang Province, People’s Republic of China; 2Department of Medical Oncology, Affiliated Jinhua Hospital, Zhejiang University School of Medicine, Jinhua, Zhejiang Province, People’s Republic of China
Correspondence: Jianfei Fu, Department of Medical Oncology, Zhejiang University Jinhua Hospital, 351 Mingyue Road, Jinhua, 321000, Zhejiang Province, People’s Republic of China, Fax +86-579-82552856, Email [email protected] Huixian Hu, Department of Medical Hematology, Zhejiang University Jinhua Hospital, 351 Mingyue Road, Jinhua, Zhejiang Province, 321000, People’s Republic of China, Fax +86-579-82136611, Email [email protected]
Objective: Chemotherapy-induced thrombocytopenia (CIT) can lead to chemotherapy dose delay or reduction, and even serious bleeding. This study aimed to develop a CIT-predicting model based on the laboratory indices of cancer patients undergoing chemotherapy.
Material and Methods: From Jun 1, 2017 to Dec 30, 2021, a total of 2043 patients who had received 7676 cycles of chemotherapy were retrospectively enrolled. A logistic regression analysis was performed to identify predictive factors, on the basis of which a nomogram model for predicting CIT was established. A bootstrapping technique was applied for internal validation. A generalized additive mixed model (GAMM) was constructed to analyze the trends in the changes of aspartate aminotransferase (AST), ratio of AST to alanine transaminase (ALT) (AST/ALT ratio), and platelet (PLT) count in patients with solid tumors. P values ≤ 0.05 were considered statistically significant.
Results: The patient-based incidence of CIT was 20.51% and the cycle-based incidence was 10.01%. The multivariate analysis showed that AST level, AST/ALT ratio, and total bilirubin (Tbil), white blood cell (WBC), platelet (PLT), hemoglobin (Hb) levels were significantly associated with the risk of CIT. The GAMM analysis showed that PLT level was inversely associated with AST/ALT ratio and AST level, more significantly with AST/ALT ratio. And both exhibited statistically predictive abilities for CIT. The model achieved an area under the receiver operating characteristic curve (AUC) of 0.793, a sensitivity of 0.543 and a specificity of 0.930.
Conclusion: The AST/ALT ratio was inversely associated with the CIT risk in cancer patients. The GAMM model based on laboratory indices presented a high accuracy in predicting the risk of CIT, and a potential to be translated into clinical management.
Keywords: chemotherapy-induced thrombocytopenia, solid tumors, AST/ALT-ratio, prediction model
Corrigendum for this paper has been published.
Introduction
Chemotherapy-induced thrombocytopenia (CIT), a most common complication in cancer patients receiving myelosuppressive chemotherapy, emerges as the peripheral platelet count falls below 100×109/L, with or without bleeding.1 In the Common Terminology Criteria for Adverse Events version 4.03 (CTCAE 4.03) established by the National Institute of Health (NIH), thrombocytopenia refers to a decrease in the number of platelets (PLT) in the blood specimen, involving four grades: grade 1, PLT count < low limit of normal (LLN) of 75,000/mm3 or 75.0×10⁹/L; grade 2, PLT count <75,000–50,000/mm3 or <75.0–50.0×10⁹/L; grade 3, PLT count <50,000–25,000/mm3 or <50.0–25.0×10⁹/L; grade 4, PLT count <25,000/mm3 or <25.0×10⁹/L. Prior studies estimated that more than 30% of patients with solid tumors experienced thrombocytopenia,2 while the incidence of CIT in hematological tumors reached 75%.3 CIT may lead to chemotherapy dose delay or reduction, and even serious bleeding, which increases the expenditure and worsens the prognosis.4
Serum transaminases aspartate transaminase (AST) and alanine transaminase (ALT) are routinely measured to evaluate liver function. ALT is involved in the glucose-alanine cycle, interchange between alanine and pyruvate, and regeneration of glucose consumed by muscle. AST acts in aerobic glycolysis through relocating nicotinamide adenine dinucleotide (NADH) within the mitochondria. These transaminase reactions are essential to the metabolism in muscle and liver cells.5 AST/ALT ratio, also termed as De Ritis ratio, has also been proven as an efficient index to diagnose many non-hepatic diseases.6 Moreover, it is also an independent prognostic factor for several cancer entities.7–11 Besides, a recent study has suggested that AST/ALT ratio is inversely associated with palette (PLT) count in severe fever with thrombocytopenia syndrome (SFTS).12 However, the efficiency of AST/ALT ratio in predicting CIT is unclear.
Cytotoxic chemotherapy can decrease PLT count through several pathophysiological mechanisms. Cytotoxic drugs repress the production of megakaryocytes and PLTs.13 In addition, chemotherapeutic drugs can enhance PLT clearance through various immune mechanisms. For example, idiopathic thrombocytopenic purpura (ITP) has been reported in patients receiving fludarabine monotherapy.14 Currently, treatment options of CIT and related therapeutic benefits are limited. An efficient model based on various variables is needed to predict high-risk CIT groups. Some studies have clarified the relationship between CIT and demographic characteristics, such as the body mass index.15–17 However, these variables were relatively simple subjective and some show region-related differences.
Therefore, based on objective laboratory indexes, we constructed a model and evaluated its accuracy to predict CIT in a cohort of cancer patients receiving chemotherapy.
Materials and Methods
Patients and Data Collection
This was a retrospective study that included 2043 patients receiving chemotherapy for solid tumor in the Oncology Department of Jinhua Municipal Central Hospital from June 2017 to December 2021. In this study, the primary endpoint was chemotherapy-induced thrombocytopenia predicted by the model. Basic information of the cancer patients, including epidemiological, demographic, clinical, and laboratory data, were obtained from the electronic medical records of the hospital (the Guide Patients Support Care [GPS] information system).
The inclusion criteria were as follows: (1) solid malignant tumors were confirmed by pathological findings; (2) the patient was followed up during all chemotherapy cycles; (3) the patient had blood routinely tested within 1–2 months after the occurrence of CIT; (4) the patient had no other liver diseases, except for malignancies.
The exclusion criterions were as follows: (1) a history of hematologic malignancy confirmed by fluorescence in situ hybridization (FISH) from a bone marrow aspirate and biopsy or peripheral blood review test performed in the prior three months; (2) a history of symptomatic venous thromboembolic events (VTEs) or arterial events; (3) abnormal liver and kidney function confirmed by laboratory indicators within the past three months.
The PLT count test was performed at the beginning of every chemotherapy cycle. A single episode of thrombocytopenia was considered as CIT. The diagnosis of thrombocytopenia was based on the PLT count during chemotherapy. The diagnosis of CIT was made based on the lowest platelet value.
This study complied with the ethical standards of the Institutional Research Council and the Declaration of Helsinki.
Variables Definitions
According to the CTCAE 4.03, thrombocytopenia was divided into four grades: Grade 1, 75×109-99×109/L; Grade 2, 50×109-74×109/L; Grade 3, 25×109-49×109/L; Grade 4, <25×109/L. Anemia was defined as hemoglobin (Hb) concentration <110 g/L. Decreased white blood cell (WBC) count was defined as a WBC count <4000/mL, increased C-reactive protein (CRP) as a CRP level >8 mg/dL, decreased total bilirubin (Tbil) as a Tbil level <25 µmol/L. Hypoalbuminemia was considered as an albumin (Alb) level <30g/L. Increased ALT was defined as an ALT level >50 U/L and increased AST was defined as an AST level >35 U/L. AST/ALT ratio >1 was regarded as abnormal.
Tumors in less than 30 patients were classified as “other tumors”, and those with two or more primary sites were defined as multiple primary cancers (MPC).
Statistical Analysis
Continuous variables were expressed as the mean ± standard deviation (SD) if in normal distribution, or median (interquartile range) if in skewed distribution; categorical variables were described as frequency or percentage. In addition, the Chi-square test (categorical variables) and two-tailed test (continuous variables) were employed to determine differences in means and proportions between groups. Univariate and multivariate logistic regression analyses were applied to identify factors associated with CIT.
A generalized additive mixed model (GAMM) was constructed to explore the relationship between AST, AST/ALT-ratio and PLT. The accuracies of the two variables were compared according to their receiver operating curves (ROCs).
Variables with a p-value less than 0.05 in the multivariate logistic regression analysis were selected. Using them, a nomogram was established to display the predictive accuracy of the final model. The discrimination and calibration of the model were calculated using the area under the ROC curve. A bootstrapping technique was applied using 1000 random data sets (validation set) generated from the original data. All statistical analyses were performed by R software (version 4.1.2) with the “survival”, “survminer”, “rms”, “pROC” and “rmda” packages. P values ≤0.05 were considered statistically significant.
Results
Demographics and Clinical Characteristics of Patients
A total of 2043 patients (1224 [59.91%] males and 819 [40.09%]) females with solid tumors who received chemotherapy during the study period were included. The patients’ detailed demographic and clinical characteristics are summarized in Table 1. Thrombocytopenia occurred in 419 patients, with a frequency of 20.51%. The 5 most common types were (in a downtrend of frequency) cervical (10/27, 37.04%), biliary (13/37, 35.14%), gastric (45/136, 33.09%), ovarian (12/41, 29.27%) and bladder (9/32, 28.12%) cancers.
 |
Table 1 Demographics and Clinical Characteristics of Cancer Patients |
The patients’ laboratory results were analyzed. In all patients with CIT, the WBC count decreased in 161 (38.42%) patients. The Hb level dropped below the normal range in 285 (68.02%) patients. The AST level rose above the normal range in 142 (33.89%) patients, and the ALT level in 45 (10.84%) patients. The Tbil level exceeded the upper limit in 57 (13.60%) patients, while the Alb level decreased in 39 (9.31%) patients.
Univariate and Multivariate Analyses Based on Chemotherapy Cycles
A total of 7676 cycles were administered. CIT occurred in 768 (10.01%) cycles (Table 2). The univariate logistic analysis showed that tumor site (P<0.001), AST/ALT ratio (P<0.001), AST (P<0.001), Tbil (P<0.001), Alb (P=0.002), PLT (P<0.001), Hb (P<0.001), WBC (P<0.001), CRP (P=0.020) were associated with CIT of patients with solid tumors (Table 3). In the multivariate logistic analysis, we found that AST/ALT-ratio (P<0.001), AST (P<0.001), Tbil (P=0.04), PLT (P<0.001), WBC (P=0.001) and Hb (P<0.001) were independent predictive factors for CIT.
 |
Table 2 Clinical Characteristics Based on Chemotherapy Cycles |
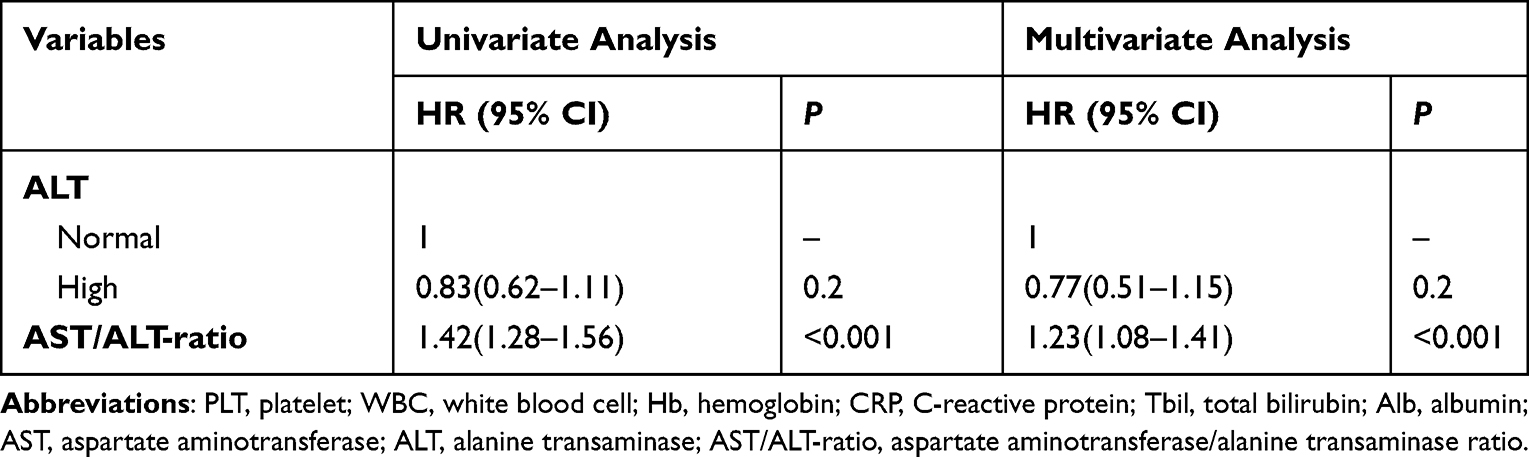 |
Table 3 Univariate and Multivariate Analysis |
Predictive Values of AST/ALT Ratio and AST for CIT
Given that the levels of myeloid, erythroid, and megakaryocytic cells can reflect the hematopoietic function of bone marrow, it has been expected that WBC and Hb are associated with PLT. We further explored whether AST influences the count of PLT. An abnormal AST/ALT ratio was detected after a median of 4 cycles of chemotherapy. The GAMM model showed that both AST/ALT ratio and AST were inversely associated with PLT count (Figures 1 and 2), and the relationship between AST/ALT ratio and PLT showed a stronger linear negative correlation. As shown by the ROC curves, the AUC of AST/ALT ratio was 0.604, while the AUC of AST was 0.569 (Figure 3). Obviously, AST/ALT ratio was more accurate than AST in predicting CIT (P=0.045).
 |
Figure 1 Shift trend of AST and PLT of cancer patients analyzed by GAMM. |
 |
Figure 2 Shift trend of AST/ALT-ratio and PLT of cancer patients analyzed by GAMM. |
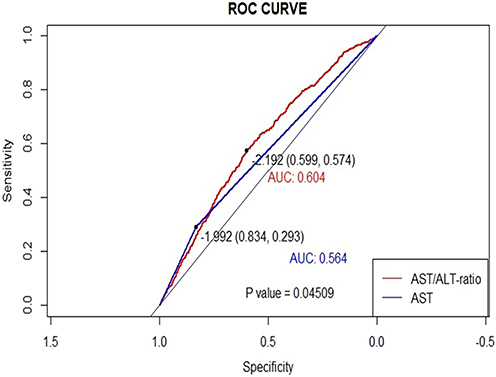 |
Figure 3 The compared ROC between AST/ALT-ratio and AST. |
Predictive Value of Nomogram for CIT
In the multivariate logistic regression model, AST/ALT ratio, AST, PLT, WBC and Hb were statistically significant predictors for CIT. Therefore, a nomogram containing AST/ALT-ratio, Tbil, Alb, PLT, WBC and Hb was established to predict CIT of chemotherapy-treated patients (Figure 4). The AUC value of the model was 0.793 (sensitivity 0.543, specificity 0.930), which indicated that the prediction model has a high accuracy (Figure 5). In addition, the calibration plots revealed a good match between the CIT frequencies predicted by the nomogram model and observed in the real setting (Figure 6).
 |
Figure 4 The nomogram model for CIT probability prediction based on laboratory indicators. Abbreviations: Tbil, total bilirubin; Alb, albumin; PLT, platelet; WBC, white blood cell; Hb, hemoglobin; AST/ALT-ratio, aspartate aminotransferase/alanine transaminase ratio; Risk; Risk probability of developing thrombocytopenia. |
 |
Figure 5 The area under the ROC curve (AUC). AUC:0.793, Sensitivity: 0.543, Specificity: 0.930. |
 |
Figure 6 The calibration curve for predicting CIT in the validation set: the ideal prediction curve has a good fit with the actual observations. |
Discussion
In this study, we found that baseline laboratory parameters, including PLT, WBC, Hb, AST, Tbil and AST/ALT-ratio, were significantly associated with CIT risk. There was an inversely relationship between AST/ALT ratio and PLT count, as well as between AST and PLT count. Besides, a nomogram incorporating the six significant parameters demonstrated a strong predictive ability.
In our cohort, the incidence of CIT during the chemotherapy course was 20.51%, higher than those in previous studies.18,19 The incidences in different cancer types were slightly different from other investigations.20–24
To the best of our knowledge, our study was the first to evaluate the potential predictive value of AST/ALT ratio and AST for CIT. Furthermore, we found AST/ALT-ratio and AST were both inversely associated with PLT. In a prognostic study of severe fever with SFTS, an evident inverse correlation was found between AST/ALT ratio and PLT count.12 In other studies of SFTS, some inflammatory factors were up-regulated in infected HepG2 cells. Proinflammatory cytokines, including IL-6 and tumor necrosis factor-alpha (TNF-α), increase dramatically with disease severity.25 Patients who received allogeneic hematopoietic stem cell transplantation exhibited high levels of TNF-α, interferon-gamma (IFN-γ), and IL-2, as well as ALT and AST.26 These indicate that the immune system is disrupted in liver injury. Previous studies have highlighted that PLTs are essential to cellular inflammation and can be used to score hepatic fibrosis. Xu et al have found that a low PLT count is associated with cirrhosis and progression to hepatic decompensation among patients with chronic hepatitis C.27 In patients receiving chemotherapy, the AST/ALT ratio increases and the PLT count decreases, indicating the damage to hepatic function. Chemotherapy-induced liver injury (CALI) is also a common adverse event in cancer patients. The evolution of CALI is usually accompanied by elevations of ALT, AST, and Tbil. Idiosyncratic CALI has been explained as a result from adaptive immune attack in previous reports, with immune cell-mediated liver injury playing a critical role.28
Some molecules trigger the adaptive immune attack on the liver by up-regulating costimulatory factors on professional antigen-presenting cells and promoting the release of cytokines and chemokines. In addition, some cytokines, such as TNF-α and IFN-γ, can make hepatocytes more susceptible to drug-induced stress by shifting cellular responses away from cell survival towards cell death.29 Considering that CIT involves specific immune responses induced by chemotherapeutic drugs, we propose that the link between elevated AST and CIT may be mediated by immune-related mechanisms. Currently, the immune-related mechanisms underlying CIT have not been fully clarified. No immunosuppressive agents have been used in the routine treatment of CIT. However, in some cases whose thrombocytopenia is known to be caused by immune mechanisms, such as ITP caused by fluadabine, corticosteroids or gamma globulin can be used to treat thrombocytopenia, and the therapeutic effect is significant.30
Interestingly, serum AST/ALT ratio has been found related to a high mortality rate in previous cancer models. In patients with oral and oropharyngeal cancer, AST/ALT ratio >1.44 is an independent prognostic factor for poor cancer-specific survival and overall survival (OS).31 Furthermore, AST/ALT ratio has been validated as a prognostic marker for disease-free survival (DFS) in stage II–III non-cancer patients.32 Besides, it can also predict the prognosis of gastric, prostate and advanced-stage pancreatic cancer.33–35 In the current study, we addressed that the AST/ALT ratio tightly correlates with CIT risk. However, the mechanism contributing to the increase in AST/ALT ratio and the decrease in PLT after chemotherapy is still unclear, and should be uncovered by future studies.
Severe thrombocytopenia may lead to bleeding, which require platelet transfusion. Few models have been developed to predict CIT risk based on clinical and laboratory variables.36 These predictive models only incorporate specific predictors and their application is limited to a certain cancer type. In the present study, our model was based on the data from a whole spectrum of cancers, thus largely expanding its clinical applicability. Compared with previous models, our model absorbed real-time laboratory indicators measured in those who had passed the myelosuppression phase but not received the next cycle of chemotherapy. These indicators, easily measurable, can efficiently help to distinguish the patients at a high risk of CIT.
However, several limitations should be mentioned. First, our study lacked external data validation. Second, our study was a retrospective and single-center study, and therefore, the potential biases could not be avoided. Such drawbacks will be addressed in our future studies.
In conclusion, our model was accurate in predicting CIT risk, and AST/ALT ratio was closely associated with PLT count in patients with solid tumors. Our model may provide a possibility to design individualized treatment for cancer patients.
Studies Involving Animal Subjects
Generated Statement: No animal studies are presented in this manuscript.
Studies Involving Human Subjects
Generated Statement: The studies involving human participants were reviewed and approved by Medical Ethics Committee of Jinhua Central Hospital. The patients/participants provided their written informed consent to participate in this study.
Inclusion of Identifiable Human Data
Generated Statement: No potentially identifiable human images or data are presented in this study.
Author Contributions
All authors made a significant contribution to the work reported, whether that is in the conception, study design, execution, acquisition of data, analysis and interpretation, or in all these areas; took part in drafting, revising or critically reviewing the article; gave final approval of the version to be published; have agreed on the journal to which the article has been submitted; and agree to be accountable for all aspects of the work.
Disclosure
Jianfei Fu and Huixian Hu are co-corresponding authors for this study. Jianfei Fu has received research support from Company Jiangsu Hengrui Medicine Co., Ltd. The authors have no other relevant financial or non-financial interests to disclose for this work.
References
1. Chinese Society of Clinical Oncology. 肿瘤化疗所致血小板减少症诊疗中国专家共识 (2014版) [Expert consensus on diagnosis and treatment of chemotherapy-induced thrombocytopenia in cancer patients (2014 version]. Zhonghua Zhong Liu Za Zhi. 2014;36:876–879. Chinese
2. Epstein RS, Aapro MS, Basu RUK, et al. Patient burden and real-world management of chemotherapy-induced myelosuppression: results from an online survey of patients with solid tumors. Adv Ther. 2020;37:3606–3618. doi:10.1007/s12325-020-01419-6
3. Kantarjian H, Giles F, List A, et al. The incidence and impact of thrombocytopenia in myelodysplastic syndromes. Cancer. 2007;109:1705–1714. doi:10.1002/cncr.22602
4. Hassan BA, Yusoff ZB, Hassali MA, Bin Othman S. Treatment patterns and outcomes in management of solid cancer patients suffering from thrombocytopenia in Penang hospital. Asian Pac J Cancer Prev. 2011;12:2841–2845.
5. Botros M, Sikaris KA. The de ritis ratio: the test of time. Clin Biochem Rev. 2013;34:117–130.
6. De Ritis F, Coltorti M, Giusti G. An enzymic test for the diagnosis of viral hepatitis; the transaminase serum activities. Clin Chim Acta. 1957;2:70–74. doi:10.1016/0009-8981(57)90027-X
7. Nishikawa M, Miyake H, De Ritis FM. (Aspartate transaminase/alanine transaminase) ratio as a significant predictor of recurrence-free survival in patients with upper urinary tract urothelial carcinoma following nephroureterectomy. Urol Oncol. 2016;34:417.e419–417.e415. doi:10.1016/j.urolonc.2016.04.001
8. Wang H, Fang K, Zhang J, et al. The significance of De Ritis (aspartate transaminase/alanine transaminase) ratio in predicting pathological outcomes and prognosis in localized prostate cancer patients. Int Urol Nephrol. 2017;49:1391–1398. doi:10.1007/s11255-017-1618-7
9. Ishihara H, Kondo T, Yoshida K, et al. Evaluation of preoperative aspartate transaminase/alanine transaminase ratio as an independent predictive biomarker in patients with metastatic renal cell carcinoma undergoing cytoreductive nephrectomy: a propensity score matching study. Clin Genitourin Cancer. 2017;15:598–604. doi:10.1016/j.clgc.2017.04.011
10. Miyake H, Matsushita Y, Watanabe H, et al. Significance of De ritis (aspartate transaminase/alanine transaminase) ratio as a significant prognostic but not predictive biomarker in Japanese patients with metastatic castration-resistant prostate cancer treated with cabazitaxel. Anticancer Res. 2018;38:4179–4185. doi:10.21873/anticanres.12711
11. Ha YS, Kim SW, Chun SY, et al. Association between De Ritis ratio (aspartate aminotransferase/alanine aminotransferase) and oncological outcomes in bladder cancer patients after radical cystectomy. BMC Urol. 2019;19:10. doi:10.1186/s12894-019-0439-7
12. Wang L, Xu Y, Zhang S, Bibi A, Xu Y, Li T. The AST/ALT ratio (de ritis ratio) represents an unfavorable prognosis in patients in early-stage SFTS: an observational cohort study. Front Cell Infect Microbiol. 2022;12:725642. doi:10.3389/fcimb.2022.725642
13. JZzlzz. [Consensus on clinical diagnosis, treatment and prevention management of chemotherapy induced thrombocytopenia in China (2018)]. Zhonghua Zhong Liu Za Zhi. 2018;40:714–720. Chinese. doi:10.3760/cma.j.issn.0253-3766.2018.09.014
14. Kuter DJ. Managing thrombocytopenia associated with cancer chemotherapy. Oncology. 2015;29:282–294.
15. Zhu C, Wang Y, Wang X, et al. Profiling chemotherapy-associated myelotoxicity among Chinese gastric cancer population receiving cytotoxic conventional regimens: epidemiological features, timing, predictors and clinical impacts. J Cancer. 2017;8:2614–2625. doi:10.7150/jca.17847
16. Tanriverdi O. Predictive value of baseline plasma D-dimers for chemotherapy- induced thrombocytopenia in patients with stage III colon cancer: a pilot study. Asian Pac J Cancer Prev. 2013;14:293–297. doi:10.7314/APJCP.2013.14.1.293
17. Razzaghdoust A, Mofid B, Zangeneh M. Predicting chemotherapy-induced thrombocytopenia in cancer patients with solid tumors or lymphoma. J Oncol Pharm Pract. 2019;26:587–594. doi:10.1177/1078155219861423
18. Weycker D, Hatfield M, Grossman A, et al. Risk and consequences of chemotherapy-induced thrombocytopenia in US clinical practice. BMC Cancer. 2019;19:151. doi:10.1186/s12885-019-5354-5
19. Kilpatrick K, Shaw JL, Jaramillo R, et al. Occurrence and management of thrombocytopenia in metastatic colorectal cancer patients receiving chemotherapy: secondary analysis of data from prospective clinical trials. Clin Colorectal Cancer. 2021;20:170–176. doi:10.1016/j.clcc.2020.10.004
20. Paz-Ares L, de Marinis F, Dediu M, et al. Maintenance therapy with pemetrexed plus best supportive care versus placebo plus best supportive care after induction therapy with pemetrexed plus cisplatin for advanced non-squamous non-small-cell lung cancer (PARAMOUNT): a double-blind, Phase 3, randomised controlled trial. Lancet Oncol. 2012;13:247–255. doi:10.1016/S1470-2045(12)70063-3
21. Reck M, von Pawel J, Zatloukal P, et al. Phase III trial of cisplatin plus gemcitabine with either placebo or bevacizumab as first-line therapy for nonsquamous non-small-cell lung cancer: aVAil. J Clin Oncol. 2009;27:1227–1234. doi:10.1200/JCO.2007.14.5466
22. Zhou C, Wu YL, Chen G, et al. BEYOND: a randomized, double-blind, placebo-controlled, multicenter, phase III study of first-line carboplatin/paclitaxel plus bevacizumab or placebo in Chinese patients with advanced or recurrent nonsquamous non-small-cell lung cancer. J Clin Oncol. 2015;33:2197–2204. doi:10.1200/JCO.2014.59.4424
23. Ohe Y, Ohashi Y, Kubota K, et al. Randomized phase III study of cisplatin plus irinotecan versus carboplatin plus paclitaxel, cisplatin plus gemcitabine, and cisplatin plus vinorelbine for advanced non-small-cell lung cancer: four-Arm Cooperative Study in Japan. Ann Oncol. 2007;18:317–323. doi:10.1093/annonc/mdl377
24. Fossella F, Pereira JR, von Pawel J, et al. Randomized, multinational, phase III study of docetaxel plus platinum combinations versus vinorelbine plus cisplatin for advanced non-small-cell lung cancer: the TAX 326 study group. J Clin Oncol. 2003;21:3016–3024. doi:10.1200/JCO.2003.12.046
25. Sun Q, Jin C, Zhu L, et al. Host responses and regulation by NFκB signaling in the liver and liver epithelial cells infected with a novel tick-borne bunyavirus. Sci Rep. 2015;5:11816. doi:10.1038/srep11816
26. Lv J, Xiao Q, Chen Y, et al. Effects of magnesium isoglycyrrhizinate on AST, ALT, and serum levels of Th1 cytokines in patients with allo-HSCT. Int Immunopharmacol. 2017;46:56–61. doi:10.1016/j.intimp.2017.02.022
27. Xu F, Moorman AC, Tong X, et al. All-cause mortality and progression risks to hepatic decompensation and hepatocellular carcinoma in patients infected with hepatitis C virus. Clin Infect Dis. 2016;62:289–297. doi:10.1093/cid/civ860
28. Mosedale M, Watkins PB. Drug-induced liver injury: advances in mechanistic understanding that will inform risk management. Clin Pharmacol Ther. 2017;101:469–480. doi:10.1002/cpt.564
29. Maiuri AR, Breier AB, Gora LF, Parkins RV, Ganey PE, Roth RA. Cytotoxic synergy between cytokines and NSAIDs associated with idiosyncratic hepatotoxicity is driven by mitogen-activated protein kinases. Toxicol Sci. 2015;146:265–280. doi:10.1093/toxsci/kfv091
30. Hegde UP, Wilson WH, White T, Cheson BD. Rituximab treatment of refractory fludarabine-associated immune thrombocytopenia in chronic lymphocytic leukemia. Blood. 2002;100:2260–2262. doi:10.1182/blood.V100.6.2260
31. Knittelfelder O, Delago D, Jakse G, et al. The AST/ALT (De Ritis) ratio predicts survival in patients with oral and oropharyngeal cancer. Diagnostic. 2020;10:973.
32. Scheipner L, Smolle MA, Barth D, et al. The AST/ALT ratio is an independent prognostic marker for disease-free survival in stage II and III colorectal carcinoma. Anticancer Res. 2021;41:429–436. doi:10.21873/anticanres.14792
33. Riedl JM, Posch F, Prager G, et al. The AST/ALT (De Ritis) ratio predicts clinical outcome in patients with pancreatic cancer treated with first-line nab-paclitaxel and gemcitabine: post hoc analysis of an Austrian multicenter, noninterventional study. Ther Adv Med Oncol. 2020;12:1758835919900872. doi:10.1177/1758835919900872
34. Li L, Zeng Q, Xue N, et al. A nomogram based on aspartate aminotransferase/alanine aminotransferase (AST/ALT) ratio to predict prognosis after surgery in gastric cancer patients. Cancer Control. 2020;27(1):1073274820954458. doi:10.1177/1073274820954458
35. Zhou J, He Z, Ma S, Liu R. AST/ALT ratio as a significant predictor of the incidence risk of prostate cancer. Cancer Med. 2020;9:5672–5677. doi:10.1002/cam4.3086
36. Kuderer NM, Francis CW, Crawford J, et al. A prediction model for chemotherapy-associated thrombocytopenia in cancer patients. J CLin Oncol. 2006;24:8616. doi:10.1200/jco.2006.24.18_suppl.8616
 © 2022 The Author(s). This work is published and licensed by Dove Medical Press Limited. The full terms of this license are available at https://www.dovepress.com/terms.php and incorporate the Creative Commons Attribution - Non Commercial (unported, v3.0) License.
By accessing the work you hereby accept the Terms. Non-commercial uses of the work are permitted without any further permission from Dove Medical Press Limited, provided the work is properly attributed. For permission for commercial use of this work, please see paragraphs 4.2 and 5 of our Terms.
© 2022 The Author(s). This work is published and licensed by Dove Medical Press Limited. The full terms of this license are available at https://www.dovepress.com/terms.php and incorporate the Creative Commons Attribution - Non Commercial (unported, v3.0) License.
By accessing the work you hereby accept the Terms. Non-commercial uses of the work are permitted without any further permission from Dove Medical Press Limited, provided the work is properly attributed. For permission for commercial use of this work, please see paragraphs 4.2 and 5 of our Terms.