Back to Journals » Psychology Research and Behavior Management » Volume 15
A PLS-SEM Analysis to Check Public Willingness to Use Water from Filtration Plants Installed by Public Own Organizations; a Study of Psychological Behavior Toward Sustainable Development
Received 20 August 2022
Accepted for publication 10 September 2022
Published 20 September 2022 Volume 2022:15 Pages 2671—2682
DOI https://doi.org/10.2147/PRBM.S386097
Checked for plagiarism Yes
Review by Single anonymous peer review
Peer reviewer comments 3
Editor who approved publication: Professor Mei-Chun Cheung
Muhammad Tayyab Sohail,1,2 Shaoming Chen3,4
1School of Public Administration, Xiangtan University, Xiangtan, Hunan, 411105, People’s Republic of China; 2South Asia Research Center, School of Public Administration, Xiangtan University, Xiangtan, Hunan, 411105, People’s Republic of China; 3International Business School, Guangzhou City University of Technology, Guangzhou, 510800, People’s Republic of China; 4Faculty of Finance, City University of Macau, Macau, 999078, People’s Republic of China
Correspondence: Shaoming Chen, Email [email protected]
Introduction: Water is the basic need of human beings and there is no substitute for water. This research was conducted to analyze public willingness to use water from filtration plants installed by public own Organizations and which psychological factors may help them to decide to use safe water.
Methods: There ought to be some nudges in the right direction to encourage people to use water filters. A questionnaire was adopted from the literature for this research. PLS-SEM is used to evaluate data to check the connection among variables since it is the most recommended way for assessing and predicting explained variables to account for the largest latent variance, and PLS-SEM is one of the most effective approaches for predicting outcomes.
Results: PLS-SEM direct path analysis revealed that hypotheses H1-H6 were accepted and the gender and levels of education of the respondents as control variables, gender and education showed insignificant relationships with WUFWFP. Age showed a substantial relationship as a moderator variable between WQK*Age, and HC*Age with a willingness to use filter water from filtration plants=WUFWFP, while the rest of the variables showed an insignificant relationship.
Discussion: As per our results, H1a and H3a have a significant relationship as moderator variables between IV and DV, while H2a, H4a, H5a, and H6a did not show any relationship as moderator variables between IV and DV. Hence H1a and H3a were accepted while the rest of the moderator was rejected under this research. This study would be helpful for the decision-makers and planners to take proper sustainable measures to address the repercussions of urbanization and land use changes to protect the ecosystem.
Keywords: PLS-SEM, public health, organizations, psychological behavior, water filtration plants, safe water
Introduction
Water is the basic need of human beings and gained importance due to the scarcity of freshwater.1 This problem is more serious in developing countries; therefore, water has become a valuable commodity.2,3 Different studies indicate that more than half the world’s population is not having access to safe drinking water and many people die every year due to contaminated drinking water.4,5 The rapid increase in population is primarily responsible for resource scarcity; however, this scarcity is also an issue because humans have depleted this resource in extremely harmful ways.6 The world is making progress in technology, innovations and the latest technology is normal every day, it has not only increased the standard of living but also enhanced the health of individuals and lowered the cost of healthcare by preventing water-borne diseases.7–9 The availability of contaminant-free water is one of the essential human rights that contributes to the achievement of optimal health. A fundamental human right is to have access to safe, uncontaminated drinking water, so the Government must provide safe drinking water to the public.5 The municipal authorities of this study area installed several filtration plants to ensure that citizens have access to drinkable water. It is crucial to comprehend the public’s reaction and willingness to utilize water from these plants.5 A complex combination of multiple factors is required to increase public knowledge of water quality requirements.10–12 These may include demographic and economic factors; availability of water filtration plants; and knowledge of water quality, management, and supply systems.10 In contrast, the majority of recent research on public perceptions of the safety and quality of drinking water has focused on studies of underground water, bottled water, and filtered water.13,14 Some other studies discovered that improving public awareness about water quality and how it is used facilitated the efficient operation of concerned authorities.15,16 The public’s willingness to use safe drinking water is vital information for researchers and policymakers, as well as for the preservation of the environment. The public’s inclination to consume clean drinking water also depends on their level of education, age, and socioeconomic status.17 To evaluate the amount of public engagement and the required positive behavioral response, it is necessary to gain a deeper understanding of how the general public feels about water quality and its importance for environmental sustainability.18–26 To implement and evaluate the success of water quality improvement plans and water pollution management strategies, policymakers must take a more in-depth look at a variety of factors, including human factors such as perception, knowledge, awareness, communication, and societal fabric, as well as economic factors, especially in light of socio-economic impact and climate change.27 It is more challenging for developing countries with limited resources to provide potable water.28 The evaluation of drinking water safety and contamination occurrences, as well as the selection of water sources, must therefore place a substantial emphasis on customer satisfaction and perceptions of service quality. Due to the encouragement of investments in the water industry, the successful management of water demand, and intermittent water delivery systems, public tap water access is prevalent in some low-income and middle-income nations.29 Consequently, people’s understanding of drinking water quality and safety, as well as the relationship between public awareness and the prevention of drinking water contamination accidents in the current study region, are not yet thoroughly covered issues. Under these conditions, the goal of this study was to assess the general population’s degree of knowledge and awareness regarding the quality and safety of drinking water and water pollution. In particular, we investigate whether or not residents of the capital city of Pakistan are willing to drink water filtered at one of the city’s numerous facilities. In addition, we evaluated the relationships between socioeconomic status, water quality information, cost, watercolor, health-related issues, and societal perspectives. As per the previous study, many researchers tried to know people’s knowledge about water quality, but people willing to know about safe drinking water were missing, it was research gaps identified in this research. The purpose of this study is to determine the factors that influence the public’s willingness to use water from public own organizations in Islamabad Pakistan. Some other researchers30–33 have developed a conceptual framework for this research that takes into account the public’s willingness to drink water that has been filtered at a plant that has already been erected. Under this research number of parameters were selected to check people’s willingness to use water from filtration plants ie, Water Quality Knowledge= WQK; Social Perspective=SP; Health Consciousness=HC; Hygiene Water=HW; Cost Savings=CS; Water Color=WC; Willingness to use Filter Water from Filtration Plants=WUFWFP. Specific objectives of this research were 1) A PLS-SEM analysis to check public willingness to use water from filtration plants installed by Public own Organizations and 2) A study of psychological behavior toward the use of filtered water for a healthy life. 3) To check the impacts of age (moderator) between DV and IV. The link between SP (H1a), HC (H2a), WQK (H3a), CS (H4a), HW (H5a), WC (H6a), and WUFWFP is moderated by age. Therefore, the current study was designed to address the following direct hypotheses (Figure 1):
- H1: Social perspective has a positive direct relationship with willingness to use filter water from installed filtration plants.
- H1a: Age shows moderation relationship between social perspective and willingness to use filter water from installed filtration plants
- H2: Health consciousness has a positive direct relationship with willingness to use filter water from installed filtration plants.
- H2a: Age shows moderation relationship between Health consciousness and willingness to use filter water from installed filtration plants
- H3: Water quality knowledge has a positive direct relationship with willingness to use filter water from installed filtration plants.
- H3a: Age shows moderation relationship between Water quality knowledge and willingness to use filter water from installed filtration plants
- H4: Cost saving has a positive direct relationship with willingness to use filter water from installed filtration plants.
- H4a: Age shows moderation relationship between Cost saving and willingness to use filter water from installed filtration plants
- H5: Hygiene water has a positive direct relationship with willingness to use filter water from installed filtration plants.
- H5a: Age shows moderation relationship between Hygiene water and willingness to use filter water from installed filtration plants
- H6: Water color has a positive direct relationship with willingness to use filter water from installed filtration plants.
- H6a: Age shows moderation relationship between Water color and willingness to use filter water from installed filtration plants
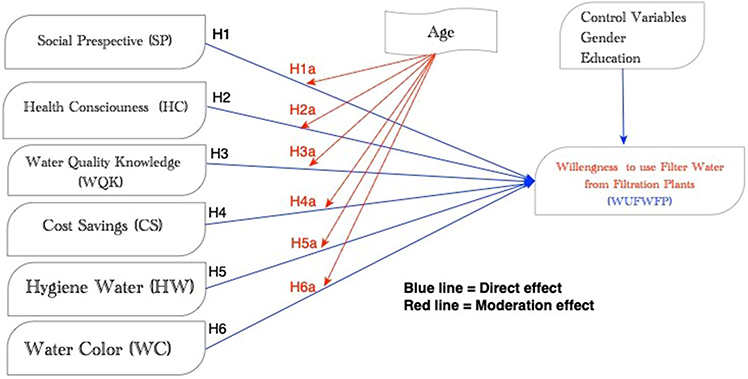 |
Figure 1 Research Model. |
According to the Government of Pakistan Census 1998, the population of Islamabad was 529,180 in 1998 and it increased to 1,014,825 in 2017 under the Government of Pakistan Census Pakistan Bureau of Statistics.5,26 All of these figures indicate that the rate of population growth in this city is increasing, and a population of this size has implications not just for the environment, but also for the water resources and the government’s responsibility to supply its residents with clean and safe drinking water.34 The great majority of migrants come from locations where climate change and other sorts of natural disasters have severely affected rural lifestyles.35 The majority of the city’s new population is from the adjacent provinces of Punjab and Khyber Pakhtunkhwa. There are also several migrants from Afghanistan in this city.36 It can be a little difficult for local Governments to provide all essential things to local inhabitants with limited resources.26 Rural-to-urban migration has become a significant phenomenon in the modern world as a result of the expansion of the economy and industry, as well as other causes related to these developments. There is less vegetation in and around cities as a result of this fast urbanization, which produces a complex set of environmental challenges. Due to population growth, important green space is being converted into construction grounds. There is no doubt that urbanization has a positive impact on the economic and social development of a country, but rapid urbanization also causes several challenges, especially in developing countries.37 Such a huge population can have pressure on traffic and air pollution, as well as constraints placed on a region’s water resources.38
Materials and Method
Study Area
The capital city of Pakistan Islamabad was the study area of this research. Islamabad is located at a latitude of 33.43 degrees north and a longitude of 73.04 degrees east. It is located on the northern edge of the Pothohar Plateau at the base of the Margalla Hills. above sea level by 540 meters (1770 feet). At the time of independence, Islamabad was part of Punjab province the Potohar Plateau in particular. However, Islamabad was mandated to become the capital city in 1960. Islamabad’s total land area is 906 square kilometers, of which 220.15 square kilometers are devoted to the city and 466.20 square kilometers to the surrounding countryside (Figure 2). The population of Islamabad gets their drinking water from both surface water and groundwater. The Simply Dam is the main supply of surface water in the area under study, while public tube wells in the vicinity of the National Park provide access to groundwater. This has caused too much groundwater to be taken out of the ground to meet water needs, which has caused the water table to drop in the Capital Region.
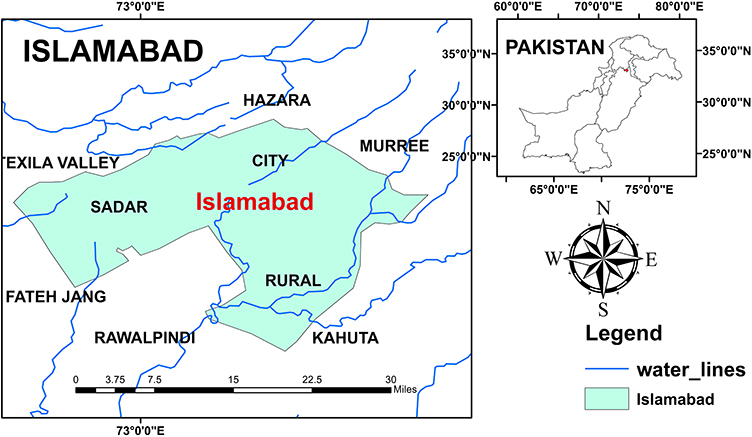 |
Figure 2 Geographical location of the study area. |
The Capital Development Authority (CDA) of the Government of Pakistan installed numeral of water filtration plants in Islamabad to meet the growing demand for clean drinking water in the capital. In the current study, we attempted to determine whether or not individuals are willing to drink water that has been filtered at a facility. There ought to be some nudges in the right direction to encourage people to use water filters. A questionnaire was adopted from the literature for this research. The most fundamental aspects of research ethics were taken into account during the process of defining the objectives of the study and gathering information from members of the public in the city of Islamabad.26 Additionally, the objectives of the study were articulated very plainly to the general public.39 The most important indicators concerned the demographic information of the participants as well as their level of water quality knowledge, social perspective, health consciousness, hygiene water, cost savings, water color, and willingness to use filtered water from filtration plants.
Data Analysis
In this study, a total number of 600 filled-out questionnaires were gathered, and a pre-test was conducted to assess the reliability of the data and to eliminate any inconsistencies that may have occurred. After data collection, the information was transferred into PLS-SEM and SPSS 24 for additional examination, ArcGIS was used to make a map of the study area. Since PLS-SEM is one of the most useful methods for predicting outcomes and since it is the most commonly recommended method for predicting and assessing explained variables to account for the largest potential variance to analyze the relationship among variables.19 PLS-SEM is used to analyze data since it is the most recommended way for predicting and assessing explained variables to account for the largest potential variance, and PLS-SEM is one of the most effective approaches for predicting outcomes.40 PLS-SEM permits using a limited sample number while yielding higher-quality conclusions. Apart from this, it can run both external and internal processing concurrently on all the models. It is also feasible to examine complex route models using this method of data collection.41 According to recent studies, the PLS-SEM approach is one of the best approaches to checking relationships among variables.42 Because of this, the PLS-SEM approach looks to be the best option for this study. A two-stage analysis is more useful since the model takes into consideration the non-linear account interactions. A route modeling approach based on PLS is evaluated twice to ensure the accuracy and reliability of the assessments of the constructs. First, the validity and reliability of convergent validity were checked.
Results and Discussion
This research is based on public willingness to use water from filtration plants in Islamabad and which parameters help them to decide to use water from filtration plants. These parameters were selected WQK, SP, HC, HW, CS, WT, and WUFWFP to check public willingness to use water from filtration plans. When analyzing measurement models, it is important to take into account both the convergent and the discriminant validity of the indicators and constructs.40 We put the indicators of the constructs through their paces by subjecting them to several tests to find out whether or not they provide an appropriate evaluation of the study variables. In conjunction with item loading, it allowed us to Identify the dependability of the instrument in the issue. The composite reliability, also known as CR, and the average variance extracted (AVE), both measures used to show the degree of variance in indicators compensated for by the latent construct, are also utilized. The factor loadings on the connected structures are utilized to assess each item’s dependability. (Table 1 and Figure 3), it is considered significant if values are greater or equal to 0.6.40 Cronbach’s Alpha values were calculated as well to check the reliability of overall data, It is recommended that the value of Cronbach’s Alpha for all constructions be more than or extremely close to the recommended cutoff of 0.7.43 The Cronbach’s Alpha values for this research variable are: WQK = 0.789; SP =0.734; HC =0.694; HW=0.884; CS =0.831; WC=0.882; WUFWFP =0.915. Composite reliability (CR) was calculated as well, this was done in place of the traditional method.43 The high-reliability scores of these results, which are greater than 0.7, provide further support for these findings. These results show that the dataset has adequate information for further research.
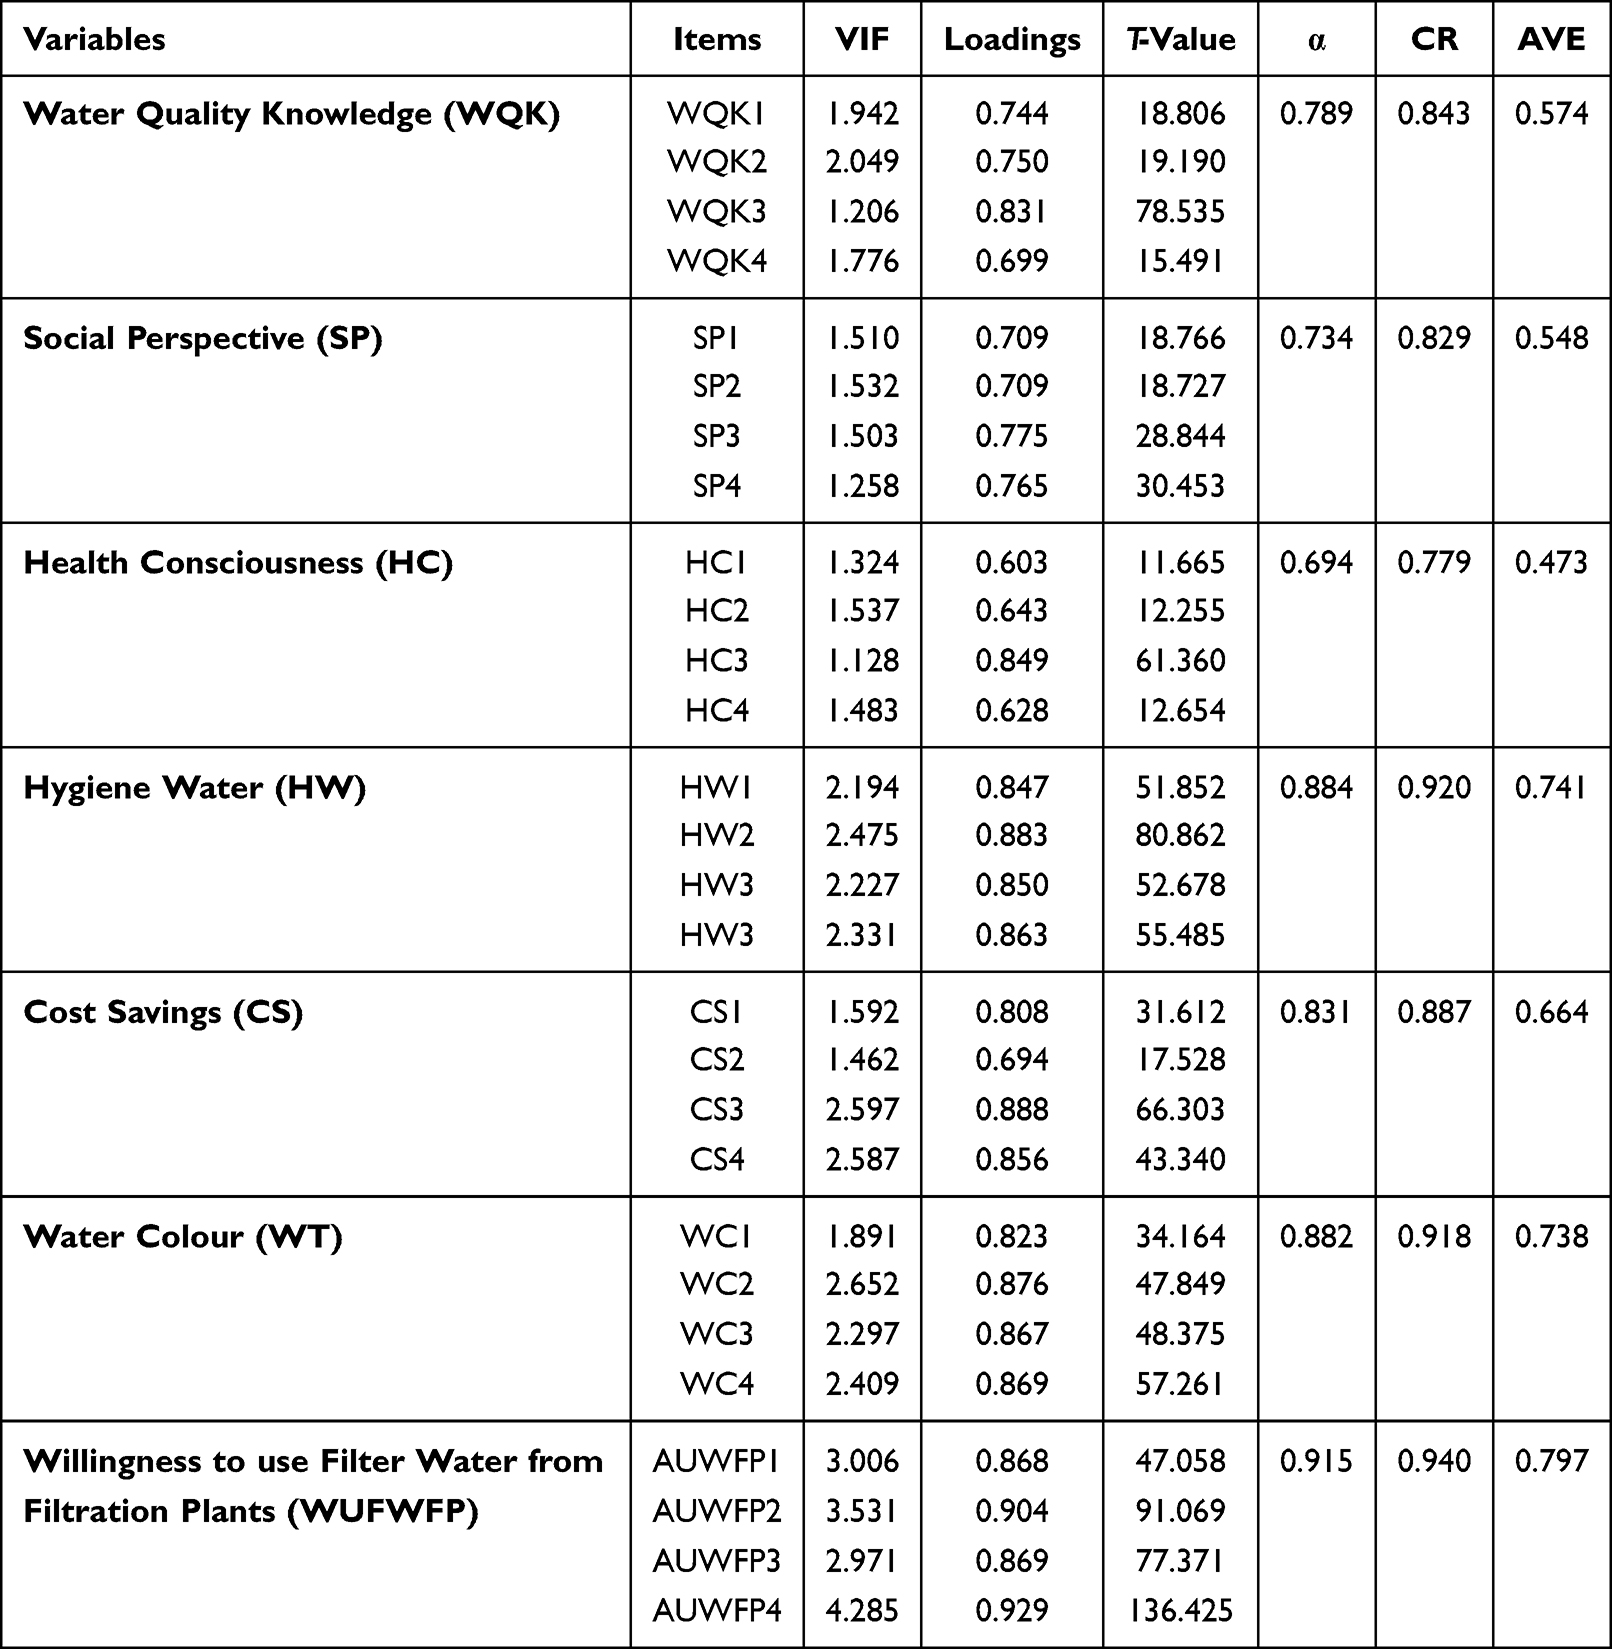 |
Table 1 Reliability and Validity Analysis |
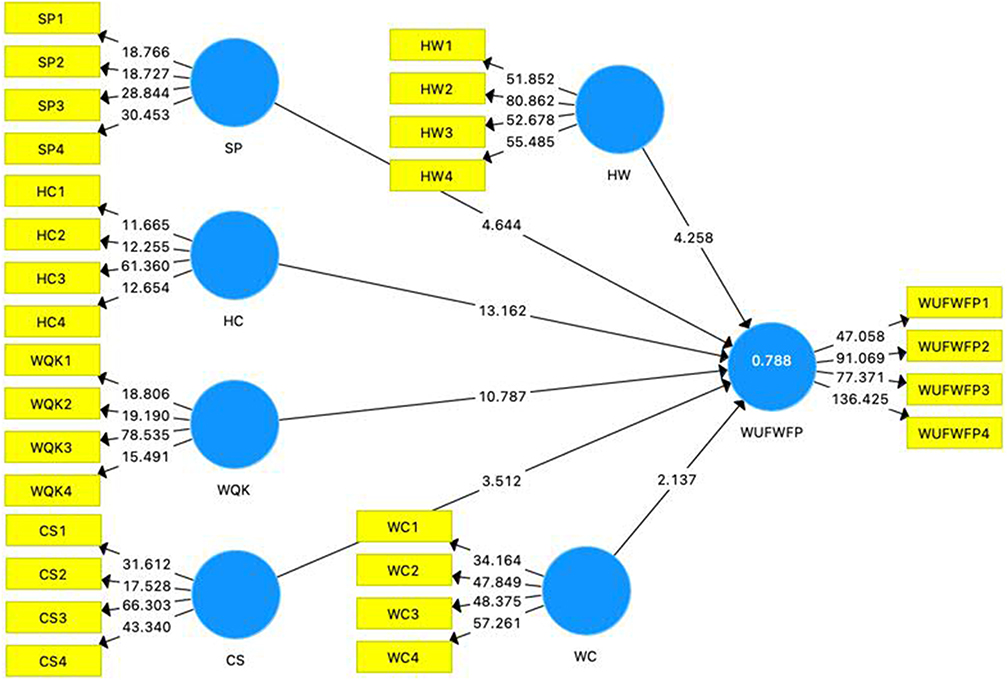 |
Figure 3 Measurement model. |
The suggested model’s discriminant validity is assessed using the Fornell-Larcker criterion and heterotrait-monotrait (HTMT) ratios.40,41 The highest significant correlation of variables in each column in Table 2 clearly shows that the Fornell-Larcker criteria were used to verify discriminant validity.44 Henseler, Ringle, and Sarstedt (2015)45 proposed the HTMT ratio methodology as a novel way of determining the presence or absence of discriminant validity. Table 3 displays the HTMT values for each of the several factors studied during this research. All of the HTMT values in this study are less than 0.90, which means that the variables had discriminant validity and that the experiment was successful and met its goals.45 The rule of thumb is that the square root of each construct’s AVE is greater than the values of correlated latent variables/constructs otherwise discriminant validity is violated, but in this research, all other values were under limit, so this research ignored it.
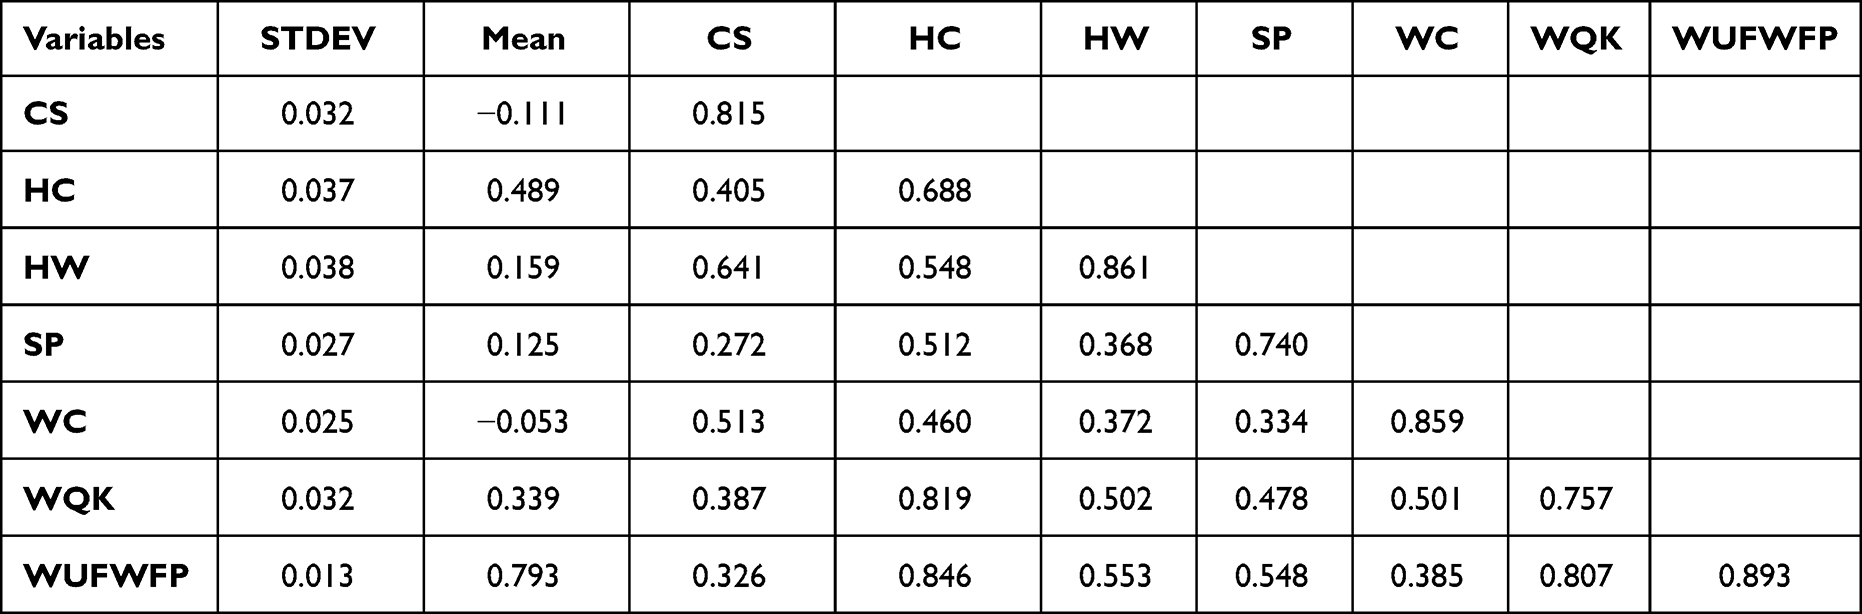 |
Table 2 Fornell-Larcker Criterion |
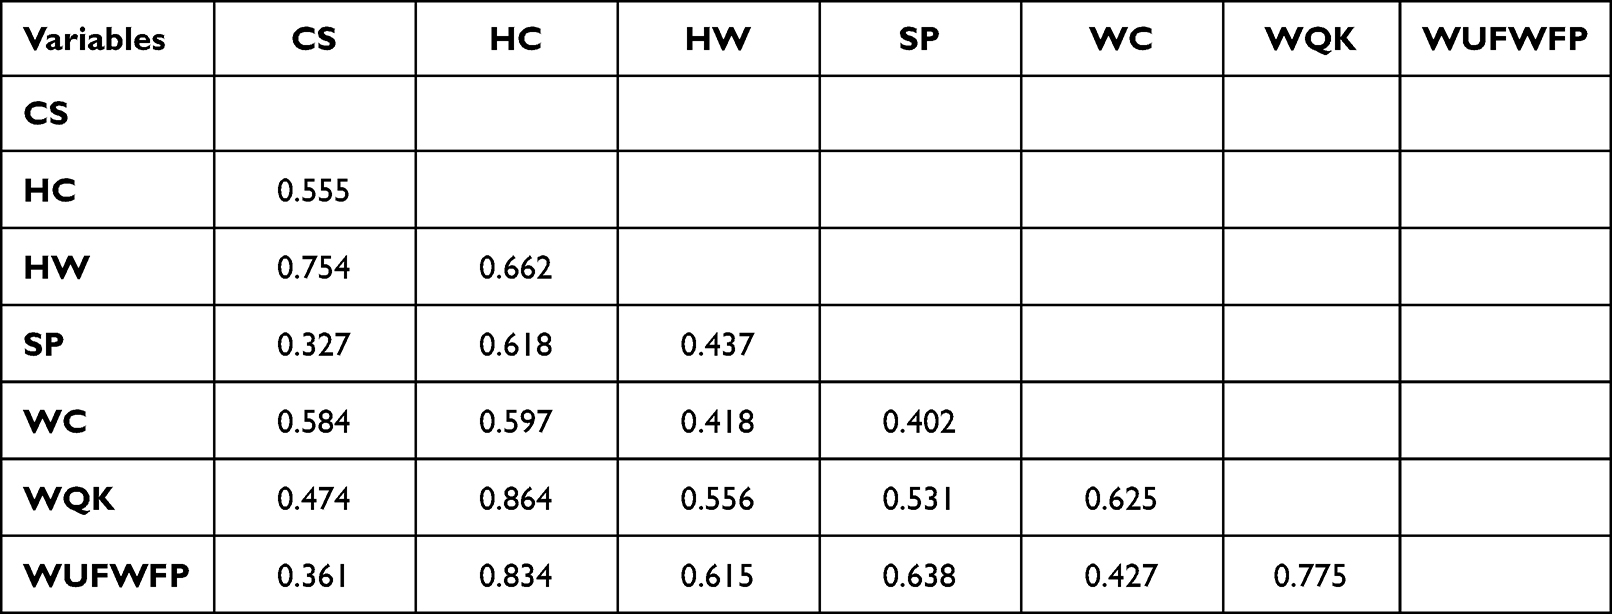 |
Table 3 HTMT Ratio |
There are also some other studies conducted to check people’s willingness to use safe drinking water across the globe.46–50 Water is a basic human need and necessary for survival, but safe drinking water is more important for a healthy life.51,52 Under current study tried to check people’s willingness to use safe drinking water in the designed study area. This study evaluated the structural model by using the guidelines provided by Hair Jr41 to understand the data. The PLS-SEM assessment process was divided into several phases, at the second phase structural model was conducted to check relations among different variables. The predictive relevance of the model, multicollinearity, the empirical importance of the path coefficients, and the level of confidence are some of the factors that should be taken into account when examining the structural path model. At this stage, the direct path was investigated between independent variables and dependent variable WUFWFP. The results of the PLS-SEM path analysis (Figure 4) indicated an R2 value of 0.788 and a Q2 value of 0.619, which showed our model was fit (Table 4). The following variables were examined using PLS-SEM: WQK; SP; HC; HW; CS; WC and WUFWFP. We started by looking at the causal connections between the many variables that were already known to exist to assess the validity of the hypothesis. After that, we performed a bootstrapping test with 5000 repetitions to see how much our results supported the hypothesis.42,53,54 PLS-SEM direct path analysis revealed that WQK -> WUFWFP (β=0.342; p<0.000), SP -> WUFWFP (β=0.125; p<0.000), HC -> WUFWFP (β=0.488; p<0.000), HW -> WUFWFP (β=−0.160; p<0.000) CS -> WUFWFP (β=−0.114 p<0.001), WC-> WUFWFP (β=−0.054; p<0.033) are significant. These results offer support to hypotheses H1-H6 accepted. We have also looked at the levels of education and gender of the respondents as control variables, gender (β=−0.004; p<0.834) and education (β=0.009; p<0.650) showed insignificant relationships with WUFWFP. It means there is no direct relationship between gender and education to DV (Table 4 and Figure 4). Most people were willing and aware of water quality and willing to use water from installed water filtration plants to obtain safe drinking water.47
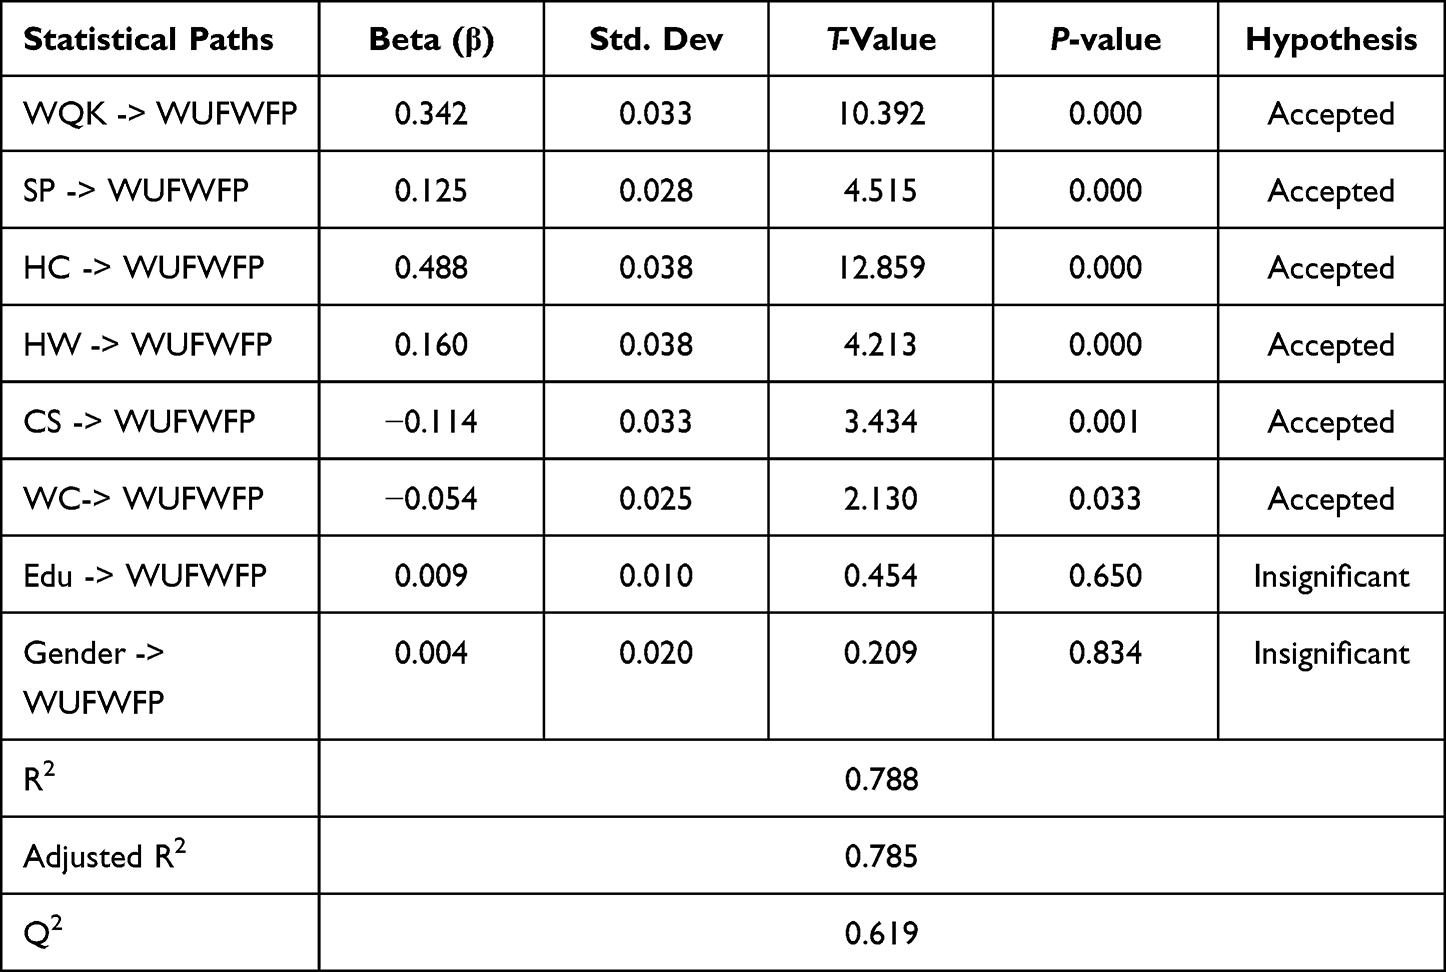 |
Table 4 Path Analysis (PLS-SEM) |
 |
Figure 4 PLS-SEM Path Model. |
It is always important to see demographic factors influence variables.42,53,54 Age is considered an experience of life with different circumstances of life that’s why age was chosen as a modern variable in this research.55 PLS-SEM was used to check moderations (Age) for H1a-H6a between DV and IV. Smart-PLS ran the second model by adding the moderation effect of age and applied the same settings of bootstrapping with 5000 sample repetitions. Study results revealed a small moderation effect in the relationships between independent variables and dependent variables. Age showed a significant relationship as a moderator variable between WQK*Age, and HC*Age with a willingness to use filter water from filtration plants=WUFWFP, while the rest of the variables showed an insignificant relationship. Here are β and p values of moderating effects WQK*Age -> WUFWFP (β=0.110; p<0.012), SP*Age -> WUFWFP (β=0.010; p<0.723), HC*Age ->WUFWFP (β=−0.115; p<0.003), HW*Age -> WUFWFP (β=0.037; p<0.258), CS*Age -> WUFWFP (β=−0.007; p<0.837) and WC*Age ->WUFWFP (β=0.027; p<0.412). As per our results, H1a and H3a have a significant relationship as moderator variables between IV and DV, while H2a, H4a, H5a, and H6a did not show any relationship as moderator variables between IV and DV. Hence H1a and H3a were accepted while the rest of the moderator was rejected under this research (Table 5 and Figure 5).
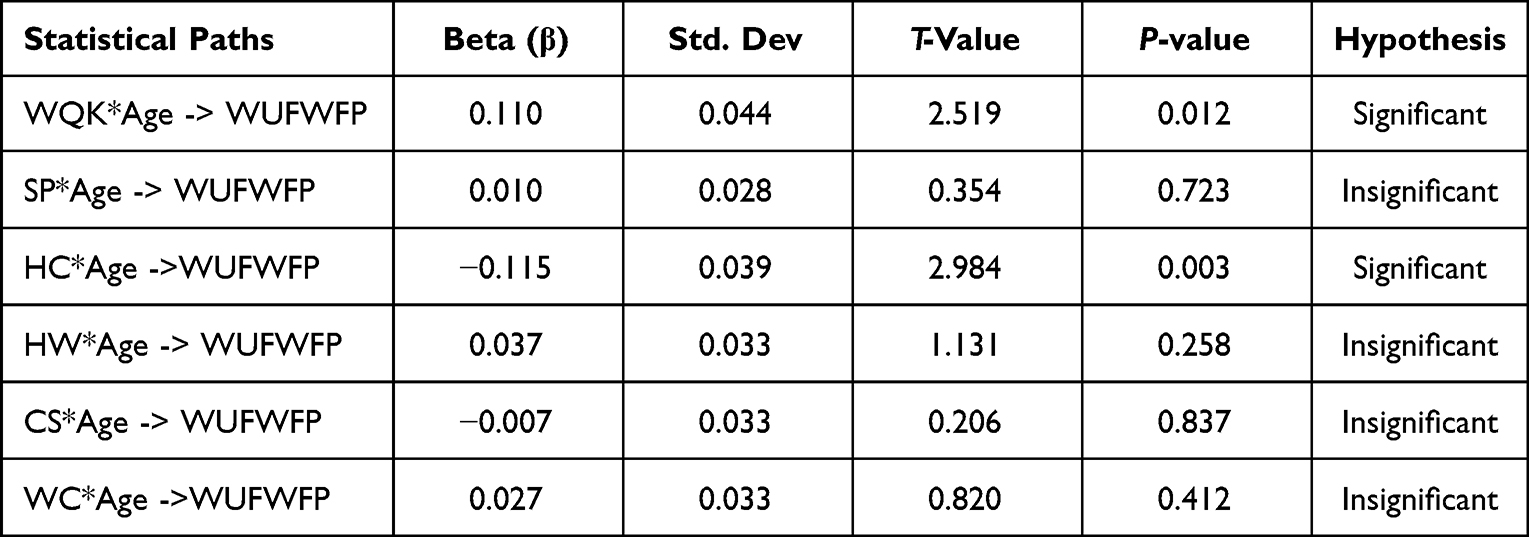 |
Table 5 Moderation Effect (Age) |
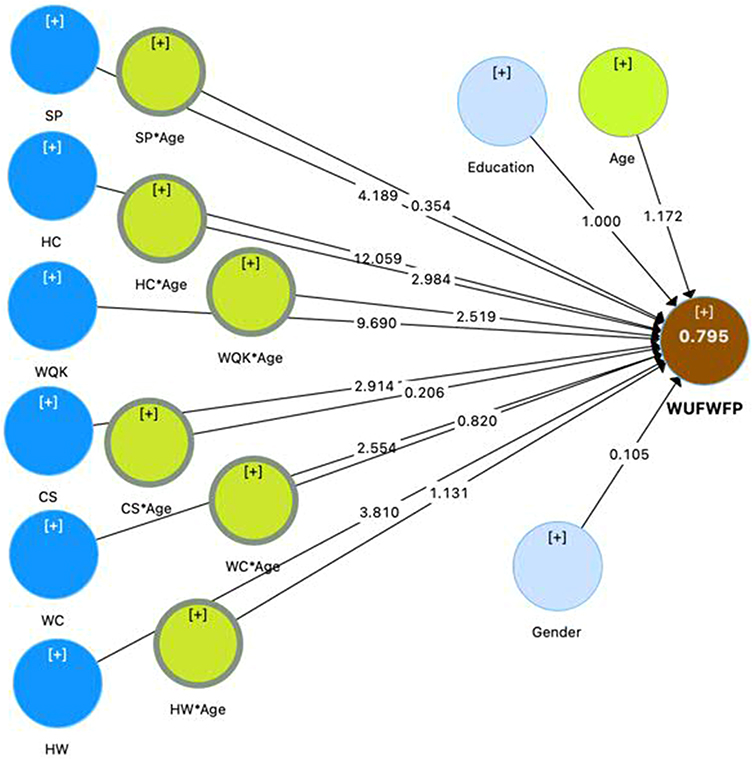 |
Figure 5 Moderator (Age). |
Conclusions
This study was based on the public’s awareness of Islamabad’s use of water from filtration facilities and the factors that facilitate that usage. PLS-SEM direct path analysis revealed that WQK -> WUFWFP, SP -> WUFWFP, HC -> WUFWFP, HW -> WUFWFP, CS -> WUFWFP, WC -> WUFWFP were significant. These results support hypotheses H1-H6 accepted and the levels of education and gender of the respondents as control variables. Gender and education showed insignificant relationships with WUFWFP. It means there is no direct relationship between gender and education and DV. Study results revealed a small moderation effect in the relationships between independent variables and dependent variables. Age showed a significant relationship as a moderator variable between WQK*Age, and HC*Age with a willingness to use filter water from filtration plants=WUFWFP, while the rest of the variables showed an insignificant relationship. Since this research was conducted in Pakistan’s capital, the findings of this research may apply to this study area but also other similar study areas. Public awareness about and willingness to use safe water is very important. Government must promote and guide more people to use safe drinking water through annual reports, newspapers, social media, and other communication channels. This study would help policymakers and decision-makers to make more friendly policies to provide safe water and protect public health. For future research direction more areas and more people can be included in this type of research and another technique Artificial neural network ANN can be used for further analysis.
The Ethics Statement
All participants provided informed consent. This study was authorized by the Academic Ethics Committee of the School of Public Administration of Xiangtan University.
Author Contributions
All authors made substantial contributions to conception and design, acquisition of data, or analysis and interpretation of data; took part in drafting the article or revising it critically for important intellectual content; gave final approval of the version to be published; and agree to be accountable for all aspects of the work.
Disclosure
The authors report no conflicts of interest in this work.
References
1. Leya RS, Bala SK, Newton IH, Chowdhury M, Haque SM. Water security assessment of a peri-urban area: a study in Singapore Upazila of Manikganj district of Bangladesh. Environ Dev Sustain. 2022;1–24. doi:10.1007/s10668-021-02023-6
2. Parveen S, Ahmad J, Rahman M. Estimating willingness to pay for drinking water quality in Nowshera Pakistan: a domestic study for public health. Int J African Asian Stud J. 2016;19:48–56.
3. Mukhopadhyay A, Duttagupta S, Mukherjee A. Emerging organic contaminants in global community drinking water sources and supply: a review of occurrences, processes, and removal. J Environ Chem Eng. 2022;107560. doi: 10.1016/j.jece.2022.107560
4. Tang W, Pei Y, Zheng H, Zhao Y, Shu L, Zhang H. Twenty years of China’s water pollution control: experiences and challenges. Chemosphere. 2022;295:133875. doi:10.1016/j.chemosphere.2022.133875
5. Sohail MT, Mahfooz Y, Aftabc R, Yend Y, Talibe MA, Rasoolf A. Water quality and health risk of public drinking water sources: a study of filtration plants installed in Rawalpindi and Islamabad, Pakistan. Desalin Water Treat. 2020;181:239–250. doi:10.5004/dwt.2020.25119
6. DeNicola E, Aburizaiza OS, Siddique A, Khwaja H, Carpenter DO. Climate change and water scarcity: the case of Saudi Arabia. Ann Glob Health. 2015;81(3):342–353. doi:10.1016/j.aogh.2015.08.005
7. Padhi R, Sahu S. Deepening democracy and people’s movements: the context of access to drinking water in India. Water Gov. 2013;1:136.
8. McCaffrey SC. A human right to water: domestic and international implications. Geo Int’L Envtl L Rev. 1992;5:1.
9. Gleick PH. Basic water requirements for human activities: meeting basic needs. Water Int. 1996;21(2):83–92. doi:10.1080/02508069608686494
10. Arora M, Malano H, Davidson B, Nelson R, George B. Interactions between centralized and decentralized water systems in urban context: a review. Water. 2015;2(6):623–634.
11. Phan TD, Smart JC, Capon SJ, Hadwen WL, Sahin O. Applications of Bayesian belief networks in water resource management: a systematic review. Environ Model Softw. 2016;85:98–111. doi:10.1016/j.envsoft.2016.08.006
12. Nkhoma PR, Alsharif K, Ananga E, Eduful M, Acheampong M. Recycled water reuse: what factors affect public acceptance? Environ Conserv. 2021;48(4):278–286. doi:10.1017/S037689292100031X
13. Bass D, McFadden B, Costanigro M, Messer K. Implicit and explicit biases for recycled water and tap water. Water Resour Res. 2022;58(6):e2021WR030712. doi:10.1029/2021WR030712
14. Cevallos-Mendoza J, Amorim CG, Rodríguez-Díaz JM, Montenegro MDCB. Removal of contaminants from water by membrane filtration: a review. Membranes. 2022;12(6):570. doi:10.3390/membranes12060570
15. Benameur T, Benameur N, Saidi N, Tartag S, Sayad H, Agouni A. Predicting factors of public awareness and perception about the quality, safety of drinking water, and pollution incidents. Environ Monit Assess. 2022;194(1):1–26. doi:10.1007/s10661-021-09557-2
16. Lu J. Can the central environmental protection inspection reduce transboundary pollution? Evidence from river water quality data in China. J Clean Prod. 2022;332:130030. doi:10.1016/j.jclepro.2021.130030
17. Tarannum F, Kansal A, Sharma P. Understanding public perception, knowledge and behaviour for water quality management of the river Yamuna in India. Water Policy. 2018;20(2):266–281. doi:10.2166/wp.2018.134
18. Mumbi AW, Watanabe T. Differences in risk perception of water quality and its influencing factors between lay people and factory workers for water management in river Sosiani, Eldoret Municipality Kenya. Water. 2020;12(8):2248. doi:10.3390/w12082248
19. Sohail MT, Chen S. A systematic PLS-SEM approach on assessment of indigenous knowledge in adapting to floods; A way forward to sustainable agriculture. Front Plant Sci. 2022;13:3020.
20. Muhammad AM, Zhonghua T, Dawood AS, Sohail MT. A study to investigate and compare groundwater quality in adjacent areas of landfill sites in Lahore city. Nat Environ Pollut Technol. 2014;13(1):1–10.
21. Sohail MT, Ullah S, Majeed MT, Usman A, Andlib Z. The shadow economy in South Asia: dynamic effects on clean energy consumption and environmental pollution. Environ Sci Pollut Res. 2021;28(23):29265–29275. doi:10.1007/s11356-021-12690-7
22. Sohail MT, Xiuyuan Y, Usman A, Majeed MT, Ullah S. Renewable energy and non-renewable energy consumption: assessing the asymmetric role of monetary policy uncertainty in energy consumption. Environ Sci Pollut Res. 2021;28(24):31575–31584. doi:10.1007/s11356-021-12867-0
23. Mahfooz Y, Yasar A, Tabinda AB, Sohail MT, Siddiqua A, Mahmood S. Quantification of the river Ravi pollution load and oxidation pond treatment to improve the drain water quality. Desalin Water Treat. 2017;85:132–137. doi:10.5004/dwt.2017.21195
24. Sohail MT, Ullah S, Majeed MT, Usman A. Pakistan management of green transportation and environmental pollution: a nonlinear ARDL analysis. Environ Sci Pollut Res. 2021;28(23):29046–29055. doi:10.1007/s11356-021-12654-x
25. Sohail M, Ehsan M. Investigating the drinking water quality and associated health risks: a survey of metropolis area Pakistan. Front Mater. 2022;9:864254.
26. Sohail M, Ehsan M, Riaz S, Elkaeed E, Awwad N, Ibrahium H. Investigating the drinking water quality and associated health risks in metropolis area of Pakistan. Front Mater. 2022;9:864254. doi:10.3389/fmats
27. Mukherjee S, Bassler BL. Bacterial quorum sensing in complex and dynamically changing environments. Nat Rev Microbiol. 2019;17(6):371–382. doi:10.1038/s41579-019-0186-5
28. Montgomery MA, Elimelech M. Water and sanitation in developing countries: including health in the equation. Environ Sci Technol. 2007;41(1):17–24. doi:10.1021/es072435t
29. Drouiche N, Aoudj S, Lounici H, Drouiche M, Ouslimane T, Ghaffour N. Fluoride removal from pretreated photovoltaic wastewater by electrocoagulation: an investigation of the effect of operational parameters. Procedia Eng. 2012;33:385–391. doi:10.1016/j.proeng.2012.01.1218
30. Saylor A, Prokopy LS, Amberg S. What’s wrong with the tap? Examining perceptions of tap water and bottled water at Purdue University. Environ Manage. 2011;48(3):588–601. doi:10.1007/s00267-011-9692-6
31. Debbeler LJ, Gamp M, Blumenschein M, Keim D, Renner B. Polarized but illusory beliefs about tap and bottled water: a product-and consumer-oriented survey and blind tasting experiment. Sci Total Environ. 2018;643:1400–1410. doi:10.1016/j.scitotenv.2018.06.190
32. Grupper MA, Schreiber ME, Sorice MG. How perceptions of trust, risk, tap water quality, and salience characterize drinking water choices. Hydrology. 2021;8(1):49. doi:10.3390/hydrology8010049
33. Ochoo B, Valcour J, Sarkar A. Association between perceptions of public drinking water quality and actual drinking water quality: a community-based exploratory study in Newfoundland (Canada). Environ Res. 2017;159:435–443. doi:10.1016/j.envres.2017.08.019
34. Hibbs BJ, Sharp JM Jr. Hydrogeological impacts of urbanization. Environ Eng Geosci. 2012;18(1):3–24. doi:10.2113/gseegeosci.18.1.3
35. Ibrahim B, Mensah H. Rethinking climate migration in sub-Saharan Africa from the perspective of tripartite drivers of climate change. SN Soc Sci. 2022;2(6):1–24. doi:10.1007/s43545-022-00383-y
36. Paul BK, Rahman MK, Lu M, Crawford TW. Household migration and intentions for future migration in the climate change vulnerable lower Meghna estuary of coastal Bangladesh. Sustainability. 2022;14(8):4686. doi:10.3390/su14084686
37. Vandermeulen V, Verspecht A, Vermeire B, Van Huylenbroeck G, Gellynck X. The use of economic valuation to create public support for green infrastructure investments in urban areas. Landsc Urban Plan. 2011;103(2):198–206. doi:10.1016/j.landurbplan.2011.07.010
38. Izakovičová Z, Mederly P, Petrovič F. Long-term land use changes driven by urbanisation and their environmental effects (example of Trnava City, Slovakia). Sustainability. 2017;9(9):1553. doi:10.3390/su9091553
39. Ashraf J. Examining the public sector recruitment and selection, in relation to job analysis in Pakistan. Cogent Soc Sci. 2017;3(1):1309134. doi:10.1080/23311886.2017.1309134
40. Hair JF Jr, Howard MC, Nitzl C. Assessing measurement model quality in PLS-SEM using confirmatory composite analysis. J Bus Res. 2020;109:101–110. doi:10.1016/j.jbusres.2019.11.069
41. Hair JF Jr, Sarstedt M. Data, measurement, and causal inferences in machine learning: opportunities and challenges for marketing. J Mark Theory Pract. 2021;29(1):65–77. doi:10.1080/10696679.2020.1860683
42. Mustafa S, Hao T, Jamil K, Qiao Y, Nawaz M. Role of eco-friendly products in the revival of developing countries’ economies and achieving a sustainable green economy. Front Environ Sci. 2022;1082. doi:10.3389/fenvs.2022.955245
43. Werts CE, Linn RL, Jöreskog KG. Intraclass reliability estimates: testing structural assumptions. Educ Psychol Meas. 1974;34(1):25–33. doi:10.1177/001316447403400104
44. Fornell C, Larcker DF. Structural Equation Models with Unobservable Variables and Measurement Error: Algebra and Statistics. Los Angeles, CA: Sage Publications Sage CA; 1981.
45. Henseler J, Ringle CM, Sarstedt M. A new criterion for assessing discriminant validity in variance-based structural equation modeling. Acad Mark Sci Rev. 2015;43(1):115–135. doi:10.1007/s11747-014-0403-8
46. Khan NI, Brouwer R, Yang H. Household’s willingness to pay for arsenic safe drinking water in Bangladesh. J Environ Manage. 2014;143:151–161. doi:10.1016/j.jenvman.2014.04.018
47. Dey NC, Parvez M, Saha R, et al. Water quality and willingness to pay for safe drinking water in Tala Upazila in a coastal district of Bangladesh. Expos Health. 2019;11(4):297–310. doi:10.1007/s12403-018-0272-3
48. Jordan JL, Elnagheeb AH. Willingness to pay for improvements in drinking water quality. Water Resour Res. 1993;29(2):237–245. doi:10.1029/92WR02420
49. Khan H, Iqbal F, Saeed I. Estimating willingness to pay for improvements in drinking water quality: evidence from Peshawar, Northern Pakistan. Environ Econ. 2010;1(Iss. 2):38–43.
50. Ahsan M, Hadiujjaman S, Islam M, et al. Willingness to pay for improved safe drinking water in a coastal urban area in Bangladesh. Water Policy. 2021;23(3):633–653. doi:10.2166/wp.2021.031
51. Khuc QV. Household’s Willingness-to-Pay Estimation for Safe Drinking Water: A Case Study in Vietnam. Colorado State University; 2013.
52. Sobsey MD. Drinking water and health research: a look to the future in the United States and globally. J Water Health. 2006;4(S1):17–21. doi:10.2166/wh.2006.0039
53. Mustafa S, Tengyue H, Qiao Y, Sha S, Sun R. How a successful implementation and sustainable growth of e-commerce can be achieved in developing countries; a pathway towards green economy. Front Environ Sci. 2022;10(940659):
54. Mustafa S, Qiao Y, Yan X, Anwar A, Hao T, Rana S. Digital students’ satisfaction with and intention to use online teaching modes, role of big five personality traits. Front Psychol. 2022;13. doi:10.3389/fpsyg.2022.956281
55. Eckert P. Age as a sociolinguistic variable. In: The Handbook of Sociolinguistics. Wiley Online Library; 2017:151–167.
 © 2022 The Author(s). This work is published and licensed by Dove Medical Press Limited. The
full terms of this license are available at https://www.dovepress.com/terms
and incorporate the Creative Commons Attribution
- Non Commercial (unported, 3.0) License.
By accessing the work you hereby accept the Terms. Non-commercial uses of the work are permitted
without any further permission from Dove Medical Press Limited, provided the work is properly
attributed. For permission for commercial use of this work, please see paragraphs 4.2 and 5 of our Terms.
© 2022 The Author(s). This work is published and licensed by Dove Medical Press Limited. The
full terms of this license are available at https://www.dovepress.com/terms
and incorporate the Creative Commons Attribution
- Non Commercial (unported, 3.0) License.
By accessing the work you hereby accept the Terms. Non-commercial uses of the work are permitted
without any further permission from Dove Medical Press Limited, provided the work is properly
attributed. For permission for commercial use of this work, please see paragraphs 4.2 and 5 of our Terms.