")
Back to Journals » International Journal of General Medicine » Volume 14
A Novel Pyroptosis-Related Gene Signature for Early-Stage Lung Squamous Cell Carcinoma
Received 4 August 2021
Accepted for publication 28 September 2021
Published 5 October 2021 Volume 2021:14 Pages 6439—6453
DOI https://doi.org/10.2147/IJGM.S331975
Checked for plagiarism Yes
Review by Single anonymous peer review
Peer reviewer comments 2
Editor who approved publication: Dr Scott Fraser
Xiaoyan Li,1,2 Jie He1,3
1Clinical Medical College of Chengdu Medical College, Chengdu, Sichuan, 610500, People’s Republic of China; 2Department of Endocrinology, The First Affiliated Hospital of Chengdu Medical College, Chengdu, Sichuan, 610500, People’s Republic of China; 3Department of Pulmonary and Critical Care Medicine, The First Affiliated Hospital of Chengdu Medical College, Chengdu, Sichuan, 610500, People’s Republic of China
Correspondence: Jie He
Clinical Medical College of Chengdu Medical College, BaoGuang Street 278, Chengdu, Sichuan, 610500, People’s Republic of China
Tel +86-28-83016637
Fax +86-27-83016637
Email [email protected]
Background: Diagnosis of early stage lung squamous cell carcinoma (LUSC) has improved; however, a comprehensive analysis of prognostic signatures is needed.
Purpose: To identify, establish, and validate a signature model based on pyroptosis-related genes for prognostic predictions of early stage LUSC.
Patients and Methods: Two independent cohorts were included. RNA-seq transcriptome data from patients with early stage LUSC were obtained from The Cancer Genome Atlas (TCGA) database. Thirty-three pyroptosis-related genes were analyzed between early stage LUSC and normal lung tissues. Cox regression analysis, random survival forest, and least absolute shrinkage and selection operator algorithms established a three-gene signature. Kaplan–Meier survival and receiver-operating characteristic curves assessed the prognostic efficacy of the model. Single-sample gene set enrichment analysis (ssGSEA) assessed the relationship between pyroptosis and immune cells. Patients with early stage LUSC from the GSE74777 dataset were used for validation. Pyroptosis-related genes were verified by RT-qPCR and Western blotting.
Results: Twenty-three differentially expressed pyroptosis-related genes were identified in the LUSC and adjacent normal tissues. Three differentially expressed pyroptosis-related genes were identified as hub genes in early stage LUSC. Patients with early stage LUSC in the TCGA cohort were classified into low- and high-risk subgroups according to the risk score. Overall survival (OS) was significantly short in the high-risk subgroup versus the low-risk subgroup. A similar result was found for the GSE74777 dataset. ssGSEA of immune cells and immune-related pathways between the low- and high-risk subgroups may explain the different OS for patients with early-stage LUSC. IL-6 expression was upregulated, which was inconsistent with the bioinformatic analysis. NOD1 and CASP4 were downregulated in LUSC (all P < 0.05) versus normal lung tissues.
Conclusion: Differentially expressed pyroptosis-related genes may be involved in early stage LUSC. Pyroptosis-related genes are important in tumor immunity and may be potential prognostic predictors for early stage LUSC.
Keywords: early-stage lung squamous cell carcinoma, pyroptosis, prognosis, tumor microenvironment, immunotherapy
Introduction
Lung carcinoma is a common malignancy associated with a high incidence and mortality rate; in 2018, around 2.1 million new cases and 1.7 million deaths due to lung carcinoma were reported worldwide by the International Agency for Research on Cancer (IARC).1 Non-small-cell lung carcinoma (NSCLC) accounts for more than 80% of all lung carcinomas, among which lung squamous cell carcinoma (LUSC) is a frequently occurring pathological type, accounting for approximately 30% of NSCLC cases. The morbidity and mortality rates associated with LUSC have gradually increased. Lung carcinomas usually have an occult onset, as typical clinical manifestations are lacking in the early stage. Despite advances in the diagnosis and treatment of lung carcinomas, the 5-year survival rate is less than 18%.2 Studies have shown that LUSC develops through a multistep process, during which mutations accumulate in a stepwise fashion, eventually resulting in carcinoma. Since most patients with LUSC are diagnosed at an advanced stage, prognostic predictions are challenging. Furthermore, the lack of a comprehensive, individualized treatment plan contributes to the high mortality rate. Therefore, there is a need to identify novel gene signatures for early prognostic predictions, which may have implications for novel therapeutic targets in the treatment of LUSC.
Evidence suggests that pyroptosis can regulate tumor growth and metastasis, which may have implications for potential treatment targets and prognostic predictors.3 Cell pyroptosis is a type of programmed cell death mediated by members of the gasdermin (GSDM) protein family and regulated by caspase-1, −4, −5, and −11. It is characterized by swelling of the cell, plasma membrane perforation, and efflux of small inflammatory molecules.4–7 This process often leads to activation of the inflammatory cysteine-aspartic protease. Cells undergoing pyroptosis present nuclear agglutination, annexin V-positivity in situ, cytoskeleton degradation, and oligomeric protein pores on the membrane (1–2 nm). The plasma membrane gradually breaks down, leading to the efflux of intracellular proinflammatory small molecules and consequently, a strong inflammatory reaction.8 A role for pyroptosis in infection resistance has been reported. However, the mechanisms of pyroptosis may underlie tumor development. Key components of pyroptosis include the GSDM protein family, inflammatory vesicles, and proinflammatory cytokines that contribute to tumorigenesis, invasion, and metastasis.3 Using transgenic mice, Dupaul-Chicoine et al showed that depletion of genes associated with inflammatory vesicles, such as NLRP3 and CASP1, increased the susceptibility of mice to colon cancer compared to wild-type mice.9 In addition, knocking out the pyroptosis-related gene, Apoptosis-associated speck-like protein has been shown to enhance the expression of B-cell lymphoma 2 (Bcl-2) protein and proto-oncogene tyrosine-protein kinase Src in A549 cells, thus promoting the proliferation, migration, and invasion of tumors.10 Additionally, unlike apoptosis, pyroptosis is often accompanied by the activation and release of harmful signaling molecules and cytokines, activating the immune system and inducing a strong inflammatory response.7 Studies have also shown that the pro-inflammatory effect of pyroptosis can regulate the tumor immune microenvironment.11 Defective expression of gasdermin D (GSDMD) correlates with a significant reduction in the number of CD8+ lymphocytes and suppression of their activity.12 Pyroptosis is dependent on inflammatory GSDMD and subsequent pore formation in plasma membranes through which IL-18 is released from cells.13 IL-18 promotes the proliferation of natural killer (NK) cells, leading to increased expression of CD80 and CD86, human leukocyte antigen-DQ (HLA-DQ), and human leukocyte antigen-DR (HLA-DR) in NK cells. Thus, NK cells acquire an antigen-presenting cell (APC)-like phenotype, thereby exerting an anti-cancer effect.14
Several studies on pyroptosis and the early diagnosis of LUSC indicate a potential role in tumorigenesis. However, the specific functions of pyroptosis-related genes in early stage LUSC have not been extensively studied. Here, we systematically determined and compared the expression of genes associated with pyroptosis in normal lung and lung squamous cell carcinoma tissues. We evaluated the predictive value of these pyroptosis-related genes for the prognosis of patients with LUSC and studied their effects on the tumor immune microenvironment.
Patients and Methods
Dataset
We obtained RNA sequencing data and clinical features for 401 patients with early stage LUSC (stage I–II) and 49 normal adjacent tissues from The Cancer Genome Atlas (TCGA) database (https://portal.gdc.cancer.gov/). For external validation, RNA sequencing data and clinical information for patients with LUSC were obtained from GSE74777 (https://www.ncbi.nlm.nih.gov/geo/, accessed on July 8, 2021).15 GSE74777 contained 107 patients with early-stage LUSC (stage I–II).
Identification of Pyroptosis-Related Differentially Expressed Genes
Thirty-three pyroptosis-related genes were identified based on previous studies (Table S1).16–19 We considered normalized fragment per kilobase million (FPKM) data for LUSC-TCGA. The “limma” package identified differentially expressed genes (DEGs) with a set threshold cutoff of P < 0.05. The network for the protein-protein interaction (PPI) of DEGs was constructed using ‘Search Tool for the Retrieval of Interacting Genes’ (STRING) version 11.0.
Establishment and External Validation of a Pyroptosis-Related Gene Prognostic Model
To assess the predictive value of genes associated with pyroptosis for the prognosis of LUSC, Cox regression was used to estimate the individual association of these genes with the survival status of patients included in the TCGA dataset. To avoid omissions, the P-value cutoff was set at 0.2. Six survival genes related to pyroptosis were identified for further analysis. The “randomForestSRC” package was used to establish a stable prognostic score system for pyroptosis-related genes. This random survival forest algorithm reduced the size of the signature, and genes were selected according to their variable importance (VIMP) and minimum depth. Only genes with a VIMP > 0.01 were selected along with their corresponding minimum depths.20 The least absolute shrinkage and selection operator (LASSO) Cox regression model (R package “glmnet”) narrowed the range of candidate genes, and we established a prognostic model. In the LASSO model, the minimum criterion (λ) was selected based on 10 cross validations. Finally, three pyroptosis-related genes and their coefficients were prioritized. The TCGA expression data were centrally standardized (using the “scale” function in R software) using the penalty parameter (λ) based on a minimum criterion. The risk score calculation was as follows:

where, X is the correlation coefficient and Y is the gene expression level. The LUSC-TCGA samples were classified into two groups according to the median risk score: low- and high-risk subgroups, and Kaplan–Meier analysis was performed to compare the overall survival (OS) time in each group. Principal component analysis (PCA) using the “prcomp” function of three gene signatures was performed using the “stats” R package; the 3-year receiver operating characteristic (ROC) curve was evaluated using t-distribution random neighbor embedding (t-SNE) with “t-SNE,” “survminer” and “timeROC” packages in R. To validate the model, a LUSC cohort from the Gene Expression Omnibus database (GSE74777) was used as the external cohort. The expression of individual genes related to pyroptosis was normalized by the “scale” function. A risk analysis was performed using the same formula as used for the TCGA cohort. The GSE74777 cohort was also classified into low- and high-risk groups using the same formula as for the TCGA cohort risk analysis. The gene model was validated by comparing the two risk groups.
Independent Analysis of Prognostic Risk Score
Clinical information on age, sex, and stage was obtained for the TCGA cohort. Based on our regression model, these parameters were analyzed in conjunction with the risk score. Univariate and multivariate Cox regression analyses were also performed.
Functional Enrichment of DEGs in Low- and High-Risk Groups
LUSC-TCGA samples were classified based on the median risk score as low- and high-risk groups. DEGs were identified as per the set threshold of |log2fold change|≥1 and false discovery rate (FDR) < 0.05. Annotations were subsequently performed by GeneOntology (GO) and Kyoto Encyclopedia of Genes and Genomes (KEGG) enrichment analyses using “clusterProfiler” package.
Immune Cells and Pyroptosis
Infiltration immune cell scores were calculated, and the activity of immune-related pathways was assessed using the Gene Set Variation Analysis (GSVA) software package for ssGSEA.
Experimental Verification
A cohort of 20 patients with early stage LUSC (stage I–II) who underwent surgical treatment at the First Affiliated Hospital of Chengdu Medical College were included in our study, which was conducted from January 2019 to January 2021. All patients were diagnosed based on pathological examination. All tissues were stored at −80°C until further analysis. Each case included a tumor sample and a matched normal tissue sample (5 cm from the cancer margin). Clinical data were collected for the 20 patients and included sex, age, differentiation, and tumor node metastasis (TNM) stage (Table 1). All procedures were performed according to the ethical standards of the institution and/or the National Research Council, and the Declaration of Helsinki, and were approved by the Ethics Committee of the First Affiliated Hospital of Chengdu Medical College (license number: 2020CYFYIRB-BA-101). All patients provided written informed consent for participation in the study.
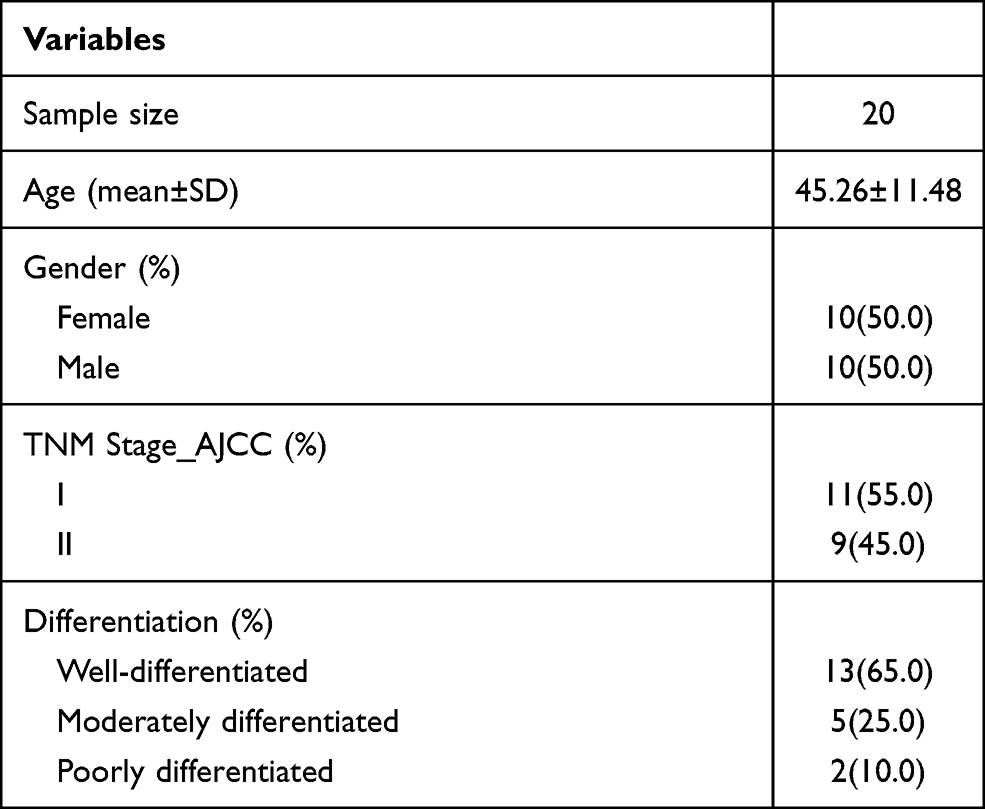 |
Table 1 Clinical Information of the Study Population |
Total RNA was extracted from LUSC specimens and adjacent normal tissues using RNAiso Plus (Takara, Dalian, China). Complementary DNA (cDNA) was synthesized using 1 μg of total RNA using the PrimeScript® RT reagent Kit with gDNA (genomic DNA) Eraser (Takara). RNA levels were determined using the CFX96 Real-time System (Bio-Rad, USA) with the TB Green® Premix Ex Taq® II kit (Takara). The relative expression of candidate genes related to pyroptosis was normalized to those of endogenous transcribed glyceraldehyde-3-phosphate dehydrogenase (GAPDH). The primers were synthesized by Shanghai Sangon Biology Company and are listed in Table S2.
Frozen LUSC tissues and adjacent normal tissues were placed into a tube and ground in cell lysis buffer containing protein inhibitors. After centrifugation, total protein from the tissues was contained in the supernatant. The protein concentration was assessed using a NanoDrop UV-vis spectrophotometer (Thermo Scientific, MD, USA). Equal amounts of protein samples were loaded on an 8% sodium dodecyl sulfate-polyacrylamide (SDS-PAGE) gel and separated by electrophoresis. The separated proteins were transferred to a polyvinylidene difluoride (PVDF) immobilon-P membrane (Millipore, Billerica, MA, USA). After blocking with 5% non-fat milk, the membrane was probed with primary antibodies in a cold room overnight, followed by incubation with secondary antibodies. The target protein bands were analyzed using the iBand western system (Thermo Fisher Scientific, MA, USA).
Each group of experiments was repeated 3 times. In this experiment, the following antibodies were used: anti-IL-6 (1:5000; Abcam, Cambridge, UK), anti-NOD1 (1:2000; Abcam, Cambridge, UK), anti- CASP4 (1:2000; Abcam, Cambridge, UK), and anti-β-actin (1:5000; Abcam).
Statistical Analysis
All statistical analyses were performed using R software (version 3.6.1). Differential gene expression in tumor and normal tissues was compared by Student’s t-test using “limma” R package. Univariate Cox regression, random survival forest, and LASSO algorithm analyses were used to evaluate the correlations between the factors and OS through the “survival,” “glmnet” and “randomForestSRC” package in R. A Log rank test was used to compare OS between the two risk groups. Kaplan–Meier curves depicted survival using the ”survival” package. The Mann–Whitney test, with P-values adjusted by the BH method, was applied to compare the ssGSEA scores of immune cells or pathways between the high- and low-risk groups using “limma,” “ggpubr” and “reshape2” package. Statistical significance was set at P < 0.05.
Results
Identification of Pyroptosis-Related Genes
The methods used for data collection and analysis of pyroptosis-related genes in LUSC are summarized in Figure 1. Thirty-three pyroptosis-related genes were obtained based on previous studies (Supplementary Table 1). To determine prognosis-specific pyroptosis-related genes for early stage LUSC, we systematically analyzed and compared RNA-seq data from the tissues of 401 patients with early stage LUSC and 49 normal adjacent tissues from TCGA. Using the condition of P < 0.05, we identified 23 differentially expressed pyroptosis-related genes. Nine genes (PLCG1, CASP6, PJVK, CASP3, GSDMB, GSDME, AIM2, NLRP7, and GSDMC) were upregulated, while 14 genes (IL6, ELANE, NLRC4, NLRP3, CASP5, NOD1, IL1B, CASP1, TNF, TIRAP, IL18, NLRP1, and PRKACA) were downregulated. The RNA expression levels of these genes are represented by the heatmaps shown in Figure 2A. To examine the associations between these pyroptosis-related genes, we performed a PPI analysis, as shown in Figure 2B. The minimum confidence for PPI was 0.9 (highest confidence cutoff in STRING). CASP1, AIM2, NLRP3, NLRC4, IL18, and IL1B were identified as hub genes. The correlation network of all differentially expressed pyroptosis-related genes is shown in Figure 2C (red: positive correlation; blue: negative correlation).
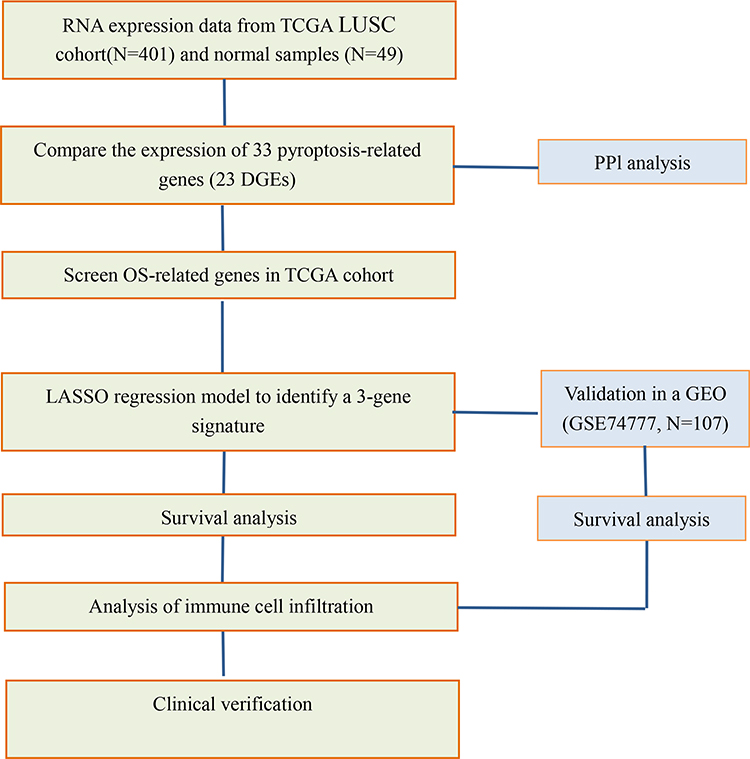 |
Figure 1 Data analysis workflow. |
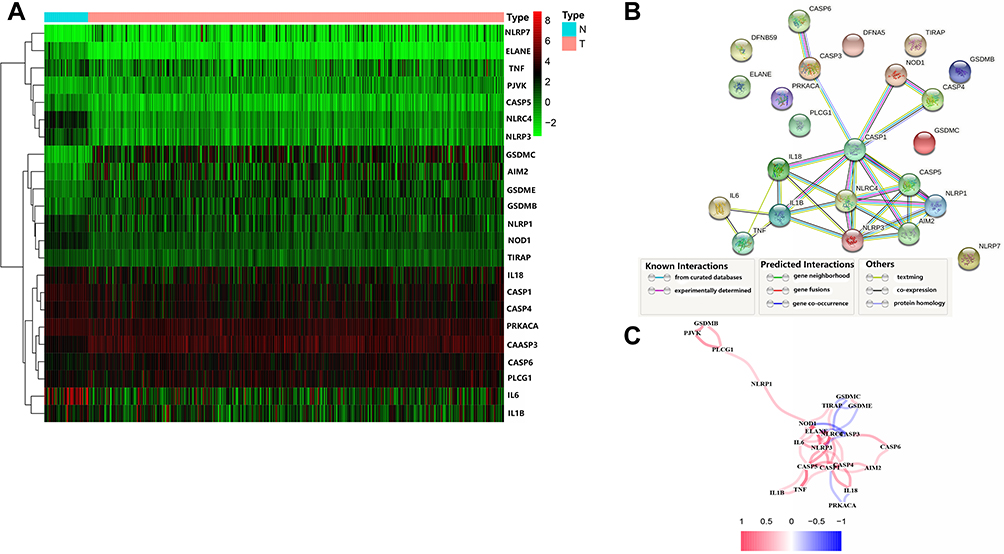 |
Figure 2 Expression and interaction of 23 pyroptosis-related genes. (A) Heat map showing the expression of pyroptosis-related genes between normal (N, blue) and tumor tissues (T, red) (green: low expression levels; red: high expression levels); (B) protein-protein interaction (PPI) network showing interactions for pyroptosis-related genes (interaction confidence 0.9); (C) network correlations for pyroptosis-related genes (red: positive correlation; blue: negative correlation; color depth reflects the intensity of the correlation). |
Prognostic Signature Model in the TCGA Cohort
Survival data related to the 401 samples corresponding to the respective LUSC patients were obtained. Univariate Cox regression analysis was performed for the primary screening of survival-related genes. Six genes (IL6, NOD1, NLRC4, ELANE, CASP4, and NLRP3) meeting the criterion of P < 0.2, were retained for further analysis. The hazard ratio values of all six genes were greater than one (Figure 3). The expression values of the six pyroptosis-related genes were used to construct a random forest model. To summarize model accuracy, we used the out-of-bag (OOB) error estimate, where a lower value indicates higher predictive accuracy. The results showed that the OOB error of the random forest model tended to be stable when trees were close to 420 (Figure 4A and B). Next, using the LASSO Cox regression, a three-gene signature model was constructed according to the optimum λ value (λ=0.018) (Figure 5A and B). The risk score was calculated as follows: risk score = (−0.070* IL6exp) + (0.373 × NOD1exp) + (0.176* CASP4exp). Based on the risk score formula and calculated median scores, 401 LUSC samples were categorized into low- and high-risk subgroups (Figure 6A). PCA and t-distributed stochastic neighbor embedding (t-SNE) analysis indicated that patients with different risks could be separated into two clusters (Figure 6B and C). In the high-risk subgroup, patients showed higher mortality and poorer survival compared with those in the low-risk subgroup (Figure 6D, on the right side of the dotted line). A significant difference in OS time was detected between the two groups (P = 0.013, Figure 6E). A ROC curve was applied to evaluate the sensitivity and specificity of the prognostic model. The area under the ROC curve (AUC) was 0.621 for 1 year, 0.598 for 2 years, and 0.637 for 3 years (Figure 6F).
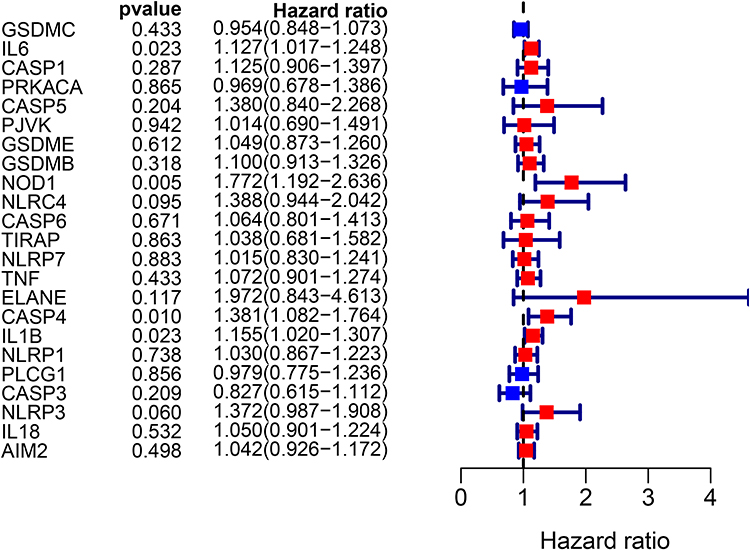 |
Figure 3 Univariate Cox regression analysis of overall survival (OS) for each pyroptosis-related gene, and six genes with P < 0.2. |
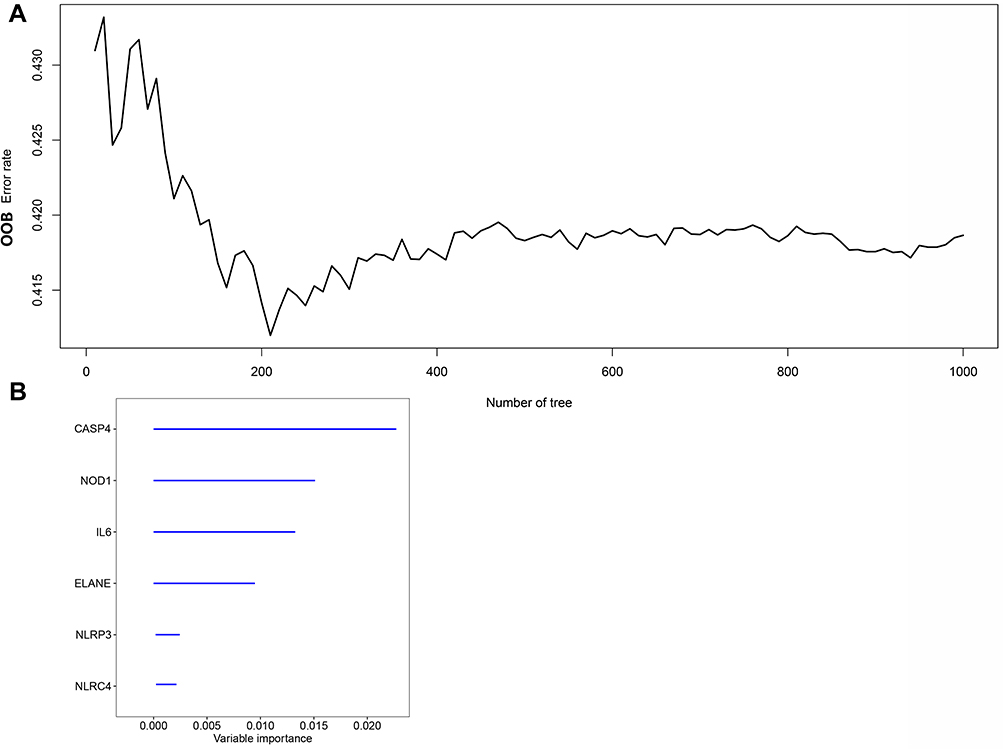 |
Figure 4 Random survival forest screening of the genes. (A) Estimate of random forest out-of-bag (OOB) prediction error rate based on tree number. (B) Genes with variable importance (VIMP) > 0.01. |
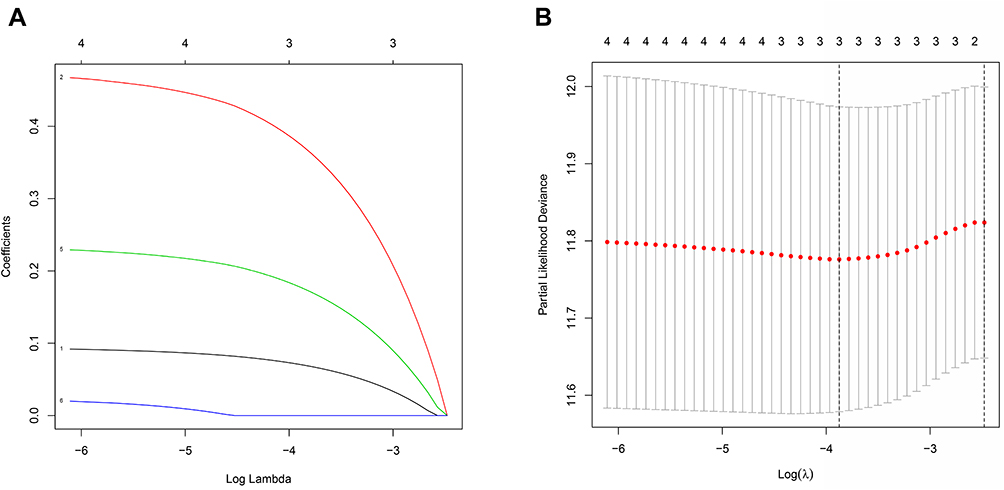 |
Figure 5 Construction of a risk signature using The Cancer Genome Atlas (TCGA) cohort. (A) The least absolute shrinkage and selection operator (LASSO) regression of three OS-related genes. (B) Cross-verification for tuning the parameter selection in the LASSO regression. |
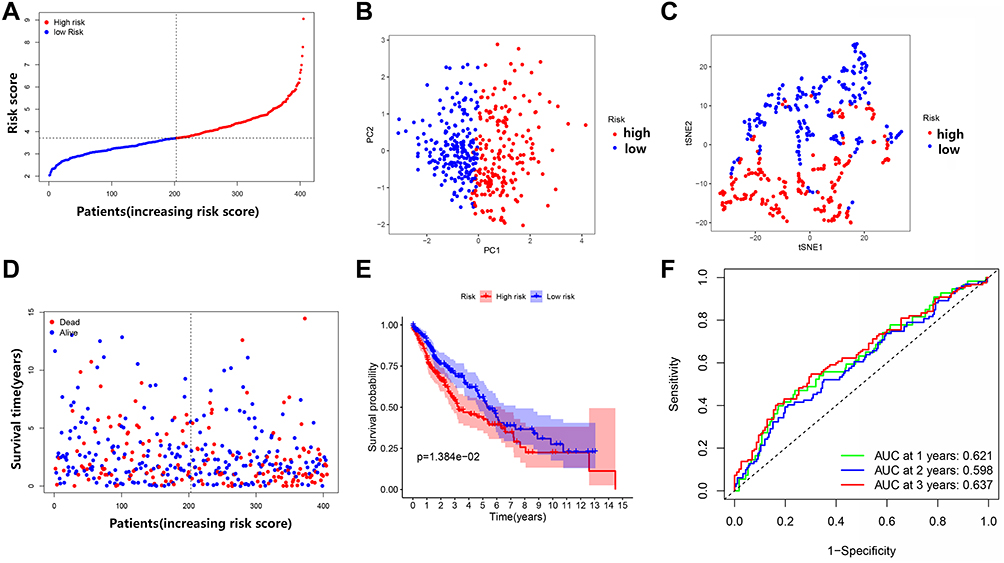 |
Figure 6 Comparison of high- and low-risk groups in the TCGA dataset. (A) Patient distribution based on the risk score. (B) Principal component analysis (PCA) plot for OCs based on the risk score. (C) t-SNE plot for OCs based on the risk score. (D) Survival status of each patient (low-risk group: on the left side of the dotted line; high-risk group: on the right side of the dotted line). (E) Kaplan–Meier curves for the OS of patients in the high- and low-risk groups. (F) Receiver operating characteristic (ROC) curves demonstrated the predictive efficiency of the risk score. |
External Validation of the Risk Signature
A total of 107 LUSC patients (stage I–II) from the Gene Expression Omnibus (GEO) cohort (GSE74777) were used as the validation set. The “scale” function was used to normalize the levels of gene expression for further analyses. According to the median risk scores, 54 patients in the GEO cohort were included in the high-risk subgroup, and the remaining 53 patients were included in the low-risk subgroup (Figure 7A). PCA and t-SNE showed satisfactory division between the two groups (Figure 7B and C). Patients in the low-risk subgroup had longer survival and lower mortality rates compared with those in the low-risk subgroup (Figure 6D, on the left side of the dotted line). The Kaplan–Meier analysis revealed no statistically significant differences in the survival rates between the low- and high-risk groups (Figure 7E). However, Figure 6E shows consistent prognostic trends with results from the TCGA cohort (P = 0.121, Figure 7E). ROC curve analysis of the GEO cohort showed that our model had excellent predictive power (AUC = 0.719 for, 1 year, AUC = 0.693 for 2 years, and AUC = 0.627 for 3 years) (Figure 7F).
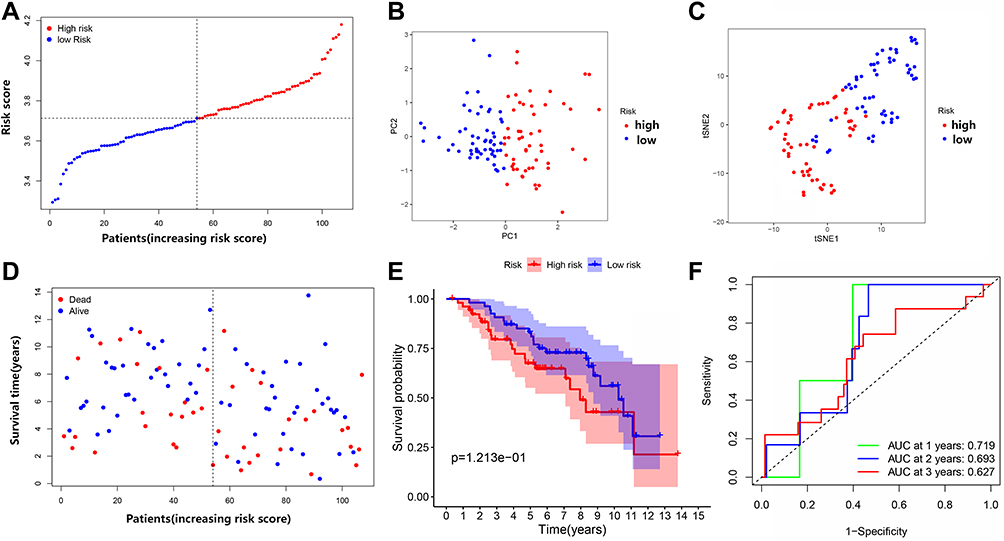 |
Figure 7 Comparison of high- and low-risk groups in the Gene Expression Omnibus (GEO) dataset. (A) The distribution of patients based on the risk score. (B) PCA plot for OCs based on the risk score. (C) t-SNE plot for OCs based on the risk score. (D) The survival status of each patient (low-risk group: on the left side of the dotted line; high-risk group: on the right side of the dotted line). (E) Kaplan–Meier curves for the OS of patients in the high- and low-risk groups. (F) ROC curves demonstrating the predictive efficiency of risk score. |
Independent Predictive Value of the Risk Model
Univariate and multivariate Cox regression analyses were used to assess whether the risk score derived from the pyroptosis-related gene signature model could serve as an independent prognostic factor. Univariate Cox regression analysis showed that the risk score was an independent predictor for poor survival in the TCGA cohort (HR = 1.364, 95% confidence interval [CI]: 1.178–1.577, Figure 8A). After adjusting for confounding factors, multivariate Cox regression analysis also showed that the risk score could be a prognostic factor (HR = 1.371, 95% CI: 1.184–1.587, Figure 8B). In addition, we generated a heatmap of clinical features for the TCGA cohort (Figure 8C) and observed that patient age, stage, and survival status were diversely distributed between the low-and high-risk groups (P < 0.05 for all).
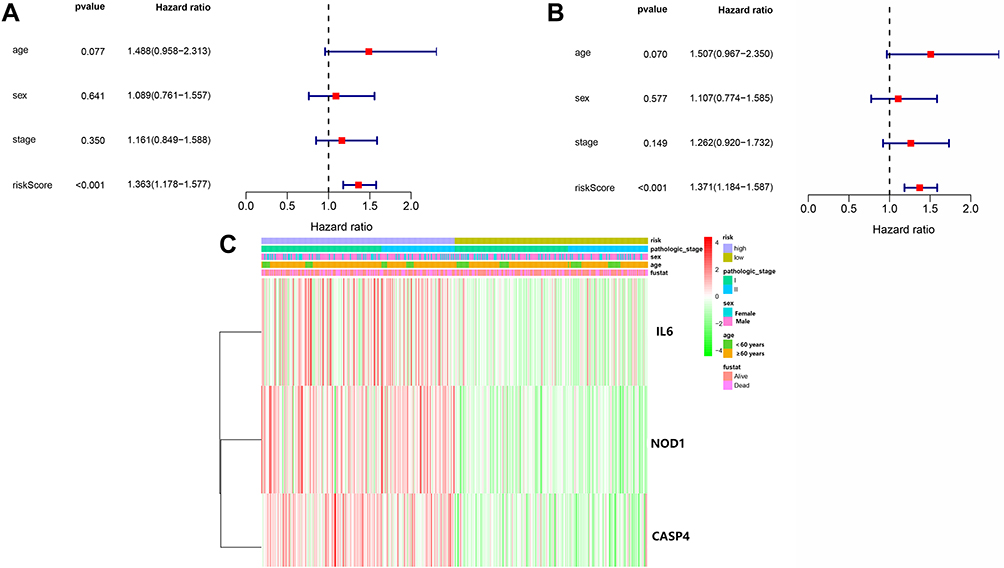 |
Figure 8 Univariate and multivariate Cox regression analyses for risk factors. (A) Univariate analysis of the LUSC-TCGA cohort. (B) Multivariate analysis in the LUSC-TCGA cohort. (C) Heatmap (green: low expression; red: high expression) for the connections between clinicopathologic features and risk groups. |
Functional Analysis Based on the Risk Model
To further examine differences in gene function and pathways between the subgroups categorized by the risk model, the “limma” package was used to extract DEGs by applying a cutoff criteria (FDR< 0.05, log2fold change | ≥1). A total of 450 DEGs were identified between the two subgroups in the TCGA cohort. Of these, 325 were downregulated in the high-risk group, while 125 were upregulated (Table S3). GO enrichment and KEGG pathway analyses were performed based on these DEGs. The results demonstrated that DEGs were mainly enriched in the inflammatory reaction, immune response, tyrosine metabolism, and arachidonic acid pathways (Figure 9A and B).
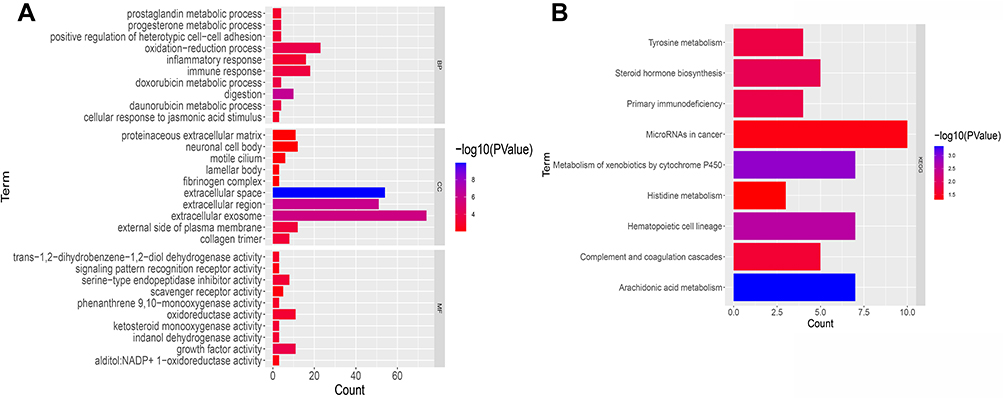 |
Figure 9 Functional analysis of differentially expressed genes (DEGs) in the two subgroups of the TCGA cohort. (A) Bar chart for GeneOntology (GO) enrichment (the longer the bar, the richer the gene enrichment, and the darker the red the greater the difference). (B) Bar chart for Kyoto Encyclopedia of Genes and Genomes (KEGG) pathways (the longer the bar means the more genes enriched, and darker the red the greater the difference). |
Comparison of Immune Activity Between Subgroups
Based on ssGSEA and functional analyses (Table S4), we compared the enrichment scores of 16 types of immune cells and the activity of 13 immune-related pathways between the low- and high-risk groups in both the TCGA and GEO cohorts. In the TCGA cohort (Figure 10A), the level of immune cell infiltration was lower in the high-risk subgroup, including CD8 + T cells, NK cells, neutrophils, tumor-infiltrating lymphocytes (TILs), and regulatory T cells (Treg). Except for the MHC class I pathway, the other 12 immune-associated pathways displayed lower activity in the high-risk group than in the low-risk group (Figure 10B). Similar findings were observed when immune status was evaluated in the GEO cohort. Moreover, dendritic cells (DCs), induced dendritic cells (iDCs), and macrophages were enriched. Nevertheless, no differences in inflammation-promoting pathways and MHC class I were found between the low- and high-risk groups (Figure 10C and D).
 |
Figure 10 Comparison of the single-sample gene set enrichment (ssGSEA) scores for immune cell types and immunological pathways. (A and B) Comparison of enrichment scores for 16 types of immune cells and 13 immune-related pathways between the low-risk group (blue box) and the high-risk group (red box) in the TCGA cohort. (C and D) Comparison of enrichment scores for 16 types of immune cells and 13 immune-related pathways between the low-risk group (blue box) and the high-risk group (red box) in the GEO cohort. P values were: NS: not significant; ***P < 0.001; **P < 0.01; *P < 0.05. |
Validation of Differentially Expressed Pyroptosis-Related Genes in Patients with Early-Stage LUSC
To confirm the reliability of the TCGA and GEO datasets, the expression levels of IL6, NOD1, and CASP4 in our clinical samples were evaluated by RT-PCR and Western blotting. The clinicopathological variables of the patients are summarized in Table 1. In our cohort, inconsistent with previous results of bioinformatic analyses, the expression levels of IL6 were significantly higher in early stage LUSC tissues than in normal lung tissues (Figures 11 and 12). Additionally, the expression levels of NOD1 and CASP4 were significantly decreased in tissues from early stage LUSC, similar to the results obtained by bioinformatic analysis (Figures 11 and 12).
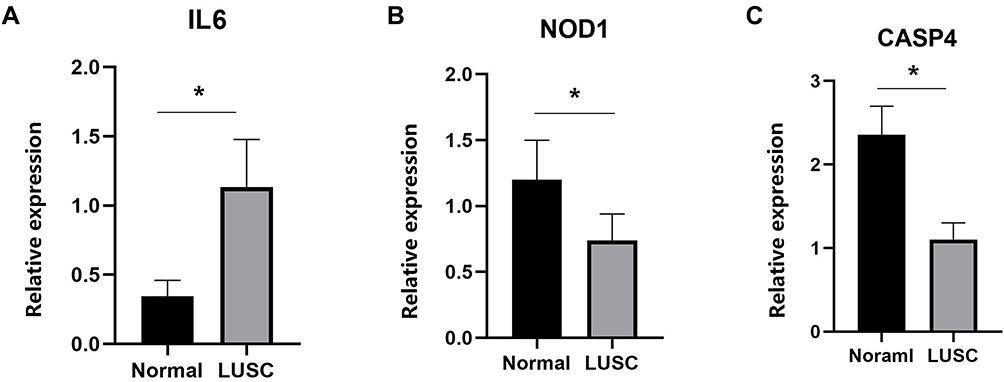 |
Figure 11 Relative mRNA expression of three pyroptosis-related genes in clinician-collected tissue samples. IL-6 (A) was highly expressed; NOD1 (B) and CASP4 (C) were expressed at significantly lower levels, *P < 0.05. |
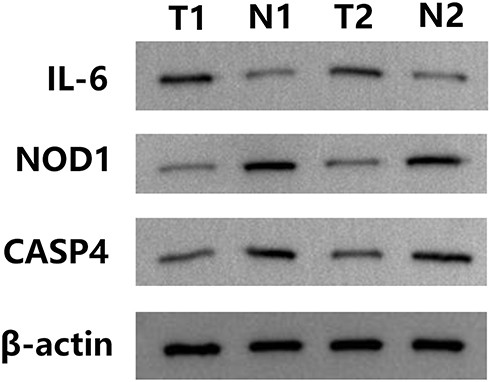 |
Figure 12 Relative protein expression of three pyroptosis-related genes in clinician-collected tissue. N1 and N2 represent non-tumor tissues, and T1 and T2 represent tumor tissues. |
Discussion
In the present study, we examined the mRNA expression of 33 previously identified genes related to pyroptosis in samples from LUSC and normal tissues and found that around two-thirds (69.7%; 23/33 patients) were differentially expressed between the two groups. To assess the prognostic predictive value of these pyroptosis-associated genes for LUSC, we established a three-gene (IL6, NOD1, and CASP4) signature risk model using univariate Cox, random survival forest, and LASSO Cox regression analyses, which was subsequently verified using an external dataset. Survival analysis suggested that these three genes had good prognostic value. According to this signature, patients in the TCGA and GEO cohorts were divided into high-and low-risk subgroups. Functional analysis showed that DEGs between the high-risk subgroup and the low-risk subgroup were associated with immunological pathways. In the high-risk subgroup, we found reduced infiltration of different immune cell types, and the activity of the immunological pathways had also decreased in comparison with the low-risk subgroup. The immune cell enrichment analysis indicated the pyroptosis had a close connection with tumor immunity. These findings strongly implied the great potential roles of pyroptosis in LUSC.
The increased use of low-dose computed tomography (CT) has enable patients to be diagnosed with lung cancer at an earlier stage. A better understanding of early stage lung cancer and the establishment of reliable prognosis-related gene signatures are important for treatment decisions. In recent years, pyroptosis, as a mechanism of programmed cell death, has gained attention as a potential target in cancer progression and treatment. Pyroptosis inhibits the growth of tumor cells, and may therefore represent a novel therapeutic target; however, the production of IL-1β, IL-18, and other inflammatory factors during pyroptosis forms a inflammatory tumor microenvironment, which promotes tumor growth.16,17 Therefore, an early stage prediction model for LUSC based on pyroptosis-related genes is important. The interaction between pyroptosis-related genes and their association with LUSC survival outcomes remains unclear. Our study identified three pyroptosis-related genes (IL-6, NOD1, and CASP4). Survival analysis and prognostic ROC models were developed based on three genes (IL-6, NOD1, and CASP4). In addition, our prognostic model was validated using GEO data, which yielded consistent, stable, and universal results.
Among the three genes, IL-6 was identified as an independent risk factor for OS in patients with early stage LUSC in our study. IL-6 is a pleiotropic cytokine produced by epithelial cells, fibroblasts, mononuclear macrophages, T lymphocytes, and B lymphocytes, which plays a major immunomodulatory role in the tumor microenvironment. After binding to its receptor to form IL-6/IL-6R/gp130 hexamers, it activates the JAK-STAT signal transduction pathway and regulates several biological and cellular processes, including cell proliferation, differentiation, immune defense mechanisms, and blood cell production. IL-6 expression has been associated with the occurrence and progression of several tumors. In addition, it regulates cell adhesion and activity, angiogenesis, expression of tumor-specific antigens, proliferation of tumor cells, and chemical resistance, which impact tumor progression. Dalwadi et al21 showed that IL-6 expression was reduced following the treatment of LUSC cells with COX-2 siRNA, confirming that COX-2 mediates anti-apoptotic and anti-angiogenic effects through activation of signal transduction molecule STAT3, and the expression of inhibitor of apoptosis, survivin. The serum levels of IL-6 in 339 patients with non-small-cell lung carcinoma were reported by Yamaguchi et al,22 who found that patients with higher levels of IL-6 tended to have advanced LUSC and large cell lung carcinoma, suggesting that IL-6 levels in serum differed among histopathologic types. It is reasonable to hypothesize that abnormal expression of IL-6 may promote the development of tumors by regulating pyroptosis. In the present study, IL-6 was highly expressed in clinical samples of LUSC; however, bioinformatic analyses indicated that IL-6 was down-regulated as compared to normal lung tissues in TCGA database. This may be due to the limited data from LUSC. Furthermore, the TCGA database contains data from mainly Caucasian and African populations. Thus, our findings on IL-6 need to be validated using a larger sample size and a more representative population.
NOD1 is a cytoplasmic protein involved in innate immunity. It is a pattern recognition receptor, which is highly genetically conserved, and is closely related to inflammation and cell death. NOD1 recognizes peptidoglycan and lipopolysaccharide in the cell wall, and subsequently activates downstream MAPK and NF-κB signaling to regulate the physiological and pathological processes of inflammation, oxidative stress, and cell proliferation.23–25 NOD1 binds to tumor necrosis factor and participates in intercellular signal transduction and cell pyroptosis. It activates NF-κB-inducing kinases through phosphorylation, and regulates the interaction of the apoptotic signaling enzyme, transforming growth factor-β, to inhibit caspase activation, furthermore, NF-κB granule release in the chelated cytoplasm can induce cell pyroptosis based on the interaction between protein kinases. The results of our bioinformatic analysis and clinical validation are consistent with those of previous studies, suggesting that NOD1 may be a tumor suppressor gene in lung carcinoma (HR<1). NOD1-knockout mice have been shown to demonstrate increased sensitivity to the occurrence of inflammation-induced colon tumors.26 The serum levels of NOD1, NF-κB, and R1P2 were higher and increased in cancer tissues after chemotherapy with pemetrexed combined with oxaliplatin. This suggested that the NOD1/NF-Κb/R1P2 downstream signaling cascade may regulate the proliferation and differentiation of lung carcinomas.27
CASP4 belongs to the caspase family of proteins. Multiple internal and external factors, including the efflux of pro-inflammatory cytokines and the induction of innate immune responses, activate CASP4.28 CASP1 and CASP4/5 are involved in human cell pyroptosis. CASP1 is involved in the classical inflammasome pathway, and CASP4/5 is involved in the non-classical inflammasome pathway. Overexpression of CASP4 in keratinocytes and epithelial cells induces cell death.29,30 CASP4 mediates GSDMD activity and pyroptosis, and activates the NLRP3 inflammasome However, the relationship between CASP4-mediated pyroptosis and the development of lung cancer remains unclear. We found that higher CASP4 expression was associated with poorer survival outcomes, probably due to the negative regulation of pyroptosis by CASP4.31
In the present study, we identified similarities and shared mechanisms between pyroptosis and apoptosis. However, further studies on pyroptosis are required. Multiple patterns of cell death may co-exist and interact to affect tumor development.32 For example, the three genes in our model may be important regulators of the apoptotic pathway. Apoptosis is characterized by the integrity of the cell membrane, the contents of which are not released, and do not directly induce an inflammatory response. However, pyroptosis exhibits contrasting characteristics.33 By comparing the low- and high-risk subgroups, we found that the DEGs were primarily involved in inflammation and the immune response, suggesting that pyroptosis can induce a strong inflammatory response. Based on the results of GO and KEGG pathway analyses, we speculated that pyroptosis may modulate the composition of the tumor immune microenvironment.
The results of the ssGSEA analysis indicated that the levels of key anti-tumor immune cell infiltrates were lower in the high-risk subgroup in the LUSC-TCGA cohort, indicating that immune function in this subgroup was impaired; similar trends were observed in the GEO cohort. Notably, the proportion of Treg cells was higher in the low-risk group than in the high-risk group. However, previous studies have shown that Treg cells are involved in the suppression of anti-tumor immunity and are associated with poor clinical outcomes.34,35 The difference in our study may be because Tregs are an essential component of the tumor microenvironment, which regulates pyroptosis-stimulated hyperactive inflammation. In addition, two Treg subtypes have been reported in colon cancer, with opposing effects in regulating the tumor microenvironment.36 Therefore, further studies are required to identify Treg subtypes in LUSC. In our study, except for MHC class I, other immune-related pathways were downregulated in the high-risk subgroups from both the TCGA and GEO cohorts. Thus, patients with LUSC in the high-risk subgroup presented poorer survival, which may be attributed to reduced anti-tumor immunity.
One strength of this study is that we performed a systematic analysis based on a national database, and summarized current knowledge on pyroptosis genes in early stage LUSC. Our study provides a preliminary evaluation of the prognostic value of these pyroptosis-associated genes, forming a theoretical basis for future studies. Accurate and effective prognostic assessments form a clinical signature for the individualized treatment of patients with LUSC.
There were some limitations to this study. First, the clinical information downloaded from TCGA and GEO was incomplete, especially regarding therapy, which would help to understand if pyroptosis-related genes are potential therapeutic biomarkers. Second, the mechanism by which pyroptosis modulates early stage LUSC remains unclear. Finally, prognostic models need to be verified in a large-scale multicenter clinical cohort. This study provides a comprehensive overview of PRGs profiles in early stage LUSC, and the aforementioned limitations may be overcome if sufficient data are available in the future.
Conclusion
In conclusion, we identified differentially expressed genes related to pyroptosis, which may be involved in early stage LUSC. A novel prognostic model of three pyroptosis-related genes was constructed in this study, which was then independently associated with OS in both the TCGA and GSE74777 cohorts, providing a candidate model for predicting the survival of patients with early stage LUSC. Our study may provide insights into the identification of therapeutic targets. Further studies are necessary to verify these results.
Data Acquisition
Data can be retrieved from the TCGA and GEO databases (GEO database https://www.ncbi.nlm.nih.gov/GEO/query/acc.cgi?acc=gse74777, TCGA database https://portal.gdc.cancer.gov/). The codes used in this study can be obtained from the corresponding author upon reasonable request.
Author Contributions
J. H. contributed the study concept and design, revised the manuscript, and approved the final version. XY. L analyzed the data, interpreted the results, and wrote the manuscript. All authors contributed to data analysis, drafting or revising the article, gave final approval of the version to be published, agreed to the submitted journal, and agree to be accountable for all aspects of the work.
Funding
There is no funding to report.
Disclosure
All authors have no competing financial interests to disclose.
References
1. Bray F, Ferlay J, Soerjomataram I, et al. Global cancer statistics 2018: GLOBOCAN estimates of incidence and mortality worldwide for 36 cancers in 185 countries. CA Cancer J Clin. 2018;68(6):394–424. doi:10.3322/caac.21492
2. Chien CM, Yang JC, Wu PH, et al. Phytochemical naphtho[1,2-b] furan-4,5-dione induced topoisomerase II-mediated DNA damage response in human non-small-cell lung cancer. Phytomedicine. 2019;54:109–119. doi:10.1016/j.phymed.2018.06.025
3. Fang Y, Tian S, Pan Y, et al. Pyroptosis: a new frontier in cancer. Biomed Pharmacother. 2020;121:109595. doi:10.1016/j.biopha.2019.109595
4. Shi J, Gao W, Shao F. Pyroptosis: gasdermin-mediated programmed necrotic cell death. Trends Biochem Sci. 2017;42(4):245–254. doi:10.1016/j.tibs.2016.10.004
5. Liu X, Zhang Z, Ruan J, et al. Inflammasome-activated gasdermin D causes pyroptosis by forming membrane pores. Nature. 2016;535(7610):153–158. doi:10.1038/nature18629
6. Kovacs SB, Miao EA. Gasdermins: effectors of pyroptosis. Trends Cell Biol. 2017;27(9):673–684. doi:10.1016/j.tcb.2017.05.005
7. Wang Y, Gao W, Shi X, et al. Chemotherapy drugs induce pyroptosis through caspase-3 cleavage of a gasdermin. Nature. 2017;547(7661):99–103. doi:10.1038/nature22393
8. Galluzzi L, Vitale I, Abrams JM, et al. Molecular definitions of cell death subroutines: recommendations of the nomenclature committee on cell death 2012. Cell Death Differ. 2012;19(1):107–120. doi:10.1038/cdd.2011.96
9. Dupaul-Chicoine J, Yeretssian G, Doiron K, et al. Control of intestinal homeostasis, colitis, and colitis-associated colorectal cancer by the inflammatory caspases. Immunity. 2010;32(3):367–378. doi:10.1016/j.immuni.2010.02.012
10. Sakaizawa T, Matsumura T, Fujii C, et al. Potential role of ASC, a proapoptotic protein, for determining the cisplatin susceptibility of lung cancer cells. Tohoku J Exp Med. 2018;244(2):133–144. doi:10.1620/tjem.244.133
11. Tang R, Xu J, Zhang B, et al. Ferroptosis, necroptosis, and pyroptosis in anticancer immunity. J Hematol Oncol. 2020;13(1):110.
12. Zhang D, Xiao Y, Luo J, et al. Measurement of fractional exhaled nitric oxide and nasal nitric oxide in male patients with obstructive sleep apnea. Sleep Breath. 2019;23(3):785–793. doi:10.1007/s11325-018-1760-1
13. Aki T, Funakoshi T, Noritake K, Unuma K, Uemura K. Extracellular glucose is crucially involved in the fate decision of LPS-stimulated RAW264.7 murine macrophage cells. Sci Rep. 2020;10(1):10581. doi:10.1038/s41598-020-67396-6
14. Senju H, Kumagai A, Nakamura Y, et al. Effect of IL-18 on the expansion and phenotype of human natural killer cells: application to cancer immunotherapy. Int J Biol Sci. 2018;14(3):331–340. doi:10.7150/ijbs.22809
15. Noro R, Ishigame T, Walsh N, et al. A two-gene prognostic classifier for early-stage lung squamous cell carcinoma in multiple large-scale and geographically diverse cohorts. J Thorac Oncol. 2017;12(1):65–76. doi:10.1016/j.jtho.2016.08.141
16. Karki R, Kanneganti TD. Diverging inflammasome signals in tumorigenesis and potential targeting. Nat Rev Cancer. 2019;19(4):197–214. doi:10.1038/s41568-019-0123-y
17. Xia X, Wang X, Cheng Z, et al. The role of pyroptosis in cancer: pro-cancer or pro-”host”? Cell Death Dis. 2019;10(9):650. doi:10.1038/s41419-019-1883-8
18. Wang B, Yin Q. AIM2 inflammasome activation and regulation: a structural perspective. J Struct Biol. 2017;200(3):279–282. doi:10.1016/j.jsb.2017.08.001
19. Man SM, Kanneganti TD. Regulation of inflammasome activation. Immunol Rev. 2015;265(1):6–21. doi:10.1111/imr.12296
20. Ishwaran H, Gerds TA, Kogalur UB, et al. Random survival forests for competing risks. Biostatistics. 2014;15(4):757–773. doi:10.1093/biostatistics/kxu010
21. Dalwadi H, Krysan K, Heuze-Vourc’h N, et al. Cyclooxygenase-2-dependent activation of signal transducer and activator of transcription 3 by interleukin-6 in non-small cell lung cancer. Clin Cancer Res. 2005;11(21):7674–7682. doi:10.1158/1078-0432.CCR-05-1205
22. Yamaguchi T, Yamamoto Y, Yokota S, et al. Involvement of interleukin-6 in the elevation of plasma fibrinogen levels in lung cancer patients. Jpn J Clin Oncol. 1998;28(12):740–744. doi:10.1093/jjco/28.12.740
23. Velloso FJ, Campos AR, Sogayar MC, Correa RG. Proteome profiling of triple negative breast cancer cells overexpressing NOD1 and NOD2 receptors unveils molecular signatures of malignant cell proliferation. BMC Genomics. 2019;20(1):152. doi:10.1186/s12864-019-5523-6
24. Guo XX, Li XP, Zhou P, et al. Evodiamine induces apoptosis in SMMC-7721 and HepG2 cells by suppressing NOD1 signal pathway. Int J Mol Sci. 2018;19(11):3419. doi:10.3390/ijms19113419
25. Wang S, Yang J, Li X, et al. Discovery of 1,4-Benzodiazepine-2,5-dione (BZD) derivatives as dual nucleotide binding oligomerization domain containing 1/2 (NOD1/NOD2) antagonists sensitizing paclitaxel (PTX) to suppress Lewis Lung Carcinoma (LLC) growth in vivo. J Med Chem. 2017;60(12):5162–5192. doi:10.1021/acs.jmedchem.7b00608
26. Liu R, Truax AD, Chen L, et al. Expression profile of innate immune receptors, NLRs and AIM2, in human colorectal cancer: correlation with cancer stages and inflammasome components. Oncotarget. 2015;6(32):33456–33469. doi:10.18632/oncotarget.5587
27. Wang Y. Mechanism of pemetrexed combined with oxaliplatin in regulating NOD1/NF-Kb/R1P2 signlingin lung cancer. China J Modern Med. 2019;29(19):53–57.
28. Lin XY, Choi MS, Porter AG. Expression analysis of the human caspase-1 subfamily reveals specific regulation of the CASP5 gene by lipopolysaccharide and interferon-gamma. J Biol Chem. 2000;275(51):39920–39926. doi:10.1074/jbc.M007255200
29. Shi J, Zhao Y, Wang Y, et al. Inflammatory caspases are innate immune receptors for intracellular LPS. Nature. 2014;514(7521):187–192. doi:10.1038/nature13683
30. Raymond AA, Mechin MC, Nachat R, et al. Nine procaspases are expressed in normal human epidermis, but only caspase-14 is fully processed. Br J Dermatol. 2007;156(3):420–427. doi:10.1111/j.1365-2133.2006.07656.x
31. Lagrange B, Benaoudia S, Wallet P, et al. Human caspase-4 detects tetra-acylated LPS and cytosolic Francisella and functions differently from murine caspase-11. Nat Commun. 2018;9(1):242. doi:10.1038/s41467-017-02682-y
32. Sonnenschein C, Soto AM. The death of the cancer cell. Cancer Res. 2011;71(13):4334–4337. doi:10.1158/0008-5472.CAN-11-0639
33. He C, Yang J, Jiang X, et al. Kaempferol alleviates LPS-ATP mediated inflammatory injury in splenic lymphocytes via regulation of the pyroptosis pathway in mice. Immunopharmacol Immunotoxicol. 2019;41(5):538–548. doi:10.1080/08923973.2019.1666405
34. Wolf D, Wolf AM, Rumpold H, et al. The expression of the regulatory T cell-specific forkhead box transcription factor FoxP3 is associated with poor prognosis in ovarian cancer. Clin Cancer Res. 2005;11(23):8326–8331. doi:10.1158/1078-0432.CCR-05-1244
35. Toker A, Nguyen LT, Stone SC, et al. Regulatory T cells in ovarian cancer are characterized by a highly activated phenotype distinct from that in melanoma. Clin Cancer Res. 2018;24(22):5685–5696. doi:10.1158/1078-0432.CCR-18-0554
36. Saito T, Nishikawa H, Wada H, et al. Two FOXP3(+)CD4(+) T cell subpopulations distinctly control the prognosis of colorectal cancers. Nat Med. 2016;22(6):679–684. doi:10.1038/nm.4086
 © 2021 The Author(s). This work is published and licensed by Dove Medical Press Limited. The full terms of this license are available at https://www.dovepress.com/terms.php and incorporate the Creative Commons Attribution - Non Commercial (unported, v3.0) License.
By accessing the work you hereby accept the Terms. Non-commercial uses of the work are permitted without any further permission from Dove Medical Press Limited, provided the work is properly attributed. For permission for commercial use of this work, please see paragraphs 4.2 and 5 of our Terms.
© 2021 The Author(s). This work is published and licensed by Dove Medical Press Limited. The full terms of this license are available at https://www.dovepress.com/terms.php and incorporate the Creative Commons Attribution - Non Commercial (unported, v3.0) License.
By accessing the work you hereby accept the Terms. Non-commercial uses of the work are permitted without any further permission from Dove Medical Press Limited, provided the work is properly attributed. For permission for commercial use of this work, please see paragraphs 4.2 and 5 of our Terms.