Back to Journals » Journal of Inflammation Research » Volume 16
A Novel Prognostic Model Predicts Outcomes in Non-Metastatic Nasopharyngeal Carcinoma Based on Inflammation, Nutrition, and Coagulation Signature
Authors Chen LZ ![]() , Li HS, Han GW, Su Y, Lu TZ
, Li HS, Han GW, Su Y, Lu TZ ![]() , Xie HH, Gong XC, Li JG
, Xie HH, Gong XC, Li JG ![]() , Xiao Y
, Xiao Y
Received 29 July 2023
Accepted for publication 7 November 2023
Published 22 November 2023 Volume 2023:16 Pages 5515—5529
DOI https://doi.org/10.2147/JIR.S423928
Checked for plagiarism Yes
Review by Single anonymous peer review
Peer reviewer comments 5
Editor who approved publication: Professor Ning Quan
Li-Zhi Chen,1,2,* Han-Shu Li,1,2,* Gao-Wei Han,1,2,* Yong Su,1,3 Tian-Zhu Lu,1– 3 Hong-Hui Xie,1,3 Xiao-Chang Gong,1,3 Jin-Gao Li,1,3 Yun Xiao1,3
1NHC Key Laboratory of Personalized Diagnosis and Treatment of Nasopharyngeal Carcinoma, Jiangxi Clinical Research Center for Cancer, Jiangxi Cancer Hospital, The Second Affiliated Hospital of Nanchang Medical College, Nanchang, Jiangxi, 330029, People’s Republic of China, Nanchang, Jiangxi, 330029, People’s Republic of China; 2Jiangxi Medical College, Nanchang University, Nanchang, Jiangxi, 330029, People’s Republic of China; 3Department of Radiation Oncology, Jiangxi Clinical Research Center for Cancer, Jiangxi Cancer Hospital, The Second Affiliated Hospital of Nanchang Medical College, Nanchang, Jiangxi, 330029, People’s Republic of China
*These authors contributed equally to this work
Correspondence: Jin-Gao Li; Yun Xiao, Department of Radiation Oncology, Jiangxi Clinical Research Center for Cancer, Jiangxi Cancer Hospital, The Second Affiliated Hospital of Nanchang Medical College, 519 East Beijing Road, Nanchang, Jiangxi, 330029, People’s Republic of China, Tel +86-791-88313632, Fax +86-791-8321742, Email [email protected]; [email protected]
Purpose: This study aimed to assess the prognostic and predictive value of a circulating hematological signature (CHS) and to develop a CHS-based nomogram for predicting prognosis and guiding individualized chemotherapy in non-metastatic nasopharyngeal carcinoma (NPC) patients.
Patients and Methods: NPC patients were recruited between January 2014 and December 2017 at the Jiangxi Cancer Hospital. The CHS was constructed based on a series of hematological indicators. The nomogram was developed by CHS and clinical factors.
Results: A total of 779 patients were included. Three biomarkers were selected by least absolute shrinkage and selection operator regression, including prognostic nutritional index, albumin-to-fibrinogen ratio, and prealbumin-to-fibrinogen ratio, were used to construct the CHS. The patients in the low-CHS group had better 5-year DMFS and OS than those in the high-CHS group in the training (DMFS: 85.0% vs 56.6%, p< 0.001; OS: 90.3% vs 65.4%, p< 0.001) and validation cohorts (DMFS: 92.3% vs 43.6%, p< 0.001; OS: 92.1% vs 65.5%, p< 0.001). The nomogram_CHS showed better performance than clinical stage in predicting distant metastasis (concordance index: 0.728 vs 0.646). In the low-TRS (total risk scores) group, the patients received RT alone, CCRT and IC plus CCRT had similar 5-year DMFS and OS (p> 0.05). In the middle-TRS group, the patients received RT alone had worse 5-year DMFS (58.7% vs 80.8% vs 90.8%, p=0.002) and OS (75.0% vs 94.1% vs 95.0%, p=0.001) than those received CCRT or IC plus CCRT. In the high-TRS group, the patients received RT alone and CCRT had worse 5-year DMFS (18.6% vs 31.3% vs 81.5%, p< 0.001) and OS (26.9% vs 53.2% vs 88.8%, p< 0.001) than those received IC plus CCRT.
Conclusion: The developed nomogram_CHS had satisfactory prognostic accuracy in NPC patients and may individualize risk estimation to facilitate the identification of suitable IC candidates.
Keywords: nasopharyngeal carcinoma, circulating hematological signature, induction chemotherapy, distant metastasis-free survival, overall survival
Introduction
Nasopharyngeal carcinoma (NPC) is a malignant tumor derived from the nasopharyngeal mucosal epithelium, and there is an unbalanced ethnic and geographic distribution of NPC cases, with the highest incidence in South China and Southeast Asia.1 NPC cells are highly sensitive to irradiation, and accordingly, radiotherapy (RT) has become the mainstay treatment modality for non-metastatic NPC.2 With the combination of RT and chemotherapy, non-metastatic NPC has become a highly curable disease, with a 5-year overall survival (OS) rate of as high as 80%.1,2 Despite improvements in RT technology and the addition of chemotherapy, approximately 20–30% of patients experience distant metastases (DM), the leading cause of treatment failure.3
Currently, therapeutic strategies for NPC are mainly based on the 8th edition American Joint Committee on Cancer/Union for International Cancer Control Tumor, Node, Metastasis (TNM-8) staging system. Although the clinical stage identified by the TNM-8 staging system is currently the most widely used indicator for assessing the DM risk of NPC, patients with the same stage still have significant heterogeneity in DM and death risk.4 Thus, it is critical to identify reliable prognostic factors to complement the TNM-8 staging system and predict DM and death risk in patients with NPC.
Researchers have explored various strategies and methods to assess DM risk, including radiomics,5 proteomics,5,6 and genomics.7 Although these methods are effective in predicting DM risk, their promotion and application are limited by their high complexity and cost. For example, Epstein-Barr virus (EBV) DNA is a widely used NPC prognostic marker.8 However, the detection of EBV DNA is not satisfactory for each laboratory, and there is no consensus on the sample type, sample preparation protocol, or assay unit.
In recent years, with the deepening of research, people have found that the three systems of coagulation-malnutrition-inflammation are independent of each other and have complex interactions, and their dysfunction may lead to the occurrence of tumor. The chronic inflammatory response in the tumor microenvironment has a variety of functions to promote NPC occurrence and development, including promoting the proliferation of malignant cells, promoting angiogenesis and metastasis, destroying adaptive immune response, and reducing the sensitivity of radiotherapy and chemotherapy in NPC.9 In addition, chronic inflammation will lead to malnutrition, which will make patients unable to tolerate anti-tumor treatment, and will weaken the body’s repair ability, thereby aggravating chronic inflammation.10 Chronic inflammation can directly and/or indirectly promote the up-regulation of tissue factor expression in monocytes/ macrophages and vascular endothelial cells, thus initiating the clotting process and causing thrombosis. Serine proteinases during clotting also promote inflammation. Therefore, when the body is attacked by EBV, inflammation, malnutrition and coagulation have a positive feedback effect on each other.11
Notably, a number of recent studies have demonstrated that hematological biomarkers, such as the prognostic nutritional index (PNI),12,13 albumin,14 and fibrinogen,15,16 are independent prognostic biomarkers. Several nomograms have been established to guide the stratified treatment of patients.17–28 However, most of these previous studies had some shortcomings, such as (1) including some unconventional biomarkers,19–26 (2) not considering hematological and clinical measures when constructing the nomogram,17,18 and (3) not integrating these measures to construct a composite signature to guide the clinical decision-making process.17–26
Therefore, this study aimed to evaluate the prognostic and predictive value of a circulating hematological signature (CHS), which was constructed using a panel of indicators of inflammation, nutrition, and coagulation biomarkers. The CHS was then utilized to develop a potential prognostic model for predicting distant metastasis-free survival (DMFS) and OS in patients with non-metastatic NPC to guide individualized treatment.
Materials and Methods
Study Participants
This prognostic study followed the Transparent Reporting of a Multivariable Prediction Model for Individual Prognosis or Diagnosis (TRIPOD) report guideline. This retrospective study included patients with histologically confirmed NPC between January 2014 and December 2017. Those with the following conditions were excluded: (a) not receiving intensity-modulated radiotherapy (IMRT) combined with or without chemotherapy, (b) systemic metastasis at the time of diagnosis or the presence of other malignancies, (c) a history of cancer treatment, or (d) without complete baseline clinical information and laboratory data. The flow diagram of the study design is shown in Figure 1. Patients were included in the training cohort (January 2014 to December 2016) and validation cohort (January 2017 to December 2017) by year of diagnosis. Each patient was re-staged according to the TNM-8. This retrospective cohort study was conducted in accordance with the Declaration of Helsinki. We obtained approval from the Institutional Ethics Committee of Jiangxi Cancer Hospital. Informed consent was waived due to this study’s retrospective nature and the anonymized processing of patient data (2023ky102).
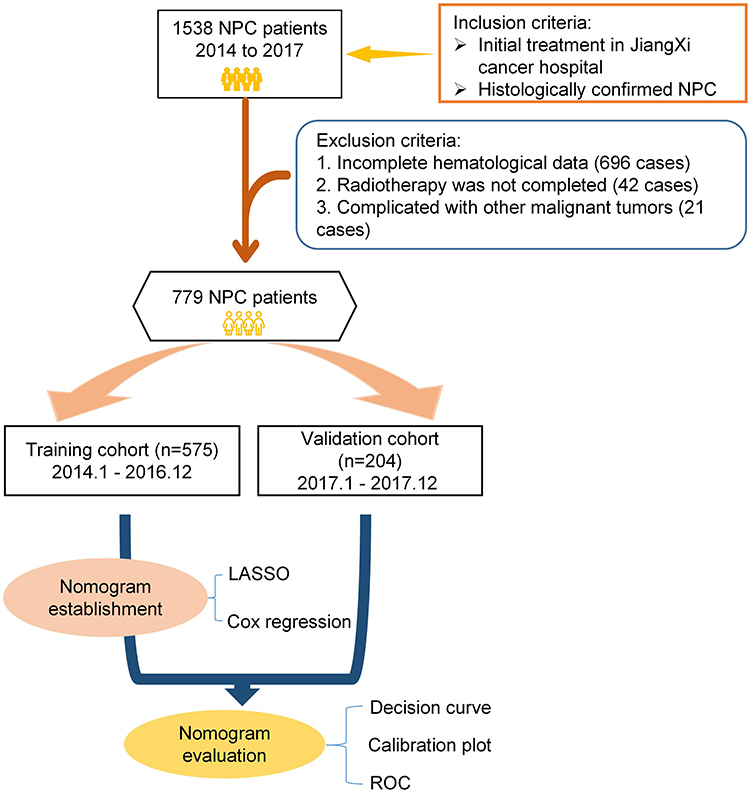 |
Figure 1 Flow diagram of study design. |
Data Collection and Processing
This study collected general information (age, sex, smoking history, and Karnofsky Performance Status) and data on hematologic parameters (plasma EBV DNA, blood biochemistry, routine blood test, and coagulation test). Data on neutrophil count, lymphocyte count, monocyte count, and platelet count; hemoglobin, creatinine, uric acid, urea nitrogen, lactate dehydrogenase, aspartate aminotransferase, alanine aminotransferase, albumin, pre-albumin, fibrinogen, and lactate dehydrogenase levels; and activated partial thromboplastin time, prothrombin time, thrombin time, and international normalized ratio were collected in this study and constructed hematological composite indicators based on them. The calculation formulas are presented in Supplement.
Treatment
All the patients received platinum-based chemotherapy at an interval of 21 days. Common induction chemotherapy (IC) regimens included docetaxel-cisplatin-fluorouracil, docetaxel-cisplatin, cisplatin-fluorouracil, and gemcitabine-cisplatin. Concurrent chemotherapy consisted of 2–3 cycles of cisplatin (80 or 100 mg/m2) during RT. The RT technique used was IMRT. Detailed descriptions of IMRT plans and dose prescriptions have been published previously.29
Follow-Up
After treatment completion, the patients were followed-up every 3 months during the first 2 years and every 6 months thereafter. The follow-up duration was defined as the date of treatment initiation until the last contact or death. Post-treatment surveillance at each follow-up appointment included comprehensive physical examination, plasma EBV DNA load evaluation, nasopharyngoscopy, and imaging assessment, similar to pretreatment examinations. Patients were followed-up via telephone if their recent examination records were not available. The primary endpoint was DMFS, the time from diagnosis to the date of DM or the date of the last follow-up. The second endpoint was OS, the time from diagnosis to date of death or last follow-up.
Construction of a CHS Prognostic Nomogram of DMFS
The least absolute shrinkage and selection operator (LASSO) Cox regression30 provided in the R package “glmnet” was applied to select the most useful prognostic markers among the 38 considered hematological biomarkers in the training cohort, and the selected prognostic markers and their respective LASSO regression coefficients were further used to construct the CHS. Patients were divided into high-, middle-, and low-CHS groups based on the best X-tile cutoff.31 The prognostic values of CHS and other clinical factors were analyzed using multivariate analysis (MVA) with a backward step. Based on the independent prognostic factors, a nomogram was constructed (nomogram_CHS). The performance of nomogram_CHS was assessed based on discrimination, calibration, and clinical usefulness The total risk score (TRS) was calculated according to the nomogram, and the patients were divided into low-, middle- and high-TRS DM groups.
Statistical Analysis
The best cutoff values for hematological indices were calculated using X-tile (Version 3.6.1; Yale University, New Haven, CT, USA), and continuous variables were divided into two subgroups based on the best cutoff value. To compare the differences in categorical variables between the training and validation cohorts, the χ2 test or Fisher exact test was used. DMFS and OS were analyzed using the Kaplan–Meier method, and differences were examined using the Log rank test. Discrimination was measured using the concordance index (C-index), calibration was assessed using the calibration curve, and clinical usefulness was evaluated using decision curve analysis. A bootstrap resampling method with 1000 repetitions was applied for internal validation. All statistical analyses were performed using SPSS 26 (version 26.0; IBM Corporation, Armonk, NY, USA) and R software 4.13 (R Foundation for Statistical Computing, Vienna, Austria) using RMS, GGPlot, survivalROC, and GlMNet packets. A two-tailed p value of <0.05 was considered statistically significant.
Results
Participant Characteristics
A total of 575 patients in the training cohort and 204 in the validation cohort were included in our analyses. In total, 169 (21.6%), 343 (44.0%), and 213 (27.3%) patients received RT alone, CCRT, and IC plus CCRT, respectively. Among the patients who received IC plus CCRT, IC regimens included taxol-platinum (n=176), platinum-5-fluorouracil (n=25), and gemcitabine-platinum (n=12). Patient characteristics of the training and validation cohorts are shown in Table 1. Circulating hematological biomarkers are shown in Table S1. Except for chemotherapy (yes/no), there was no difference between the training and validation cohorts. The median follow-up times were 75.6 months (range: 2.2–101.2) and 61.9 months (range: 17.0–68.6) in the training and validation cohorts, respectively. Overall, 169 (21.6%) patients died from various causes, and 151 (19.3%) patients experienced DM. The 5-year DMFS and OS were 76.6% and 83.0% in the training cohort, and 77.9% and 84.2% in the validation cohort.
 |
Table 1 Baseline Characteristics in the Training and Validation Cohort |
Construction of the CHS
The best cutoff of hematological biomarkers determined by X-tile is presented in Table S1. The 38 bio-markers were reduced to three prognostic markers using LASSO Cox regression (Figure 2A and B). CHS was constructed according to the coefficients of three prognostic biomarkers, including prognostic nutritional index (PNI), albumin-to-fibrinogen ratio (AFR) and prealbumin-to-fibrinogen ratio (PAFR) (CHS =−0.1814831× PNI - 0.3667708 × AFR - 0.1389865 × PAFR). Each variable was valued as 0 or 1; when the variable was less than the cutoff value, a value of 0 was assigned, and otherwise, a value of 1 was assigned. Patients were divided into high and low CHS groups based on the best cutoff values determined by X-tile. Kaplan–Meier analyses showed that the patients in the high-CHS group had worse 5-year DMFS than those in the low-CHS group in the training and validation cohorts (training cohort: 56.6% vs 85.0%, p<0.001; validation cohort: 43.6% vs 92.3%, p<0.001) (Figure 2C and D), as well as 5-year OS (training cohort: 65.4% vs 90.3%, p<0.001; validation cohort: 65.5% vs 92.1%, p<0.001) (Figure 2E and F).
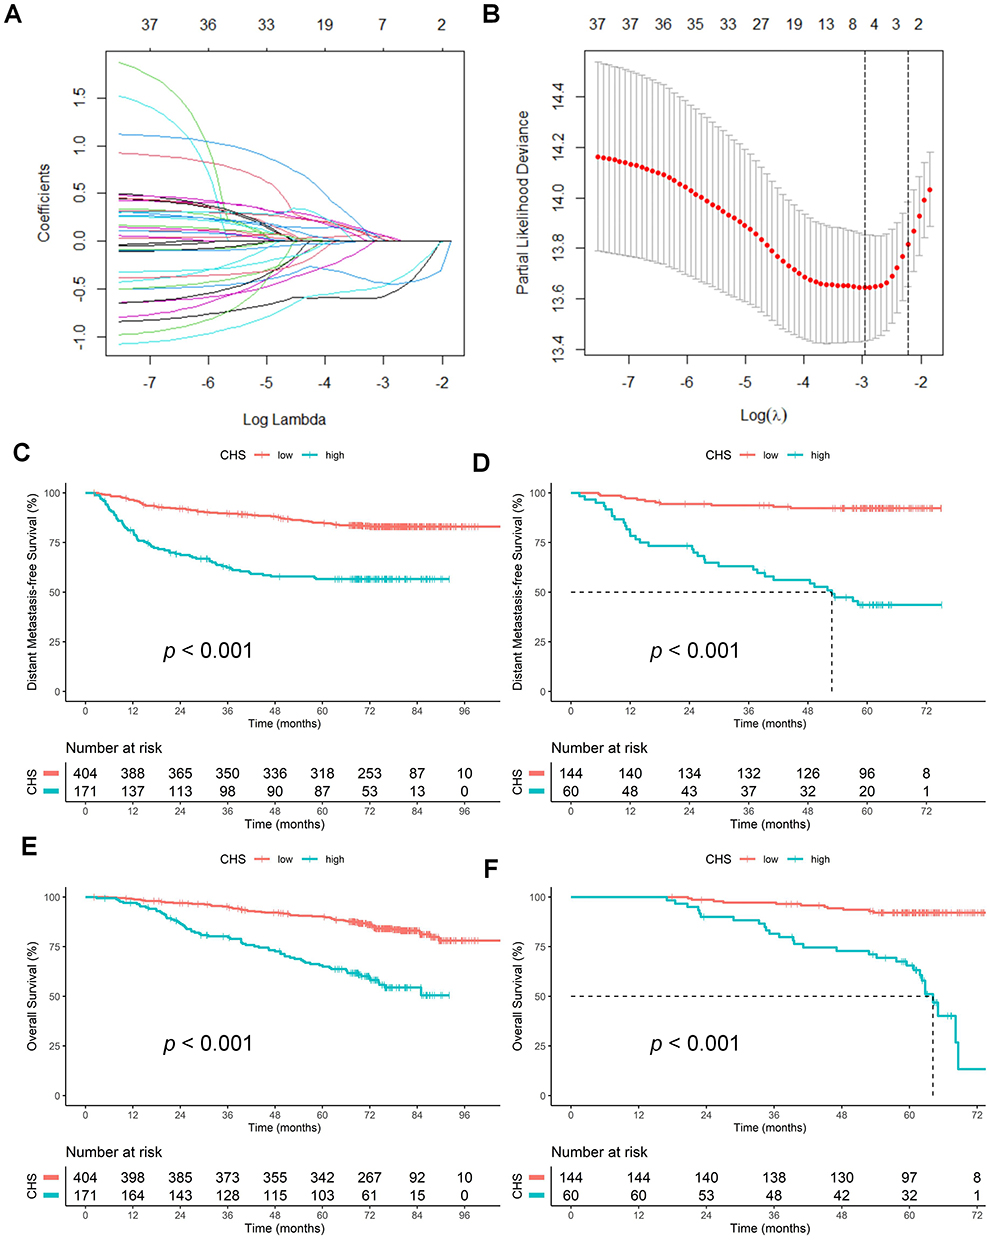 |
Figure 2 CHS selection using LASSO Cox regression (A). Tuning parameter lambda plus one standard error ((λ+SE) selection in the LASSO Cox regression via minimum criteria (B). Kaplan–Meier curves for DMFS stratified by the CHS values in the training cohort (C) and validation cohort (D). Kaplan–Meier curves for OS stratified by CHS in the training cohort (E) and validation cohort (F). |
Construction of Signature-Based Nomogram
MVA showed that in the training cohort, CHS, N classification, chemotherapy (yes/no) and EBV DNA were independent prognostic factors for DMFS (Table 2). To better evaluate the outcome of patients, nomogram_CHS was constructed based on the residual indicators after MVA (Figure 3A). The TRS of each patient was calculated from the nomogram_CHS, and patients were divided into high-, middle-, and low-TRS groups based on the best cutoff value (Table S1). Kaplan–Meier analysis showed that in the training cohort the patients in the low-TRS group had better 5-year DMFS than those in the middle- (88.7% vs 61.9%, p<0.001) or high-TRS (88.7% vs 38.5%, p<0.001) groups, as well as validation cohort (89.6% vs 67.0%, p<0.001; 89.6% vs 39.2%, p<0.001) (Figure 3B and C). Similar results were observed for the OS in the training cohort (92.4% vs 76.0%, p<0.001; 92.4% vs 47.0%, p<0.001), and validation cohort (91.0% vs 78.1%, p<0.001; 91.0% vs 61.6%, p<0.001) (Figure 3D and E).
 |
Table 2 Multivariate Analysis of DMFS and OS in the Training and Validation Cohort |
 |
Figure 3 CHS based nomogram for estimating the 1-, 3- and 5-year DMFS in NPC Patients (A). Kaplan–Meier curves for DMFS stratified by the TRS of nomogram values in the training cohort (B) and validation cohort (C). Kaplan–Meier curves for OS stratified by TRS in the training cohort (D) and validation cohort (E). |
Evaluation of the Prognostic Performance of the Nomogram
Furthermore, in order to better display the differentiation of nomogram_CHS, we constructed nomogram_nonCHS which includes Node classification, chemotherapy (yes/no), and EBV DNA. In the training cohort, the nomogram_CHS had higher C-index than nomogram_nonCHS, CHS and clinical stage for DMFS (0.728 vs 0.674 vs 0.645 vs 0.646) and OS (0.736 vs 0.686 vs 0.646 vs 0.668). In the validation cohort, nomogram_CHS had higher C-index than nomogram_nonCHS, CHS and clinical stage for DMFS (0.839 vs 0.746 vs 0.752 vs 0.616) and OS (0.818 vs 0.753 vs 0.710 vs 0.619) (Table S2). In the training cohort, nomogram_CHS had higher areas under the receiver operating characteristic curve (AUC) than nomogram_nonCHS, CHS and clinical stage for 5-year DMFS (0.779 vs 0.703 vs 0.688 vs 0.671) and OS (0.853 vs 0.773 vs 0.746 vs 0.637) (Figure S1A and B). In the validation cohort, nomogram_CHS had higher AUC than nomogram_nonCHS, CHS and clinical stage for 5-year DMFS (0.818 vs 0.755 vs 0.688 vs 0.686) and OS (0.862 vs 0.835 vs 0.737 vs 0.625) (Figure S1C and D). In the training and validation cohorts, the bootstrap resampling method with 1000 repetitions also indicated that the discriminability of the nomogram_CHS was better than the nomogram_nonCHS, clinical stage and CHS, regardless of the time change for DMFS (Figure S1E and F) and OS (Figure S1G and H). The calibration curves plotted at the 3- and 5-year time points showed good consistency between the predicted DMFS of the nomogram and observed DMFS in both the training and validation cohorts (Figure S2A and B). In the decision curve analysis, the nomogram_CHS had a higher 5-year DMFS net clinical benefit than the nomogram_nonCHS, clinical stage and CHS across a wider range of threshold probabilities for predicting outcomes in the training and validation cohorts (Figure S3A and B), as well as OS (Figure S3C and D).
The Value of Chemotherapy in Different Risk Groups Based on Nomogram
We further evaluated the value of the nomogram for chemotherapy guidance. When the patients were divided into training and validation cohorts for analysis, the number of patients in the low-, middle- and high-TRS groups was small in the validation cohort. Therefore, we combined the training and validation cohorts for the subsequent analysis. In the low-TRS group, the patients received RT alone, CCRT and IC plus CCRT have similar 5-year DMFS (94.7% vs 90.7% vs 91.8%, p=0.399) and OS (95.6% vs 95.7% vs 93.9%, p=0.636) (Figure 4A and B). In the middle-TRS group, the patients received RT alone have worse 5-year DMFS and OS than those received CCRT (DMFS: 58.7% vs 80.8%, p=0.046; OS: 75.0% vs 94.1%, p=0.007) or IC plus CCRT (DMFS: 58.7% vs 90.8%, p=0.001; OS: 75.0% vs 95.0%, p=0.004) (Figure 4C and D). In the high-TRS group, the patients received IC+CCRT had better 5-year DMFS and OS than those received RT alone (DMFS: 81.5% vs 18.6%, p<0.001; OS: 88.8% vs 26.9%, p<0.001) and CCRT (DMFS: 81.5% vs 31.3%, p<0.001; OS: 88.8% vs 53.2%, p<0.001)(Figure 4E and F).
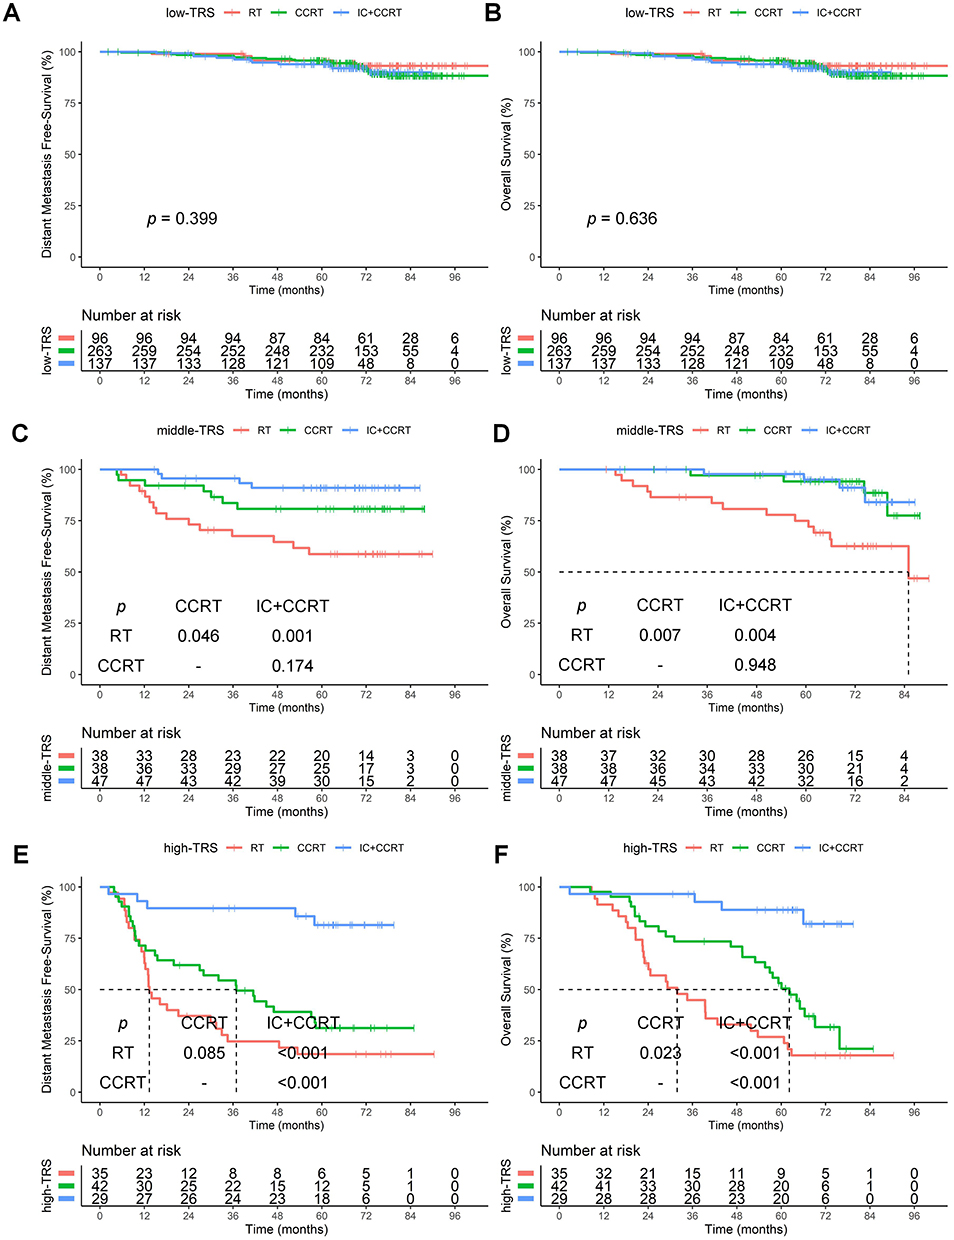 |
Figure 4 Kaplan–Meier curves of DMFS (A) and OS (B) in low-TRS group. Kaplan–Meier curves of DMFS (C) and OS (D) in middle-TRS group. Kaplan–Meier curves of DMFS (E) and OS (F) in high-TRS group. |
Considering chemotherapy failed to improve the prognosis of NPC patients in the low-TRS group, a further subgroup analysis was conducted to investigate whether stage III–IV patients could benefit from chemotherapy. The stage I–II and stage III–IV NPC patients received IC plus CCRT or CCRT has no 5-year DMFS benefit compared to those received RT alone (stage I–II: 100.0% vs 90.2% vs 97.8%, p=0.194; stage III–IV: 91.1% vs 90.8% vs 91.7%, p=0.939) (Figure 5A and B). The stage I–II and stage III–IV NPC patients received IC plus CCRT or CCRT has no 5-year OS benefit compared to those received RT alone (stage I–II: 100.0% vs 100.0% vs 97.8%, p=0.214; stage III–IV: 93.4% vs 94.6% vs 93.3%, p=0.936) (Figure 5C and D).
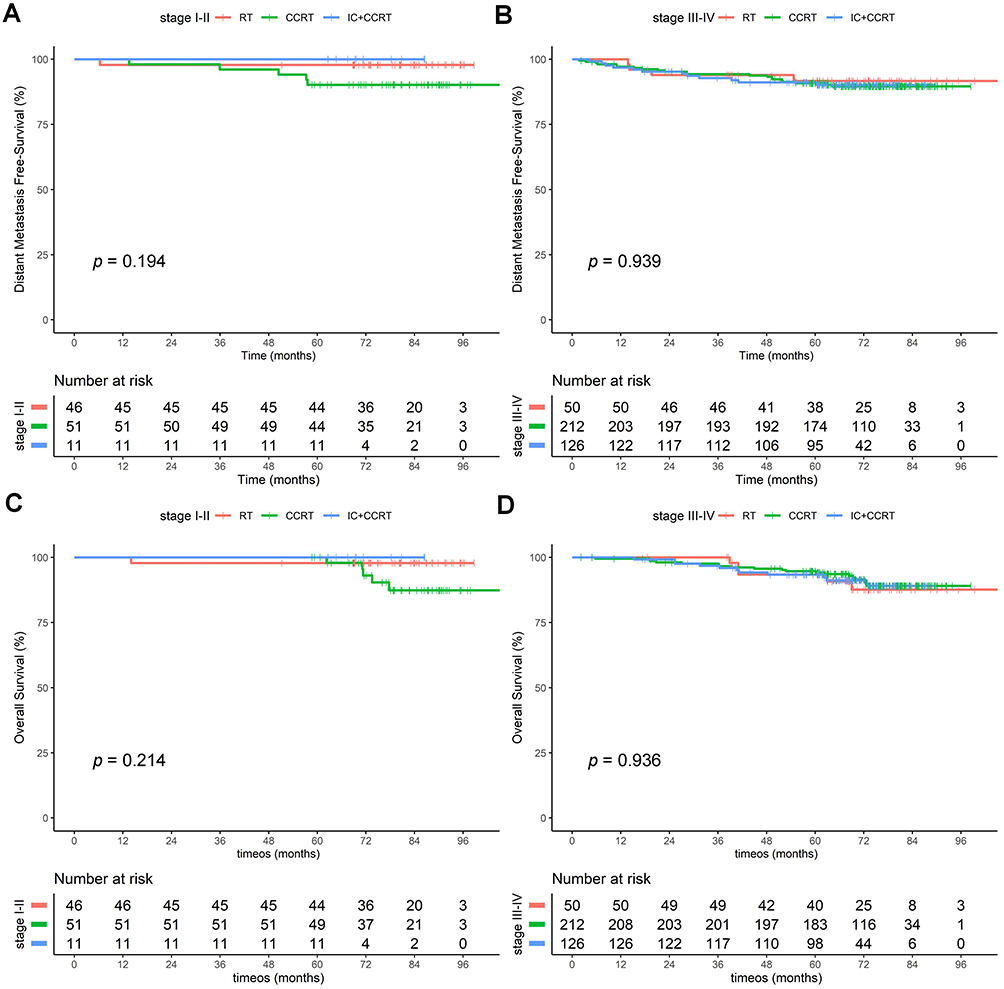 |
Figure 5 Kaplan–Meier curves of DMFS in the low-TRS group of Stage I–II (A) and Stage III–IV (B) NPC patient. Kaplan–Meier curves of OS in the low-TRS group of Stage I–II (C) and Stage III–IV (D) NPC patient. |
Discussion
Despite improvements in RT technology and equipment, DM still occur in about 20–30% of patients and are the leading cause of treatment failure.1,2 Accurate estimation of DMFS is crucial for decision-making when designing treatment strategies for patients. This study found that a signature based on a series of circulating hematological biomarkers could effectively distinguish the DMFS and OS of NPC patients in the training and validation cohorts. The nomogram_CHS was based on CHS and clinical characteristics could better predict DMFS and OS than the CHS and clinical stage. More importantly, our study found that IC could potentially improve the DMFS and OS of middle and high-TRS patients but not low-TRS patients, based on the nomogram_CHS score.
The current study found that CHS could effectively distinguish between the risk of DM and death, and three hematological indicators (PNI, AFR and PAFR) remained after LASSO regression. As a simple and feasible nutritional test, PNI can be used as an indicator of individual nutritional status to a certain extent. It is widely used to predict the prognosis of various malignant tumors, as well as NPC.12,13 A large number of studies have shown that fibrinogen increases tumor angiogenesis by promoting tumor progression and DM.15,16 Additionally, it is well known that proteins are mainly synthesized in the liver; hypoalbuminemia occurs when there are insufficient raw materials (amino acids absorbed by the digestive tract) or the ability to synthesize proteins is reduced due to abnormal liver function, indicating that the level of albumin in plasma can be used to assess nutritional status and liver function. The AFR and PAFR, which considers both albumin, prealbumin and fibrinogen, are better indexes to assess prognosis. Indeed, many studies have confirmed that AFR and PAFR is related to tumor prognosis.32–36 Notably, our study found that AFR and were important prognostic biomarker because them had a higher LASSO coefficient than other hematological biomarkers. Furthermore, we found that the AUCs of CHS were higher than those of PNI, AFR and PAFR, suggesting that compared with one or fewer markers, the signature of multiple markers in a single model substantially improves the prognostic value. In fact, a few composite hematological indexes have been proposed in some studies; for example, Chen et al26 and Zhou et al28 used high-density lipoprotein cholesterol, apolipoprotein A-1, EBV VCA-IgA, and EA-IgA and Xiang et al27 used hyaluronidase, collagen IV, laminin, and procollagen III to construct composite hematological indexes. It should be noted that these studies included some unconventional testing indicators when constructing hematological composite indicators. In contrast, the indicators in our study are highly popular and have broad clinical applicability.
Nomograms are widely used for cancer prognosis, primarily because of their ability to reduce statistical predictive models into a single numerical estimate of the probability of an event, such as death or recurrence.17–28 In our study, nomogram_CHS was constructed based on MVA results (Node classification, chemotherapy (yes/no), EBV-DNA, and CHS). The nomogram_CHS had better prognostic efficiency than TNM-8 with a higher C-index in the training (0.728 vs 0.646) and validation cohort (0.893 vs 0.622). Although many scholars have constructed a few nomograms for the prognosis assessment of NPC based on blood indicators, the performance of the prognostic nomogram constructed in this study (C-index >0.8) seems better than previous nomograms.17–19,23–27
IC with CCRT has become the standard treatment for locoregional NPC (stage III–IV) in the IMRT era according to the CSCO-ASCO guidelines.37–39 However, retrospective studies have shown that some patients do not benefit from IC.40,41 Similar to previous studies, our study found that patients in the low-TRS group did not benefit from chemotherapy. There were 409 stage III–IV NPC patients in the low-TRS group, including 30 with T3N0, 128 with T3N1, 27 with T4N0, 66 with T4N1, and 158 with TXN2. Consistent with our study, a randomized clinical trial published by Ma et al42 indicated that T3N0 NPC patients without adverse features (all nodes <3 cm, no level IV/Vb nodes; no extranodal extension; EBV DNA <4000 copies/mL) received RT alone had similar progress-free survival compare to CCRT. In a study published by Tang et al43 it was found that for low-risk T3N0, T3N1, and T4N0 NPC patients (EBV DNA < 2000 copies /mL; Women and EBV DNA≥2000 copies /mL) who received CCRT and IC+CCRT showed no survival difference. However, it is noted that no studies have analyzed the survival difference between RT alone and CCRT in low-risk T3N1 and T4N0 patients. In addition, Ma et al44 found that the rate of distant metastasis was significantly lower in node-negative NPC patients than in node-positive patients. Similarly, Tang et al found that T4N0-2 NPC patients had better 3-year OS and DMFS and worse local relapse-free survival than T1-4N3 patients. Therefore, more attention should be paid to local radiation therapy rather than systemic chemotherapy in T4N0-2 NPC patients for them having a lower risk of distant metastasis. Consistent with the findings of Tang et al45 our study also found that in locally advanced NPC patients, low-risk TXN2 NPC patients (EBV DNA < 500 copies /mL, high AFR, PAFR, and PNI before treatment) may be exempt from chemotherapy. In the middle-TRS group, IC plus CCRT could reduce DM and death risk of NPC patients compared with RT alone but not CCRT. These results suggest that CCRT or IC plus CCRT can significantly improve the prognosis of patients with locally advanced NPC compared with RT alone, which is consistent with previous studies.46,47 In the high-TRS group, the patients received IC plus CCRT have better DMFS and OS than those received CCRT or RT alone. This suggests to us that adequate IC in high-TRS patients is necessary, which can greatly reduce DM risk and thus improve prognosis.37–39
Limitations
Although this study was a well-designed retrospective study with a large sample size and included a training group and a validation group, it had several limitations. First, due to the retrospective nature, this study had selection bias: the study population was derived from EBV-endemic areas, where EBV-associated NPC and non-keratinizing NPC are common. Second, we included EBV DNA levels in our analyses, which are not widely available in many hospitals. Third, although we constructed an internal validation group, external validation is still required, which will help generalize the results to other institutions.
Conclusions
In this study, the proposed nomogram model based on a circulating hematological biomarker panel showed satisfactory accuracy, discrimination capability, and clinical utility. This model would enable individualized prognostication of DMFS and OS and guide personalized treatment.
Acknowledgments
This work was supported by the National Natural Science Foundation of China (grant 82103478), Non-profit Central Research Institute Fund of Chinese Academy of Medical Sciences (grant number 2020-PT320-004), and Regional Innovation System Construction Cross-regional Research and Development Project of Science and Technology of Jiangxi Province (grant 20221ZDH04056), and Natural Science Foundation of Jiangxi Province (20212BAB21606, 20224BAB216053) and Jiangxi Province Traditional Chinese Medicine Science and Technology Plan Project (2020B0349).
Disclosure
The authors report no conflicts of interest in this work.
References
1. Chen YP, Chan ATC, Le QT, Blanchard P, Sun Y, Ma J. Nasopharyngeal carcinoma. Lancet. 2019;394(10192):64–80. doi:10.1016/S0140-6736(19)30956-0
2. Lai SZ, Liu MZ, Ma J. How does intensity-modulated radiotherapy versus conventional two-dimensional radiotherapy influence the treatment results in nasopharyngeal carcinoma patients? Int J Radiat Oncol Biol Phys. 2011;80(3):661–668. doi:10.1016/j.ijrobp.2010.03.024
3. Zhang MX, Hong MH, Chen MY. Intensity-modulated radiotherapy prolongs the survival of patients with nasopharyngeal carcinoma compared with conventional two-dimensional radiotherapy: a 10-year experience with a large cohort and long follow-up. Eur J Cancer. 2015;51(17):2587–2595. doi:10.1016/j.ejca.2015.08.006
4. Tang LL, Sun Y, Ma J. Validation of the 8th Edition of the UICC/AJCC Staging System for Nasopharyngeal Carcinoma From Endemic Areas in the Intensity-Modulated Radiotherapy Era. J Natl Compr Canc Netw. 2017;15(7):913–919. doi:10.6004/jnccn.2017.0121
5. Zhong L, Tang L, Tian J. A deep learning-based radiomic nomogram for prognosis and treatment decision in advanced nasopharyngeal carcinoma: a multicentre study. EBioMedicine. 2021;70:103522. doi:10.1016/j.ebiom.2021.103522
6. Wu Z, Weng D, Li G. Quantitative proteome analysis of overexpressed Cripto-1 tumor cell reveals 14-3-3gamma as a novel biomarker in nasopharyngeal carcinoma. J Proteomics. 2013;83:26–36. doi:10.1016/j.jprot.2013.03.001
7. Liu SL, Sun XS, Chen QY, et al. Development and validation of a transcriptomics-based gene signature to predict distant metastasis and guide induction chemotherapy in locoregionally advanced nasopharyngeal carcinoma. Eur J Cancer. 2022;163:26–34. doi:10.1016/j.ejca.2021.12.017
8. Li XY, Luo DH, Guo L, et al. Deintensified Chemoradiotherapy for Pretreatment Epstein-Barr Virus DNA-Selected Low-Risk Locoregionally Advanced Nasopharyngeal Carcinoma: a Phase II Randomized Noninferiority Trial. J Clin Oncol. 2022;40(11):1163–1173. doi:10.1200/JCO.21.01467
9. Mantovani A, Allavena P, Sica A, Balkwill F. Cancer-related inflammation. Nature. 2008;454(7203):436–444. doi:10.1038/nature07205
10. Arends J, Baracos V, Bertz H, et al. ESPEN expert group recommendations for action against cancer-related malnutrition. Clinical Nutrition. 2017;36(5):1187–1196. doi:10.1016/j.clnu.2017.06.017
11. Bauer AT, Gorzelanny C, Gebhardt C, Pantel K, Schneider SW. Interplay between coagulation and inflammation in cancer: limitations and therapeutic opportunities. Cancer Treat Rev. 2022;102. doi:10.1016/j.ctrv.2021.102322
12. Miao J, Xiao W, Wang L, et al. The value of the Prognostic Nutritional Index (PNI) in predicting outcomes and guiding the treatment strategy of nasopharyngeal carcinoma (NPC) patients receiving intensity-modulated radiotherapy (IMRT) with or without chemotherapy. J Cancer Res Clin Oncol. 2017;143(7):1263–1273. doi:10.1007/s00432-017-2360-3
13. Kucukarda A, Erdogan B, Gokyer A, et al. Prognostic nutritional index and its dynamics after curative treatment are independent prognostic factors on survival in non-metastatic nasopharyngeal carcinoma. Support Care Cancer. 2022;30(3):2131–2139. doi:10.1007/s00520-021-06627-6
14. Li G, Gao J, Liu ZG, et al. Influence of pretreatment ideal body weight percentile and albumin on prognosis of nasopharyngeal carcinoma: long-term outcomes of 512 patients from a single institution. Head Neck. 2014;36(5):660–666. doi:10.1002/hed.23357
15. Tang LQ, Zeng MS, Mai HQ. The impact of plasma Epstein-Barr virus DNA and fibrinogen on nasopharyngeal carcinoma prognosis: an observational study. Br J Cancer. 2014;111(6):1102–1111. doi:10.1038/bjc.2014.393
16. S-S H, L-X L, Chen Y. Plasma Fibrinogen Correlates with Metastasis and is Associated with Prognosis in Human Nasopharyngeal Carcinoma. J Cancer. 2017;8(3):403–409. doi:10.7150/jca.17028
17. Jae-Keun CH-SJ, Chan Ahn Y. Development and external validation of nomograms predictive of response to radiation therapy and overall survival in nasopharyngeal cancer patients. Eur J Cancer. 2015;51(10):1303–1311. doi:10.1016/j.ejca.2015.04.003
18. Zhang Y, Liu Q, Ma J. Nomogram to predict the benefit of additional induction chemotherapy to concurrent chemoradiotherapy in locoregionally advanced nasopharyngeal carcinoma: analysis of a multicenter, Phase III randomized trial. Radiother Oncol. 2018;129(1):18–22. doi:10.1016/j.radonc.2017.12.002
19. Miao S, Lei H, Li X, et al. Development and validation of a risk prediction model for overall survival in patients with nasopharyngeal carcinoma: a prospective cohort study in China. Cancer Cell Int. 2022;22(1):360. doi:10.1186/s12935-022-02776-8
20. Pan JJ, Ng WT, Zong JF, et al. Prognostic nomogram for refining the prognostication of the proposed 8th edition of the AJCC/UICC staging system for nasopharyngeal cancer in the era of intensity-modulated radiotherapy. Cancer. 2016;122(21):3307–3315. doi:10.1002/cncr.30198
21. Xu C, Sun Y, Ma J. Establishing and applying nomograms based on the 8th edition of the UICC/AJCC staging system to select patients with nasopharyngeal carcinoma who benefit from induction chemotherapy plus concurrent chemoradiotherapy. Oral Oncol. 2017;69:99–107. doi:10.1016/j.oraloncology.2017.04.015
22. Zhang LL, Li YY, Shao JY. Development of a Nomogram Model for Treatment of Nonmetastatic Nasopharyngeal Carcinoma. JAMA Netw Open. 2020;3(12):e2029882. doi:10.1001/jamanetworkopen.2020.29882
23. Mao JR, Lan KQ, Liu SL, et al. Can the prognosis of individual patients with nasopharyngeal carcinoma be predicted using a routine blood test at admission? Radiother Oncol. 2023;179:109445. doi:10.1016/j.radonc.2022.109445
24. Tang LQ, Mai HQ, Zeng MS. Establishment and Validation of Prognostic Nomograms for Endemic Nasopharyngeal Carcinoma. J Natl Cancer Inst. 2016;108(1):67.
25. Lu ZJ, Liu LT, Sun XS, et al. Establishment and validation of a prognostic nomogram to predict early metastasis in nasopharyngeal carcinoma patients within six months after radiotherapy and to guide intensive treatment. Radiother Oncol. 2021;162:202–211. doi:10.1016/j.radonc.2021.03.035
26. Li J, Chen S, Peng S, et al. Prognostic nomogram for patients with Nasopharyngeal Carcinoma incorporating hematological biomarkers and clinical characteristics. Int J Biol Sci. 2018;14(5):549–556. doi:10.7150/ijbs.24374
27. Lv SH, Li WZ, Liang H, Liu GY, Xia WX, Xiang YQ. Prognostic and Predictive Value of Circulating Inflammation Signature in Non-Metastatic Nasopharyngeal Carcinoma: potential Role for Individualized Induction Chemotherapy. J Inflamm Res. 2021;14:2225–2237. doi:10.2147/JIR.S310017
28. Lai C, Chen S, Zhou L. A novel prognostic model predicts overall survival in patients with nasopharyngeal carcinoma based on clinical features and blood biomarkers. Cancer Med. 2021;10(11):3511–3523. doi:10.1002/cam4.3839
29. Zeng L, Gong XC, Li JG. Risk factors and distribution features of level IB lymph nodes metastasis in nasopharyngeal carcinoma. Auris Nasus Larynx. 2019;46(3):457–464. doi:10.1016/j.anl.2018.10.012
30. Tibshirani R. The lasso method for variable selection in the Cox model. Stat Med. 1997;16(4):385–395. doi:10.1002/(sici)1097-0258(19970228)16:4<385::aid-sim380>3.0.co;2-3
31. Camp MD-F RL, Rimm DL. X-tile a new bio-informatics tool for biomarker assessment and outcome-based cut-point optimization. Clin Cancer Res. 2004. doi:10.1158/1078-0432.CCR-04-0713
32. Yu W, Jiang X, Jiang Y. Preoperative albumin-to-fibrinogen ratio predicts chemotherapy resistance and prognosis in patients with advanced epithelial ovarian cancer. J Ovarian Res. 2019;12(1):88. doi:10.1186/s13048-019-0563-8
33. Zhang J, Zhang M, Xu M. Development and validation of a prognostic model based on the albumin-to-fibrinogen ratio (AFR) and gamma-glutamyl transpeptidase-to-platelet ratio (GPR) in hepatocellular carcinoma patients. Clin Chim Acta. 2020;511:107–116. doi:10.1016/j.cca.2020.09.038
34. You X, Chen J, Shen H. Preoperative albumin-to-fibrinogen ratio predicts severe postoperative complications in elderly gastric cancer subjects after radical laparoscopic gastrectomy. BMC Cancer. 2019;19(1):931. doi:10.1186/s12885-019-6143-x
35. Ying HQ, Chen W, Xiong CF, Wang Y, Li XJ, Cheng XX. Quantification of fibrinogen-to-pre-albumin ratio provides an integrating parameter for differential diagnosis and risk stratification of early-stage colorectal cancer. Cancer Cell Int. 2022;22(1):137. doi:10.1186/s12935-022-02532-y
36. Li SQ, Jiang YH, Lin J, et al. Albumin-to-fibrinogen ratio as a promising biomarker to predict clinical outcome of non-small cell lung cancer individuals. Cancer Med. 2018;7(4):1221–1231. doi:10.1002/cam4.1428
37. Sun Y, Liu MZ, Ma J. Induction chemotherapy plus concurrent chemoradiotherapy versus concurrent chemoradiotherapy alone in locoregionally advanced nasopharyngeal carcinoma: a Phase 3, multicentre, randomised controlled trial. Lancet Oncol. 2016;17(11):1509–1520. doi:10.1016/S1470-2045(16)30410-7
38. Cao SM, Guo X, Hong MH. Neoadjuvant chemotherapy followed by concurrent chemoradiotherapy versus concurrent chemoradiotherapy alone in locoregionally advanced nasopharyngeal carcinoma: a phase III multicentre randomised controlled trial. Eur J Cancer. 2017;75:14–23. doi:10.1016/j.ejca.2016.12.039
39. Zhang Y, Sun Y, Ma J. Gemcitabine and Cisplatin Induction Chemotherapy in Nasopharyngeal Carcinoma. N Engl J Med. 2019;381(12):1124–1135. doi:10.1056/NEJMoa1905287
40. Lei Y, Liu N, Ma J. A Gene-Expression Predictor for Efficacy of Induction Chemotherapy in Locoregionally Advanced Nasopharyngeal Carcinoma. J Natl Cancer Inst. 2021;113(4):471–480. doi:10.1093/jnci/djaa100
41. Liu SL, Bian LJ, Liu ZX, et al. Development and validation of the immune signature to predict distant metastasis in patients with nasopharyngeal carcinoma. J Immunother Cancer. 2020;8(1). doi:10.1136/jitc-2019-000205
42. Tang LL, Guo R, Zhang N, et al. Effect of Radiotherapy Alone vs Radiotherapy With Concurrent Chemoradiotherapy on Survival Without Disease Relapse in Patients With Low-risk Nasopharyngeal Carcinoma: a Randomized Clinical Trial. JAMA. 2022;328(8):728–736. doi:10.1001/jama.2022.13997
43. Xu C, Zhang S, W-F L, et al. Selection and Validation of Induction Chemotherapy Beneficiaries Among Patients With T3N0, T3N1, T4N0 Nasopharyngeal Carcinoma Using Epstein-Barr Virus DNA: a Joint Analysis of Real-World and Clinical Trial Data. Front Oncol. 2019:9. doi:10.3389/fonc.2019.01343
44. Sun Y, Tang -L-L, Chen L, et al. Promising treatment outcomes of intensity-modulated radiation therapy for nasopharyngeal carcinoma patients with N0 disease according to the seventh edition of the AJCC staging system. BMC Cancer. 2012;12(1). doi:10.1186/1471-2407-12-68
45. Huang C-L, Guo R, J-Y L, et al. Nasopharyngeal carcinoma treated with intensity-modulated radiotherapy: clinical outcomes and patterns of failure among subsets of 8th AJCC stage IVa. Eur Radiol. 2019;30(2):816–822. doi:10.1007/s00330-019-06500-5
46. Chen X, Zhu X, Liang Z, et al. Long-term outcomes of neoadjuvant chemotherapy followed by concurrent chemoradiotherapy (CCRT) vs CCRT alone for nasopharyngeal carcinoma in the era of intensity-modulated radiation therapy using propensity score matching method. Onco Targets Ther. 2017;10:2909–2921. doi:10.2147/OTT.S135590
47. Wu LR, Jiang XS, Song X, et al. Comparing the efficacy of induction-concurrent with concurrent-adjuvant chemotherapy in locoregionally advanced nasopharyngeal carcinoma: a propensity score matching analysis. Oncotarget. 2017;8(45):79953–79963. doi:10.18632/oncotarget.20389
 © 2023 The Author(s). This work is published and licensed by Dove Medical Press Limited. The
full terms of this license are available at https://www.dovepress.com/terms
and incorporate the Creative Commons Attribution
- Non Commercial (unported, 3.0) License.
By accessing the work you hereby accept the Terms. Non-commercial uses of the work are permitted
without any further permission from Dove Medical Press Limited, provided the work is properly
attributed. For permission for commercial use of this work, please see paragraphs 4.2 and 5 of our Terms.
© 2023 The Author(s). This work is published and licensed by Dove Medical Press Limited. The
full terms of this license are available at https://www.dovepress.com/terms
and incorporate the Creative Commons Attribution
- Non Commercial (unported, 3.0) License.
By accessing the work you hereby accept the Terms. Non-commercial uses of the work are permitted
without any further permission from Dove Medical Press Limited, provided the work is properly
attributed. For permission for commercial use of this work, please see paragraphs 4.2 and 5 of our Terms.
Recommended articles
A Nomogram to Identify the Optimal Candidates for Induction Chemotherapy in Advanced N-Stage Nasopharyngeal Carcinoma
Jiang YT, Chen KH, Liang ZG, Yang J, Qu S, Li L, Zhu XD
Cancer Management and Research 2022, 14:2583-2596
Published Date: 31 August 2022
Prognostic Value of a Serum Panel of Inflammatory Factors in Non-Metastatic Nasopharyngeal Carcinoma Patients Undergoing Radical Radiotherapy with Adjuvant Chemotherapy
Liang T, Xiao D, Lu S, Ye X, Xiao Z
Cancer Management and Research 2022, 14:2763-2772
Published Date: 16 September 2022
Prognostic Significance of Cervical Lymph Node Biopsy in Nasopharyngeal Carcinoma Patients: A Retrospective Analysis
Sang R, Tang Z, Xu X, Qin S, Zhou J
Cancer Management and Research 2025, 17:2675-2690
Published Date: 10 November 2025