Back to Journals » Journal of Hepatocellular Carcinoma » Volume 13
A Novel Predictive Model Based on Glutathione Metabolism Genes RRM2 and G6PD in Hepatocellular Carcinoma
Authors Li X, Tang J, Qin H, Huang Y, Li M, Yang Z, Meng J, Li L
Received 20 April 2025
Accepted for publication 9 September 2025
Published 16 June 2026 Volume 2026:13 529380
DOI https://doi.org/10.2147/JHC.S529380
Checked for plagiarism Yes
Review by Single anonymous peer review
Peer reviewer comments 2
Editor who approved publication: Professor Manal Hassan
Xiaolong Li,1,2,* Jiayan Tang,1,* Huotang Qin,1 Yu Huang,1 Minqing Li,1 Zaiyong Yang,1 Jiali Meng,3– 5 Ling Li6,7
1Guangxi Medical University, Nanning, Guangxi Zhuang Autonomous Region, People’s Republic of China; 2Department of Cell Biology and Genetics, School of Pre-Clinical Medicine, Key Laboratory of Longevity and Aging Related Diseases of the Chinese Ministry of Education, Nanning, Guangxi Zhuang Autonomous Region, People’s Republic of China; 3Department of Radiation Oncology, The First Affiliated Hospital of Guangxi Medical University, Nanning, Guangxi Zhuang Autonomous Region, People’s Republic of China; 4Guangxi Key Laboratory of Immunology and Metabolism for Liver Diseases, Nanning, Guangxi Zhuang Autonomous Region, People’s Republic of China; 5Key Laboratory of Early Prevention and Treatment for Regional High-Frequency Tumors (Guangxi Medical University), Ministry of Education, Nanning, Guangxi Zhuang Autonomous Region, People’s Republic of China; 6Department of Pathology, School of Medicine, the Sixth Affiliated Hospital of South China University of Technology (Nanhai District People’s Hospital of Foshan), Foshan, People’s Republic of China; 7Department of Pathology, People’s Hospital of Guangxi Zhuang Autonomous Region, Nanning, Guangxi Zhuang Autonomous Region, People’s Republic of China
*These authors contributed equally to this work
Correspondence: Ling Li, Email [email protected]
Purpose: Glutathione (GSH) metabolism is closely associated with tumor behavior in hepatocellular carcinoma (HCC). HCC is the third fatality reason and the sixth incidence rank in global tumor ranking. Our study explored the connection between glutathione metabolism genes (GMGs) expression and HCC progression and prognosis.
Methods: We obtained seven differentially expressed genes (DEGs) by analyzing GMGs dataset in HCC and the TCGA-LIHC cohort. Utilizing LASSO Cox analysis, we developed a predictive model based on 2-GMGs: Ribonucleotide reductase regulatory subunit M2 (RRM2) and glucose-6-phosphate dehydrogenase (G6PD). The model was apprized with the SHapley Additive exPlanations (SHAP). The predictive ability of the model was rigorously validated through prognostic stratification, univariable and multivariable Cox regression, and nomogram construction. We anticipated chemotherapy sensitivity using the GDSC database and used GEPIA and TIMER to examine the correlations with 2-GMGs expression and cellular immune-associated markers. This study also detects the impact of RRM2 and G6PD expression on HCC patient survival through immunohistochemistry.
Results: A prognostic model and nomogram composed of 2-GMGs provided an accurate prognostic for HCC patients. The median risk score as a dividing criterion was used to classify into low and high-risk groups. A positive outcome for the lowest-risk group was achieved by Kaplan–Meier curves. Moreover, the risk score was verified as an independable predictive indicator by multifactorial and unifactorial Cox regression analyses. Notable disparities between the two groups regarding the infiltration of different immune cell subtypes, tumor mutation burden (TMB) and sensitivity to chemotherapeutic subtypes were observed. Finally, immunohistochemical indicated that increased RRM2 and G6PD expression and decreased viability of HCC patients.
Conclusion: Our findings exposit that the higher 2-GMGs expression and the worse progression and prognosis of HCC. The SHAP approach was employed to elucidate the 2-GMGs model, enhancing its utility for clinicians.
Keywords: RRM2, G6PD, hepatocellular carcinoma, prognostic model, immune
Introduction
Hepatocellular carcinoma is the third fatality reasons and the sixth incidence rank in global tumor ranking.1 It has received considerable attention internationally. Surgical resection,2 liver transplantation,3 and the application of molecular targeted drugs4 have collectively enhanced the therapeutic outcomes of patients with HCC to some extent. Nonetheless, a sizable portion of patients develop lymphatic metastasis or recrudescence within a few years.5 The diagnosis of hepatocellular carcinoma in its initial stages is a significant challenge due to the lack of specific biomarkers and overt symptoms. This contributes to a significantly reduced survival rate among patients with HCC.6 Patients with HCC keep a high fatality rate for poor drug sensitivity and cancer cell metastasis, even with recent medical and scientific advancements.7,8
GSH is significant for preserving the redox balance, guarding against xenophilic toxicity and oxidative damage and serving as a principal reducing agent within cells.9 An enormous number of free radicals and oxidative stresses are generated in the development of HCC due to tumor proliferation and metabolic activity. A recent investigation revealed that the metabolic reprogramming of glutamine is essential for HCC. It is not only the result of HCC occurrence or progression but also the main factor leading to HCC occurrence or promoting HCC metastasis. The changes in the components of glutamine metabolism in HCC indicate the potential role of biomarkers, including related metabolic enzymes, metabolites, and metabolite transporters.10 It is worth noting that glutamine is a part of the composition of glutathione, so it is possible to target the reprogramming of glutamine to achieve therapeutic effects on HCC and provide new options for treating HCC patients in clinical practice. The current research trend is focused on how to impact the metabolism of glutathione11,12 and thus influence the development process of HCC. These findings are useful for studying the evolution and development of hepatocellular carcinoma and for developing therapeutic strategies. The prognostic influence of genes linked to glutathione metabolism on HCC patients has still not been clearly established.
On the basis of the above questions, we selected two valuable GMGs through deeper analysis. Moreover, we also created nomograms and explored the connection between GMGs and the immune microenvironment. Finally, the correlation between RRM2 and G6PD expression level and prognosis was verified. The interactions between GMGs and the immunotherapies and chemosensitivity have also been analyzed in detail. These findings presented that genes related to glutathione metabolism have both prognostic and therapeutic value in HCC. Additionally, a model of risk score has been developed to forecast the outcome of HCC after treatment and provides novel perceptions on liver cancer management.
Methods
Data Acquisition and Processing
Using the The Cancer Genome Atlas Program (TCGA) database (https://www.cancer.gov/ccg/research/genome-sequencing/tcga), we extracted gene expression profiles and clinical data of the HCC cohort. From the Molecular Signatures Database (MSigDB) (https://www.gsea-msigdb.org/gsea/msigdb), we obtained glutathione metabolism-genes. Using |Log2FC|>1 and p-value < 0.05) as criteria, we performed differential expression analyses of these genes.
Construction of LASSO Regression Analysis and Survival Prediction Model
To calculate and select the linear model and retain valuable variables, we identified seven genes of interest through Venn analysis. We then employed the “glmnet” package in R to conduct LASSO regression analysis. To ascertain the optimal penalty regularization parameter λ, we subsequently processed a cross-validation, which led to the identification of two specific genes. The Kaplan-Meier survival analysis was utilized for making a contrast of the estimated survival durations between the two different risk groups. The receiver operating characteristic (ROC) curve is applied for apprizing the model’s prognosticative capacity, which is an analytical evaluation indicator.
ML Model Construction and Evaluation
We constructed models using three different types of machine learning algorithms based on the feature factors that have been selected, including CatBoost, GBM, and GBDT. We exerted the ROC to apprize the capability of the three models and pinpoint the best model. Besides, we exerted the SHAP approach to apprize the overall feature importance in the ML model with the best predictive performance, thereby enhancing interpretability.
Development and Validation of the Nomogram
The validity and independence of the risk score were assessed utilizing both multifactorial and unifactorial Cox regression analyses. A predictive nomogram was then developed using the “rms” R package to assess the 1-, 3- and 5-year probabilities of OS, including age, grade, stage, T, M, N, gender and risk score as independent prognostic factors. Calibration curves, time-ROC curves and C-indexes were jointly employed to comprehensively and accurately evaluate the accuracy and discriminatory ability of risk models and nomograms in predicting the prognostic risk of patients.13
Tumor Mutation Burden (TMB) Analysis
To investigate the disparity of TMB in high- and low-risk categories, we utilized the “maftools” package to generate waterfall plots of the top 30 genes.14
Immunological Analyses
To compare the immune cell infiltration degree and quantity within the tumor immunological environment (TME) in the HCC risk groups, we applied single sample gene set enrichment analysis (ssGSEA).15 Various algorithms and the Tumor Immune Estimation Resource (TIMER) (http://timer.comp-genomics.org/) have also been employed to evaluate immune cell infiltration.16 The immune checkpoint suppression in the two groups was evaluated based on the findings of Zhang Z et a.l17 Besides, we applied the GEPIA database18 to examine the correlations with 2-GMGs expression levels and cellular immune-associated markers.
Immunotherapy Response and Drug Sensitivity
The Tumor Immune Dysfunction and Exclusion (TIDE) score was exerted to apprize the immunotherapy response in individual patients with HCC.19 By leveraging the “oncoPredict” R package,20 we compared the chemosensitivity patterns of high-risk and low-risk cohorts through analysis of the half-maximal inhibitory concentration (IC50) values of widely-used medicines. This approach facilitated an assessment of differences in treatment effectiveness in the two cohorts.
Immunohistochemistry
The information of thirty patients with liver cancer was from the People’s Hospital in the Guangxi Zhuang Autonomous Region. The samples were subjected to paraffin fixation, cut into continuous slices, and overnight incubation at 4°C with rabbit RRM2 (Proteintech, 11661-1-AP) and G6PD (Proteintech, 25413-1-AP) polyclonal antibodies. Following that, the tissue slices underwent staining with hematoxylin and eosin (HE). Immunohistochemical staining was conducted with a Universal Two-Step Detection Kit (Mouse/Rabbit Enhanced Polymer Detection System) (ZSGB-BIO, PV-9000). The antigen concentration, distribution density, labelling methodology employed, and drug sensitivity rate were ascertained along with the quantifying the number of positively stained cells during the immunohistochemical labelling process. A higher antibody content is associated with a larger positive result distribution density and brighter color development. Tawny is a medium positive marker, dark brown is a strong positive marker, pale yellow is a mildly positive marker, and blue is a negative marker.
Statistical Analysis
Data analyses were conducted utilizing R software. The evaluation of predictive accuracy was conducted through measurement of the area under the curve (AUC). We implemented a Pearson correlation analysis to appraise the associations of risk score and TMB score. To apprize the overall survival (OS) of two risk groups, Kaplan-Meier analysis and log rank tests were employed. The two groups’ differences in tumor purity, TIDE, stromal score, immune cell abundance, immunological function, and ESTIMATE Score were compared using non-parametric testing. Continuous variables were analyzed via the Wilcoxon test. Meanwhile, Cox proportional hazard regression models were applied to pinpoint the independent prognostic factors linked to overall survival. A p-value below 0.05 was designated as the cut-off for statistical significance across all analyses. The levels of significance were classified as follows: ns (not significant), *p < 0.05 (significant), **p < 0.01 (very significant), ***p < 0.001 (extremely significant), **** p < 0.0001 (extremely significant).
Results
Data Collection and Processing
Utilizing the TCGA website, we obtained transcriptome profiles, gene expression data, and pertinent clinical details pertaining to LIHC patients. Furthermore, the glutathione gene set was downloaded from the Molecular Signatures Database. The analysis of the expression profiles of HCC samples taken from the TCGA database aimed to identify glutathione genes linked to prognosis and crucial factors that govern the emergence and progression of HCC. Notably, 9416 genes were discovered to exhibit significant differential expression (| Log2FC|>1, p<0.05). We intersected 9416 DEGs with 50 genes related to glutathione metabolism using the Venny website to create a Venn diagram (Figure 1A). This resulted in 7 candidate genes (GSTZ1, GSTM5, GGT5, GSTA2, GSTA4, G6PD, and RRM2) and the volcano plot illustrated that 4 DEGs down-regulated and 3 DEGs up-regulated (Figure 1B). To delve deeper into the biological mechanisms underlying the observed phenomena, we exerted the R package “clusterProfiler” to conduct Gene Ontology (GO) analysis and Kyoto Encyclopedia of Genes and Genomes (KEGG) annotation. We discovered notable enrichment in the glutathione metabolism pathway (Figure 1C and D).
 |
Figure 1 Identification and functional profiling of key genes. (A) Venn diagram illustrating the intersection of the two databases. (B) A heatmap depicting DEGs within the TCGA cohort. (C) GO analysis of metabolic processes and cellular responses, including glutathione metabolism and drug metabolism pathways. (D) The KEGG pathway analysis of gene ratios and p-values for various metabolic and cellular processes. |
Construction and Validation of 2-GMGs Risk Signature for HCC Prognosis
In order to avoid excessive variables that may lead to overfitting, we performed LASSO regression on the aforementioned seven genes to refine the selection of genes. LASSO analysis identified 7 candidate genes and two model genes were finally selected: RRM2 and G6PD (Figure 2A and B). The TCGA cohort’s HCC sufferers were categorized into high-stake and bitsy-risk categories with a median risk score as the boundary. Scatter plots effectively represent survival and death in both groups at different times. The high-risk group expressed superior levels of G6PD and RRM2 and poorer prognosis (Figure 2C). Kaplan-Meier survival analysis represented the overall survival of these groups, revealing that high-risk patients had worse survival (Figure 2D). Furthermore, we applied the ROC curve to appraise the model’s prognostic capability. The AUC was 0.767 at year 1, 0.666 at year 3, and 0.623 at year 5. All three indicators were greater than 0.5, indicating that the model has good predictive value (Figure 2E).
 |
Figure 2 Development and Validation of a Gene-Expression-Based Prognostic Signature. (A and B) LASSO regression model to identify prognostic genes. (C) Risk score distribution, survival analysis, and heatmap for the RRM2 and G6PD genes in the TCGA-HCC cohort. (D) OS comparison between the two HCC risk groups. (E)The time ROC curve with AUC values and 95% CIs. |
Performance Comparison of Machine Learning Algorithms
Figure 3A-C present a detailed contrast of the precision in three machine learning (ML) models (CatBoost, GBDT, GBM) in predicting the occurrence of HCC. We exerted the area under the AUC to apprize the capability of models. The results indicated that the CatBoost model performed the best, with an AUC value of 0.641 and a specificity of 0.847, indicating that this model has the most precise prediction rate. In order to visually represent the importance of certain variables, we utilized SHAP to demonstrate the impact of per gene on the development of HCC in our model. As represented in Figure 3D, these values are displayed in descending order: RRM2, G6PD, GSTA4, GSTM5, GSTZ1, GGT5, and GSTA2. RRM2 and G6PD are identified as the two most critical gene features in the predictive model. In Figure 3E each feature significance line has yellow representing high-risk values, while maroon indicates low-risk values. We observed that elevated scores of RRM2 and G6PD increase the risk of HCC occurrence. As depicted in Figure 3F and G, genes in yellow imply a reduction in the risk of HCC development, while those in maroon signify an increase in HCC risk. Therefore, RRM2 and G6PD enhance the risk of HCC occurrence. Furthermore, we analyzed the interaction between RRM2 and G6PD levels using SHAP interaction values. The plot reveals that as the RRM2 value increases, the SHAP value also gradually increases, indicating that RRM2’s contribution to the model’s predictive outcome grows with its value. Additionally, we observed that samples with higher G6PD values (yellower colors) exhibit relatively higher SHAP values when RRM2 values are high (Figure 3H).
 |
Figure 3 ROC curves of the test and validation set of ML models. (A) ROC curves of the CatBoost. (B) ROC curves of the GBDT. (C) ROC curves of the GBM. (D) CatBoost feature importance ranking. (E) SHAP value scatter plot for feature impact. (F) SHAP waterfall plot. (G) SHAP force plot. (H) Feature dependency plot. |
Development and Validation for Nomogram
The associations of clinical indicators (gender, age, T, M, and N classifications, grading, and staging) with the risk score were analyzed in this investigation. The results indicated that risk score was higher during the early and intermediate stages of pathological staging, which implied a poorer prognosis at this stage (Supplementary Figure S1). We employed both multifactorial and unifactorial Cox regression analyses to elucidate the link between risk elements and clinical outcome and determine independent risk factors in HCC suffers (Figure 4A and B). The analyses represent a significant link between T stage, M stage, risk score and survival in hepatocellular carcinoma patients. Furthermore, these factors could be used as independent diagnostic predictors of hepatocellular carcinoma. To improve the accuracy of the model’s clinical application, we constructed column-line plots with age, gender, grade, stage, TMN staging, and riskscore as predictors of 1-, 3-, and 5-year survival probabilities of survival in HCC individuals (Figure 4C). The column-line plot results indicate that the riskscore had the greatest impact on predicting overall survival (OS). To assess the forecasting precision of the factors, we conducted the ROC analysis. The ROC plots indicate that the riskscore, stage, and T characteristics had highly predictive accuracy in OS (Figure 4D). The time-ROC curve acts as a measure to appraise the model’s forecasting capabilities (Figure 4E). The AUCs at O.S for 1, 3, and 5 years were 0.764, 0.666, and 0.606, respectively. This outcome suggests that the model demonstrates a satisfactory level of predictive accuracy. The calibration plot shows that the column line plots show a high degree of precision in forecasting 1-,3-, and 5-year survival outcomes (Figure 4F). Moreover, an extensive assessment was carried out to determine the significance of clinical decision-making using both decision curve analysis and consistency index evaluation (Figure 4G and H). The findings showed that the riskScore factor model was the most accurate predictor within the validity interval. In summary, the model exhibits superior clinical predictive precision, thereby validating its significance in practical applications.
 |
Figure 4 Predictive performance of clinical variables and risk score in hepatocellular carcinoma survival. (A and B) Forest plot of multifactorial and unifactorial Cox regression analysis for various clinical variables (Age, Grade, Stage, T, M, N, riskScore) and their association with survival outcomes. (C) Nomogram for predicting the probability of model. (D) Time-dependent ROC curves make a contrast of riskScore performance and other clinical variables. (E) ROC curves of 1-, 3-, and 5-year survival prediction. (F) Calibration curves validating the nomogram’s predictions against actual survival outcomes at 1, 3, and 5 years. (G) C-index trends over time for the riskScore, age, grade and stage. (H) Decision curve analysis for predictive model utility. |
Immune Cell Infiltration in High and Low Risk Groups
Immunotherapy plays a crucial role in tumor treatment. Therefore, we conducted immunoassays on cells and functions related to the prognostic model of GMGs (Figure 5A). Eight immune cell types exhibited marked differences in expression levels between the groups. More specifically, the expressive level of activated Dendritic Cells(aDCs), immature Dendritic Cells(iDCs), macrophages, Th1 cells, Th2 cells, an T regulatory (Treg) cells were superior in the high-risk group, whereas mast cells and natural killer (NK) cells were expressed at poorer levels. Furthermore, we conducted immunological analyses to ascertain the relevant functions. The high-risk group displayed elevated higher levels of antigen-presenting cell (APC) co-stimulation, check-point molecules, human leukocyte antigen (HLA), major histocompatibility complex (MHC) class I molecules, T cell co-inhibition markers, and T cell co-stimulation factors (Figure 5B–D). These findings suggest a more intense immune regulatory environment in high-risk individuals. It is noteworthy that the Type I IFN (interferon) response was lower in this group. Based on these findings, we conclude that immunotherapy exhibits superior therapeutic effects in high-risk patient populations. To further explore the intricate relationships between risk score and tumor cell purity, stromal score, immune score, and ESTIMATE score, we conducted additional detailed analyses (Figure 5E). However, only the immunity score showed the significant differences in two groups. The high-risk group had superior immunological status, as evidenced by reduced tumor purity and a higher proportion or frequency of immune cells.
 |
Figure 5 Gene expression characterization and cellular infiltration analysis in high and low-risk groups for hepatocellular carcinoma. (A and B) Box plots comparing the distribution of immune scores and immune function across different groups. (C) Scatter plot displaying the expression levels of various immune checkpoint between in two groups. (D) Analysis of HLA gene expression. ns (not significant), *p< 0.05, **p< 0.01, ***p< 0.001, **** p < 0.0001. (E) Comparison of two risk groups in different score. |
Genetic Variation and Tumor Mutation Burden Analysis
Analysis of the mutational profiles of hepatocellular carcinoma patients revealed significant disparities in the frequency of mutations between the high- and low-risk groups (Figure 6A and B). Furthermore, tumor Protein p53 (TP53) and Catenin Beta 1(CTNNB1) were found to exhibit the maximum value of mutations within the top 30 genes. Notably, the high-stake group is possessed of the lower incidence of common mutations relative to the other group. We conducted a number of in-depth analyses to delve deeper into the complex correlation of risk scores and TMB scores (Figure 6C). These consequences interpreted a positive correlation between them, indicating that risk scores are proportional to TMB scores. Notably, our findings revealed that patients with a high TMB score exhibited a significantly lower survival rate, indicating the prognostic significance of TMB in these patients. By combining TMB and risk score, patients can be divided into four subgroups (Figure 6D and E). Our study indicated that individuals with both elevated risk scores and TMB exhibited the poorest clinical outcomes, in contrast to those with lower risk scores and TMB levels demonstrated the best prognosis. Therefore, a more potent predictor of the clinical outcome of hepatocellular carcinoma sufferers is the integration of the TMB and risk score.
 |
Figure 6 Relationship between TMB and risk score in HCC. (A and B) The mutation profiles of the top30 genes in both groups. (C) Tumor mutation burden and risk score. (D and E) Survival analysis based on TMB and the risk score. |
2-GMGs Predict Sensitivity to Chemotherapy
TIDE can serve as a measure of response to tumor immunotherapy. In the TCGA cohort, the TIDE score was poorer in the high-risk group, suggesting that tumor immunotherapy had a better effect on this population (p<0.05) (Figure 7L). We assessed the 2-GMGs’ forecasting capability for chemosensitivity by the Genomics of Drug Sensitivity in Cancer (GDSC) database (https://www.cancerrxgene.org/) to improve the precision of medication therapy. We additionally evaluated the disparities in chemosensitivity on the two groups and found that 11 drugs had a significant difference in chemosensitivity between high- and low-risk groups. Axitinib, sorafenib, gemcitabine, leflunomide, entospletinib, selumetinib and KRAS (G12C) inhibitor-12 have comparatively increased IC50 values within the high-risk group (Figure 7A–K), representing that they are fewer effective drugs in the clinical treatment on this specific patient population. Gefitinib, Dasatinib, 5-Fluorouracil and Lapatinib had lower IC50s and more effective in the high-risk group.
 |
Figure 7 The 2-GMGs signature predicts chemotherapy sensitivity. (A) Axitinib (B) Sorafenib (C) Gemcitabine (D) Leflunomide (E) Entospletinib (F) Gefitinib, (G) Dasatinib, (H) 5-Fluorouracil, (I) Lapatinib, (J) Selumetinib and (K) KRAS (G12C) Inhibitor-12. (L) TIDE score in the two-risk group. *p< 0.05. |
Correlation Between RRM2 and G6PD Expression and Immune Biomarkers in HCC
Using the TIMER database to comprehensively evaluate the relationship between RRM2 and G6PD expression and immunological cell penetration in HCC, we observed the expression levels of both genes have a positive association with the penetration of B cells, CD8+ T cells, CD4+ T cells, macrophages, neutrophils, and dendritic cells (Figure 8A and B). The GEPIA database revealed that markers of cellular immunity are strongly associated with RRM2 and G6PD expression levels (Table 1 and Supplementary Table 1). Therefore, there was a strong relation between biomarkers of immune cells and RRM2 and G6PD by the analyses conducted using both the TIMER and GEPIA databases.
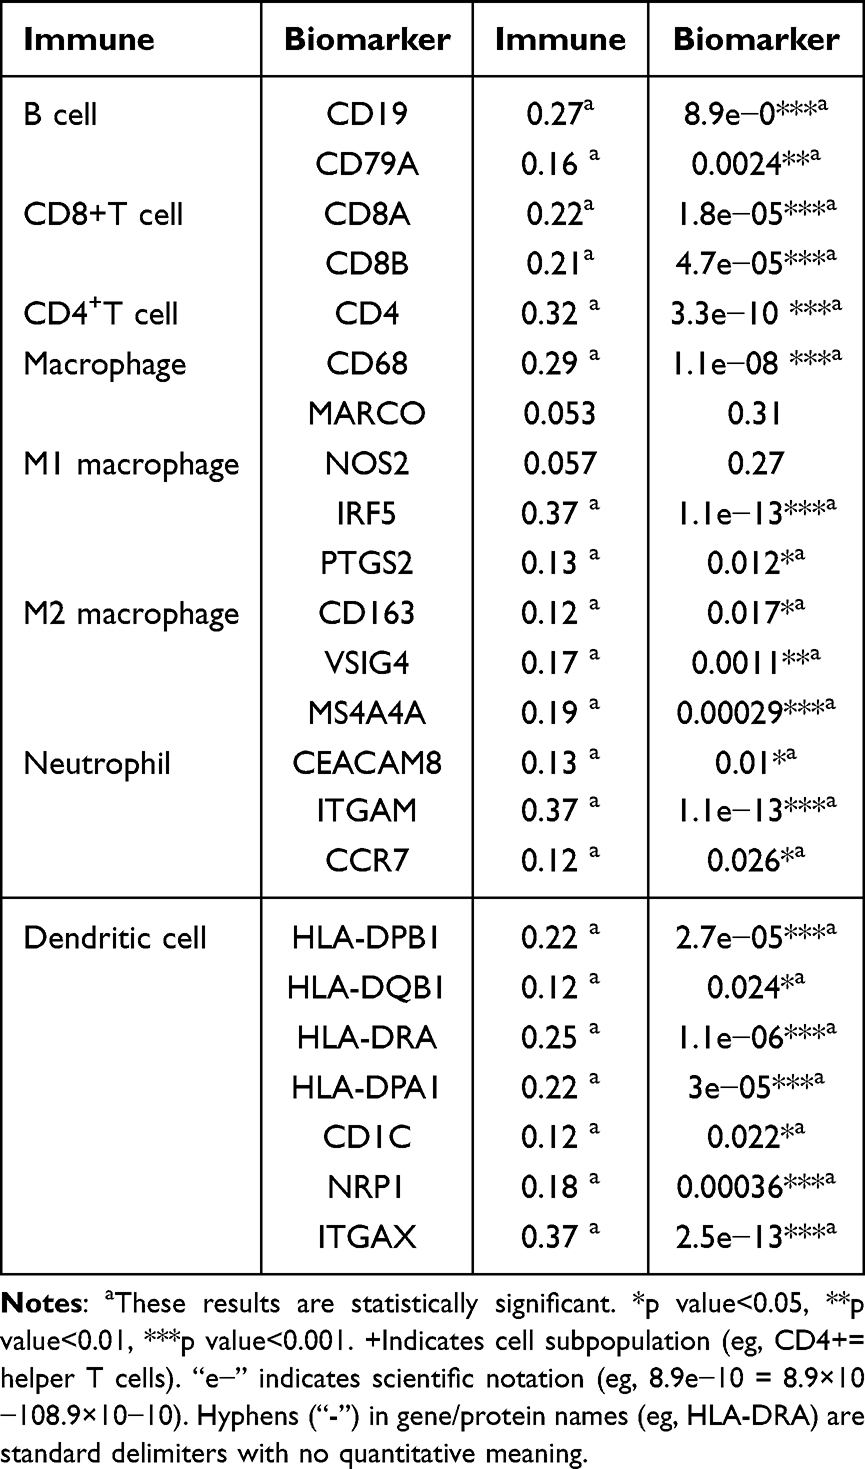 |
Table 1 GEPIA Database-Derived Association Analysis Between RRM2 and Cellular Immune-Associated Markers (Correlation Coefficient: Spearman) |
 |
Figure 8 Correlation between immunological cell penetration levels and 2-GMGs across hepatocellular carcinoma. (A) Relationship between RRM2 expression and immunological cell infiltration levels in HCC. (B) Relationship between G6PD expression and immunological cell infiltration levels in HCC. |
Diagnostic and Prognostic Value of RRM2 and G6PD Expression
To confirm the reliability of our analyses, we analyzed 30 samples of hepatocellular carcinoma and 30 normal samples and revealed that RRM2 and G6PD were up-regulated in HCC. Regarding RRM2, hepatic cancer tissue exhibited an average positive area of 2,581,522.233 m2 and an average optical intensity of 0.606860114. In contrast, on-carcinogenic liver tissue had an average area of positive measurement of 3,114,623.983 m2 and an average optical intensity of 0.569471938. The results revealed a larger positive area in neoplasm tissue relative to benign tissue and examining the t-test outcomes revealed (Figure 9A and B). For G6PD, the mean positive in cancerous tissue was 1,068,668.8 m2 with an optical intensity of 0.551651749, in contrast the mean positive in non-cancerous tissue was 236,739.4667 m2 with an average optical intensity of 0.451987581. A notable figure below 0.0001 (p<0.05) was observed, highlighting the stark contrast in data between the two groups, with the cancerous group exhibiting a larger area of positive coloring compared to the normal group. These studies confirmed the notably elevated presence of RRM2 and G6PD in cancerous tissues (Figure 9C and D), which is consistent with the validation results of the GSE87630 dataset (Figure 9E and 9F). ROC curve analysis showed that RRM2 (AUC: 0.962) and G6PD (AUC: 0.952) both had high predictive value for the diagnosis of HCC (Figure 10A and B). Using KM curves, we also separately apprize the connection between RRM2 and G6PD and the survival of HCC. Figure 10C and D individually show that the expression of RRM2 and G6PD was inversely linked with the survival rate of HCC patients.
 |
Figure 9 Immunohistochemical validation and expression of G6PD and RRM2. (A) Immunohistochemical analysis of RRM2 in neoplasm group and normal groups. Scale bar: 100 μm, 10× objective + 10× eyepiece, total 100× magnification. (B) Immunohistochemical analysis of G6PD in the tumor group and normal groups. Scale bar: 100 μm, 10× objective + 10× eyepiece, total 100× magnification. (C) Making a contrast of RRM2 expression levels between cancer and benign tissues. **** p < 0.0001 (extremely significant). (D) Making a contrast of G6PD expression levels between cancer and benign tissues. **** p < 0.0001 (extremely significant). (E) The RRM2 expression levels in neoplasm and benign groups of the GSE87630 dataset. (F) The G6PD expression levels in neoplasm and benign groups of the GSE87630 dataset. |
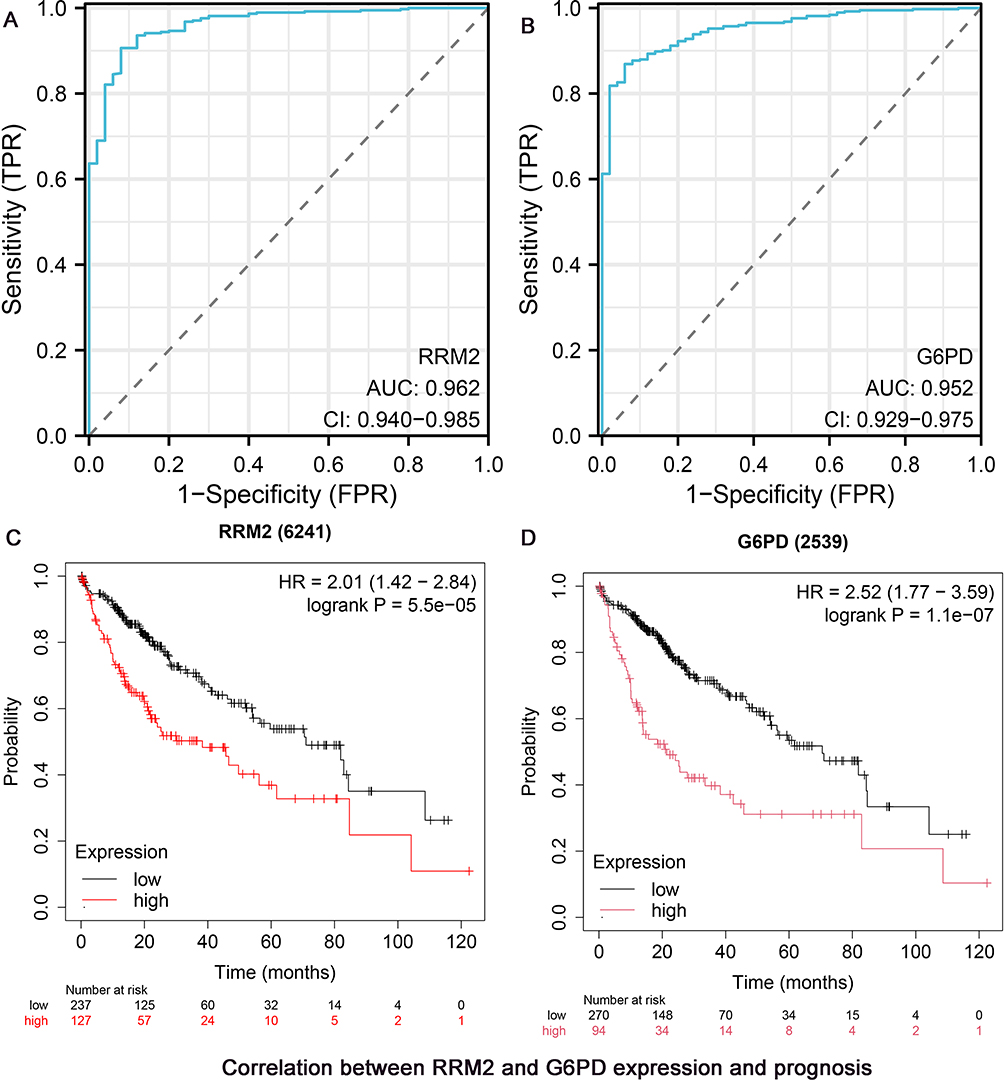 |
Figure 10 Correlation between RRM2 and G6PD expression and prognosis. (A) The ROC curve apprizes the diagnostic capability of RRM2. (B) The ROC curve apprizes the diagnostic capability of G6PD. (C) Survival analysis of RRM2. (D) Survival analysis of G6PD patients. |
Pan-Cancer Expression of 2-GMGs
To further elucidate the significance of 2-GMGs in tumor immune response, we examined the correlation between RRM2 and G6PD expressive levels and varying levels of immune cell penetration. The study found that B cells memory, dendritic cells resting, macrophages M0, mast cells resting, monocytes, T cells CD4 memory activated and T cells follicular helper in LICH were strongly associated (Figure 11A and B). We have also investigated 2-GMGs in other cancers. 2-GMGs were conducted within the TCGA dataset, which revealed that they were generally highly expressed, although KICH lowly expressed. (Figure 11C and D). Furthermore, the ESTIMATE algorithm was exerted to calculate the estimated scores for the immunological and stromal components. The findings revealed a notable correlation between the immunological score and 14 distinct types of cancer, and the stromal score exhibited a relationship with 19 different tumors. Among these factors, the immunological score was strongly positively correlated with almost cancers. However, the correlations between 19 cancers and the stromal score and ESTIMATE score were complex. LICH has a negative correlation with the ESTIMATE score but hardly have relation with stromal score and immune score (Figure 11E and F). To provide a clearer representation of the correlation between RRM2 and G6PD and various cancers, we analyzed the TMB score and Microsatellite Instability (MSI) score of both genes. The MSI radar plot revealed positive correlations between RRM2 and stomach adenocarcinoma (STAD), uterine corpus endometrial carcinoma (UCEC), colon adenocarcinoma (COAD), and liver intrahepatic cholangiocarcinoma (LICH) (Figure 12A). However, G6PD only had a positive relationship with kidney renal clear cell carcinoma (KIRC) (Figure 12B). In the TMB score, it was discovered that RRM2 and G6PD had positive associations with breast invasive carcinoma (BRCA) and KIRC (Figure 12C and D).
 |
Figure 11 Pan-Cancer expression disparities of RRM2 and G6PD and their correlations with immune infiltration and immune scores. (A) Correlations of different immune cell types among various neoplasms of RRM2. (B) Correlations of different immune cell types among various neoplasms ofG6PD. (C) Comparison of RRM2 expression levels across cancer types (tumor vs. normal). (D) Comparison of G6PD expression levels across cancer types (tumor vs. normal). (E) Correlations between RRM2 expression and immune scores. (F) Correlations betweenG6PD expression and immune scores. *p < 0.05 (significant), **p < 0.01 (very significant), ***p < 0.001 (extremely significant), ****p < 0.0001 (extremely significant). |
 |
Figure 12 Correlation analysis between 2-GMGs and MSI and TMB. (A) Correlation analysis between RRM2 and MSI. (B) Correlation analysis between G6PD and MSI. (C) Correlation analysis between RRM2 expression and TMB. (D) Correlation analysis between G6PD expression and TMB. *p < 0.05 (significant), **p < 0.01 (very significant). |
Discussion
Hepatocellular carcinoma, a malignant neoplasm of the digestive system, is known for its infiltrative capability and propensity for recurrence and is often accompanied by metastasis.21,22 Although surgical, pharmacological, and immunotherapeutic treatments have made remarkable progress, the post-treatment outcomes for HCC patients remains suboptimal. Numerous prognostic models for HCC have been developed previously, such as Tang Y developed a prognostic model for HCC based on three MVI-related genes (DBF4, ARG2 and SLC16A3).23 Wang W, who developed a prognostic model utilizing lipid metabolism to assess risk scores in HCC patients,24 and Hu R, who introduced a predictive model that estimated HCC risk through three DNA Damage Response (DDR)-related genes.25 Glutathione helps maintain the redox balance within cells by defending against these oxidative stresses, which can be effective in preventing HCC.26 If GSH is severely depleted, it may destroy its homeostasis and lead to abnormal cell proliferation and death. For instance, tumor necrosis factor-alpha (TNF-α)-induced apoptosis in mouse hepatocytes is more sensitive to GSH depletion.27,28 It is worth to mention that the groundbreaking study conducted by Huang et al demonstrated underlying mechanism for the elevation of glutathione levels in human liver cancer. Moreover, their research demonstrated that elevated GSH levels accelerate the development of liver tumor cells.29 However, there is currently few risks scoring system for hepatocellular carcinoma that is based on glutathione metabolism. Xu et al established a glutamine metabolism-associated prognostic model of HCC, which focused on single gene RRM1.30 In comparison, our study successfully developed a risk model based on GMGs (RRM2 and G6PD), which provide new options for predicting and improving the accuracy and validity of early diagnosis of liver cancer.
This study processed and identified HCC data from TCGA and a gene set related to glutathione metabolism, resulting in the identification of 7 candidate genes. To prevent overfitting, we used LASSO analysis and finally obtained two key glutathione metabolism genes (RRM2 and G6PD) to construct the model. Moreover, the SHAP value analysis highlighted RRM2 and G6PD as the most influential predictors, consistent with LASSO result and reinforcing the validity of the model output. The correlation between 2-GMGs and HCC expression was examined utilizing the GEPIA database and TIMER database, and prognostic analyses were carried out with the Kaplan-Meier plotter. The differential expression of RRM2 and G6PD was verified by immunohistochemistry, which demonstrated elevated expression levels in neoplasm tissues relative to under levels in control tissues.
Ribonucleotide reductase regulatory subunit M2 functions as an oncogene in various malignant tumors like breast cancer. Its over - expression indicates poor prognosis and is linked to immune infiltrates in HCC. Thus, RRM2 may serve as a momentous molecular biomarker for HCC diagnosis and posttreatment outcome.31 G6PD facilitates the encroachment and migration of hepatocellular carcinoma cells via inciting epithelial-mesenchymal transformation through the activation of signal transducer and activator of transcription 3 (STAT3) pathway.32
The median risk score was used as a dividing criterion to classify HCC patients into two risk groups to achieve a more precise prediction. Kaplan-Meier survival analysis revealed extensive variability in clinical survival, revealing that high-risk patients presented shorter lifetime. Both multifactorial and unifactorial Cox regression analyses independently confirmed the prognostic value of the model’s risk score as a standalone indicator. Additionally, ROC curve and calibration curve analyses illustrated the exceptional prognosticative capability of the 2-GMGs model in assessing the survival outcomes of HCC patients. To enhance the predictive ability of 2-GMGs features and demonstrate their practical value in prognosticating hepatocellular carcinoma patients, we formulated nomograms utilizing diagnostic factors and risk scores. Our findings indicate that 2-GMGs features exhibit superior predictive efficacy compared to clinicopathological characteristics, enabling a more precise prognostication of the clinical outcomes of HCC patients. This information could provide a basis for clinicians’ decision-making. The model’s excellent predictive ability was reconfirmed.
Numerous studies have demonstrated the significant role of TME in tumorigenesis and development,33,34 including its ability to promote immune escape and inflammation formation. The ssGSEA results indicate high expression of aDCs, macrophages, Treg, HLA, and MHC_class_I in the high-risk group, and the initial three individuals have been shown to promote tumor growth.35,36 Therefore, weakened anti-tumor immunity in high-risk groups may contribute to their poor prognosis.
We additionally compared the expression of 2-GMGs with immune cell indicators in HCC using the GEPIA and TIMER databases. The results represented that their expression performed positively correlation with B cells, CD8+ T cells, CD4+ T cells, macrophages, neutrophils, and dendritic cell infiltration levels. These findings imply an inverse link between 2-GMGs expression and infiltrating immune cells.
In recent years, there has been a growing identification of immunological checkpoints that hinder anti-tumor immunity in carcinomas. These include cytotoxic T lymphocyte-associated antigen 4 (CTLA-4) and programmed cell death ligand 1 (PD-L1).37 Furthermore, immunotherapy based on immune checkpoint inhibitors has accomplished relatively satisfactory results in clinical practice. The majority of immunological checkpoints and HLAs were expressed at superior levels in high-risk patients, representing that patients may benefit more from ICB therapy.
The sensitivity of different patient groups to specific drugs was also assessed. Axitinib and Sorafenib are both important and efficacious pharmacological agents utilized in the management of advanced HCC, with antitumor activity and controlled toxicity. They belong to the first line of treatment for this condition.38,39 The prediction results revealed that sensitivity of Axitinib and Sorafenib was elevated in the low-risk group, suggesting that the therapeutic benefits conferred by targeted therapy might be more pronounced in this group. Consistent results were also observed for Gemcitabine, Leflunomide, Entospletinib, Selumetinib and KRAS (G12C) Inhibitor-12. However, the high-risk group exhibited lower IC50 levels for 5-fluorouracil, afatinib, dasatinib, lapatinib, and gefitinib, suggesting that this group may exhibit greater sensitivity to these drugs, revealing potential chemotherapy and targeted therapy options for HCC.
In summary, a novel prognostic model was constructed based on two 2-GMGs and provides a new theory for prognostic assessment and therapeutic options for HCC patients. The risk score of the model was established as a reliable and accurate predictive marker for HCC and exhibited good accuracy and confidence.
However, this study has some limitations. This research primarily emphasized bioinformatics analysis and lacked experimental confirmation beyond in vivo experiments. Consequently, it is crucial to gather further clinical data to confirm the precision of the risk score. Furthermore, the current sample size is inadequate, thus necessitating its expansion in the future.
Conclusion
A novel prognostic model for HCC patients has been successfully established and validated. This model is based on GSH-related genes and provides accurate predictions for clinical decision-making, prognostic assessment, and immunotherapy for HCC patients. It also enables clinicians to better personalize treatment for HCC patients.
Abbreviations
GSH, Glutathione; HCC, Hepatocellular carcinoma; LIHC, Liver Hepatocellular Carcinoma; GMGs, glutathione metabolism genes; DEGs, differentially expressed genes; RRM2, Ribonucleotide Reductase; G6PD, Glucose-6-phosphate dehydrogenase; SHAP, SHapley Additive exPlanations; TMB, tumor mutation burden; ROC, receiver operating characteristic; TME, tumor immunological environment; ssGSEA, single sample gene set enrichment analysis; TIDE, Tumor Immune Dysfunction and Exclusion; IC50, half-maximal inhibitory concentration; HE, hematoxylin and eosin; AUC, area under the curve; OS, overall survival; GO, Gene Ontology; KEGG, Kyoto Encyclopedia of Genes and Genomes; GDSC, Genomics of Drug Sensitivity in Cancer; TCGA, The Cancer Genome Atlas Program; STAT3, signal transducer and activator of transcription 3; CTLA-4, cytotoxic T lymphocyte-associated antigen 4; PD-L1, programmed cell death ligand 1; TNF, Tumor necrosis factor; OS, Overall Survival; aDCs, Activated Dendritic Cells; iDCs:Immature Dendritic Cells; Treg, Regulatory T Cells; NK:Natural Killer Cells; APC:Antigen-Presenting Cell; HLA, Human Leukocyte Antigen; MHC:Major Histocompatibility Complex; IFN, Interferon; TP53, Tumor Protein p53; CTNNB1, Catenin Beta 1; MSI, Microsatellite Instability; STAD, Stomach Adenocarcinoma; UCEC, Uterine Corpus Endometrial Carcinoma; COAD, Colon Adenocarcinoma; LICH, Liver Intrahepatic Cholangiocarcinoma; KIRC, Kidney Renal Clear Cell Carcinoma; BRCA, Breast Invasive Carcinoma; DDR, DNA Damage Response.
Data Sharing Statement
Publicly available datasets were analyzed in this study. These data can be found here: The Cancer Genome Atlas Program (TCGA) and Molecular Signatures Database (MSigDB).
Ethical Approval Statement
The study, including the use of publicly available data, was approved by the Ethics Committee of People’s Hospital of Guangxi Zhuang Autonomous Region in accordance with the ethical guidelines of the Declaration of Helsinki (Approval No. KY-KJT-2023-282).
Acknowledgments
The authors express their gratitude to the members for their contributions to this effort.
Author Contributions
All authors made a significant contribution to the work reported, whether that is in the conception, study design, execution, acquisition of data, analysis and interpretation, or in all these areas; took part in drafting, revising or critically reviewing the article; gave final approval of the version to be published; have agreed on the journal to which the article has been submitted; and agree to be accountable for all aspects of the work.
Funding
Natural Science Foundation of Guangxi Province [grant No:2017GXNSFAA198063]and Guangxi Medical University’s Basic Medical Science and Technology Innovation Training Fund Project [grant No: 202010598020] sponsored this research.
Disclosure
The authors state that the study was carried out without any commercial or financial connections that could be considered a potential conflict of interest.
References
1. Bray F, Laversanne M, Sung H, et al. Global cancer statistics 2022: GLOBOCAN estimates of incidence and mortality worldwide for 36 cancers in 185 countries. CA Cancer J Clin. 2024;74(3):229–20. doi:10.3322/caac.21834
2. Lu WP, Dong JH. Hepatectomy for hepatocellular carcinoma in the era of liver transplantation. World J Gastroenterol. 2014;20(28):9237–9244. doi:10.3748/wjg.v20.i28.9237
3. Akoad ME, Pomfret EA. Surgical resection and liver transplantation for hepatocellular carcinoma. Clin Liver Dis. 2015;19(2):381–399. doi:10.1016/j.cld.2015.01.007
4. Yao-min W, Ya-ling L. Advances in molecular targeted drugs for hepatocellular carcinoma. J Sun Yat-Sen Univ. 2023;44(6):915–924. doi:10.13471/j.cnki.j.sun.yat-sen.univ(med.sci).2023.0605
5. Forner A, Reig M, Bruix J. Hepatocellular carcinoma. Lancet. 2018;391(10127):1301–1314. doi:10.1016/s0140-6736(18)30010-2
6. Chidambaranathan-Reghupaty S, Fisher PB, Sarkar D. Hepatocellular carcinoma (HCC): epidemiology, etiology and molecular classification. Adv Cancer Res. 2021;149:1–61. doi:10.1016/bs.acr.2020.10.001
7. Fitzmaurice C, Abate D, Abbasi N, et al. Global, regional, and national cancer incidence, mortality, years of life lost, years lived with disability, and disability-adjusted life-years for 29 cancer groups, 1990 to 2017: a systematic analysis for the global burden of disease study. JAMA Oncol. 2019;5(12):1749–1768. doi:10.1001/jamaoncol.2019.2996
8. Vogel A, Meyer T, Sapisochin G, Salem R, Saborowski A. Hepatocellular carcinoma. Lancet. 2022;400(10360):1345–1362. doi:10.1016/s0140-6736(22)01200-4
9. Forman HJ, Zhang H, Rinna A. Glutathione: overview of its protective roles, measurement, and biosynthesis. Mol Aspects Med. 2009;30(1–2):1–12. doi:10.1016/j.mam.2008.08.006
10. Ye Y, Yu B, Wang H, Yi F. Glutamine metabolic reprogramming in hepatocellular carcinoma. Front Mol Biosci. 2023;10:1242059. doi:10.3389/fmolb.2023.1242059
11. Hu X, He Y, Han Z, et al. PNO1 inhibits autophagy-mediated ferroptosis by GSH metabolic reprogramming in hepatocellular carcinoma. Cell Death Dis. 2022;13(11):1010. doi:10.1038/s41419-022-05448-7
12. Wanbiao Z, Jing M, Shi Z, Tengxiang C, Xueke Z, Haiyang L. MIA3 promotes the degradation of GSH (glutathione) by binding to CHAC1, thereby promoting the progression of hepatocellular carcinoma. Mol Cell Biochem. 2023. doi:10.1007/s11010-023-04850-9
13. Jiang S, Ren X, Liu S, et al. Integrated analysis of the prognosis-associated RNA-binding protein genes and candidate drugs in renal papillary cell carcinoma. Front Genet. 2021;12:627508. doi:10.3389/fgene.2021.627508
14. Mayakonda A, Lin DC, Assenov Y, Plass C, Koeffler HP. Maftools: efficient and comprehensive analysis of somatic variants in cancer. Genome Res. 2018;28(11):1747–1756. doi:10.1101/gr.239244.118
15. Barbie DA, Tamayo P, Boehm JS, et al. Systematic RNA interference reveals that oncogenic KRAS-driven cancers require TBK1. Nature. 2009;462(7269):108–112. doi:10.1038/nature08460
16. Li T, Fu J, Zeng Z, et al. TIMER2.0 for analysis of tumor-infiltrating immune cells. Nucleic Acids Res. 2020;48(W1):W509–W514. doi:10.1093/nar/gkaa407
17. Zhang Z, Mao M, Wang F, et al. Comprehensive analysis and immune landscape of chemokines- and chemokine receptors-based signature in hepatocellular carcinoma. Front Immunol. 2023;14:1164669. doi:10.3389/fimmu.2023.1164669
18. Tang Z, Li C, Kang B, Gao G, Li C, Zhang Z. GEPIA: a web server for cancer and normal gene expression profiling and interactive analyses. Nucleic Acids Res. 2017;45(W1):W98–W102. doi:10.1093/nar/gkx247
19. Jiang P, Gu S, Pan D, et al. Signatures of T cell dysfunction and exclusion predict cancer immunotherapy response. Nat Med. 2018;24(10):1550–1558. doi:10.1038/s41591-018-0136-1
20. Maeser D, Gruener RF, Huang RS. oncoPredict: an R package for predicting in vivo or cancer patient drug response and biomarkers from cell line screening data. Brief Bioinform. 2021;22(6). doi:10.1093/bib/bbab260
21. Llovet JM, Kelley RK, Villanueva A, et al. Hepatocellular carcinoma. Nat Rev Dis Primers. 2021;7(1):6. doi:10.1038/s41572-020-00240-3
22. Sung H, Ferlay J, Siegel RL, et al. Global cancer statistics 2020: GLOBOCAN estimates of incidence and mortality worldwide for 36 cancers in 185 countries. CA Cancer J Clin. 2021;71(3):209–249. doi:10.3322/caac.21660
23. Tang Y, Xu L, Ren Y, et al. Identification and validation of a prognostic model based on three MVI-related genes in hepatocellular carcinoma. Int J Biol Sci. 2022;18(1):261–275. doi:10.7150/ijbs.66536
24. Wang W, Zhang C, Yu Q, et al. Development of a novel lipid metabolism-based risk score model in hepatocellular carcinoma patients. BMC Gastroenterol. 2021;21(1):68. doi:10.1186/s12876-021-01638-3
25. Hu R, Liang X, Li Q, Liu Y. Risk predictive model based on three DDR-related genes for predicting prognosis, therapeutic sensitivity, and tumor microenvironment in hepatocellular carcinoma. J Oncol. 2022;2022:4869732. doi:10.1155/2022/4869732
26. Yuan L, Kaplowitz N. Glutathione in liver diseases and hepatotoxicity. Mol Aspects Med. 2009;30(1–2):29–41. doi:10.1016/j.mam.2008.08.003
27. Matsumaru K, Ji C, Kaplowitz N. Mechanisms for sensitization to TNF-induced apoptosis by acute glutathione depletion in murine hepatocytes. Hepatology. 2003;37(6):1425–1434. doi:10.1053/jhep.2003.50230
28. Nagai H, Matsumaru K, Feng G, Kaplowitz N. Reduced glutathione depletion causes necrosis and sensitization to tumor necrosis factor-alpha-induced apoptosis in cultured mouse hepatocytes. Hepatology. 2002;36(1):55–64. doi:10.1053/jhep.2002.33995
29. Huang ZZ, Chen C, Zeng Z, et al. Mechanism and significance of increased glutathione level in human hepatocellular carcinoma and liver regeneration. FASEB J. 2001;15(1):19–21. doi:10.1096/fj.00-0445fje
30. Xu H, Pan H, Fang L, Zhang C, Xiong C, Cai W. A glutamine metabolish-associated prognostic model to predict prognosis and therapeutic responses of hepatocellular carcinoma. Biol Direct. 2024;19(1):118. doi:10.1186/s13062-024-00567-x
31. Qin Z, Xie B, Qian J, et al. Over-expression of RRM2 predicts adverse prognosis correlated with immune infiltrates: a potential biomarker for hepatocellular carcinoma. Front Oncol. 2023;13:1144269. doi:10.3389/fonc.2023.1144269
32. Lu M, Lu L, Dong Q, et al. Elevated G6PD expression contributes to migration and invasion of hepatocellular carcinoma cells by inducing epithelial-mesenchymal transition. Acta Biochim Biophys Sin. 2018;50(4):370–380. doi:10.1093/abbs/gmy009
33. Bejarano L, Jordāo MJC, Joyce JA. Therapeutic targeting of the tumor microenvironment. Cancer Discov. 2021;11(4):933–959. doi:10.1158/2159-8290.Cd-20-1808
34. Owusu BY, Galemmo R, Janetka J, Klampfer L. Hepatocyte growth factor, a key tumor-promoting factor in the tumor microenvironment. Cancers. 2017;9(4). doi:10.3390/cancers9040035
35. Laplane L, Duluc D, Bikfalvi A, Larmonier N, Pradeu T. Beyond the tumour microenvironment. Int J Cancer. 2019;145(10):2611–2618. doi:10.1002/ijc.32343
36. Chen D, Zhang X, Li Z, Zhu B. Metabolic regulatory crosstalk between tumor microenvironment and tumor-associated macrophages. Theranostics. 2021;11(3):1016–1030. doi:10.7150/thno.51777
37. Xu F, Jin T, Zhu Y, Dai C. Immune checkpoint therapy in liver cancer. J Exp Clin Cancer Res. 2018;37(1):110. doi:10.1186/s13046-018-0777-4
38. Kudo M, Motomura K, Wada Y, et al. Avelumab in combination with axitinib as first-line treatment in patients with advanced hepatocellular carcinoma: results from the Phase 1b VEGF liver 100 trial. Liver Cancer. 2021;10(3):249–259. doi:10.1159/000514420
39. Llovet JM, Ricci S, Mazzaferro V, et al. Sorafenib in advanced hepatocellular carcinoma. N Engl J Med. 2008;359(4):378–390. doi:10.1056/NEJMoa0708857
 © 2026 The Author(s). This work is published and licensed by Dove Medical Press Limited. The
full terms of this license are available at https://www.dovepress.com/terms
and incorporate the Creative Commons Attribution
- Non Commercial (unported, 4.0) License.
By accessing the work you hereby accept the Terms. Non-commercial uses of the work are permitted
without any further permission from Dove Medical Press Limited, provided the work is properly
attributed. For permission for commercial use of this work, please see paragraphs 4.2 and 5 of our Terms.
© 2026 The Author(s). This work is published and licensed by Dove Medical Press Limited. The
full terms of this license are available at https://www.dovepress.com/terms
and incorporate the Creative Commons Attribution
- Non Commercial (unported, 4.0) License.
By accessing the work you hereby accept the Terms. Non-commercial uses of the work are permitted
without any further permission from Dove Medical Press Limited, provided the work is properly
attributed. For permission for commercial use of this work, please see paragraphs 4.2 and 5 of our Terms.