Back to Journals » Therapeutics and Clinical Risk Management » Volume 19
A Novel Nomogram to Predict Symptomatic Intracranial Hemorrhage in Ischemic Stroke Patients After Intravenous Thrombolysis
Authors Jiang Z ![]() , Xu D, Li H, Wu X
, Xu D, Li H, Wu X
Received 11 September 2023
Accepted for publication 12 November 2023
Published 29 November 2023 Volume 2023:19 Pages 993—1003
DOI https://doi.org/10.2147/TCRM.S436145
Checked for plagiarism Yes
Review by Single anonymous peer review
Peer reviewer comments 2
Editor who approved publication: Professor Garry Walsh
Zhuangzhuang Jiang, Dongjuan Xu, Hongfei Li, Xiaolan Wu
Department of Neurology, Dongyang People’s Hospital, Affiliated to Wenzhou Medical University, Dongyang, Zhejiang, People’s Republic of China
Correspondence: Dongjuan Xu, Tel +86 13588620108, Email [email protected]
Objective: This study aimed to create and validate a novel nomogram to predict the risk of symptomatic intracranial hemorrhage (sICH) in patients with acute ischemic stroke (AIS) who underwent intravenous thrombolysis (IVT).
Methods: In this retrospective study, 784 patients with AIS who received IVT were enrolled. The patients were randomly divided into two groups: a training set (n=550, 70%) and a testing set (n=234, 30%). Utilizing multivariable logistic regression analysis, relevant factors for the predictive nomogram were selected. The performance of the nomogram was evaluated using various metrics, including the area under the receiver operating characteristic curve (AUC-ROC), the Hosmer-Lemeshow goodness-of-fit test, calibration plots, and decision curve analysis (DCA).
Results: Multivariable logistic regression analysis showed that specific factors, including National Institutes of Health Stroke Scale (NIHSS) scores, Early infarct signs (EIS), and serum sodium, were identified as independent predictors of sICH. Subsequently, a nomogram was constructed using these predictors. The AUC-ROC values of the nomogram were 0.864 (95% CI: 0.810– 0.919) and 0.831 (95% CI: 0.770– 0.891) in the training and the validation sets, respectively. Both the calibration plots and the Hosmer-Lemeshow goodness-of-fit test showed favorable agreement in both the training and the validation sets. Additionally, the DCA indicated the practical clinical utility of the nomogram.
Conclusion: The novel nomogram, which included NIHSS, EIS and serum sodium as variables, had the potential for predicting the risk of sICH in patients with AIS after IVT.
Keywords: ischemic stroke, symptomatic intracranial hemorrhage, thrombolysis, nomogram
Introduction
Acute ischemic stroke (AIS) continues to be a major global cause of mortality and disability, imposing a significant burden on both families and society.1,2 Currently, the most effective treatment for ischemic stroke within 4.5 hours of onset is intravenous thrombolysis (IVT) using recombinant tissue-plasminogen activator (rt-PA).3 However, some patients may experience a worsened condition due to symptomatic intracerebral hemorrhage (sICH) after rt-PA thrombolysis.4,5 Consequently, it becomes imperative to identify patients at risk of post-thrombolysis sICH for better management.
Numerous scoring systems6–10 are available to predict sICH risk following thrombolysis. However, many of these models transform continuous variables into categorical ones, leading to potential information loss.6–9,11 Although several prognostic nomograms have been developed for sICH events in AIS patients undergoing thrombolysis,12–20 some limitations remain. Firstly, certain examinations are either unavailable in most medical centers or require a long time for the results to be obtained,12–16 limiting their widespread applicability. Secondly, many studies overlook the impact of baseline neuroimaging before IVT.16–20 Admittedly, Yang13 has already integrated early infarct sign (EIS) on non-contrast computed tomography (NCCT) before IVT into their prognostic nomogram. Nonetheless, given the various types of early brain infarction signs on NCCT,21 subgroup analysis is meaningful.
The objective of this study is to identify the independent pre-thrombolytic factors associated with sICH in stroke patients receiving IVT. Additionally, the goal is to develop and validate a nomogram that combines neuroimaging and readily available laboratory variables to accurately predict the likelihood of sICH following IVT in ischemic stroke patients.
Materials and Methods
Study Design and Participants
Consecutive ischemic stroke patients who underwent IVT treatment in the department of emergency at Dongyang People’s Hospital between July 1, 2017, and April 30, 2023, were included in this retrospective observational study. The study was ethically approved by the Ethics Committee of Dongyang People’s Hospital (Dong Ren Yi 2023-YX-234) and adhered to the principles of the Declaration of Helsinki. Informed consent from patients was waived due to the retrospective observational design. During the data collection and analysis process, patient’s names and other identity information were concealed to fully protect patient privacy.
Patients received thrombolytic therapy in the emergency department and were subsequently admitted to the neurology ward after treatment. Within 22–36 hours after thrombolysis, no anticoagulants or antiplatelet drugs were administered. Blood pressure was maintained within 180/100 mmHg during this period, and oral or intravenous antihypertensive treatment was provided if blood pressure exceeded this range. Blood glucose levels were kept between 7.7–10.0 mmol/L during this period. If blood glucose levels fell below this range, oral or intravenous glucose solution supplementation was given, and if blood glucose levels rose above this range, insulin or oral antidiabetic medication was administered to control blood glucose. During this period, the patients are placed under 24-hour electrocardiogram monitoring and instructed to remain in bed for rest. The study enrolled participants based on the following inclusion criteria: (1) age 18 years or older, (2) diagnosed with acute ischemic stroke without any evidence of intracranial hemorrhage on NCCT, and (3) patients treated with alteplase thrombolysis within 4.5 hours from the onset of stroke symptoms. Exclusion criteria consisted of: (1) patients who underwent endovascular treatment after IVT, and (2) patients with incomplete clinical data.
Clinical Data Collection
At admission, demographic characteristics, medical history, and clinical data were collected. Stroke severity was assessed using the National Institutes of Health Stroke Scale (NIHSS) scores. Laboratory data, including baseline blood glucose, neutrophil-to-lymphocyte ratio (NLR), and platelet count and other relevant parameters, were also recorded. The method for obtaining the patient’s vascular risk factors is through inquiries with the patients and their family members. All clinical data and test results were obtained prior to thrombolysis. The early infarct signs on NCCT were categorized into four groups. Two experienced clinicians independently reviewed the cerebral NCCT scans, and the agreement between them for early infarct signs was evaluated using the kappa statistic, yielding a value of 0.783. Disagreement was resolved through discussion.
The classification of early infarct signs on cerebral CT is as follows: Group 1: No infarct sign observed in cerebral CT. Group 2: Presence of any one or multiple of the following NCCT manifestations: obscuration of lentiform nucleus, loss of differentiation between gray and white matter in the basal ganglia, focal hypoattenuation in basal ganglia, brainstem, thalami, or any other white matter region. Group 3: Presence of any one or multiple of the following NCCT manifestations: cortical sulcal effacement, loss of insular ribbon, obscuration of the sylvian fissure, and focal hypoattenuation in the cerebellum or any other cortical area. Group 4: Imaging manifestations described in both group 2 and group 3 are observed simultaneously, or there is the presence of hyperdense cerebral vessel sign.
Definition of sICH
In this study, all enrolled patients underwent follow-up CT or magnetic resonance imaging (MRI) within 22–36 hours after intravenous thrombolysis. Additionally, if there was any neurological deterioration, another CT scan was performed. Symptomatic intracranial hemorrhage (sICH) was defined, according to the European Cooperative Acute Stroke Study II criteria,22 as any type of intracranial hemorrhage(ICH) detected on posttreatment imaging after the initiation of thrombolysis, along with an increase of 4 points or more in the National Institutes of Health Stroke Scale (NIHSS) scores from baseline or resulting in death. All images and clinical scores were independently assessed by two experienced neurologists.
Statistical Analysis
In this study, continuous variables were presented as medians with interquartile ranges (IQRs) as all continuous variables did not conform to a normal distribution based on Kolmogorov–Smirnov test, while categorical variables were described as numbers with percentages. As the continuous variables did not follow a normal distribution, differences between groups with and without sICH were assessed using the Mann–Whitney U-test. For categorical variables, differences between the two groups were analyzed using Fisher’s exact test or the χ2 test, as appropriate. Variables with a P-value <0.05 in the univariate analyses were further subjected to multivariable analysis. Restricted cubic splines (RCS) are used to test the linear relationship between continuous variables and the outcome variable. Collinearity between each variable was assessed by evaluating the tolerance (<0.2 considered significant) and variation inflation factors (>5 considered significant).
The forward-selection method was employed to select the final prediction model for the development of a prognostic nomogram. The discriminative performance of the nomogram was evaluated using the area under the receiver operating characteristic curve (AUC-ROC) in both the training and the validation sets. Calibration of the nomogram model, indicating concordance between predicted and observed probabilities, was assessed using the Hosmer-Lemeshow goodness-of-fit test (P >0.05) and a calibration plot with 500 bootstrap resamples. To evaluate the clinical validity of the nomogram, decision curve analysis (DCA) was performed in both the training and validation sets. Statistical analyses were conducted using IBM SPSS (version 26.0) and R statistical software (version 3.5.1). Two-tailed significance values were applied, and statistical significance was defined as P <0.05.
Results
Baseline Characteristics
Initially, a total of 888 patients with AIS were included in this study. After excluding 104 patients who did not meet the criteria, the final analysis comprised 784 patients. Comparison between excluded and included cases shows no statistically significant differences. Among the 784 patients, 550 individuals were assigned to the training set, and the remaining 234 individuals formed the validation set in a 7:3 ratio (Figure 1). Table 1 displays the baseline characteristics of the patients in both sets. In the training set, the median age of the patients was 70 years (with an interquartile range of 59–78), and 352 patients (64.0%) were male. Meanwhile, in the validation set, the median age was 69 years (with an interquartile range of 59–79), and 150 patients (64.1%) were male. Overall, 47 patients (6.0%) experienced sICH among the total cohort. The percentages of patients with sICH were 6.7% in the training set and 4.3% in the validation set. All variables were found to be balanced between the two groups, with p-values exceeding 0.05, indicating no significant differences.
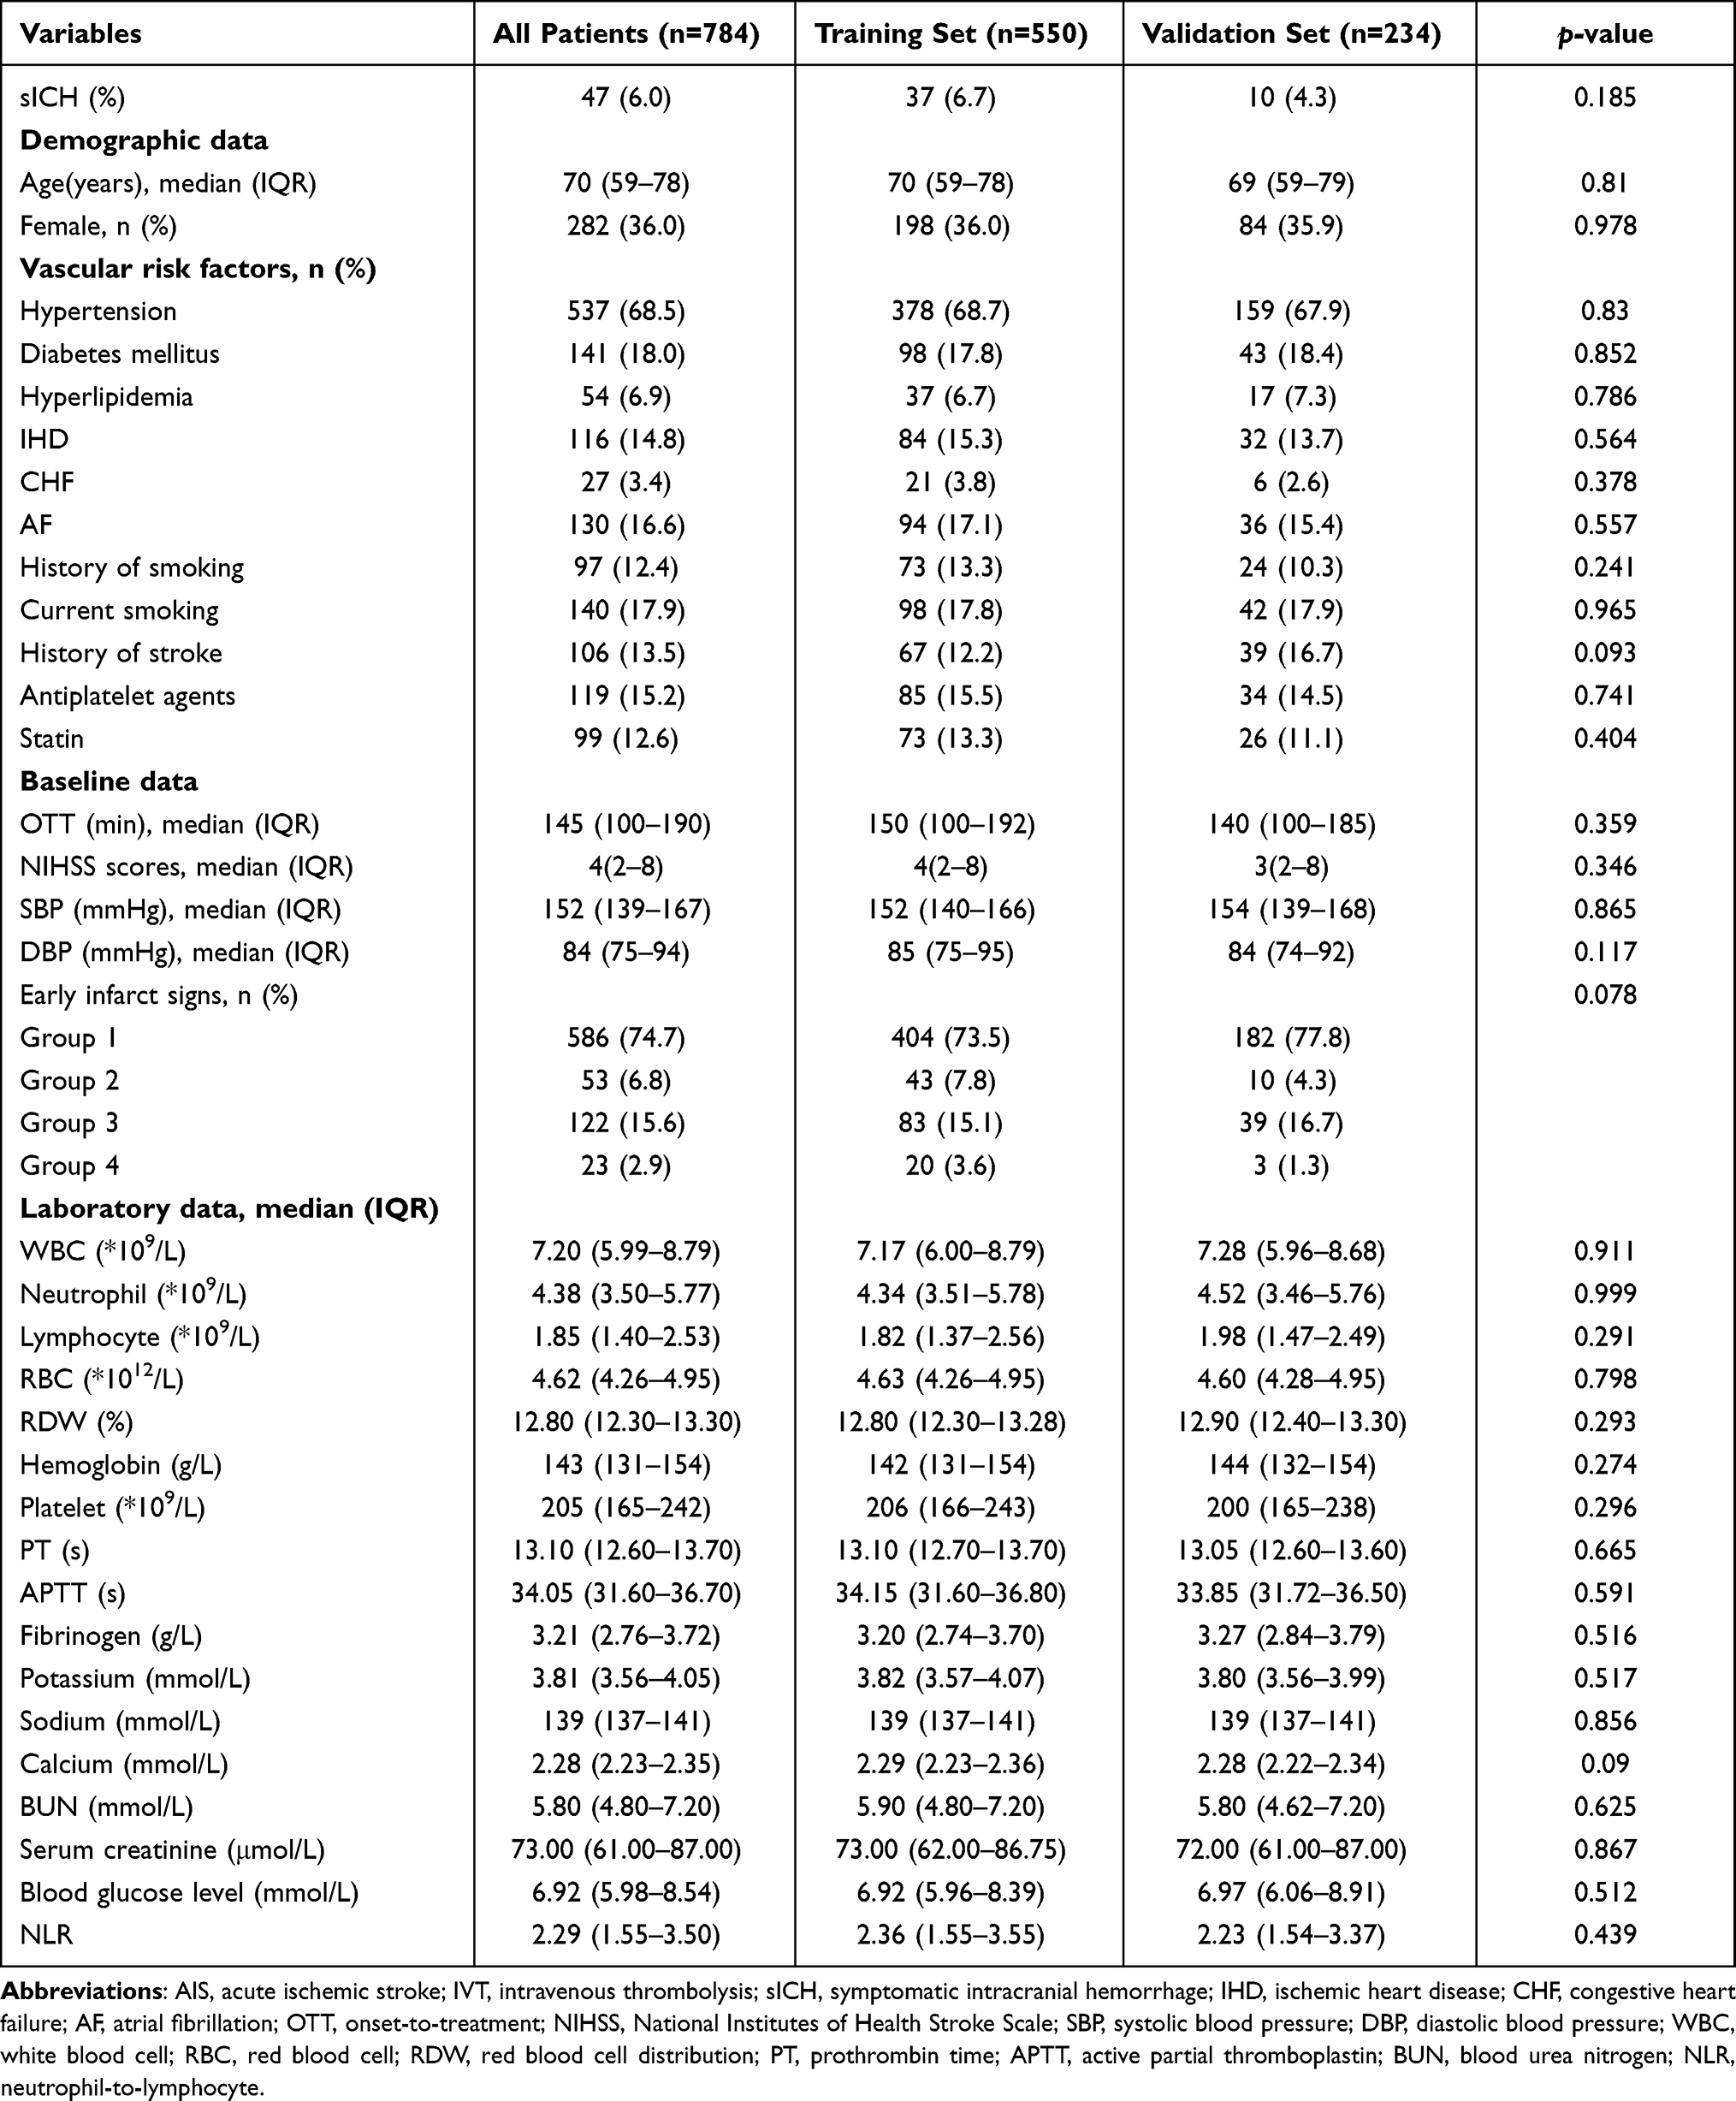 |
Table 1 Baseline Characteristics of AIS Patients with IVT in the Training and Validation Sets |
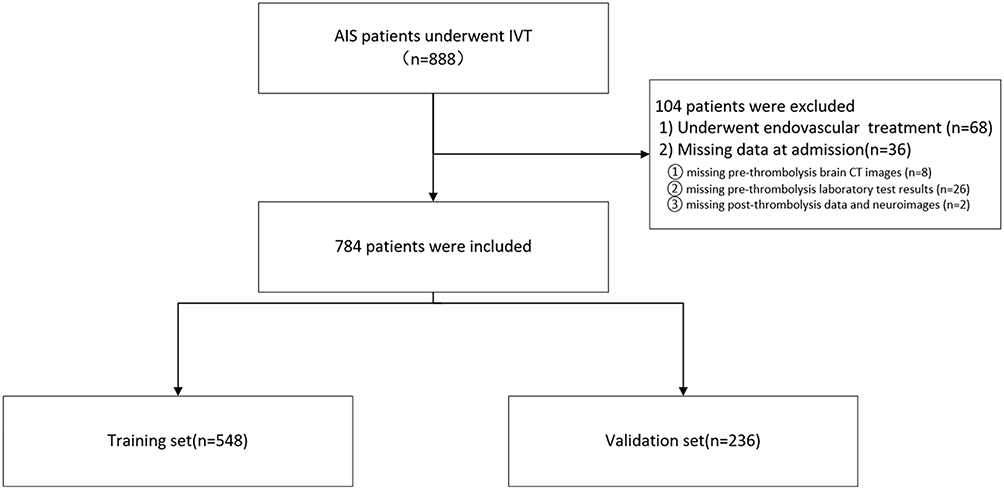 |
Figure 1 Flow chart of patient inclusion. Abbreviations: IVT, intravenous thrombolysis; CT, Computer Tomography. |
As depicted in Table 2, the results of the univariate analysis demonstrated significant associations between sICH and the following variables: age, hypertension, atrial fibrillation (AF), National Institutes of Health Stroke Scale (NIHSS) scores, early infarct signs, prothrombin time (PT), blood urea nitrogen (BUN), creatinine, and serum sodium (P < 0.05). We further established restricted cubic splines (RCS) to conduct linear test between the continuous variables and sICH (Supplementary Figure 1). All continuous variables exhibit a linear relationship with sICH (P overall <0.05, P nonlinear >0.05), indicating the reliability of incorporating predictor variables in the form of continuous variables into the development of model. In the multivariable analysis, no significant collinearity was observed among all the variables (Table 3).
 |
Table 2 Univariable and Multivariable Analysis of sICH in AIS Patients with IVT in the Training Set |
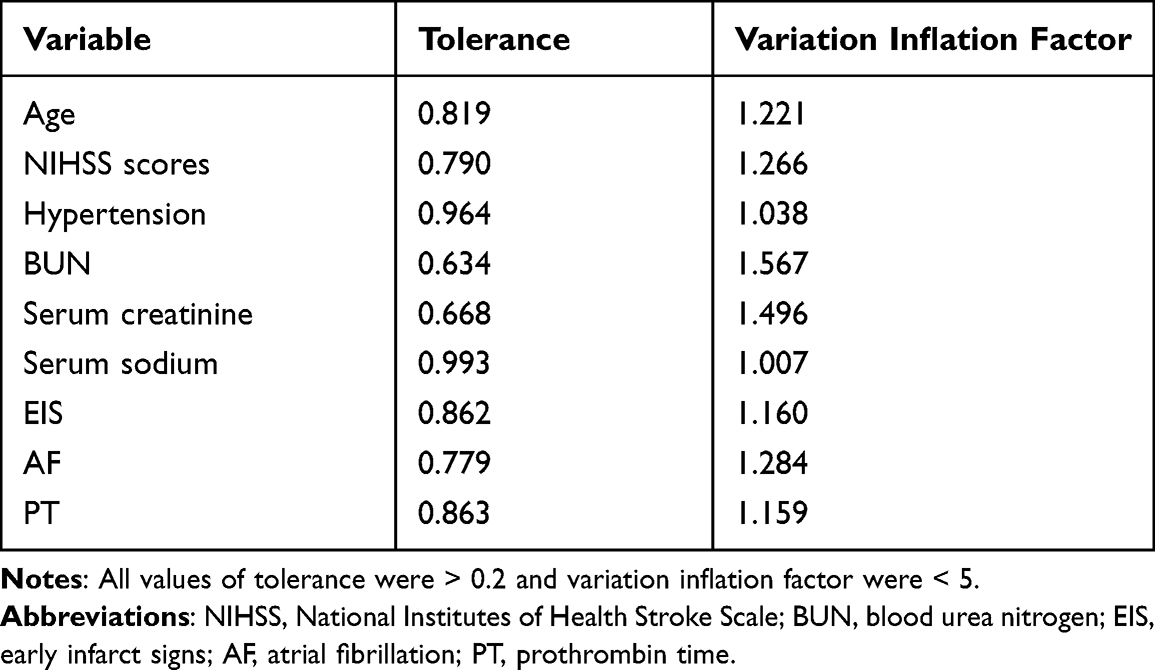 |
Table 3 Collinearity of Combinations of Variables in the Training Set |
Following the multivariate logistic regression analysis, three factors were identified as independent predictors for sICH after intravenous thrombolysis in patients with ischemic stroke. These predictors included early infarct signs (Group 2 OR,2.879; 95% CI, 0.601–10.409; P=0.134. Group 3 OR, 3.547; 95% CI, 1.399–8.941; P=0.007. Group 4 OR,11.063; 95% CI, 3.191–36.939; P<0.001), NIHSS scores (OR, 1.047; 95% CI, 1.002–1.092; P = 0.034), and serum sodium levels (OR, 0.884; 95% CI, 0.811–0.953; P = 0.002).
Predictive Model Development
The novel nomogram (Figure 2) was developed using all the identified independent predictors for sICH after intravenous thrombolysis. The nomogram comprises the preliminary values of the predictors, their corresponding preliminary score ranges, the total score, and the probability of ICH.
 |
Figure 2 Nomogram for predicting sICH in patients experiencing IVT. The nomogram consists of three predictors, each of which is given a preliminary score (0–100). The total score is obtained by summing all the preliminary score of each of the three predictors. The classification of EIS: 1: No infarct sign observed in cerebral NCCT. 2: Presence of any one or multiple of the following NCCT manifestations: obscuration of lentiform nucleus, loss of differentiation between gray and white matter in the basal ganglia, focal hypoattenuation in basal ganglia, brainstem, thalami, or any other white matter region. 3: Presence of any one or multiple of the following NCCT manifestations: cortical sulcal effacement, loss of insular ribbon, obscuration of the sylvian fissure, and focal hypoattenuation in the cerebellum or any other cortical area. 4: Imaging manifestations described in both group 2 and group 3 are observed simultaneously, or there is the presence of hyperdense cerebral vessel sign. Abbreviations: sICH, symptomatic intracranial hemorrhage; IVT, intravenous thrombolysis; NIHSS, national institutes of health stroke scale; NCCT, non-contrast computed tomography. |
To use the nomogram, one must first locate the value of each predictor for a specific patient on the corresponding axis. Next, a line is drawn vertically downward from each preliminary value to the preliminary score axis, where the corresponding preliminary score is identified. The preliminary scores for all the predictors are then added together to obtain the total score for that patient. Finally, by drawing a line upward from the total score on the probability axis, the individual probability of experiencing sICH after intravenous thrombolysis is determined.
Nomogram Validation
The discriminative performance of the nomogram was assessed using the area under the receiver operating characteristic curve (AUC-ROC), which indicated a moderate predictive power in both the training set (AUC, 0.864; 95% CI, 0.810–0.919) (Figure 3A) and the validation set (AUC, 0.831; 95% CI, 0.770–0.891) (Figure 3B).
 |
Figure 3 The receiver operating characteristic curve of the nomogram for predicting symptomatic intracranial hemorrhage in the training set (A) and the validation set (B). The value of area under curve is 0.864 in the training set and 0.831 in the validation set. |
Furthermore, the goodness-of-fit of the nomogram was evaluated using the Hosmer-Lemeshow test, demonstrating good concordance between the predicted and observed probabilities in both the training set (P = 0.606) and the validation set (P = 0.488). The calibration plots for the training set exhibited excellent agreement between the predicted probability of ICH and the actual observations (Figure 4A), and similar optimal concordance was observed in the validation set (Figure 4B).
 |
Figure 4 Calibration plot for predicting symptomatic intracranial hemorrhage after intravenous thrombolysis in the training set (A) and the validation set (B). |
To evaluate the clinical usefulness of the nomogram, decision curve analysis (DCA) was performed. The DCA results suggested that the threshold probabilities ranged from 4.0% to 55.8% in the training set (Figure 5A) and from 4.0% to 45.8% in the validation set (Figure 5B). These findings indicate that the nomogram has practical clinical utility for predicting the risk of sICH after intravenous thrombolysis in patients with ischemic stroke.
 |
Figure 5 Decision curve analysis (DCA) of the nomogram predicting symptomatic intracranial hemorrhage after intravenous thrombolysis in the training set (A) and the validation set (B). The x-axis demonstrates the threshold probability. The y-axis indicates the net benefit. The black line displays all patients are negative and have no treatment, the net benefit is zero. The gray line means all patients who accept intravenous thrombolysis will develop symptomatic intracranial hemorrhage. The blue line indicates the net benefit of the nomogram. |
Discussion
In this retrospective single-center study, we successfully developed and validated a novel nomogram that relies on easily and quickly obtainable predictors, namely the NIHSS score, early infarct signs, and serum sodium levels, prior to intravenous thrombolysis. The nomogram demonstrated excellent performance in both the training set (AUC-ROC, 0.864) and the validation set (AUC-ROC, 0.831), indicating its robust predictive capabilities. Furthermore, the calibration capability of our nomogram was also found to be excellent, as the predicted risk closely aligned with the actual risk in both the training and validation sets. This suggests that our nomogram provides accurate and reliable risk estimations for post-thrombolysis symptomatic intracranial hemorrhage. Lastly, the decision curve analysis (DCA), a tool utilized to assess the clinical usefulness of a nomogram, reaffirmed the significance of our predictive model.
Our study’s findings were consistent with previous research,6–20 as we also identified NIHSS scores as predictors for sICH in patients undergoing rt-PA intravenous thrombolysis. This finding helped explain why patients with posterior circulation stroke (PCS) experienced a lower risk of sICH after intravenous thrombolysis when compared to those with anterior circulation stroke (ACS).23,24 This was due to the fact that the NIHSS scoring system assigned higher weight to deficits commonly seen in ACS, such as aphasia and hemiparesis, while signs of PCS, like bulbar deficits and ataxia, received fewer points.25
Our study also revealed that early infarct signs was an independent risk factor for sICH as many previous studies did.6,9,11,13 However, different from previous studies, where EIS was always incorporated into prediction model with dichotomous variable, we divided EIS into four different subgroups based on the region and type of infarct signs on NCCT in this study. We found that the risk of post-thrombolysis sICH was varied in different regions and types of infarct signs. We hypothesized that the finding was attributed to the volume of cerebral infarction. Numerous prior studies have demonstrated a positive correlation between the risk of sICH after thrombolysis and the size of the identified cerebral infarction.14,26,27 In group 4, infarct signs appearing in both central and peripheral regions of brain meant a relatively large infarct volume. Additionally, the presence of hyperdense cerebral vessel sign indicated major cerebrovascular occlusion, often accompanied by massive cerebral infarction.28 Consequently, the risk of post-thrombolysis sICH in group 4 was the highest among the four groups. Comparing group 2 to group 3, the regions in group 3 contained a higher proportion of gray matters. Previous researches have demonstrated that gray matters were much more vulnerable than white matters to ischemia.29–31 This implied that infarct signs in gray matters might appeared prior to the white matters theoretically. Therefore, infarct signs in gray matters might suggest potential ischemia in adjacent white matters, whereas infarct signs in white matters did not necessarily indicate concurrent ischemia in nearby gray matters. This interpretation implied that the actual infarct volume in group 3 could be larger than what is apparent on cerebral CT, potentially leading to a higher risk of post-thrombolysis sICH compared to group 2. To further validate this hypothesis, future studies could conduct volume and area comparisons between pre-IVT CT imagining and subsequent diffusion-weighted imaging (DWI).
Notably, our study ascertained that serum sodium might act as a protective factor for post-thrombolysis sICH in patients with ischemic stroke. Serum sodium was barely taken into account in scoring systems building or nomogram establishing in the past. He32 have reported that hyponatremia was associated with post-thrombolysis hemorrhagic transformation. Several previous studies have implicated the disruption of the blood-brain barrier (BBB) and rt-PA-induced reperfusion injury as potential mechanisms behind ICH after rt-PA intravenous thrombolysis.33,34 The BBB played a vital role in maintaining cerebral homeostasis,35 and in conditions of hyponatremia, alterations in solute and water transfer could lead to volume perturbations and compromise the integrity of tight junctions and endothelial cells. This disruption of the BBB might ultimately lead to intracranial hemorrhage.36
While our study identified serum sodium as a potential protective factor, the exact mechanism behind its relationship with post-thrombolysis sICH remained to be fully investigated. Given that serum sodium level was a modifiable predictor, it merits further attention. One intriguing question was whether timely and proper management of serum sodium levels, particularly in patients with hyponatremia, could potentially reduce the risk of sICH after intravenous thrombolysis. To answer this question definitively, further investigation and research were required.
Our study has some limitations. First, the data for our study were obtained from a single-center retrospective analysis, which might introduce potential biases and limit the statistical power of the results. Second, our model has not been validated in external data. Further external validation is essential to assess the robustness of the nomogram in different patient populations.
Conclusion
In conclusion, the novel nomogram that includes NIHSS scores, early infarct signs and serum sodium may predict the risk of sICH after IVT in AIS patients.
Abbreviations
sICH, symptomatic intracranial hemorrhage; AIS, acute ischemic stroke; IVT, intravenous thrombolysis; AUC-ROC, area under the receiver operating characteristic curve; DCA, decision curve analysis; NIHSS, National Institutes of Health Stroke Scale; EIS, early infarct signs; rt-PA, recombinant tissue-plasminogen activator; NCCT, non-contrast computed tomography; NLR, neutrophil-to-lymphocyte ratio; OR, odd ratio; CI, confidence interval; IHD, ischemic heart disease; CHF, congestive heart failure; AF, atrial fibrillation; OTT, onset-to-treatment; SBP, systolic blood pressure; DBP, diastolic blood pressure; WBC, white blood cell; RBD, red blood cell; RDW, red blood cell distribution; PT, prothrombin time; APTT, active partial thromboplastin; BUN, blood urea nitrogen; IQRs, interquartile ranges; BBB, blood-brain barrier.
Data Available Statement
The raw data supporting the conclusions of this article will be made available from the corresponding author, without undue reservation.
Ethics Statement
In accordance with national legislation and institutional requirements, the Ethics Committee of Dongyang People’s Hospital reviewed and approved the studies involving human participants. Written informed consent from the participants was not necessary for this study.
Acknowledgments
Our sincere appreciation goes out to all the researchers and patients who willingly participated in this study.
Disclosure
All authors report no conflicts of interest in this work.
References
1. Feigin VL, Stark BA, Johnson CO, et al. Global, regional, and national burden of stroke and its risk factors, 1990–2019: a systematic analysis for the global burden of disease study 2019. Lancet Neurol. 2021;20(10):795–820. doi:10.1016/S1474-4422(21)00252-0
2. Wu S, Wu B, Liu M, et al. Stroke in China: advances and challenges in epidemiology, prevention, and management. Lancet Neurol. 2019;18(4):394–405. doi:10.1016/S1474-4422(18)30500-3
3. Powers WJ, Rabinstein AA, Ackerson T, et al. Guidelines for the early management of patients with acute ischemic stroke: 2019 update to the 2018 guidelines for the early management of acute ischemic stroke: a guideline for healthcare professionals from the American heart association/American stroke association. Stroke. 2019;50:12.
4. Hacke W, Kaste M, Bluhmki E, et al. Thrombolysis with alteplase 3 to 4.5 hours after acute ischemic stroke. N Engl J Med. 2008;359(13):1317–1329. doi:10.1056/NEJMoa0804656
5. Saver JL. Hemorrhage after thrombolytic therapy for stroke. Stroke. 2007;38(8):2279–2283. doi:10.1161/STROKEAHA.107.487009
6. Strbian D, Engelter S, Michel P, et al. Symptomatic intracranial hemorrhage after stroke thrombolysis: the SEDAN Score. Ann Neurol. 2012;71(5):634–641. doi:10.1002/ana.23546
7. Mazya M, Egido JA, Ford GA, et al. Predicting the risk of symptomatic intracerebral hemorrhage in ischemic stroke treated with intravenous alteplase. Stroke. 2012;43(6):1524–1531. doi:10.1161/STROKEAHA.111.644815
8. Menon BK, Saver JL, Prabhakaran S, et al. Risk score for intracranial hemorrhage in patients with acute ischemic stroke treated with intravenous tissue-type plasminogen activator. Stroke. 2012;43(9):2293–2299. doi:10.1161/STROKEAHA.112.660415
9. Cucchiara B, Tanne D, Levine SR, Demchuk AM, Kasner S. A risk score to predict intracranial hemorrhage after recombinant tissue plasminogen activator for acute ischemic stroke. J Stroke Cerebrovascular Dis. 2008;17(6):331–333. doi:10.1016/j.jstrokecerebrovasdis.2008.03.012
10. Saposnik G, Guzik AK, Reeves M, Ovbiagele B, Johnston SC. Stroke prognostication using age and NIH stroke scale: SPAN-100. Neurology. 2013;80(1):21–28. doi:10.1212/WNL.0b013e31827b1ace
11. Lou M, Safdar A, Mehdiratta M, et al. The HAT Score: a simple grading scale for predicting hemorrhage after thrombolysis. Neurology. 2008;71(18):1417–1423. doi:10.1212/01.wnl.0000330297.58334.dd
12. Wu Y, Chen H, Liu X, et al. A new nomogram for individualized prediction of the probability of hemorrhagic transformation after intravenous thrombolysis for ischemic stroke patients. BMC Neurol. 2020;20(1). doi:10.1186/s12883-020-02002-w
13. Yang M. A novel nomogram to predict hemorrhagic transformation in ischemic stroke patients after intravenous thrombolysis. Front Neurol. 2022;3:13.
14. Zhang K, Luan J, Li C, Chen M. Nomogram to predict hemorrhagic transformation for acute ischemic stroke in Western China: a retrospective analysis. BMC Neurol. 2022;22(1). doi:10.1186/s12883-022-02678-2
15. Zhang XX, Yao FR, Zhu JH, et al. Nomogram to predict haemorrhagic transformation after stroke thrombolysis: a combined brain imaging and clinical study. Clin Radiol. 2022;77(1):e92–e98. doi:10.1016/j.crad.2021.09.017
16. Shen Y, Xiong Y, Cao Q, et al. Construction and validation of a nomogram model to predict symptomatic intracranial hemorrhage after intravenous thrombolysis in severe white matter lesions. J Thromb Thrombol. 2023;56(1):111–120. doi:10.1007/s11239-023-02828-4
17. Guo H, Xu W, Zhang X, et al. A nomogram to predict symptomatic intracranial hemorrhage after intravenous thrombolysis in Chinese patients. Neuropsych Dis Treat. 2021;17:2183–2190. doi:10.2147/NDT.S320574
18. Weng Z-A, Huang X-X, Deng D, et al. A new nomogram for predicting the risk of intracranial hemorrhage in acute ischemic stroke patients after intravenous thrombolysis. Front Neurol. 2022;1:13.
19. Xie X, Yang J, Ren L, et al. Nomogram to predict symptomatic intracranial hemorrhage after intravenous thrombolysis in acute ischemic stroke in Asian Population. Curr Neurovasc Ees. 2021;18(5):543–551. doi:10.2174/1567202619666211223150907
20. Zhou Z, Yin X, Niu Q, Liang S, Mu C, Zhang Y. Risk factors and a nomogram for predicting intracranial hemorrhage in stroke patients undergoing thrombolysis. Neuropsych Dis Treat. 2020;16:1189–1197. doi:10.2147/NDT.S250648
21. Wardlaw JM, Mielke O. Early signs of brain infarction at CT: observer reliability and outcome after thrombolytic treatment--systematic review. Radiology. 2005;235(2):444–453. doi:10.1148/radiol.2352040262
22. Larrue V, von Kummer RR, Müller A, Bluhmki E. Risk factors for severe hemorrhagic transformation in ischemic stroke patients treated with recombinant tissue plasminogen activator: a secondary analysis of the European-Australasian Acute Stroke Study (ECASS II). Stroke. 2001;32(2):438–441. doi:10.1161/01.STR.32.2.438
23. Keselman B, Gdovinová Z, Jatuzis D, et al. Safety and outcomes of intravenous thrombolysis in posterior versus anterior circulation stroke. Stroke. 2020;51(3):876–882. doi:10.1161/STROKEAHA.119.027071
24. Sarikaya H, Arnold M, Engelter ST, et al. Outcomes of intravenous thrombolysis in posterior versus anterior circulation stroke. Stroke. 2011;42(9):2498–2502. doi:10.1161/STROKEAHA.110.607614
25. Kasner SE. Clinical interpretation and use of stroke scales. Lancet Neurol. 2006;5(7):603–612. doi:10.1016/S1474-4422(06)70495-1
26. Singer OC, Humpich MC, Fiehler J, et al. Risk for symptomatic intracerebral hemorrhage after thrombolysis assessed by diffusion-weighted magnetic resonance imaging. Ann Neuro. 2008;63(1):52–60. doi:10.1002/ana.21222
27. Singer OC, Kurre W, Humpich MC, et al. Risk assessment of symptomatic intracerebral hemorrhage after thrombolysis using DWI-ASPECTS. Stroke. 2009;40(8):2743–2748. doi:10.1161/STROKEAHA.109.550111
28. Derex L. Clinical and imaging predictors of intracerebral haemorrhage in stroke patients treated with intravenous tissue plasminogen activator. J Neurol Neurosurg Psychiatry. 2005;76(1):70–75. doi:10.1136/jnnp.2004.038158
29. Arakawa S, Wright PM, Koga M, et al. Ischemic thresholds for gray and white matter. Stroke. 2006;37(5):1211–1216. doi:10.1161/01.STR.0000217258.63925.6b
30. Bristow MS, Simon JE, Brown RA, et al. MR perfusion and diffusion in acute ischemic stroke: human gray and white matter have different thresholds for infarction. J Cerebral Blood Flow Metabol. 2005;25(10):1280–1287. doi:10.1038/sj.jcbfm.9600135
31. Chen C, Bivard A, Lin L, Levi CR, Spratt NJ, Parsons MW. Thresholds for infarction vary between gray matter and white matter in acute ischemic stroke: a CT perfusion study. J Cerebral Blood Flow Metabol. 2017;39(3):536–546. doi:10.1177/0271678X17744453
32. He L. Hyponatremia is associated with post-thrombolysis hemorrhagic transformation and poor clinical outcome in ischemic stroke patients. Front Mol Neurosci. 2022;4:15.
33. Krueger M, Bechmann I, Immig K, Reichenbach A, Härtig W, Michalski D. Blood—brain barrier breakdown involves four distinct stages of vascular damage in various models of experimental focal cerebral ischemia. J Cerebral Blood Flow Metabol. 2014;35(2):292–303. doi:10.1038/jcbfm.2014.199
34. Rocha EA, Topcuoglu MA, Singhal AB. Post-stroke recrudescence from infection: an immunologic mechanism? Translat Stroke Re. 2018;10(2):146–149. doi:10.1007/s12975-018-0651-x
35. Daneman R, Prat A. The blood–brain barrier. Cold Spring Harbor Perspect Biol. 2015;7(1):a020412. doi:10.1101/cshperspect.a020412
36. Khanna A, Kahle KT, Walcott BP, Gerzanich V, Simard JM. Disruption of Ion homeostasis in the neurogliovascular unit underlies the pathogenesis of ischemic cerebral edema. Translat Stroke Re. 2013;5(1):3–16. doi:10.1007/s12975-013-0307-9
 © 2023 The Author(s). This work is published and licensed by Dove Medical Press Limited. The
full terms of this license are available at https://www.dovepress.com/terms
and incorporate the Creative Commons Attribution
- Non Commercial (unported, 3.0) License.
By accessing the work you hereby accept the Terms. Non-commercial uses of the work are permitted
without any further permission from Dove Medical Press Limited, provided the work is properly
attributed. For permission for commercial use of this work, please see paragraphs 4.2 and 5 of our Terms.
© 2023 The Author(s). This work is published and licensed by Dove Medical Press Limited. The
full terms of this license are available at https://www.dovepress.com/terms
and incorporate the Creative Commons Attribution
- Non Commercial (unported, 3.0) License.
By accessing the work you hereby accept the Terms. Non-commercial uses of the work are permitted
without any further permission from Dove Medical Press Limited, provided the work is properly
attributed. For permission for commercial use of this work, please see paragraphs 4.2 and 5 of our Terms.
Recommended articles
A Novel Metabolic Score for Insulin Resistance and Symptomatic Intracranial Hemorrhage in Ischemic Stroke Patients After Endovascular Thrombectomy
Chen S, E Y, Zhang X, Wei B, Wang S, Xu Z, Gong P, Xie Y, Qin C, Zhang Y
Neuropsychiatric Disease and Treatment 2023, 19:321-328
Published Date: 5 February 2023
The Relationship Between Neuron-Specific Enolase and Clinical Outcomes in Patients Undergoing Mechanical Thrombectomy
Peng Q, Chen W, E Y, Deng Y, Xu Z, Wang S, Fu X, Wei B, Wang M, Hou J, Zhang Y, Duan R
Neuropsychiatric Disease and Treatment 2023, 19:709-719
Published Date: 4 April 2023
Correlation of Atherosclerotic Dyslipidemia with Long-Term Stroke Recurrence in Patients Undergoing Intravenous Thrombolysis for Acute Ischemic Stroke
Cheng Y, Wang Q, Niu G, Luo C
International Journal of General Medicine 2023, 16:1621-1629
Published Date: 2 May 2023
Relationship Between Liver Fibrosis and Increased Risk of Symptomatic Intracranial Hemorrhage in Ischemic Stroke Patients Undergoing Mechanical Thrombectomy
Xu J, Zhang X, E Y, Wang W, Zhou J, Shi Y, Chen S
Neuropsychiatric Disease and Treatment 2024, 20:101-108
Published Date: 18 January 2024
Utility of the ASPECT Score for Predicting Intracranial Hemorrhage Following Intravenous Thrombolysis in Patients with Suspected MCA Infarction: Insights from the Northern Thai Stroke Registry
Teekaput C, Wantaneeyawong C, Jakrachai C, Nuttawut S, Nuttawut S, Bowornsomboonkun S, Teekaput K, Thiankhaw K
Journal of Multidisciplinary Healthcare 2024, 17:5487-5499
Published Date: 22 November 2024