Back to Journals » Journal of Inflammation Research » Volume 16
A Novel Nomogram Combining Mucus Barrier Index for Predicting Treatment Failures in Ulcerative Colitis
Authors Wang Y, Huang X, Zhou G, Han J, Xie Z, Zhang M ![]() , Li X, Wu QR
, Li X, Wu QR ![]() , Li L, Ye Z, Chen M, Qiu Y, Zhang S
, Li L, Ye Z, Chen M, Qiu Y, Zhang S
Received 25 February 2023
Accepted for publication 21 April 2023
Published 1 May 2023 Volume 2023:16 Pages 1879—1894
DOI https://doi.org/10.2147/JIR.S410057
Checked for plagiarism Yes
Review by Single anonymous peer review
Peer reviewer comments 2
Editor who approved publication: Professor Ning Quan
Ying Wang,1,* Xuanzhi Huang,1,* Gaoshi Zhou,1 Jing Han,1 Zhuo Xie,1 Mudan Zhang,1 Xiaoling Li,1 Qi-rui Wu,1 Li Li,1 Ziyin Ye,2 Minhu Chen,1 Yun Qiu,1 Shenghong Zhang1
1Department of Gastroenterology, First Affiliated Hospital of Sun Yat-sen University, Guangzhou, Guangdong Province, People’s Republic of China; 2Department of Pathology, First Affiliated Hospital of Sun Yat-sen University, Guangzhou, Guangdong Province, People’s Republic of China
*These authors contributed equally to this work
Correspondence: Shenghong Zhang; Yun Qiu, Department of Gastroenterology, First Affiliated Hospital of Sun Yat-sen University, 58 Zhongshan Road 2, Guangzhou Province, 510080, People’s Republic of China, Tel/Fax +86-20-87332916, Email [email protected]; [email protected]
Background: Treatment failures (TFs) generally exist in the course of ulcerative colitis (UC), while early reliable predictors of TFs are still lacking. We aimed to generate nomograms for the prediction of TFs.
Methods: In this retrospective case–control study, the endpoint was the occurrence of TFs, which included medically associated treatment failures and surgery-associated treatment failures (colectomy). Clinical features and mucus integrity evident by goblet cells (GCs) number, expression levels of MUC2 and SLC26A3 were enrolled in the univariate analysis. Nomogram performance was evaluated by discrimination and calibration.
Results: We identified 256 UC patients at our center from January 2010 to June 2022. Fourteen variables for TFs and 9 for colectomy were identified by univariate analysis. Five baseline indices were incorporated into the nomogram for the prediction of TFs: area of GCs, age at diagnosis, disease duration, hemoglobin, and Mayo score. The model was presented with decent discrimination (C index of 0.822) and well calibration. In addition, the colectomy predictive nomogram was built using MUC2 intensity, age at onset, and Mayo score with a good discrimination (C index of 0.92).
Conclusion: Nomograms based on comprehensive factors including mucus barrier function were developed to predict TFs in UC patients with great discrimination, which may serve as practical tools aiming to identify high-risk subgroups warrant timely intervention.
Keywords: ulcerative colitis, treatment failure, nomogram, mucus barrier
Introduction
Ulcerative colitis (UC), a common subtype of inflammatory bowel disease (IBD), is presented with high morbidity universally.1,2 Given its frequent relapse and incurable features, UC has evolved as a global burden.3,4 Even though it is easier to get control than other IBD patients, a few patients still experience unbeneficial outcomes, such as loss of control under monotherapy or surgical treatment.5,6 Even the loss of response to biological intervention by biologic would occur in the unfortunate.7,8 Constant transition of therapy is common because of drug resistance or intolerance.9,10 Surgery is an unavoidable method for patients presented no response to medications or with identified colorectal neoplasm.5,6 Colectomy, as a paradigm surgery for UC, severely affects the patients’ quality of life.3
No general validated definition has been identified for treatment failures (TFs) in UC patients. Few studies simply defined TFs with monotherapy as the absence of clinical response.11–13 These patients exhibit a more progressive disease course for advanced therapy. Hence, a predictive model to identify patients that warrant timely intervention is necessary. Currently, few studies have reported on developing risk prediction models for UC-related TFs, which mostly focused on monotherapy efficacy or surgery risk individually, and mainly included only routine clinical factors.14,15
The mucus barrier16,17 plays an essential role in the pathogenesis of UC, and its impairment is proven to be an early event.18 Single-cell RNA sequencing revealed a changed profile of colonic goblets in UC patients.17 Goblet cells (GCs) depletion, a typical histological variation in UC, was an independent risk factor for clinical relapse, especially in patients with endoscopic remission (Mayo endoscopic score [MES] of 0).19,20 The dextran sulfate sodium model with MUC2 deficiency, a key component of colonic mucus, was accompanied by severe colitis,21 and the total amount of MUC2 varied with the disease activity of UC patients. SLC26A3, an ion channel for chloride ion transport in the epithelium, was rarely discovered as an indicator of mucus penetrability in UC patients.18 Thus, given the importance of mucus integrity in UC, we included the mucus barrier function integrated by the GCs number, MUC2 and SLC26A3 levels in the prediction analysis.
This study aimed to establish nomograms based on mucus barrier function and other baseline factors to predict TFs of UC.
Materials and Methods
Patients and Study Design
We selected UC patients at first visit to our center from January 2010 to June 2022. The inclusion criteria were as follows: (i) age >18 years; (ii) established diagnosis of UC according to the European Crohn’s and Colitis Organization (ECCO) Guidelines;22 (iii) intestinal biopsy with patients’ consent. Patients without complete records of baseline information or whose follow-up time was less than 6 months were excluded.
Clinical Follow-Up and Data Collection
Patient demographic, clinical, laboratory, and endoscopic data were collected through a comprehensive review of electronic medical records. The following baseline characteristics were collected: age at onset and diagnosis, sex, disease duration, UC extent according to the Montreal classification, smoking status, previous history of surgery, medication usage including clinical trials or fecal microbiota transplantation (FMT), and endoscopic imaging.
The clinical follow-up and additional pertinent data in the medical files of patients, the Inflammatory Bowel Disease Center register database (http://168.168.251.46:8888/zbk_threexh/web/#/Home), and the endoscopy register were reassessed by two experienced gastroenterologists. A pre-determined structured data-sheet was used to collect data from the medical files at the time of each visit, including general wellbeing, symptoms each time, the indication for procedure, type and findings of the procedure, medical therapies being used, any treatment adjustment.
According to the scoring system of the ECCO guidelines,22 the Truelove and 9-point Mayo score were applied for clinical assessment, the Ulcerative Colitis Endoscopic Index of Severity (UCEIS) score, and Mayo endoscopic score (MES) were used to evaluate the intestinal condition. Restricted to the underestimation of the affected intestinal segment, modified MES (mMES) was used as a complement to the mentioned score.23 Based on the criteria from previous studies,24,25 UC relapse was defined by clinical assessment and endoscopic evaluation.
Definition and Outcome
The primary endpoint of this study was TFs and the secondary endpoint was UC-related bowel surgery. In accordance with previous studies,11,12,26,27 TFs of UC patients were defined as follows: (i) steroid-resistant or dependent, (ii) immunomodulator-refractory, (iii) loss of response to biologics including anti-TNF-α inhibitors (infliximab [IFX] and adalimumab) and α4β7 integrin antagonist (vedolizumab), (iv) patients on clinical trials or undergone FMT due to poor response to conventional therapy, (v) UC-related bowel surgery. Steroid-resistant was defined as sustained active disease with 0.75 mg/kg/day prednisone for over 4 weeks. Steroid-dependent was defined as a disease relapse when prednisone was tapered to <10 mg or within 3 months of withdrawal.
Cytomegalovirus (CMV) and Epstein–Barr virus (EBV) infections were defined as follows: (i) positive histological test with intestinal mucosal biopsy; (ii) positive serum IgM or DNA loading exceeding 500 copies/mL for CMV or 1000 copies/mL for EBV.22
Histological Staining and Quantitative Analysis
Quantification of GCs and mucus property-related indicators MUC2 and SLC26A3 were separately conducted using Alcian Blue/Periodic Acid–Schiff (AB/PAS) staining or immunohistochemistry (IHC) of biopsy sections according to the manufacturer’s protocol.18,21 The images were acquired using Leica DMi8 microscope (Germany) with the same parameters. A blank image without tissue was taken simultaneously, which was used as a background correction. Image-Pro Plus 6.0 was used to quantify the number of GCs and levels of MUC2 or SLC26A3. The ratio of the positive area of AB/PAS staining to the whole-section area was regarded as GC quantification. The ratio of integrated optical density to the staining area of IHC was calculated for the evaluation of MUC2 or SLC26A3 level, which was identified as the average optical density index. Macro operation could be run with a large batch of images. More than three random images from each patient were assessed by a blinded pathologist and the average result was applied as a semi-quantitative index for further analysis.
Statistical Analysis
The median and interquartile range (IQR) were used to describe continuous variables without normal distribution, while categorical variables were presented as frequencies with percentages. Comparison of continuous variables between the two groups was performed by t-test (with normal distribution) or Mann–Whitney U-test (without normal distribution), if Fisher’s exact probabilities (categorical variables) were not applied. The correlation analysis was performed by Pearson correlations with r index under normal distribution, otherwise Spearman rank correlations with rs statistic were implemented. Multi-group comparisons were performed by Kruskal–Wallis test with quantitative variables.
Clinical and laboratory variables associated with therapeutic effect and prognosis in previous studies14,15,28,29 were enrolled in the analysis. Continuous predictors such as normalized area of GCs, expression levels of MUC2 and SLC26A3 were categorized into binomial classification variables. Patients who underwent surgery previously were excluded. Univariate analysis was performed by chi-square test (logistic regression) or Log rank test (Cox regression) to screen for possible predictive factors with p<0.05. Odds ratios (OR) or hazard ratios (HR) are presented with 95% confidence intervals (CIs). The filtered factors further entered multivariate analysis with backward stepwise selection. Variables with p≤0.15 were integrated into nomograms. The colectomy-free survival data were generated using the Kaplan–Meier method with a Log rank test. Receiver operating characteristic (ROC) curve analysis was applied to calculate the cutoff value for logistic regression, while the X-tile software (Version 1.0.4, https://kinzler.com/me/xtitle/) was used to determine the demarcation point for survival data.30
Nomogram Construction and Model Validation
Selected predictors based on the criteria illustrated above were incorporated to construct nomograms. Owing to the varied timeframe of follow-up and substantial recall bias when evaluating TFs, logistic regression rather than the Cox regression model was chosen in our study. The Akaike information criterion (AIC), C index (equivalent to the area under the ROC curve), and R2 were used to estimate the discriminative power of the models. Relatively, it was regarded as a qualified predictive model when C index was >0.75. A calibration plot was drawn using the bootstrap method (n=1000) to provide a graphic representation of the predictive performance and actual frequencies. The colectomy-free survival curve was demonstrated by the nomogram predictive value, and the cutoff point was determined by X-tile software (in which 90 was set as the cutoff value). The predictive ability of nomograms was demonstrated by the gap between the two subgroups visually along with the Log rank test. Decision curve analysis (DCA) was applied to quantify different threshold probabilities in the bootstrapped dataset.
Statistical analysis was conducted using the IBM SPSS Statistic 20 software and R software, version 3.0 (http://www.r-project.org/). All tests were two-sided, and a p value of <0.05 denoted statistical significance.
Results
Demographic and Clinical Characteristics
After reviewing the medical charts of 541 UC patients in our IBD center between 2010 and 2022, a total of 256 cases meeting the criterion with a median follow-up of 29.0 months (IQR: 14.0–49.0 months) were incorporated into this study (Figure 1). The baseline characteristics were detailed in Table 1. Patient ages ranged from 18 to 75 years at diagnosis (median: 39 years; IQR: 29–53 years); 62.5% were male. Most of the patients performed colon involved extensively (n=139, 54.3%) according to the Montreal classification. Twenty patients received biologics previously.
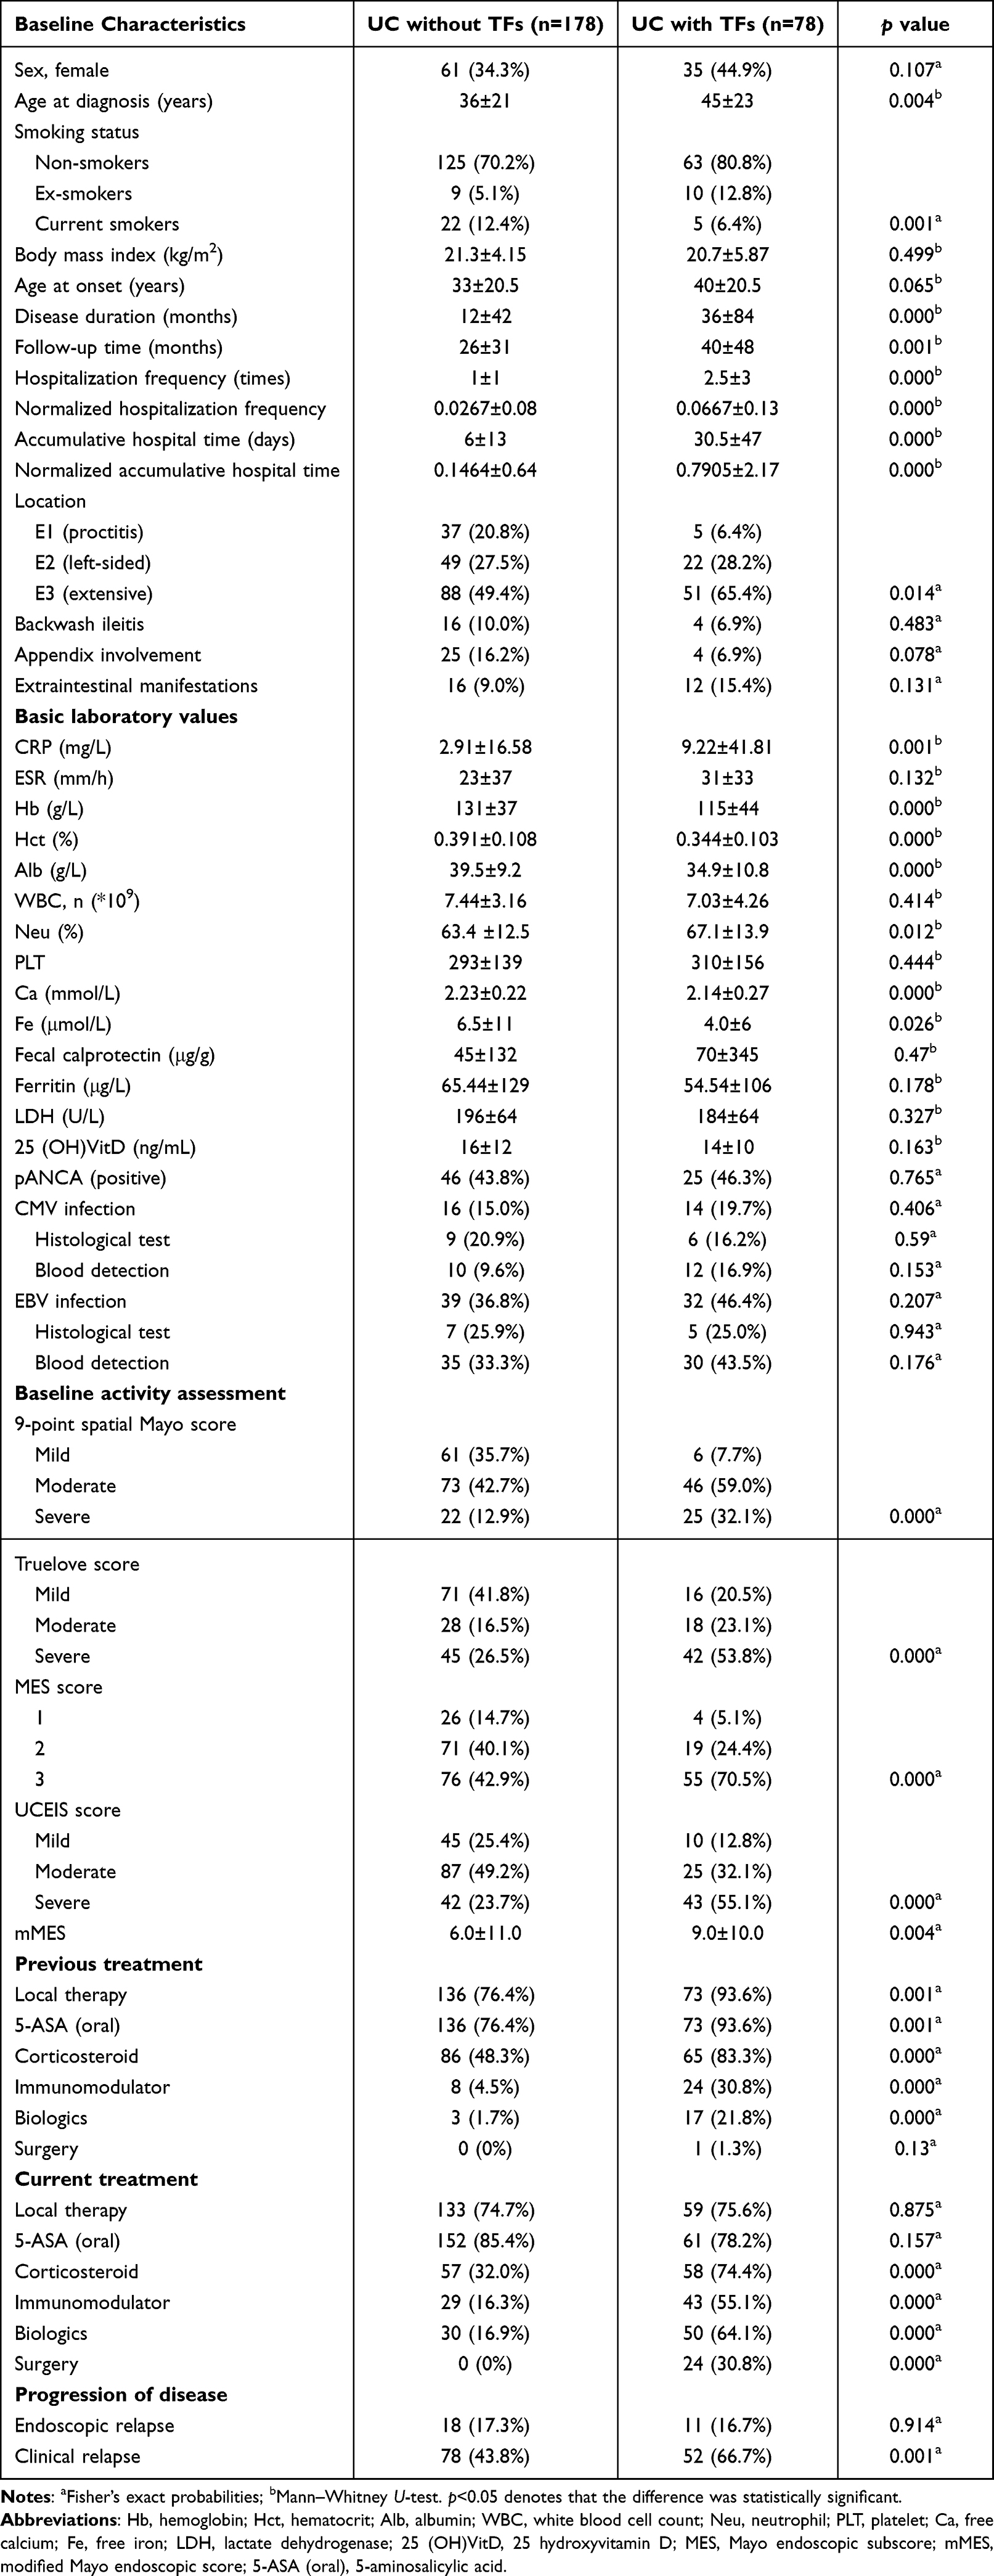 |
Table 1 Demographic and Clinical Characteristics in This Study |
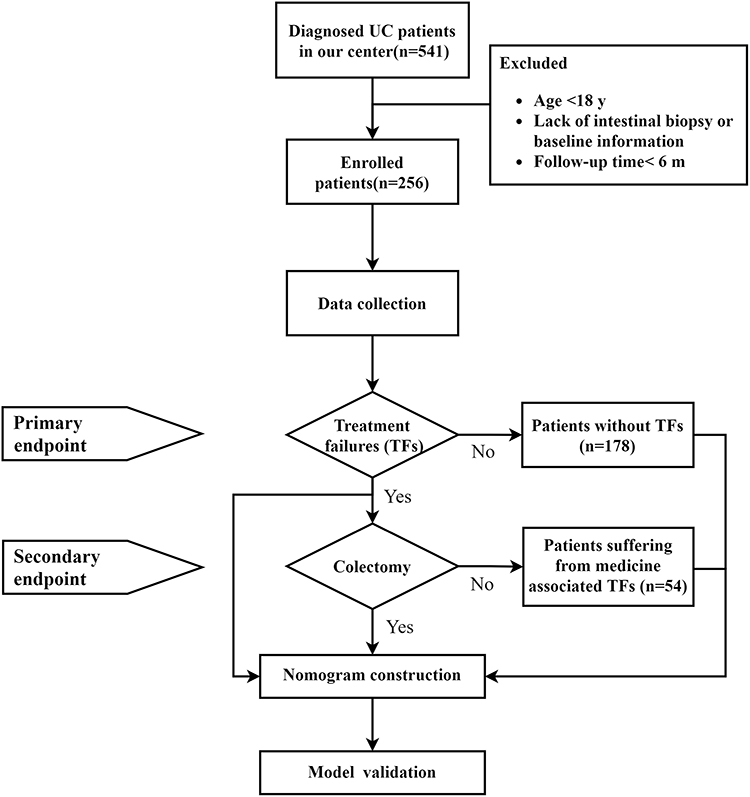 |
Figure 1 Flow chart of nomogram for predicting treatment failures. |
The eligible patients were further stratified into two groups based on TFs occurrence: 78 cases with TFs and 178 cases without TFs. UC without TFs tended to be younger (median: 36±21 vs 45±23 years old), current smokers (22 [12.4%] vs 5 [6.4%]), and had a relatively shorter disease duration (median: 12 vs 36 months). Considering the extent of bowel lesions, patients with TFs had a significantly lower E1 type (5 [6.4%] vs 37 [20.8%]) and higher E3 type (88 [49.4%] vs 51 [65.4%]) than patients without TFs. Considering the biochemical index, patients with TFs had higher C-reactive protein (CRP) levels (9.22±41.81 vs 2.91±16.58 mg/L), lower hemoglobin (115±44 vs 131±37 g/L), and albumin level (34.9±10.8 vs 39.5±9.2 g/L) (all p ≤ 0.001). The baseline activity assessment was significantly severe in patients with TFs regarding the 9-point partial Mayo score, Truelove score, MES, UCEIS score (all p<0.001), and mMES (p=0.004).
UC patients with TFs were more frequently exposed to advanced medications including immunomodulators and biologics (p<0.001). During follow-up, patients with TFs experienced significantly more clinical relapse (52 [66.7%] vs 78 [43.8%], p<0.001) than UC patients without TFs, while no significant difference in endoscopic relapse was observed.
To trace the origin of TFs occurrence, the entire panel was divided into various levels of clinical activity using a baseline 9-point Mayo score (Supplementary Figure 1A). Combined with the escalation of disease activity, an increasing probability of both medicine associated TFs and colectomy was observed. Furthermore, the number of TFs per person was elevated along with an increased clinical score (Supplementary Figure 1B).
Mucus Barrier Evaluation
Mucus integrity was essential for the maintenance of intestinal homeostasis. To further elucidate the role of mucus barrier in colitis, the number of GCs, the expression levels of MUC2 and SLC26A3 were evaluated using histological analysis (Figure 2). Moreover, the expression levels of SLC26A3 were correlated with GCs and MUC2 levels (Figure 3A). Endoscopic bowel inflammation was inversely correlated with the expression level of GCs, MUC2, or SLC26A3, respectively (Figure 2). A negative correlation between GCs number and SLC26A3 expression levels was found with the 12-point Mayo score (Figure 3B), UCEIS score (Figure 3C), and Truelove score (Figure 3D). The normalized intensity of SLC26A3 was moderately correlated with clinical activity (Figure 3E). The MUC2 expression levels demonstrated a weak correlation with mMES instead of clinical activity (Figure 3F).
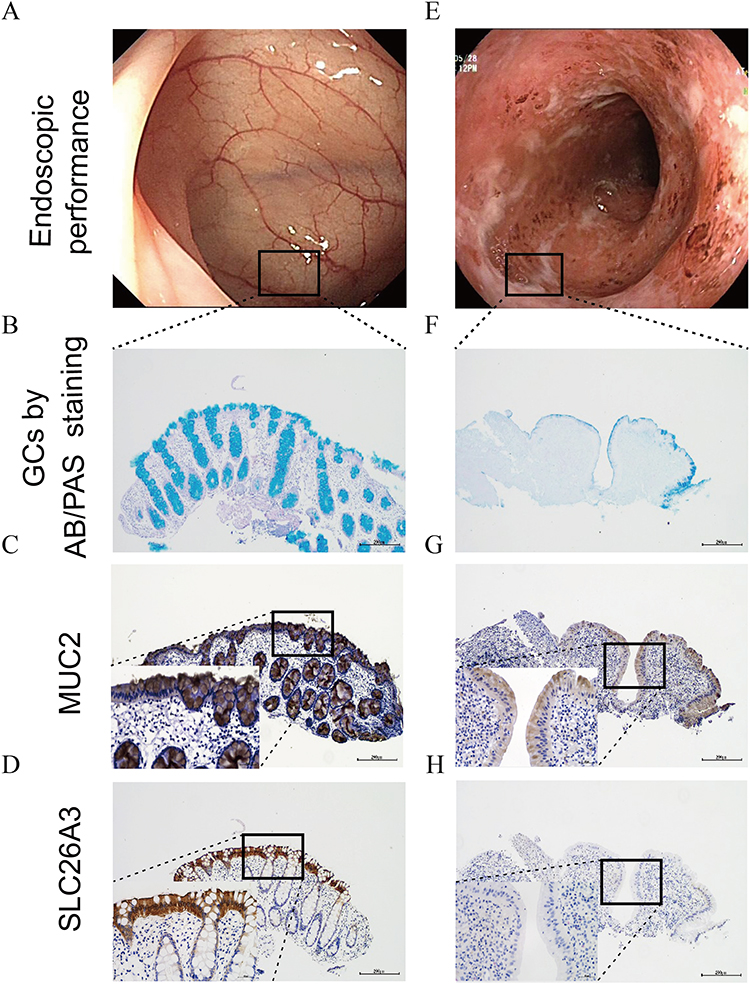 |
Figure 2 Representative images of mucus barrier-related markers in patients with endoscopic remission compared to patients with active lesions. Abbreviations: GCs, goblet cells; AB/PAS, Alcian Blue/Periodic Acid–Schiff. Notes: (A) Endoscopic image of patient 1 at sigmoid with MES equivalent to 0, *Rectangle: histological sampling site. AB/PAS (B), MUC2 (C), and SLC26A3 (D) staining images of sections from patient 1. (E) Endoscopic performance of patient 2 at sigmoid with MES score of 3, *Rectangle: histological sampling site. AB/PAS (F), MUC2 (G), and SLC26A3 (H) staining image of sections from patient 2. |
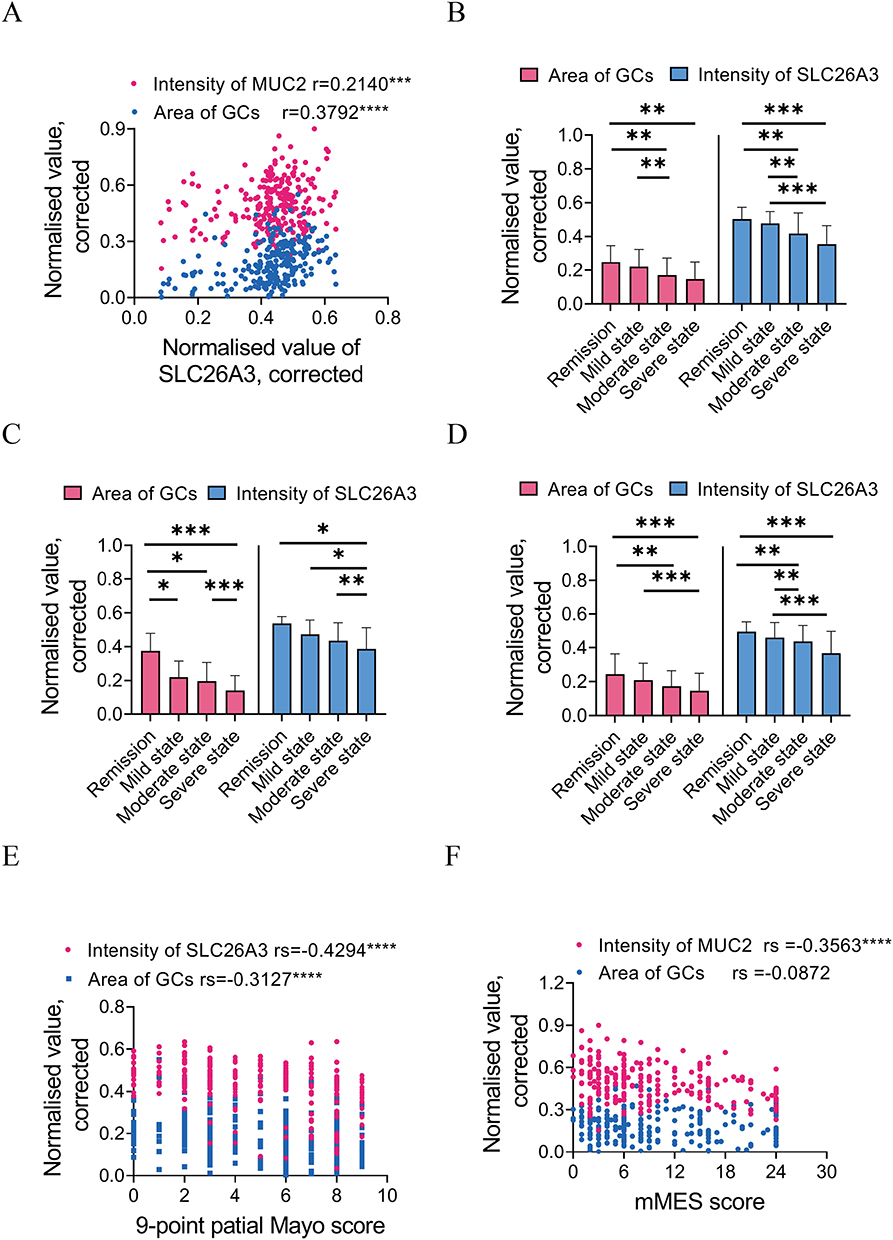 |
Figure 3 Relationship between quantification of mucus-related index by histological staining and clinical activity. Abbreviations: GCs, goblet cells; mMES, modified Mayo endoscopic score. Notes: (A) Correlation between normalized value of SLC26A3 expression level with the number of GCs or MUC2 expression level. Comparison of the number of GCs and SLC26A3 expression level in different groups stratified by 12-point Mayo score (B), UCEIS score (C), and Truelove score (D). (E) Correlation analysis between the 9-point Mayo score and the number of GCs or SLC26A3 expression level. (F) Correlation between modified Mayo endoscopic score and GCs or MUC2 level. *p < 0.05, **p < 0.01, ***p < 0.001, ****p < 0.0001. |
Nomogram for Prediction of Medical Treatment Response
Mucus integrity-related factors, as well as demographic and clinical characteristics were selected as candidates to construct predictive models of TFs. After the backward stepwise selection by AIC statistic, eight factors were chosen for multivariate logistic regression analysis. Five variables including the normalized area of GCs (OR 0.534, 95% CI 0.253–1.125), age at diagnosis (OR 3.086, 95% CI 1.448–6.673), disease duration (OR 3.630, 95% CI 1.563–8.612), hemoglobin (OR 0.490, 95% CI 0.197–1.168), and Mayo score (OR 3.469, 95% CI 1.481–8.515) were independently associated with TFs incidence (Table 2).
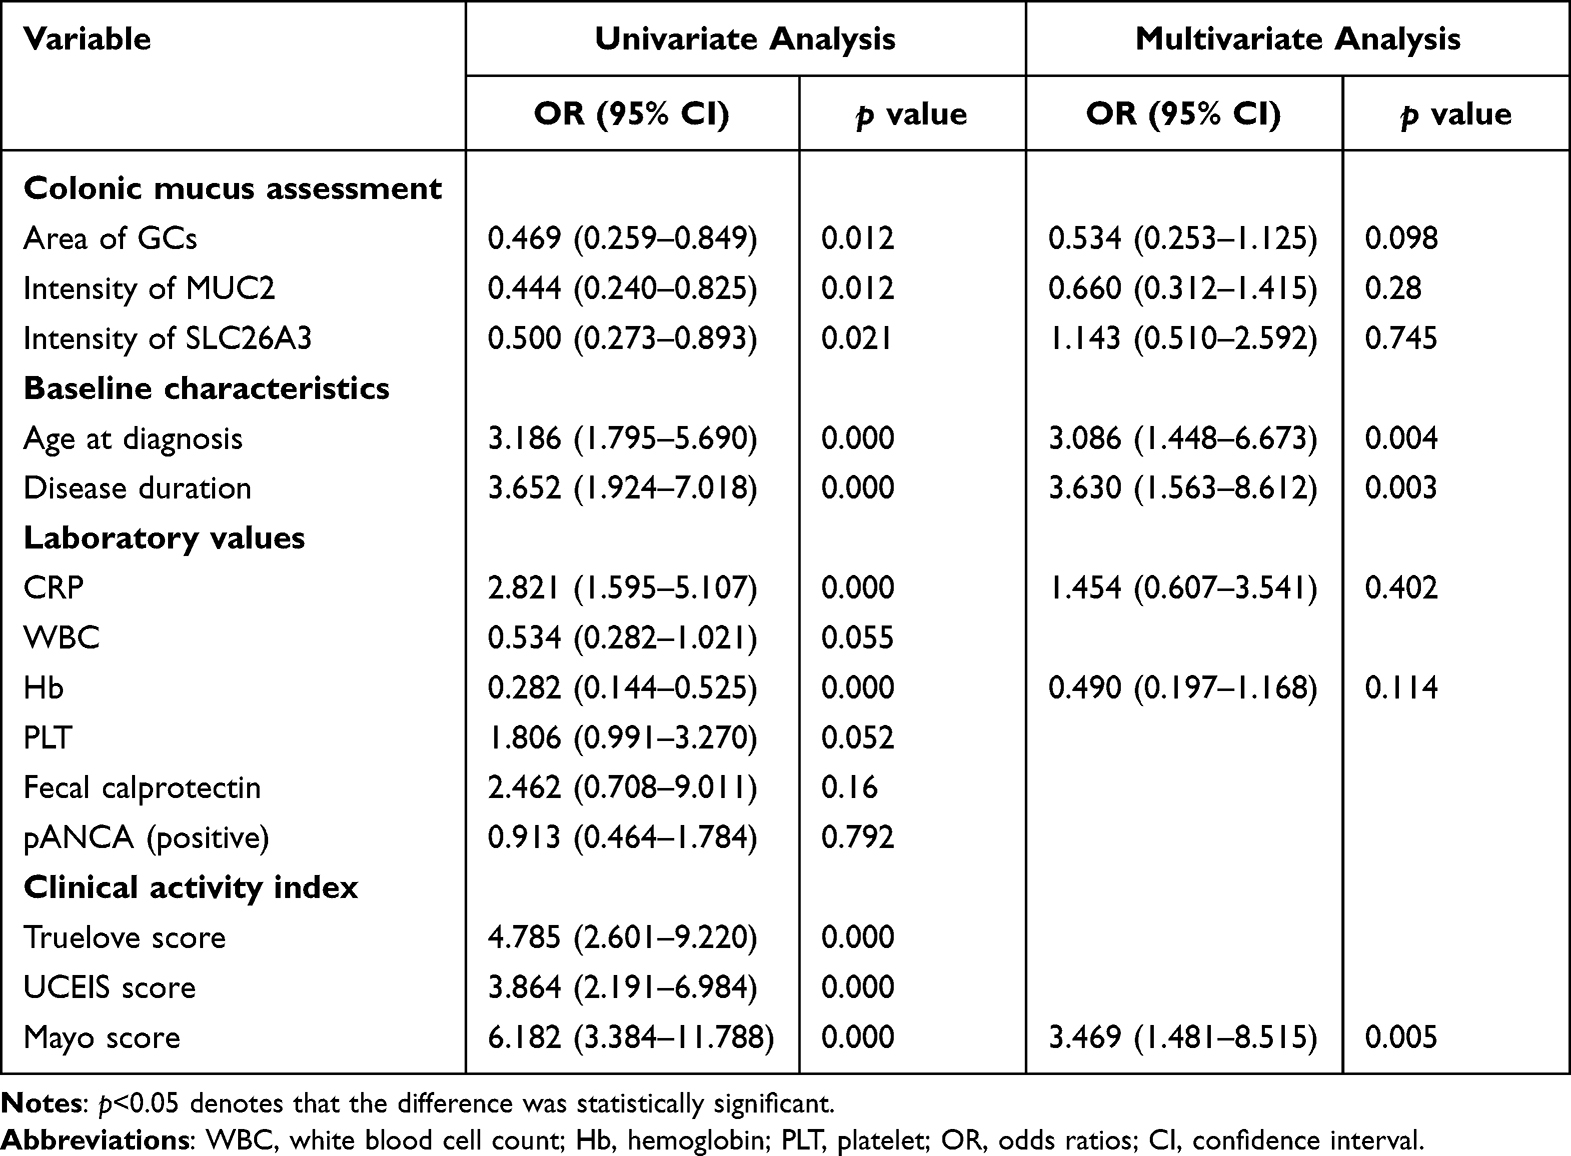 |
Table 2 Logistic Regression Analysis of the Presence of Treatment Failures, Based on Baseline Variables in Ulcerative Colitis Patients |
These explanatory factors including normalized area of GCs (≤0.12 or >0.12), age at diagnosis (≤50 or >50 years), hemoglobin (Hb≤132 or >132 g/L), disease duration, and Mayo score (≤7 or >7) were further incorporated to construct a nomogram (Figure 4). The total points calculated by summing up each factor were directly transferred into the predictive value for the incidence of TFs. Validation was performed using bootstrap method (Figure 5A). The C index of the nomogram for discriminability evaluation was 0.822. The discrimination performance of the established model was robust when stratified either by Mayo scores (active stage vs the remission group, Supplementary Figure 2A and B) or CRP value (set 2.38 as cutoff value) (Supplementary Figure 2C and D) with AUC ranged from 0.798 to 0.817.
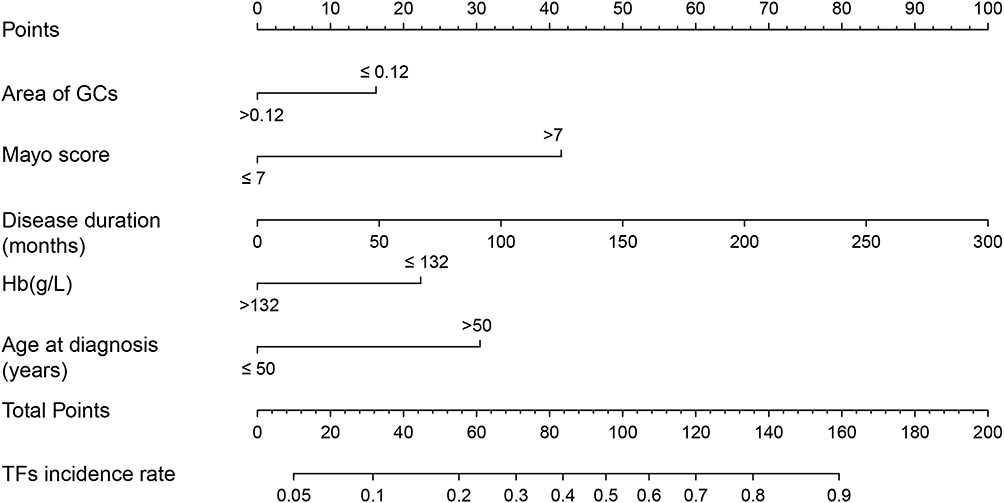 |
Figure 4 Nomogram for the prediction of treatment failures (TFs) incidence in ulcerative colitis. Abbreviations: GCs, goblet cells; Hb, hemoglobin, TFs, treatment failures. |
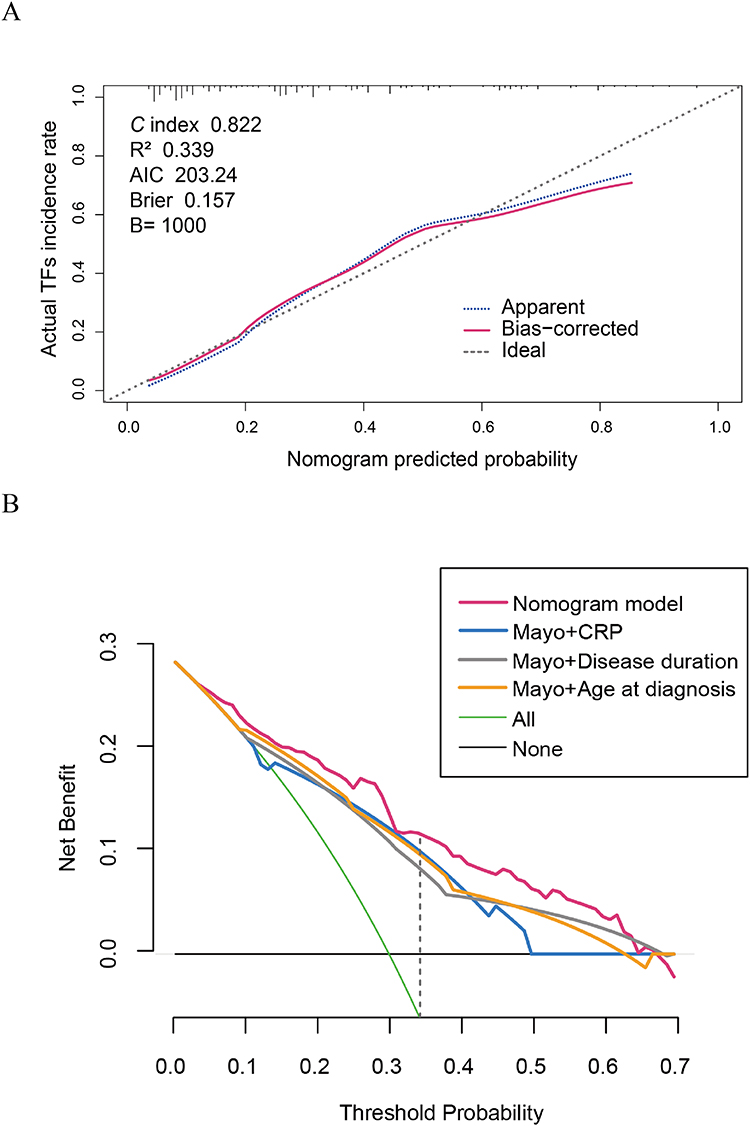 |
Figure 5 Assessment of the prediction performance of nomogram for TFs. Abbreviations: TFs, treatment failures; AIC, Akaike information criterion; CRP, C-reactive protein. Notes: (A) Calibration curve for comparing the consistence between predictive value with actual TFs incidence rate. (B) Decision curve analysis for TFs predictive nomogram compared with the integrated model combining Mayo score (pink) with CRP (blue), disease duration (grey), or age at diagnosis (orange). |
DCA was applied to compare the predictive value between the nomogram and integrated Mayo score models (Figure 5B), which consisted of the Mayo score, individual clinical, and laboratory factors at baseline. The curve demonstrated that, if the threshold probability was between 5% and 65%, the established nomogram model definitely outperformed other models.
Except for the integral factors for predicting TFs, we also deeply detected the probable indicators for response to biologic therapy specifically. Age at diagnosis and disease duration were enrolled, while SLC26A3 intensity positively forecasted the effectiveness of biological agents (Supplementary Table 1).
Nomogram for Prediction of Bowel Surgery
Restricted to the sample size of patients who underwent colectomy (n=24), three factors from nine candidates were screened based on univariate analysis. As demonstrated in Supplementary Table 2, the normalized intensity of MUC2 (HR 0.387, 95% CI 0.156–0.959), age at onset (HR 1.068, 95% CI 1.035–1.102), and Mayo score (HR 1.442, 95% CI 1.176–1.768) were independently associated with colectomy by multivariate analysis.
A nomogram was constructed using 3 independent factors: normalized intensity of MUC2 (≤0.37 or >0.37), age at onset, and Mayo score (Figure 6). The 12-month, 36-month, and 72-month colectomy incidence rates were accurately predicted by calculating the points assigned by each factor. The established nomogram demonstrated good discriminative ability with C index of 0.92 and R2 of 0.286. The subgroups separated by a cutoff point of 90 presented significant differences in colectomy-free survival (p<0.0001) (Figure 7). In addition, the predictive performance of the nomogram was further validated by bootstrapping and the 12-, 36-, and 72-month colectomy incidence probabilities were calibrated by plot performance (Supplementary Figure 3A-C).
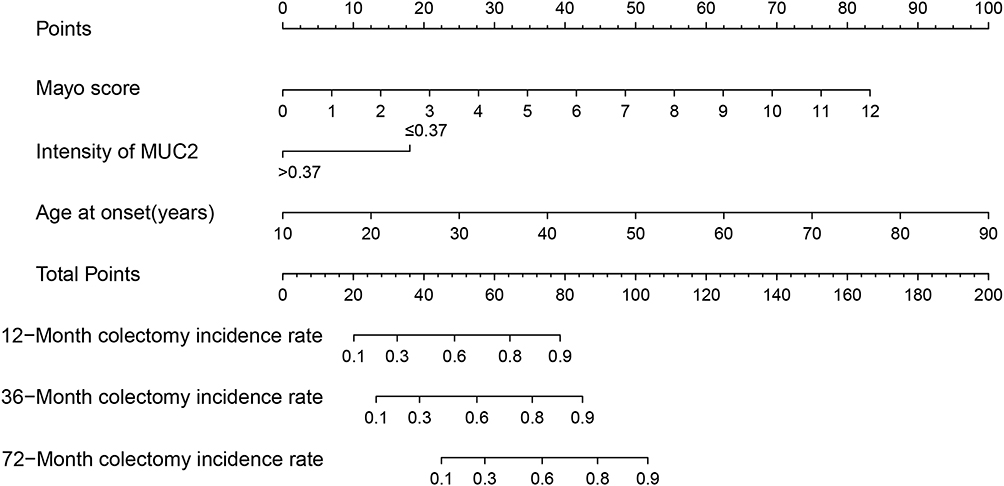 |
Figure 6 Nomogram for the prediction of surgery-associated treatment failures (colectomy) incidence based on Cox regression in ulcerative colitis. |
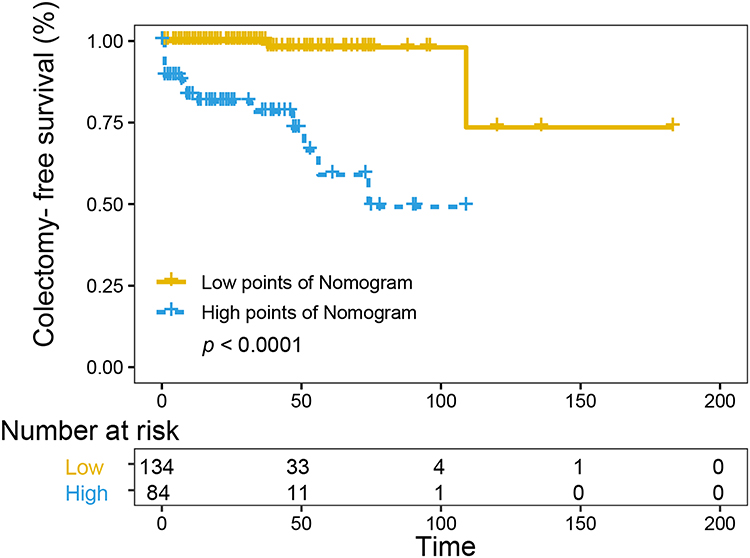 |
Figure 7 Kaplan–Meier curve for colectomy-free survival based on the calculated score of nomograms. |
Discussion
In this retrospective study, we found mucus-related index evident by the GCs number and expression levels of MUC2 or SLC26A3 showed a negative correlation with clinical scores in UC. Thus, the quantification of mucus-related markers was used to construct a predictive model along with baseline clinical factors. To our knowledge, this is the first study to establish nomogram models that incorporate the mucus barrier index for TFs with high discrimination and calibration.
Generally, in our cohort, approximately 30% of UC patients experienced TFs during the disease course, among which the incidence of TFs and colectomy was 28.9% and 9.4%, respectively. According to a population-based cohort of 1161 patients, the cumulative probability of colectomy is 22–40% from 10 to 50 years,4 which is much lower in our study. Faubion et al31 demonstrated that the probability of steroid-resistant and dependent in 1 year was 29% and 22%, respectively, while it was elevated to 15% and 64% in our study. The discrepancy in the rates of TFs and colectomy between previous studies and our cohort may partly be explained by the fact that patients in Eastern countries tend to suffer a relatively mild disease course compared to their counterparts in the West.32
In order to better predict, the clinical outcomes of UC, Dalal et al14 enrolled albumin, 9-point Mayo score, MES score and corticosteroid usage into predictive models of colectomy with an area under curve (AUC) of 0.92 (95% CI, 0.89–0.95). The predictive value was similar to our colectomy prediction model; however, this study did not take into account the incidence time of surgery. The baseline Mayo score (>9) was strongly associated (OR 1.44, 95% CI 1.16–1.78) with poor outcome in patients treated with steroids.33 A recent observational study in pediatric UC patients have identified the pediatric UC Activity Index (PUCAI) and M2-PK level with good predictive validity for predicting steroid failure.34 PUCAI was also negatively associated with sustained steroid or colectomy-free remission in another cohort (AUC 0.7, 95% CI 0.6–0.8).35 Anti-PARG and anti-PRR13 antibody titers are thought to be novel indicators for detecting refractory UC in patients with remission.36 With the surge in new biologics, a lot of work has been performed to identify possible predictors for biologics in refractory UC in recent years. A panel identified patients on IFX at risk for relapse or colectomy based on the clinical factors including pANCA, CRP, albumin levels, clinical response, and mucosal healing (both p< 0.001).37 Another prospective pilot study focused on IFX treatment found that in severe UC, future remission and colectomy can also be precisely predicted by IFX dose, early assessment of IFX concentration, calprotectin, and PM scores.28 In our study, the mucus related indices which were initially incorporated into biological research performed well while we did not include therapeutic drug monitoring factors. Moreover, no predictive model was constructed in the above-mentioned studies, and no qualified estimation of its predictive performance was provided, both of which made the comparison of these models with ours difficult.
Given the essential role of colonic mucus, mucus dysfunction has been vigorously investigated in the etiology and progression of UC.18,21 Disequilibrium of the mucus barrier with GC or mucus depletion facilitates bacteria invasion and migration16 and triggers the intestinal barrier destruction in colitis model.38–40 Alexander et al figured out that colonic inflammation is always accompanied by mucus dysfunction in UC patients.41 A recent research has also proposed that chronic inflammation leads to the abnormal mucus secretion with sustainable dysfunction of GCs42 and glycan pattern alternation is related to severe disease course.43 Basal plasmacytosis, as a feature of chronic inflammation, was an independent risk indicator (HR 4.5, 95% CI 1.7–11.9) of earlier relapse.24,44 Besides, in a retrospective cohort study, GC quantification can predict clinical relapse among UC patients in remission with an AUC of 0.81.45 Patients with histological healing based on GC assessment tend to maintain remission on IFX treatment during 42-month follow-up (HR 4.29, 95% CI 1.030–17.891).46 Furthermore, higher rates of histologic remission based on Geboes (29.2% vs 8.3%) or Robarts histopathology index (37.6% vs 19.9%) scoring systems have been observed in UC patients with vedolizumab treatment at week 52.47 In summary, recent studies have shown that the integrated mucus evaluation including GC calculation can serves as an efficient predictive tool in the clinical course of UC.
Due to the absence of circulating indices for mucus property, histological evaluation was the limited choice, which was seldom applied in clinical use. In this study, we explored the mucus-related markers as potential candidates for use in predictive models. The mucus barrier function evident by MUC2 and SLC26A3 expression levels as well as GCs number was evaluated at baseline. Both endoscopic lesions and clinical activity were inversely correlated with the expression of GCs, MUC2, or SLC26A3, respectively (Figures 2 and 3). These mucus-related markers especially the first two were confirmed as independent predictors of TFs by multivariate analysis. Eventually, the normalized area of GCs and expression levels of MUC2 were separately included in the final nomograms for TF and colectomy predictions. Both models performed well with C index values of 0.822 and 0.920, respectively. The calibration demonstrated high consistency between the predicted and actual values.
The major limitation of our study is its retrospective, single-center design with an inherent risk of bias. To mitigate recall risks, objective outcomes such as treatment adjustment and surgery were applied. Moreover, the majority of the included patients were follow-up regularly using a prospectively maintained database. Another limitation is the lack of an external validation group. Restricted to the sample capacity, it could be validated by resampling internally. It would be more convincing that UC patients from multiple centers to validate the preliminary model. Last but not least, variability was observed in the timeframe of follow-up when evaluating TFs, which is explained by the “real-life” nature of the study. Hence, the logistic regression models were chosen for TFs.
Conclusions
The nomograms based on comprehensive baseline factors incorporating mucus barrier markers were developed to predict TFs in UC patients with great discriminative power, which may serve as a practical tool to identify high-risk subgroups for management optimization.
Abbreviations
TFs, treatment failures; UC, ulcerative colitis; GCs, goblet cells; MES, Mayo endoscopic score; ECCO, European Crohn’s and Colitis Organization; FMT, fecal microbiota transplantation; UCEIS, Ulcerative Colitis Endoscopic Index of Severity; mMES, modified MES; IFX, infliximab; CMV, Cytomegalovirus; EBV, Epstein–Barr virus; IHC, immunohistochemistry; AB/PAS, Alcian Blue/Periodic Acid–Schiff; IQR, interquartile range; OR, odds ratios; HR, hazards ratio; CIs, confidence intervals; ROC, Receiver operating characteristic; AIC, Akaike information criterion; DCA, decision curve analysis; CRP, C-reactive protein; AUC, area under curve; PUCAI, Pediatric UC Activity Index.
Data Sharing Statement
We confirmed that the data supporting our ideas are available within the articles or Supplementary Materials except for the original information. The latter can be acquired from the corresponding author based on reasonable request.
Ethics Approval and Informed Consent
This case–control study was conducted with ethical approval from the First Affiliated Hospital of Sun Yat-sen University (No. [2022] 051). Informed consent was obtained from each patient. Our work complied with the Declaration of Helsinki.
Consent for Publication
All study participants provided informed consent, and the study design was approved by the appropriate ethics review board. We confirmed that any details including figures can be published.
Acknowledgments
We thank all collaborators of the multidisciplinary team at the First Affiliated Hospital of Sun Yat-sen University. We are grateful for the public use of the X tile open-source software developed by Yale University.
Author Contributions
All authors made great contribution to this study related to the conception, study design and execution. Data acquisition, analysis and interpretation were operated by each participant. All authors critically drafted, revised and reviewed this article; agreed on the submitted journal and the final version; agreed to be accountable for the contents of this work.
Funding
This work was supported by the grants from National Natural Science Foundation of China (grant numbers #82070538, #81870374, and #82270555), and Guangdong Science and Technology Department (grant number 2021A1515220107).
Disclosure
The authors have no conflicts of interests to declare.
References
1. Mak WY, Zhao M, Ng SC, Burisch J. The epidemiology of inflammatory bowel disease: east meets west. J Gastroenterol Hepatol. 2019;35:380–389. doi:10.1111/jgh.14872
2. Eisenstein M. Ulcerative colitis: towards remission. Nature. 2018;563(7730):S33. doi:10.1038/d41586-018-07276-2
3. Kaplan GG. The global burden of IBD: from 2015 to 2025. Nat Rev Gastroenterol Hepatol. 2015;12(12):720–727. doi:10.1038/nrgastro.2015.150
4. Burisch J, Lophaven S, Munkholm P, Langholz E. Surgery, cancer and mortality among patients with ulcerative colitis diagnosed 1962–1987 and followed until 2017 in a Danish population-based inception cohort. Aliment Pharmacol Ther. 2022;55(3):339–349. doi:10.1111/apt.16677
5. Mattioli G, Barabino A, Aloi M, et al. Paediatric ulcerative colitis surgery: Italian survey. J Crohns Colitis. 2015;9(7):558–564. doi:10.1093/ecco-jcc/jjv065
6. Cucchiara S, Stronati L. Ulcerative colitis: paediatric ulcerative colitis--can we predict proctocolectomy? Nat Rev Gastroenterol Hepatol. 2012;9(9):494–495. doi:10.1038/nrgastro.2012.153
7. Brandse JF, van den Brink GR, Wildenberg ME, et al. Loss of infliximab into feces is associated with lack of response to therapy in patients with severe ulcerative colitis. Gastroenterology. 2015;149(2):350–355.e352. doi:10.1053/j.gastro.2015.04.016
8. Peyrin-Biroulet L, Danese S, Argollo M, et al. Loss of response to vedolizumab and ability of dose intensification to restore response in patients with crohn’s disease or ulcerative colitis: a systematic review and meta-analysis. Clin Gastroenterol Hepatol. 2019;17(5):838–846.e832. doi:10.1016/j.cgh.2018.06.026
9. Protic M, Seibold F, Schoepfer A, et al. The effectiveness and safety of rescue treatments in 108 patients with steroid-refractory ulcerative colitis with sequential rescue therapies in a subgroup of patients. J Crohns Colitis. 2014;8(11):1427–1437. doi:10.1016/j.crohns.2014.05.004
10. Stellingwerf ME, Sahami S, Winter DC, et al. Prospective cohort study of appendicectomy for treatment of therapy-refractory ulcerative colitis. Br J Surg. 2019;106(12):1697–1704. doi:10.1002/bjs.11259
11. Chakravarty BJ. Predictors and the rate of medical treatment failure in ulcerative colitis. Am J Gastroenterol. 1993;88(6):852–855.
12. Kirchgesner J, Desai RJ, Schneeweiss MC, Beaugerie L, Schneeweiss S, Kim SC. Decreased risk of treatment failure with vedolizumab and thiopurines combined compared with vedolizumab monotherapy in Crohn’s disease. Gut. 2022;71(9):1781–1789. doi:10.1136/gutjnl-2022-327002
13. Wang M, Zhao J, Wang H, Zheng C, Chang B, Sang L. Methotrexate showed efficacy both in Crohn’s disease and ulcerative colitis, predictors of surgery were identified in patients initially treated with methotrexate monotherapy. Front Pharmacol. 2022;13:996065. doi:10.3389/fphar.2022.996065
14. Dalal RS, Osterman MT, Buchner AM, Praestgaard A, Lewis JD, Lichtenstein GR. A user-friendly prediction tool to identify colectomy risk in patients with ulcerative colitis. Inflamm Bowel Dis. 2019;25(9):1550–1558. doi:10.1093/ibd/izz014
15. Arijs I, Li K, Toedter G, et al. Mucosal gene signatures to predict response to infliximab in patients with ulcerative colitis. Gut. 2009;58(12):1612–1619. doi:10.1136/gut.2009.178665
16. Johansson ME, Gustafsson JK, Holmen-Larsson J, et al. Bacteria penetrate the normally impenetrable inner colon mucus layer in both murine colitis models and patients with ulcerative colitis. Gut. 2014;63(2):281–291. doi:10.1136/gutjnl-2012-303207
17. EEL N, Martinez-Abad B, Arike L, et al. An intercrypt subpopulation of goblet cells is essential for colonic mucus barrier function. Science. 2021;372:6539.
18. van der Post S, Jabbar KS, Birchenough G, et al. Structural weakening of the colonic mucus barrier is an early event in ulcerative colitis pathogenesis. Gut. 2019;68(12):2142–2151. doi:10.1136/gutjnl-2018-317571
19. Takishima K, Maeda Y, Ogata N, et al. Beyond complete endoscopic healing: goblet appearance using an endocytoscope to predict future sustained clinical remission in ulcerative colitis. Dig Endosc. 2022;34(5):1030–1039. doi:10.1111/den.14202
20. Ozaki R, Kobayashi T, Okabayashi S, et al. Histological risk factors to predict clinical relapse in ulcerative colitis with endoscopically normal mucosa. J Crohns Colitis. 2018;12(11):1288–1294. doi:10.1093/ecco-jcc/jjy092
21. Van der Sluis M, De Koning BA, De Bruijn AC, et al. Muc2-deficient mice spontaneously develop colitis, indicating that MUC2 is critical for colonic protection. Gastroenterology. 2006;131(1):117–129. doi:10.1053/j.gastro.2006.04.020
22. Dignass A, Eliakim R, Magro F, et al. Second European evidence-based consensus on the diagnosis and management of ulcerative colitis part 1: definitions and diagnosis. J Crohns Colitis. 2012;6(10):965–990. doi:10.1016/j.crohns.2012.09.003
23. Lobatón T, Bessissow T, De Hertogh G, et al. The Modified Mayo Endoscopic Score (MMES): a new index for the assessment of extension and severity of endoscopic activity in ulcerative colitis patients. J Crohns Colitis. 2015;9(10):846–852. doi:10.1093/ecco-jcc/jjv111
24. Bitton A, Peppercorn MA, Antonioli DA, et al. Clinical, biological, and histologic parameters as predictors of relapse in ulcerative colitis. Gastroenterology. 2001;120(1):13–20. doi:10.1053/gast.2001.20912
25. Li Y, Nuij VJ, Baars JE, et al. Increased suppressor of cytokine signaling-3 expression predicts mucosal relapse in ulcerative colitis. Inflamm Bowel Dis. 2013;19(1):132–140. doi:10.1002/ibd.22992
26. Mañosa M, García V, Castro L, et al. Methotrexate in ulcerative colitis: a Spanish multicentric study on clinical use and efficacy. J Crohns Colitis. 2011;5(5):397–401. doi:10.1016/j.crohns.2011.03.012
27. Laharie D, Bourreille A, Branche J, et al. Ciclosporin versus infliximab in patients with severe ulcerative colitis refractory to intravenous steroids: a parallel, open-label randomised controlled trial. Lancet. 2012;380(9857):1909–1915. doi:10.1016/S0140-6736(12)61084-8
28. Beswick L, Rosella O, Rosella G, et al. Exploration of predictive biomarkers of early infliximab response in acute severe colitis: a prospective pilot study. J Crohns Colitis. 2018;12(3):289–297. doi:10.1093/ecco-jcc/jjx146
29. Obraztsov IV, Shirokikh KE, Obraztsova OI, Shapina MV, Wang MH, Khalif IL. Multiple cytokine profiling: a new model to predict response to tumor necrosis factor antagonists in ulcerative colitis patients. Inflamm Bowel Dis. 2019;25(3):524–531. doi:10.1093/ibd/izy358
30. Camp RL, Dolled-Filhart M, Rimm DL. X-tile: a new bio-informatics tool for biomarker assessment and outcome-based cut-point optimization. Clin Cancer Res. 2004;10(21):7252–7259. doi:10.1158/1078-0432.CCR-04-0713
31. Faubion WA
32. Ng SC, Tang W, Ching JY, et al. Incidence and phenotype of inflammatory bowel disease based on results from the Asia-pacific Crohn’s and colitis epidemiology study. Gastroenterology. 2013;145(1):158–165.e152. doi:10.1053/j.gastro.2013.04.007
33. Yoon JY, Cheon JH, Park JJ, Hong SP, Kim TI, Kim WH. Clinical outcomes and factors for response prediction after the first course of corticosteroid therapy in patients with active ulcerative colitis. J Gastroenterol Hepatol. 2011;26(7):1114–1122. doi:10.1111/j.1440-1746.2011.06688.x
34. Turner D, Leach ST, Mack D, et al. Faecal calprotectin, lactoferrin, M2-pyruvate kinase and S100A12 in severe ulcerative colitis: a prospective multicentre comparison of predicting outcomes and monitoring response. Gut. 2010;59(9):1207–1212. doi:10.1136/gut.2010.211755
35. Schechter A, Griffiths C, Gana JC, et al. Early endoscopic, laboratory and clinical predictors of poor disease course in paediatric ulcerative colitis. Gut. 2015;64(4):580–588. doi:10.1136/gutjnl-2014-306999
36. Hamanaka S, Nakagawa T, Hiwasa T, et al. Investigation of novel biomarkers for predicting the clinical course in patients with ulcerative colitis. J Gastroenterol Hepatol. 2018;33(12):1975–1983. doi:10.1111/jgh.14297
37. Arias MT, Vande Casteele N, Vermeire S, et al. A panel to predict long-term outcome of infliximab therapy for patients with ulcerative colitis. Clin Gastroenterol Hepatol. 2015;13(3):531–538. doi:10.1016/j.cgh.2014.07.055
38. McAuley JL, Linden SK, Png CW, et al. MUC1 cell surface mucin is a critical element of the mucosal barrier to infection. J Clin Invest. 2007;117(8):2313–2324. doi:10.1172/JCI26705
39. McDermott KM, Crocker PR, Harris A, et al. Overexpression of MUC1 reconfigures the binding properties of tumor cells. Int J Cancer. 2001;94(6):783–791. doi:10.1002/ijc.1554
40. Breugelmans T, Van Spaendonk H, De Man JG, et al. In-depth study of transmembrane mucins in association with intestinal barrier dysfunction during the course of T cell transfer and DSS-induced colitis. J Crohns Colitis. 2020;14(7):974–994. doi:10.1093/ecco-jcc/jjaa015
41. Swidsinski A, Loening-Baucke V, Theissig F, et al. Comparative study of the intestinal mucus barrier in normal and inflamed colon. Gut. 2007;56(3):343–350. doi:10.1136/gut.2006.098160
42. Singh V, Johnson K, Yin J, et al. Chronic inflammation in ulcerative colitis causes long-term changes in goblet cell function. Cell Mol Gastroenterol Hepatol. 2022;13(1):219–232. doi:10.1016/j.jcmgh.2021.08.010
43. Larsson JM, Karlsson H, Crespo JG, et al. Altered O-glycosylation profile of MUC2 mucin occurs in active ulcerative colitis and is associated with increased inflammation. Inflamm Bowel Dis. 2011;17(11):2299–2307. doi:10.1002/ibd.21625
44. Bessissow T, Kron CM, Marcus V, et al. Impact of endoscopic and histologic activity on disease relapse in ulcerative colitis. Am J Gastroenterol. 2022;117(10):1632–1638. doi:10.14309/ajg.0000000000001912
45. Ohara J, Nemoto T, Maeda Y, Ogata N, Kudo SE, Yamochi T. Deep learning-based automated quantification of goblet cell mucus using histological images as a predictor of clinical relapse of ulcerative colitis with endoscopic remission. J Gastroenterol. 2022;57(12):962–970. doi:10.1007/s00535-022-01924-1
46. Tursi A, Elisei W, Picchio M, et al. Managing ambulatory ulcerative colitis patients with infliximab: a long term follow-up study in primary gastroenterology centers. Eur J Intern Med. 2014;25(8):757–761. doi:10.1016/j.ejim.2014.07.007
47. Peyrin-Biroulet L, Loftus EV
 © 2023 The Author(s). This work is published and licensed by Dove Medical Press Limited. The
full terms of this license are available at https://www.dovepress.com/terms
and incorporate the Creative Commons Attribution
- Non Commercial (unported, 3.0) License.
By accessing the work you hereby accept the Terms. Non-commercial uses of the work are permitted
without any further permission from Dove Medical Press Limited, provided the work is properly
attributed. For permission for commercial use of this work, please see paragraphs 4.2 and 5 of our Terms.
© 2023 The Author(s). This work is published and licensed by Dove Medical Press Limited. The
full terms of this license are available at https://www.dovepress.com/terms
and incorporate the Creative Commons Attribution
- Non Commercial (unported, 3.0) License.
By accessing the work you hereby accept the Terms. Non-commercial uses of the work are permitted
without any further permission from Dove Medical Press Limited, provided the work is properly
attributed. For permission for commercial use of this work, please see paragraphs 4.2 and 5 of our Terms.
Recommended articles
Exploring the Relevance of Disulfidptosis to the Pathophysiology of Ulcerative Colitis by Bioinformatics Analysis
Xiong Z, Fang Y, Lu S, Sun Q, Sun Y, Yang P, Huang J
Journal of Inflammation Research 2024, 17:2757-2774
Published Date: 7 May 2024