")
Back to Journals » Journal of Inflammation Research » Volume 16
A Novel Neutrophil Extracellular Traps Signature for Overall Survival Prediction and Tumor Microenvironment Identification in Gastric Cancer
Authors Qu Z, Han Y, Zhu Q, Ding W, Wang Y, Zhang Y , Wei W, Lei Y, Li M, Jiao Y, Gu K, Zhang Y
Received 28 April 2023
Accepted for publication 4 July 2023
Published 14 August 2023 Volume 2023:16 Pages 3419—3436
DOI https://doi.org/10.2147/JIR.S417182
Checked for plagiarism Yes
Review by Single anonymous peer review
Peer reviewer comments 2
Editor who approved publication: Professor Ning Quan
Ziting Qu,1,* Yanxun Han,2,* Qingbo Zhu,1,* Wenxi Ding,1 Yuyan Wang,1 Yan Zhang,1 Wei Wei,1 Yu Lei,1 Min Li,1 Yang Jiao,1 Kangsheng Gu,1,* Yiyin Zhang1,*
1Department of Oncology, The First Affiliated Hospital of Anhui Medical University, Hefei, Anhui, People’s Republic of China; 2Department of Otolaryngology, Head and Neck Surgery, The First Affiliated Hospital of Anhui Medical University, Hefei, Anhui, People’s Republic of China
*These authors contributed equally to this work
Correspondence: Kangsheng Gu; Yiyin Zhang, Department of Oncology, The First Affiliated Hospital of Anhui Medical University, 218th Jixi Road, Hefei, Anhui, 230022, People’s Republic of China, Email [email protected]; [email protected]
Background: Neutrophil extracellular traps (NETs) released by neutrophils are crucial for cancer development, metastasis, and can indicate gastric cancer (GC) patients’ prognosis. This study reveals the relevance of NETs-related genes to GC through transcriptome analysis.
Methods: We obtained transcriptome sequencing data of GC from UCSC Xena and screened prognostic NETs-related genes by GEPIA2 database. The signature for NETs was subsequently created using the LASSO–Cox regression. The clinical value of model was further explored using the nomogram and was externally validated by the GEO database. After that, we employed GO, KEGG, and GSEA enrichment analyses to evaluate the bio-functional enrichment and related pathways. Additionally, ESTIMATE, MCP counter, and ssGSEA scores were used to investigate the immunological microenvironment of GC patients. Finally, in the external cohort, neutrophil elastase (NE)-DNA complexes were measured by ELISA, and the prognostic value of NE-DNA in GC was investigated using Cox analysis.
Results: Seven NETs-associated genes (PDE4B, CD93, CTSG, IL6, ELANE, KCNJ15, and CRISPLD2) were filtered to establish the signature and participated in building the nomogram. In comparison to the high-risk group, the overall survival (OS) was much longer in the low-risk group (P=0.005). The validation cohort demonstrated the acceptable predictive ability of the nomogram. The signature was enriched in biological features such as extracellular matrix organization, epithelial-mesenchymal transition and inflammatory response. Moreover, there were substantial differences in immune cell infiltration across the different risk groups (p< 0.001), especially the high-risk group having more immune cells that are engaged in the antigen presentation process and associated functions. Finally, in the external cohort, NE-DNA levels were shown to be an independent factor affecting OS prognosis (p=0.006).
Conclusion: Overall, this research identified a novel signature based on seven NETs-associated genes to predict prognosis and identify tumor microenvironment of GC. And high NE-DNA level may be a critical factor in the poor OS associated with NETs.
Keywords: NETs, gastric cancer, gene signature, tumor microenvironment, prognosis
Introduction
Gastric cancer (GC) remains the fifth most common malignancy and the fourth most frequent cause of cancer mortality globally, with more than 700,000 deaths reported in 2020. With the use of surgical surgery, chemotherapy, targeted treatment, and immunotherapy in combination, the prognosis of GC patients has significantly improved.1–3 However, overall survival (OS) remains unsatisfactory for patients with advanced GC. In clinical practice, there are few biomarkers that may forecast GC patients’ prognoses. Therefore, it is urgent to explore new GC prognostic markers and establish prognostic models to improve the efficacy of individualized treatment for GC.
Cancer-associated inflammation is an essential driver of tumorigenesis and progression.4 Immune cell infiltration in the tumor microenvironment (TME) is critical for tumor development, metastasis, and immunotherapy efficacy.5,6 As the most numerous immune cells in peripheral blood (PB), the significance of circulating and infiltrating neutrophils in tumor development and progression is of increasing concern. For instance, cancer patients with infiltrating tumor-associated neutrophils (TANs) had a worse prognosis.7 Furthermore, according to our earlier research, NLR level in PB is an independent prognostic predictor in GC patients treated with immunotherapy.8
In recent years, neutrophil extracellular traps (NETs) have been documented as an effector function of neutrophils, which consist of extracellular DNA fibers composed of histones and granulins proteins, including myeloperoxidase (MPO), neutrophil elastase (ELANE/NE), matrix metalloproteinase 9 (MMP-9), and others.9 Additionally, the process of cell death accompanied by NETs creation is known as “NETosis”. In numerous clinical conditions, including infection,9 autoimmunity,10 and cancer,11 NETs play an essential role in the innate immune response, according to mounting data. Among them, the clinical application of NETs in cancers has received much attention recently. The association of NETs with malignancy was initially reported in patients with Ewing sarcoma, and tumor-associated NETs were associated with poor prognoses.12 Many researches have demonstrated that NETs can influence the development of multiple malignancies in different ways, including colorectal cancer,13 head and neck squamous cell carcinoma (HNSCC),14 and ovarian cancer.15 Additionally, circulating NETs play a role in tumor-induced systemic effects outside the tumor tissue. DNA fragments and protein granules can be released into the PB when NETs degrade into soluble ribosomes.16 Previous studies have demonstrated an association between high NETs plasma levels and high mortality in cancer patients.17 And patients with advanced cancer who have NETs in PB have a poor prognosis.18 Notably, A recent study found that a unique NETs signature based on seven NETs-associated genes can predict patients’ prognosis for HNSCC.19 Furthermore, our preliminary analysis revealed that NETs were found in the tumor microenvironment, serum, and plasma of GC patients and that NETs were closely related to diagnosis, therapy prediction, and progression-free survival (PFS) in GC patients.20 However, further research is still required to ascertain the impact of NETs levels in distinct cancer types on the OS of tumor patients.
In conclusion, NETs are crucial for the development and metastasis of tumors. Nevertheless, the prognostic value of NETs-associated genes in GC patients and their relationship with the immune microenvironment remain unknown. In the current work, we developed a scoring model based on seven genes related with NETs to forecast the prognosis of GC patients. And we verified the results in the GSE62254 cohort and the external cohort. Concretely, our specific objectives are as follows: i) To build and validate the nomogram based on NETs-associated genes by TCGA and GSE62254 cohort, respectively. ii) To perform functional enrichment analysis of the NETs-associated gene signature. iii) To conduct tumor immune microenvironment analysis of NETs-associated gene signature. iv) To validate the prognostic significance of NETs in GC patients by the external cohort.
Materials and Methods
Data Gathering and Preparation in Public Databases
Clinical data and RNA-sequencing data (348 STAD samples) for the Cancer Genome Atlas (TCGA) database were obtained from UCSC Xena (https://xena.ucsc.edu/). The RNA-seq data and clinical information for the external validation cohort were also retrieved from the GEO database (https://www.ncbi.nlm.nih.gov/geo/, ID: GSE62254). Additional file 1: Table S1 lists eighty-seven NETs-related genes that were gathered from prior researches.21,22 In order to analyze the results more accurately, we used the ComBat algorithm of the R package “sva” to correct the batch effects of the two datasets, which are shown in Additional file 2: Figure S1. Subsequently, we analyzed the NETs-related genes to overall survival using the GEPIA2 database (http://gepia2.cancer-pku.cn/).
Construction and Assessment of the Prognostic Signature Based on NETs-Associated Genes
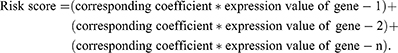
The TCGA cohort was utilized as the training group to establish the predictive signature of STAD patients using the LASSO–Cox regression. The signature risk score was created using the coefficient and expression level of each gene. The equation was:
Construction and Assessment of the Nomogram
Univariate and multivariate Cox regression analyses were used to uncover independent prognostic factors and were presented with forest plots. Afterwards, using the “rms” and “survival” R packages, a nomogram was created to predict the 1-, 3-, and 5-year OS of GC patients using the risk score and pertinent clinical characteristics from the training cohort. Next, the accuracy and discriminative capability of the nomogram were then evaluated using the concordance index (C-index), time-dependent receiver operating characteristic curves (ROC), and calibration plots. Finally, the nomogram was subjected to additional external validation in the GSE62254 cohort.
Functional Enrichment Analysis of the NETs-Related Gene Signature
Based on the median risk score, patients in the training cohort were separated into low- and high-risk groups. The differentially expressed genes (DEGs) between the two groups were identified using the criteria of |log2FC|≥1 and FDR<0.05. GO and KEGG pathway enrichment analyses of the DEGs were carried out using the “clusterProfiler” R package with the criteria of p<0.05 and FDR<0.05. And the “GOplot” package was employed to visualize the enrichment terms. Based on the “Reactome” and “Hallmark” gene sets, GSEA was utilized to further investigate biological function differences between the two groups.23
Relationship Between Prognostic Signature and Immune Infiltration
To further analyze the differences in immune infiltration of tumors, we used the MCP counter and ESTIMATE algorithms to estimate the multitude of immune infiltrating cells and immune infiltration status. In addition, we determined the enrichment scores of 16 various types of immune cells as well as the activity of 13 immune-related networks using the ssGSEA algorithm and the “gsva” R package. Using the Wilcoxon test, violin plots were created to compare the variations in immune infiltration between groups.
Patients and Follow–Up in External Validation Cohort
Seventy-two advanced GC patients were enrolled by Department of Oncology, the First Affiliated Hospital of Anhui Medical University. This project was approved by the Ethics Committee of the First Affiliated Hospital of Anhui Medical University (Quick-PJ2022-03-34). And the study was conducted in accordance with the guidelines of the Declaration of Helsinki. Additionally, the electrical medical record system was used to collect the clinical data, and either telephone follow-up or the medical record system was used to obtain the follow-up data. The OS was estimated from the first treatment date until the patient died or had their last follow-up. The deadline for follow-up of the research was July 20, 2022. Treatment continued until the disease progressed, the toxicity became intolerable, or the consent was withdrawn. Table 1 is a list of the clinical data for all patients who were covered. X-tile software established the cut-off values (version 3.6.1).
 |
Table 1 Baseline Clinical Characteristics of Advanced Gastric Cancer Patients |
Detection of NETs in PB Samples
Patients with advanced GC had their PB samples taken no more than one month before starting therapy. For the purpose of evaluating NE-DNA complexes, serums were extracted from PB samples using centrifugation. It was thought that NE linked to nucleosomes in PB sample serum indicated the establishment of NETs. NE-DNA complexes were discovered using ELISA. 96-well microtiter plates (50µL each well) were coated with 5 µg/mL anti-NE antibody and left overnight at 4 °C. 40µL of serums were added to the wells containing a peroxidase-labeled anti-DNA antibody after being blocked in 1% BSA. The wells were cleaned three times with PBS following a two-hour incubation with shaking at room temperature. The wells received a peroxidase substrate from a kit. After 40 minutes of incubation at 37 degrees Celsius in the dark, the optical density (OD) was assessed using a microplate reader at a 405nm wavelength. The quantification of NE-DNA was reflected in the OD value. The specific experimental approach is consistent with our previous study.20
Statistical Analysis
Qualitative variables were analyzed between groups through the χ2 test or Fisher’s exact test. And Quantitative data were compared using the Wilcoxon test. Prognostic factors were examined using univariate and multivariate Cox regression, and the 95% confidence interval (CI) was provided. HER-2 status and other factors with P<0.05 in univariate Cox regression analysis were included in multivariate Cox regression analyses using stepwise backward regression. The model’s clinical value was demonstrated using the concordance index (C-index), time-dependent ROC curve, calibration curve and decision curve analysis (DCA). The Kaplan-Meier analysis was used to compare the survival outcomes for various groups. Additionally, the Log-rank test was frequently used to evaluate the statistical importance of differentiating groups. P<0.05 was regarded as statistically significant for all tests. R software version 4.0.2 and SPSS version 26.0 (SPSS Inc., Chicago, IL, USA) were used to conduct statistical analyses.
Results
Identification of Prognostic NETs-Related Genes in GC
We obtained eighty-seven NETs-related genes through previous research, which was depicted in (Additional file 1: Table S1). Subsequently, through the analysis of the online GEPIA2 database, we obtained nine NETs-related genes with significant survival significance in GC (Figure 1A–I). To further analyze the role of the above genes in GC. The datasets from TCGA and GSE62254 were obtained and analyzed. From the UMAP plot, we can observe that the samples of different datasets were clustered together before processing, suggesting a batch effect between the two datasets (Additional file 2: Figure S1A). After removing the batch effect, the samples in each dataset are clustered together (Additional file 2: Figure S1B), suggesting that the batch effect is better removed by the cross-platform normalization process, which makes the subsequent analysis results more reliable. After removing samples with missing survival information and poor RNA-sequencing data quality, we obtained 348 and 300 samples in the TCGA and GSE62254, respectively.
 |
Figure 1 Identification of prognostic NETs-related genes in GC from TCGA dataset. Kaplan-Meier curves for the nine prognostic NETs-related genes, including (A) PDE4B. (B) G0S2. (C) ELANE. (D) CTSG. (E) CRISPLD2. (F) CREB5. (G) CD93. (H) KCNJ15. (I) IL6. |
Establishment and Validation of the Seven NETs-Related Gene Signature
Seven of the nine NETs-related genes that were significantly related to GC prognosis were chosen using regression analysis to create the signature. Each sample’s risk score was calculated using the following formula:  They were divided into high- and low-risk groups using the median as the cutoff (Figure2A–D). The heat map shows how signature genes are expressed differently in various groups. Differential expression of signature genes in various groups is shown by the heat map (Figure 2E). Patients in the high-risk group had substantially shorter OS than patients in the low-risk group, according to the Kaplan-Meier survival curve (p<0.05; Figure 2F). Subsequently, in the GSE62254 cohort, we obtained similar results (Figure 3A–C and E). Additionally, The predictive value of the signature was also evaluated using time-dependent ROC curves, AUCs at 1, 3, and 5 years being 0.602, 0.634, and 0.692 in TCGA, respectively (Figure 2G). At 1, 3, and 5 years, respectively, the AUC of GSE62254 was 0.606, 0.626, and 0.637 (Figure 3D).
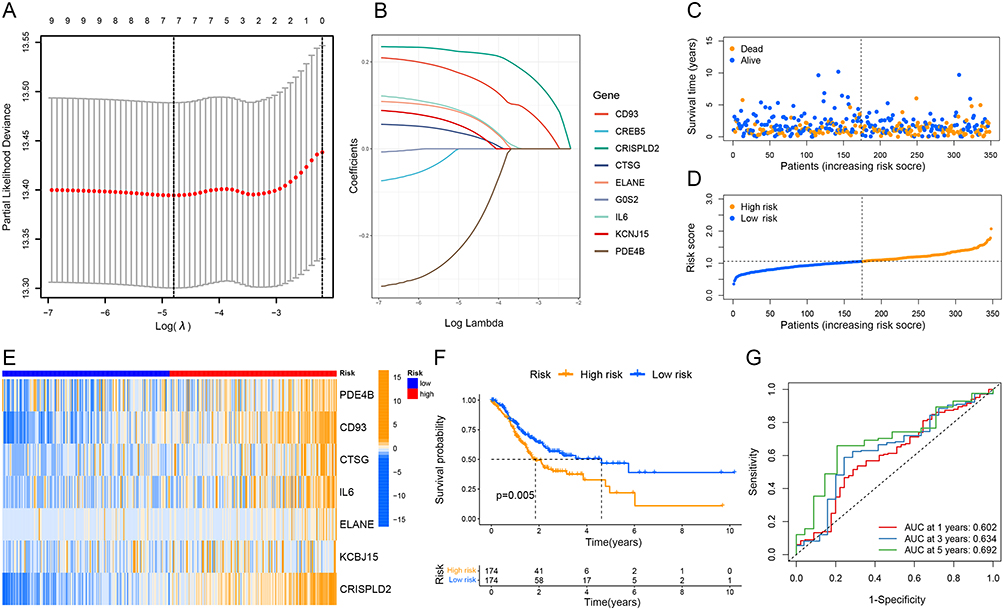 |
Figure 2 Construction and assessment of the prognostic signature based on NETs-associated genes in the TCGA dataset. (A and B) The coefficient and partial likelihood deviance of the prognostic signature. (C and D) Patients’ survival status and risk score distribution of the prognostic signature. (E) The heatmap of the seven screened NETs-related genes. (F) Kaplan–Meier curves for the OS of the signature between different risk groups. (G) Time-dependent ROC curves demonstrated the predictive efficiency of the prognostic signature. |
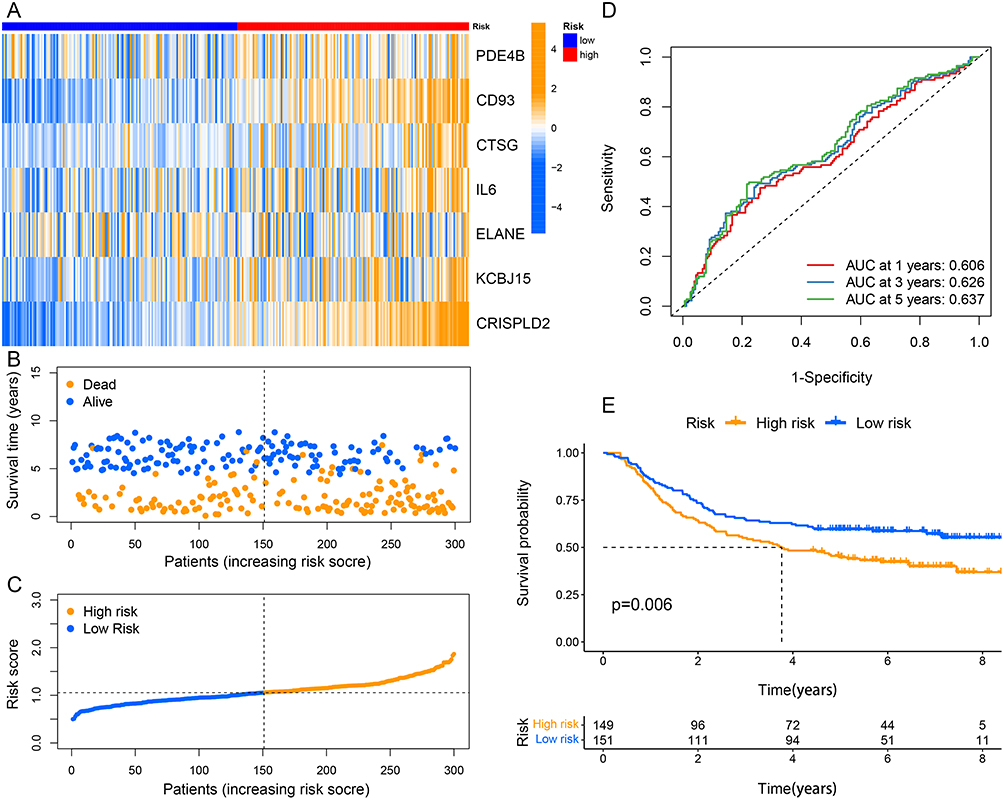 |
Figure 3 Validation of the prognostic signature in the GSE62254 cohort. (A) The heatmap of the seven screened NETs-related genes. (B and C) Patients’ survival status and risk score distribution of the prognostic signature. (D) Time-dependent ROC curves in the validation cohort. (E) Kaplan–Meier curves for comparison of the OS between different risk groups. |
Correlation of the Signature with Clinicopathological Characteristics
To further explore the relationship between risk scores and clinicopathological variables, we analyzed the distribution of risk scores for various clinicopathological characteristics (Figure 4A). The distribution of risk scores for age, gender, N stage, M stage, and stage was not substantially different as revealed by the heat map, while the risk score was higher for higher grades and T stages (p<0.05; Figure 4B and C).
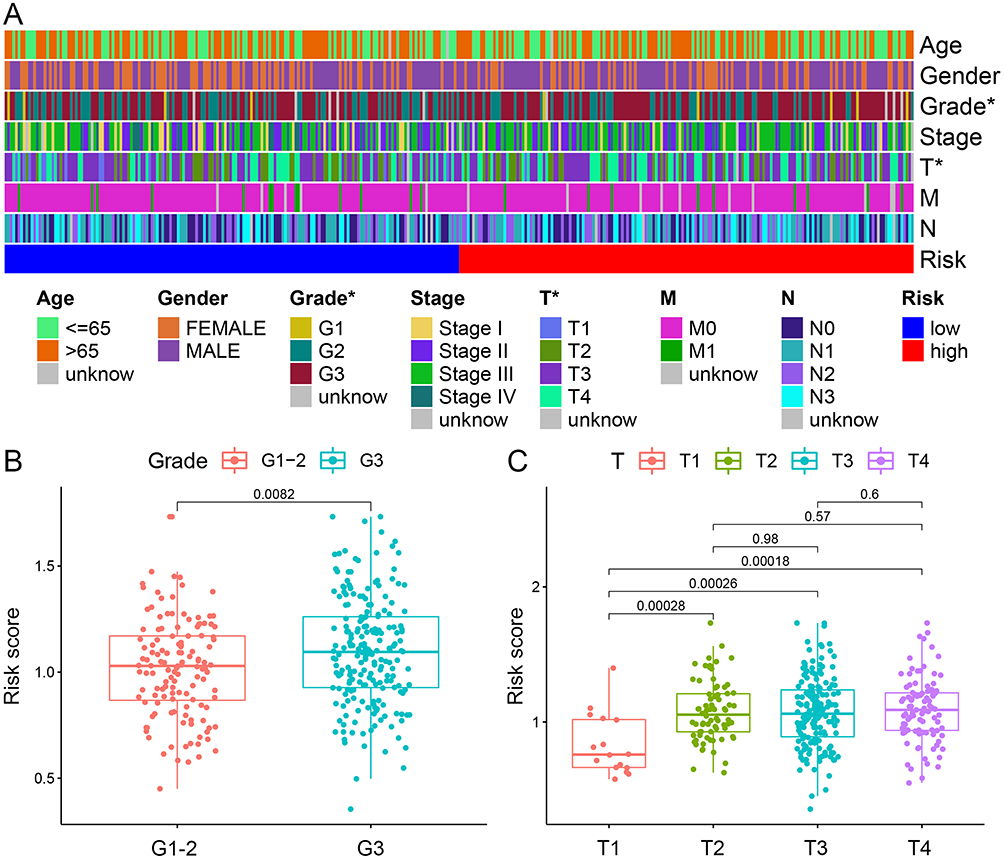 |
Figure 4 Correlation of the signature with clinicopathological characteristics. (A) A complex heat map illustrated the correlation between the signature and clinicopathological characteristics (*P<0:05). Boxplots demonstrated the differences in risk score across clinicopathological characteristics including, (B) Grade and (C) T stage. |
Establishment and Validation of the Nomogram Based on Seven NETs-Related Genes Signature
Following both univariate and multivariate Cox regression analysis, risk score, age, and stage were found to significantly affect OS prognosis (Figure 5A and B). They were chosen to structure the nomogram for prognostic prediction. The nomogram was utilized to determine the associated scores for each factor, and the overall score served as a prognostic indicator (Figure 5C). And we found that the consistency index (C-index) of nomogram predictions was better than risk scores alone or any other single variable, suggesting that the predictive efficiency of nomogram signatures is better when various clinical factors are taken into account (Figure 5D). Calibration curves for 1, 3, and 5 years were plotted to show the agreement of the actual observed predictive values with the predicted values of the nomogram (Figure 5E). And the nomogram had a higher clinical benefit and better potential for clinical application than a single variable according to DCA curves (Figure 5F–H).
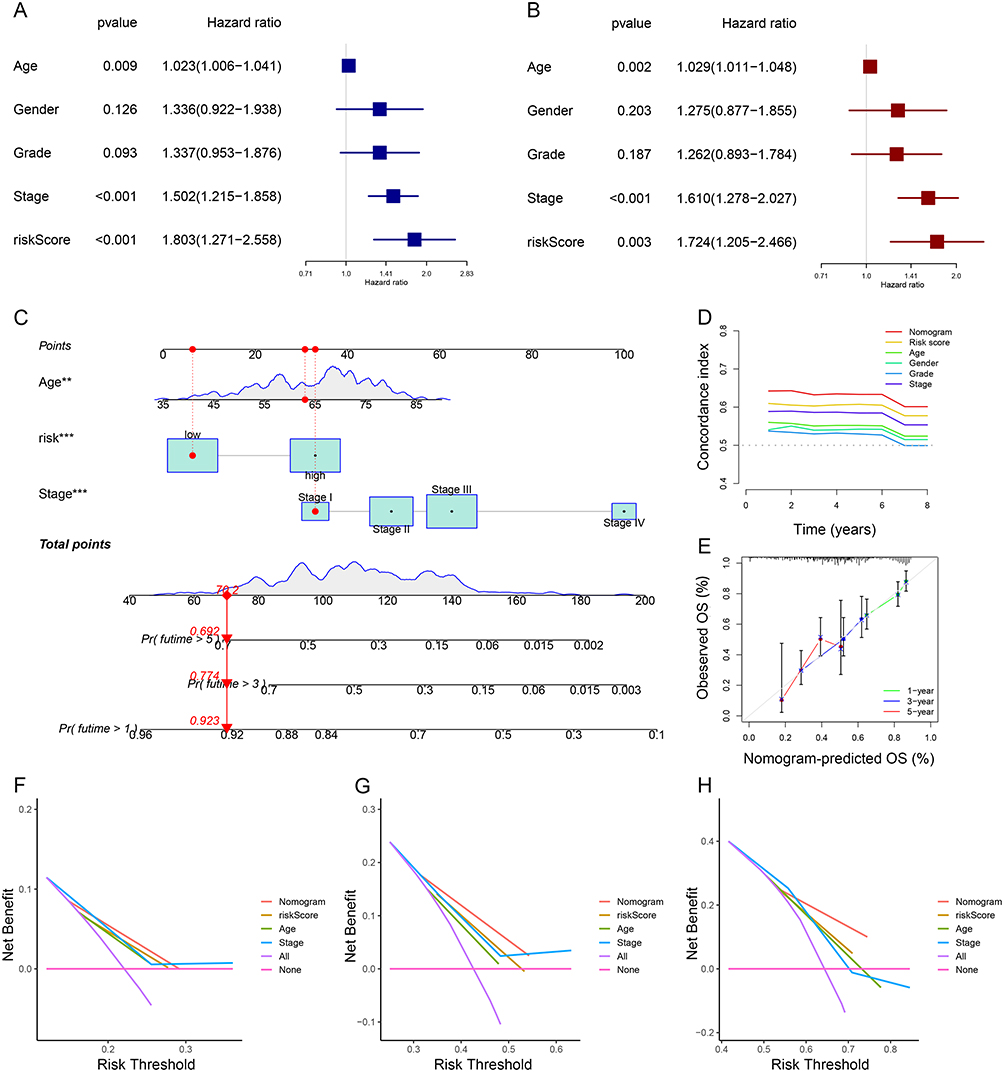 |
Figure 5 Establishment and validation of the nomogram based on seven NETs-related genes signature. (A and B) Univariate and multivariate Cox regression analyses for the signature and clinical features by forest plots. (C) Nomogram to predict 1-, 3-, and 5- year OS of GC patients. (D and E) C-index and Calibration plots analysis to assess the accuracy of nomogram in GC patients. (F–H) DCA curves to assess the accuracy of the nomogram to predict 1-, 3-, and 5- year OS in GC patients (**P < 0.01, ***P < 0.001). |
Functional Enrichment Analysis of the Seven NETs-Related Gene Signature
GO and KEGG analyses on the DEGs of both high- and low-risk groups were performed. The extracellular matrix organization, extracellular structure organization, external encapsulating structure organization, etc., were all present in DEGs, according to GO analyses (Figure 6A). Additionally, enrichment of neuroactive ligand-receptor interaction, protein digestion and absorption, ECM receptor interaction, etc. was found in the KEGG analysis results (Figure 6B). Afterwards, we further performed GSEA analysis. The high-risk group in the Reactome feature dataset was also strongly associated with interactions between the assembly of collagen fibrils and other multimeric structures, cardiac conduction, cell surface interactions at the vascular wall, etc. (Figure 6C). While the low-risk group was most significantly related to cell cycle checkpoints, DNA replication, DNA replication pre-initiation, etc. (Figure 6D). The high-risk group had considerably higher levels of apical junction, epithelial-mesenchymal transition, inflammatory response, and other factors in the Hallmark dataset (Figure 6E). Additionally, the Hallmark gene signatures including E2F targets, G2M checkpoint, MYC targets, etc. were highly enriched in the low-risk group (Figure 6F).
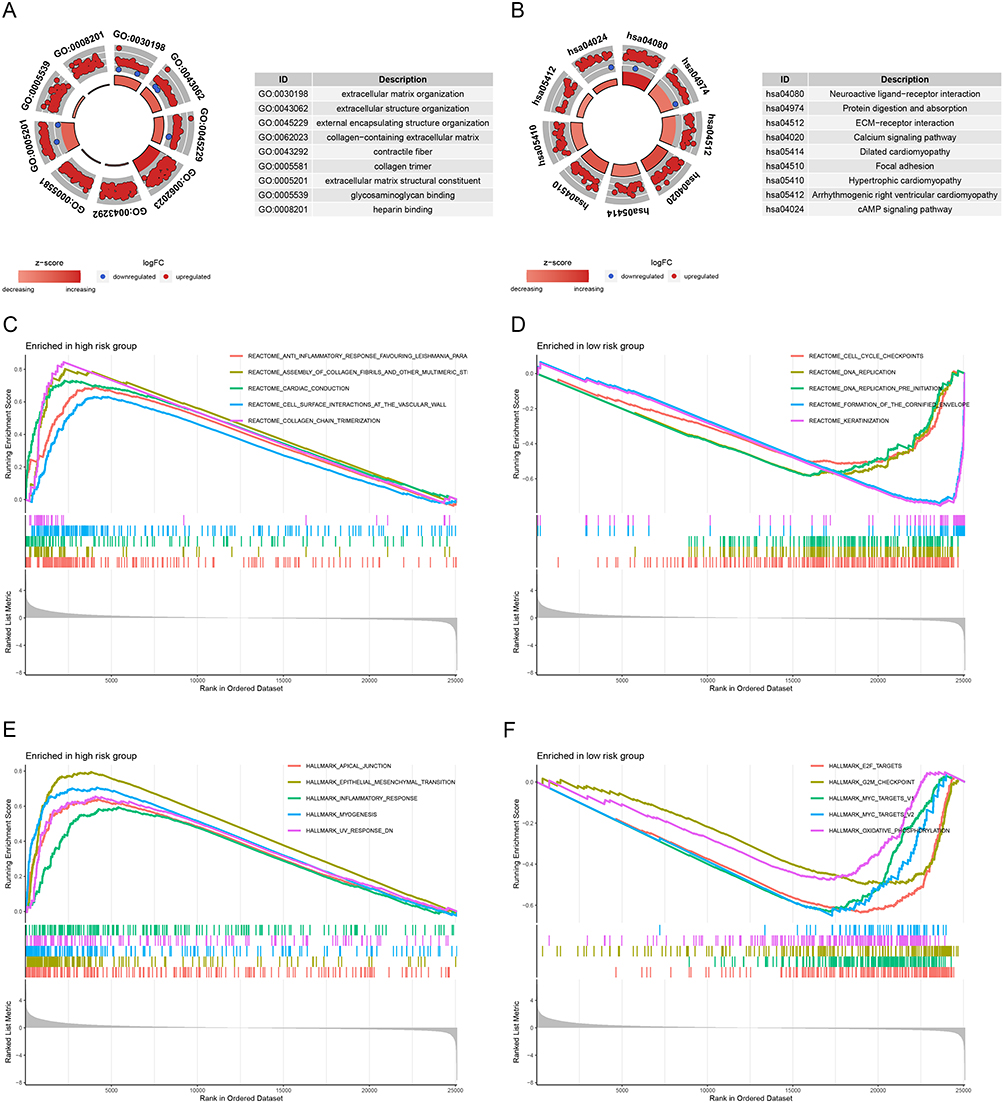 |
Figure 6 GO, KEGG, and GSEA functional enrichment analysis between different risk groups. (A) GO function enrichment of the signature. (B) KEGG pathway enrichment of the signature. (C and D) GSEA analysis of the signature in “Reactome” gene sets. (E and F) GSEA analysis of the signature based on “Hallmark” gene sets. |
Tumor Immune Microenvironment Analysis of Seven NETs-Related Gene Signature
Through a combination study of ESTIMATE, MCP counter, and ssGSEA, we discovered that patients in high-risk accumulated immune cells that infiltrated tumors. In particular, we investigated the association between the PRG signature and immune cell infiltration in the GC microenvironment. Compared to the low-risk group, the high-risk group had considerably higher StromalScore, ImmuneScore, and ESTIMATEScore scores (Figure 7A). The ssGSEA was used to analyze 16 different types of immune cells with 13 immunological-associated functions to further assess the immune status in the two categories. We found that the B-cell, DC, iDC, macrophage, mast cell, neutrophil, pDC, T helper cells, Tfh, TIL, and Treg scores in the high-risk subgroup were significantly higher than those in the low-risk group (Figure 7B). Additionally, the high-risk subgroup had increased activity in APC co-inhibition, APC co-stimulation, CCR, Checkpoint, Parainflammation, Type I IFN Response, and Type II IFN Response (Figure 7C). Besides, patients in the high-risk group had a more highly activated immune system than those in the low-risk group. Additionally, we used the MCP counter program to evaluate the immunological scores of the two subtype samples in the TCGA data sets, and the results revealed that there were substantial differences between the two groups in fibroblasts, endothelial cells, monocytic lineage, neutrophils, and B lineage (Figure 7D–M).
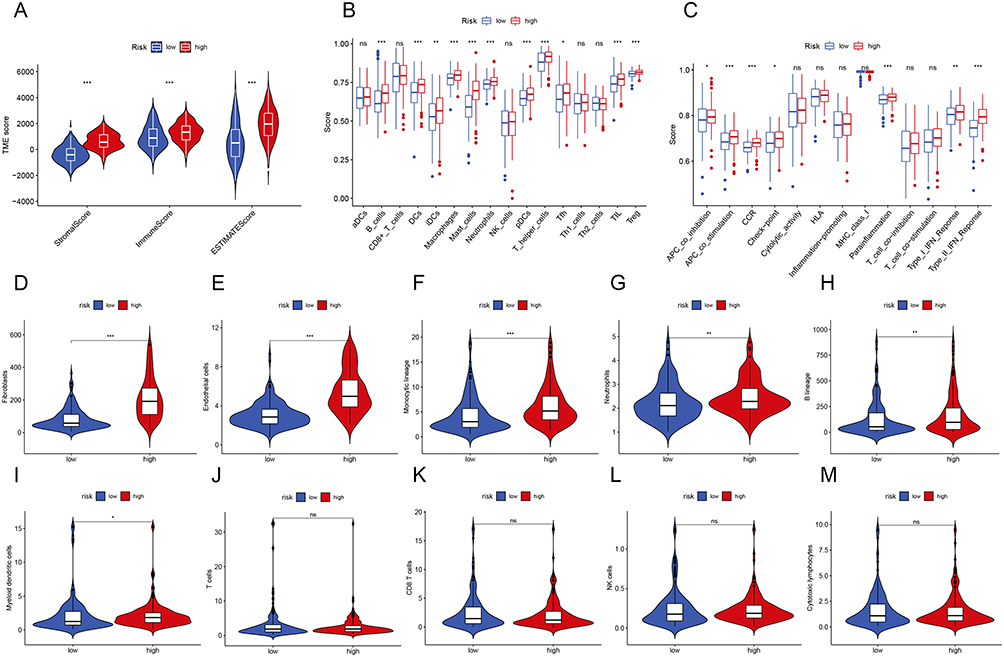 |
Figure 7 Relationship between Prognostic Signature and Immune Infiltration. (A) The ESTIMATE algorithms to assess immune-related scores. (B and C) Comparison of the enrichment scores of 16 immune cells and 13 immune-related functions between different risk groups. (D–M) Violin plots for immune infiltration based on MCP counter algorithms between different risk groups (*P < 0.05, **P < 0.01, ***P < 0.001). |
Prognostic Significance of NETs in GC in the External Validation Cohort
Seventy-two advanced GC patients were included in the research. There were fifty-three OS events among them. The median OS was 14.3 months (95% CI: 10.247–18.286). Following that, the cut-off values for NETs levels and other quantitative data were categorized by the X-tile software. Particularly, the cut-off value for NETs level was 0.38. Additionally, Table 1 lists the patient characteristics. Among them, D-dimer data were collected from Sixty-eight patients with four missing values. In comparison to patients with low NETs, NLR, and D-dimer levels at baseline, those with high levels of NETs, NLR, and D-dimer had shorter OS (NETs: HR: 2.590, 95% CI: 1.322–5.074, P=0.006; NLR: HR: 3.403, 95% CI: 1.543–7.508, P=0.002; D-dimer: HR: 2.124, 95% CI: 1.142–3.949, P=0.017, respectively) (Table 2). Additionally, the median OS duration was considerably greater for the HER-2 positive compared to the HER-2 negative (HR: 0.333, 95% CI: 0.127–0.869, P=0.025) (Table 2). The Kaplan-Meier curves of OS in individuals with advanced GC are shown in Figure 8. Similarly, individuals in low-level groups had longer OS than those in high-level groups for NETs, NLR, and D-dimer (NETs: mOS, 11.7 months, 95% CI: 7.448–15.952 vs 23.3 months, 95% CI: 17.304–29.362, P=0.014; NLR: mOS, 6.6 months, 95% CI: 4.690–8.510 vs 15.8 months, 95% CI: 11.307–20.360, P<0.001; D-dimer: mOS, 8.3 months, 95% CI: 7.367–9.233 vs 18.2 months, 95% CI: 11.753–24.714, P=0.008, respectively) (Figure 8A–C).
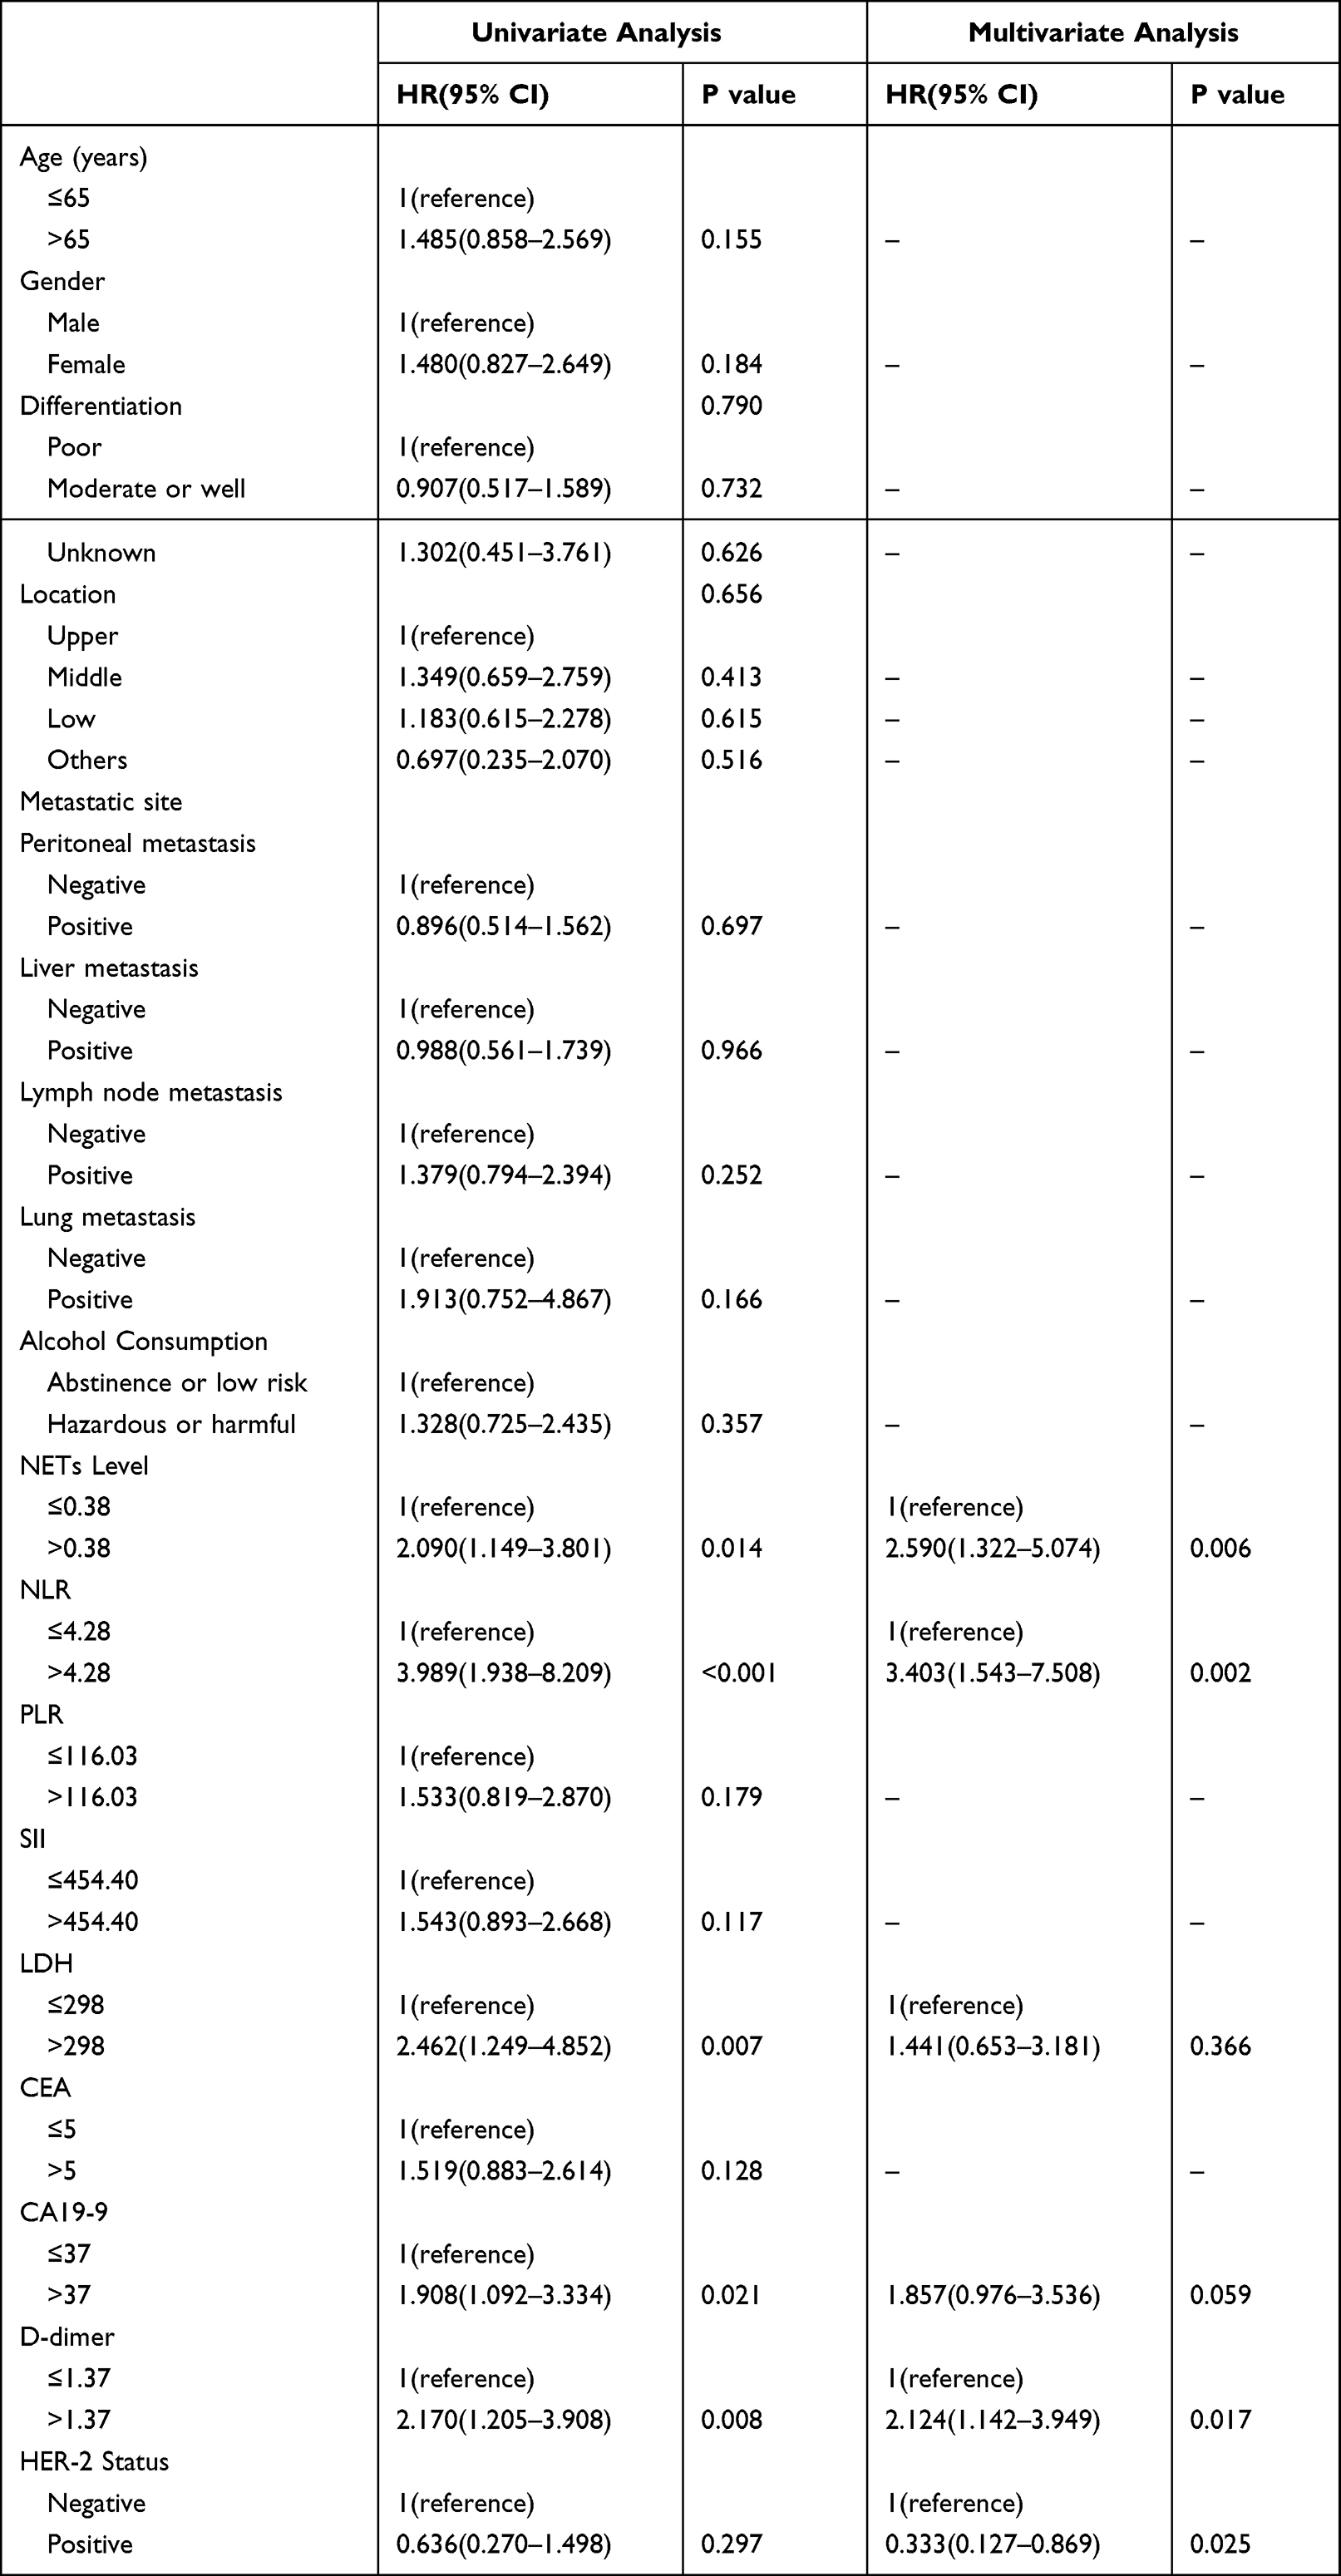 |
Table 2 Univariate and Multivariate Analysis of Factors According to OS in Advanced Gastric Cancer Patients |
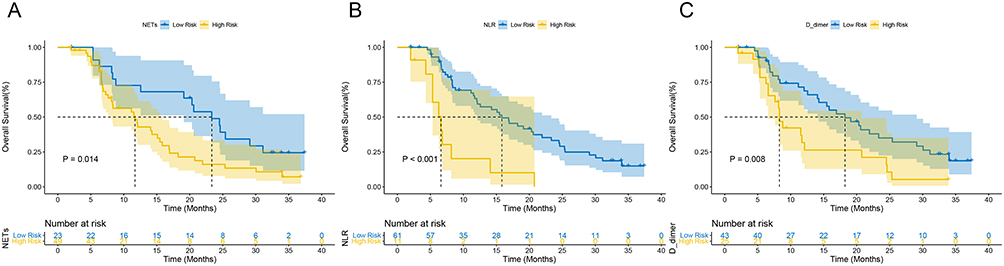 |
Figure 8 Prognostic value of NE-DNA and clinical characteristics in our clinical cohort. Kaplan–Meier curves of OS in the first-line treatment including (A) NETs level, (B) NLR, and (C) D-dimer at baseline. |
Discussion
Globally, GC has a high incidence and morbidity rate.4 Nevertheless, prognostic indicators for GC are currently few in clinical practice. Hence, It is crucial to construct a more effective predictive system for clinical practice. In the research, we constructed a prognostic nomogram for GC relying on a seven NETs-associated gene signature using public databases. And assessed the accuracy of the model by internal and external validation. Then, we examined this connection of signature with the immunological microenvironment using functional enrichment analysis. Finally, we identified the NE-DNA complex as a proxy for NETs in PB, to be an independent prognostic predictor in GC patients. To our knowledge, no previous research has explored the prognostic value of NETs-associated genes in GC and their connection to the immune microenvironment. The current work offers a possible prognostic marker and therapeutic target for enhancing the prognosis of GC patients. Our research shed light on a NETs-associated signature that contributes to predicting the prognosis of GC patients and provides potential prognostic indicators and therapeutic targets for the treatment of GC.
NETs are a unique derivative of neutrophils that have been suggested to promote tumor proliferation,24 metastasis,25 thrombosis,26 and prognosis prediction in patients with malignancies.14,20 Of interest, NETs-based prognostic models have been developed in non small cell lung cancer,27 HNSCC,28 and pan-cancer, which showed unique advantages.21 In a pan-cancer signature based on 23 genes associated with NETs, the GSVA enrichment score of the NETs-related signature was significantly higher in GC.22 Another pan-cancer signature based on NETs-associated genes suggested MPO scores were correlated with prognosis in COAD, KIRC, and LUAD.21 To our knowledge, NETs-related prognostic models for GC have never been reported. This study was the first to construct and validate a prognostic nomogram model for GC patients with seven NETs-associated genes.
To explore the prognostic biomarkers of GC and construct a prognostic model, we performed a series of analyses and validation in this study. Firstly, through the online GEPIA2 database, we subjected the set of NETs-related genes to perform survival analysis and obtained nine NETs-related genes with significant survival significance in GC. To further analyze the impact of the above genes in GC, we downloaded and processed the TCGA and GSE62254 datasets and finally acquired the TCGA cohort containing 348 samples and the GSE62254 cohort containing 300 samples. After that, we chose seven genes from the nine NETs-related genes (PDE4B, CD93, CTSG, IL6, ELANE, KCNJ15, and CRISPLD2) strongly correlated with GC OS prognosis using LASSO–Cox regression analysis on the TCGA dataset. The samples were separated into high-risk and low-risk groups using the median after the risk scores were also computed. The heat map demonstrated how the signature genes were expressed differently in the various groups. Patients in the high-risk group had considerably lower OS than the low-risk patient group, according to the Kaplan–Meier curve. In the GSE62254 cohort, we obtained similar results. Additionally, time-dependent ROC curves assessing the signature’s prognostic ability in both cohorts showed favourable discrimination. Then, to more thoroughly explore the predictive significance of genes connected to NETs, we combined risk scores with clinical indicators to create the nomogram. Following univariate and multivariate Cox regression analysis, it was discovered that the risk score, age, and stage had a significant impact on OS prognosis (Figure 5A and B). These characteristics were utilized to build the nomogram for prognostic prediction, and the risk score interacted synergistically with other clinical indicators to increase the predictive power of the nomogram. The AUC values for OS showed that the nomogram had satisfactory discrimination in both training and validation cohorts. Additionally, the nomogram has an acceptable clinical use, as shown by calibration plots and DCA curves.
The DEGs of both high-risk and low-risk categories were put through GO and KEGG analyses in order to further investigate the potential biological functions and pathways of gene traits connected to the seven NETs-related gene signature. As anticipated, the characteristics of NETs-associated features such as extracellular matrix organization, extracellular structural organization and external wrapping structural organization were widely present in DEGs according to GO analysis (Figure 6A). Furthermore, ECM−receptor interaction was also significantly enriched according to the results of the KEGG analysis (Figure 6B). Interestingly, a previous study showed that NETs-associated NE and matrix metallopeptidase 9 (MMP9) awaken cancer cells from their dormant state via extracellular matrix (ECM) remodeling.29 Moreover, a recent investigation identified cancer-associated fibroblasts (CAF) as a critical modulator of suicidal NETosis. Meanwhile, NETs, in turn, enhanced CAF proliferation and activation and exhibited a pro-tumor phenotype, which was associated with poor prognosis.30 This finding coincides with our results of the MCP counter score (Figure 7D–H). Taken together, we speculate that the interaction of NETs with ECM might be a potential mechanism of action leading to cancer cell activation and metastasis. Notably, GSEA analysis showed that inflammatory responses and the epithelial-mesenchymal transition (EMT) were considerably enriched in the high-risk category of NETs according to Hallmark dataset (Figure 6E). It is well known that EMT is an essential process in cancer cell metastasis.31 Previous research has demonstrated that NETs support the invasion and migration of gastric and breast cancers through EMT.11,32 It has been suggested that NETs may enhance metastasis by altering the adhesion of cancer cells, promoting EMT and enhancing inflammatory responses in the microenvironment,26 which agrees with the findings of our enrichment research. Overall, the EMT process is essential for NETs-induced tumor spread and may be a factor in cancer patients’ poor prognoses.
Although neutrophil extracellular traps (NETs) are critical for promoting cancer growth, researchers know little about their association with other immune cells in the tumor microenvironment. We used ssGSEA to investigate the distribution of several immune cell subpopulations and their associated functions to investigate the connection between risk score associated with NETs and immunological state. Predictably, the NETs high-risk group’s neutrophil infiltration and parainflammation scores were significantly greater than those of the NETs low-risk group. The release of NETs by neutrophils makes them essential in encouraging tumor progression, which is well established to be one of the critical mechanisms in the progression and spread of tumors in the tumor microenvironment as well as infiltration of NETs often predicts a poor prognosis,20,24,33 which is consistent with our research finding. In this investigation, the enrichment of immune cells and associated processes involving antigen presentation pathway is another intriguing finding. Macrophages, B cells, DCs, iDCs, pDCs, and APC co-stimulation scores were statistically different between the low- and high-risk groups (Figure 7B–C). Furthermore, the high-risk group also showed greater levels of type I IFN response, type II IFN response, and checkpoint molecular activity (Figure 7C). One possible speculation is that IFN-γ promotes DCs and macrophage activity, facilitates antigen presentation, and contributes to anticancer immunity. Besides that, macrophages acquire a pro-inflammatory and tumoricidal character due to IFN activating their proliferation and activation. However, in patients with solid tumors, macrophage infiltration is linked to a poor prognosis.34 Teijeira showed that NETs protect tumor cells from the cytotoxic effects of CD8+ T cells and NK lymphocytes by encapsulating them and impeding contact between immune cells and effector cells. Additionally, NETs-adsorbed proteases such as NE and MPO may be detrimental to the function of T cells and NK cells.35 The prior research showed that in TME cells, prolonged antigenic stimulation renders T cells non-functional and thus in a state of exhaustion.36 The upregulation of inhibitory receptors in exhausted T cells eventually prevents the clearing of malignancy. This may also explain why, despite the significant elevation of antigen-presenting cells and related functions in the high-risk group of NETs, there was no significant stimulation of proliferation activation of cytotoxic T cells, which in turn stimulates an acquired immune response, which is in line with the outcomes of previous research on the regulatory pattern associated with neutrophil extracellular traps in pan-cancer.22 In summary, NETs in TME, on the one hand, impede T cell and NK cell-mediated tumor cytotoxicity through a physical barrier. On the other hand, they promote T-cell depletion and thus affect the killing effect on cancer cells.
To test the application value of the nomogram model, we further collected real-world samples for clinical validation. A prior NETs-associated signature investigation by the pan-cancer revealed that MPO scores in tumors were considerably higher than in nearby normal tissue and were associated to a poor prognosis in lung cancer patients, colon adenocarcinoma, and renal clear cell carcinoma.21 It is noteworthy that the authors rated MPO as a typical marker for NETs based on the percentage of MPO+ cells in the immunohistochemistry. However, the study did not evaluate NE, another representative marker of NETs. NE, a critical component of NETs, induces proliferation in mouse and human adenocarcinoma cell lines. NE deficiency reduced tumor burden in a mouse lung cancer model37 and inhibitors of NE prevented NETs formation.38 In addition, NE stimulates tumor growth by directly altering MC38 cell metabolism and upregulating mitochondrial biogenesis via the TLR4PGC1-α pathway.39 Another study showed that NE and matrix metalloproteinase 9, which sequentially cleave laminin, induced the proliferation of dormant cancer cells by activating integrin alpha-3beta-1 signaling, which in turn induced the proliferation of dormant cancer cells.30 However, recent research has demonstrated that the CD95 death domain is released by ELANE proteolytic processing, and it binds to the histone H1 isoforms to kill cancer cells. These researches suggested that ELANE appears to be a double-edged sword in the tumor microenvironment. As prior researches have shown, measuring circulating amounts of MPO/DNA or NE/DNA complexes is more pertinent to NET formation than cfDNA alone.40 As a result, NE-DNA complexes have been frequently utilized to symbolize the development of NETs in PB. Our previous researches revealed that the NE-DNA complex, a representative of NETs, was significantly enriched in the tumor microenvironment (Additional file 3: Figure S2). And there was a strong correlation between the expression of NETs in GC tumor tissue and PB.20 As the number of tumors in GC patients reduced, so did the amount of PB NE-DNA complexes. Furthermore, the short-term efficacy of patients with advanced GC receiving first-line therapy is closely related to the dynamics of the number of NETs in PB.20 However, the relationship between NETs levels and long-term outcome OS in advanced GC patients is unclear. Following that, we conducted univariate and multivariate Cox regression analysis on the levels of NE-DNA and clinicopathological characteristics. We showed that high serum NE-DNA levels were an independent factor of OS in advanced GC patients (Figure 8A). This is consistent with a study on primary liver cancer.41 It’s interesting to note that earlier studies found that patients with advanced lung cancer who had greater levels of NLR and D-dimer had shorter PFS durations.42 Similar results were obtained in our research, where GC patients with high NLR and D-dimer had a worse OS prognosis (Figure 8B and C), suggesting neutrophil infiltration and hypercoagulable state may be poor prognostic factors in GC patients. Remarkably, despite the fact that the HER-2 status did not significantly affect survival in the univariate Cox regression, we still included it in the multivariate Cox regression given its important clinical application as a crucial target for targeted therapy in GC.2 Interestingly, the multifactorial regression model found that HER-2 status was a standalone predictive predictor for GC patients, which we believe is due to adjusting for potential confounders, allowing its true survival significance to be revealed. However, to further confirm the clinical value of the model, a multicenter prospective large sample cohort study is needed for validation in the future.
Conclusion
In conclusion, this research is the first to construct and validate a prognostic model for GC patients with seven NETs-associated genes (PDE4B, CD93, CTSG, IL6, ELANE, KCNJ15, and CRISPLD2). We also provide new insights into the association of NETs with biological functions, related signaling pathways and other cancer features. Among these, NETs-induced EMT and the interaction of NETs with immune cell infiltration TME (including B cells, DCs and T cells) are particularly worthy of further investigation. Moreover, in our external validation cohort, NE was a representative marker of NETs and GC patients with high NE levels had a worse OS prognosis, suggesting that NE is a potential prognostic biomarker for GC. Finally, studying signaling pathways regulating NETs-related signaling and identifying specific inhibitors may offer possibilities for treating cancers.
Abbreviations
NETs, Neutrophil extracellular traps; GC, Gastric cancer; HNSCC, Head and neck squamous cell carcinoma; COAD, Colon adenocarcinoma; KIRC, Kidney renal clear cell carcinoma; OS, Overall survival; PFS, Progression-free survival; TME, Tumor microenvironment; PB, Peripheral blood; TANs, Tumor-associated neutrophils; MPO, Myeloperoxidase; ELANE/NE, Neutrophil elastase; H3Cit, Circulating histone H3; MMP-9, Matrix metalloproteinase 9; TCGA, the Cancer Genome Atlas; GEO, Gene Expression Omnibus; C-index, Concordance index; ROC, Receiver operating characteristic; DEGs, Differentially expressed genes; CI, Confidence interval; DCA, Decision curve analysis; CAF, Cancer-associated fibroblasts; EMT, Epithelial-mesenchymal transition.
Data Sharing Statement
Most of the datasets generated and analyzed during the current study are publicly available data from UCSC Xena (https://xena.ucsc.edu/) and GEO databases (https://www.ncbi.nlm.nih.gov/geo/, ID: GSE62254). And the external validation data during the current study are available from the corresponding author upon reasonable request.
Ethics Approval and Consent to Publication
This study was approved by the Ethics Committee of the First Affiliated Hospital of Anhui Medical University (Quick-PJ2022-03-34). And the study was conducted in accordance with the guidelines of the Declaration of Helsinki. Informed consent was obtained from study participants prior to study initiation. All authors have provided their consent for publication.
Acknowledgments
We thank the TCGA and GEO databases for permitting the authors to use the data.
Funding
This study was supported by grants from the Natural Science Foundation of Anhui Province (No. 1908085QH333), Key Research and Development Project of Anhui Province (No. 202004j07020044), Foundation of Beijing Life Oasis Public Service Center (No. cphcf-2022-021), and the Natural Science Research Project of Anhui Provincial University (No. KJ2018ZD019).
Disclosure
Ziting Qu, Yanxun Han, and Qingbo Zhu are co-first authors for this study. Kangsheng Gu and Yiyin Zhang are co-correspondence authors for this study. The authors declare that they have no competing interests in this work.
References
1. Smyth EC, Nilsson M, Grabsch HI, van Grieken NC, Lordick F. Gastric cancer. Lancet. 2020;396(10251):635–648.
2. Bang YJ, Van Cutsem E, Feyereislova A, et al. Trastuzumab in combination with chemotherapy versus chemotherapy alone for treatment of HER2-positive advanced gastric or gastro-oesophageal junction cancer (ToGA): a Phase 3, open-label, randomised controlled trial. Lancet. 2010;376(9742):687–697. doi:10.1016/S0140-6736(10)61121-X
3. Janjigian YY, Shitara K, Moehler M, et al. First-line nivolumab plus chemotherapy versus chemotherapy alone for advanced gastric, gastro-oesophageal junction, and oesophageal adenocarcinoma (CheckMate 649): a randomised, open-label, phase 3 trial. Lancet. 2021;398(10294):27–40. doi:10.1016/S0140-6736(21)00797-2
4. Sung H, Ferlay J, Siegel RL, et al. Global cancer statistics 2020: GLOBOCAN estimates of incidence and mortality worldwide for 36 cancers in 185 countries. CA Cancer J Clin. 2021;71(3):209–249. doi:10.3322/caac.21660
5. Binnewies M, Roberts EW, Kersten K, et al. Understanding the tumor immune microenvironment (TIME) for effective therapy. Nat Med. 2018;24(5):541–550. doi:10.1038/s41591-018-0014-x
6. Joyce JA, Fearon DT. T cell exclusion, immune privilege, and the tumor microenvironment. Science. 2015;348(6230):74–80. doi:10.1126/science.aaa6204
7. Gentles AJ, Newman AM, Liu CL, et al. The prognostic landscape of genes and infiltrating immune cells across human cancers. Nat Med. 2015;21(8):938–945. doi:10.1038/nm.3909
8. Qu Z, Wang Q, Wang H, et al. The effect of inflammatory markers on the survival of advanced gastric cancer patients who underwent anti-programmed death 1 therapy. Front Oncol. 2022;12:783197. doi:10.3389/fonc.2022.783197
9. Brinkmann V, Reichard U, Goosmann C, et al. Neutrophil extracellular traps kill bacteria. Science. 2004;303(5663):1532–1535. doi:10.1126/science.1092385
10. Papayannopoulos V. Neutrophil extracellular traps in immunity and disease. Nat Rev Immunol. 2018;18(2):134–147.
11. Park J, Wysocki RW, Amoozgar Z, et al. Cancer cells induce metastasis-supporting neutrophil extracellular DNA traps. Sci Transl Med. 2016;8(361):361ra138.
12. Berger-Achituv S, Brinkmann V, Abed UA, et al. A proposed role for neutrophil extracellular traps in cancer immunoediting. Front Immunol. 2013;4:48. doi:10.3389/fimmu.2013.00048
13. Yang L, Liu L, Zhang R, et al. IL-8 mediates a positive loop connecting increased neutrophil extracellular traps (NETs) and colorectal cancer liver metastasis. J Cancer. 2020;11(15):4384–4396. doi:10.7150/jca.44215
14. Millrud CR, Kågedal Å, Kumlien Georén S, et al. NET-producing CD16(high) CD62L(dim) neutrophils migrate to tumor sites and predict improved survival in patients with HNSCC. Int J Cancer. 2017;140(11):2557–2567.
15. Lee W, Ko SY, Mohamed MS, Kenny HA, Lengyel E, Naora H. Neutrophils facilitate ovarian cancer premetastatic niche formation in the omentum. J Exp Med. 2019;216(1):176–194. doi:10.1084/jem.20181170
16. Kessenbrock K, Krumbholz M, Schönermarck U, et al. Netting neutrophils in autoimmune small-vessel vasculitis. Nat Med. 2009;15(6):623–625. doi:10.1038/nm.1959
17. Grilz E, Mauracher LM, Posch F, et al. Citrullinated histone H3, a biomarker for neutrophil extracellular trap formation, predicts the risk of mortality in patients with cancer. Br J Haematol. 2019;186(2):311–320. doi:10.1111/bjh.15906
18. Rosell A, Aguilera K, Hisada Y, et al. Prognostic value of circulating markers of neutrophil activation, neutrophil extracellular traps, coagulation and fibrinolysis in patients with terminal cancer. Sci Rep. 2021;11(1):5074. doi:10.1038/s41598-021-84476-3
19. Li Q, Chen W, Li Q, Mao J, Chen X. A novel neutrophil extracellular trap signature to predict prognosis and immunotherapy response in head and neck squamous cell carcinoma. Front Immunol. 2022;13:1019967. doi:10.3389/fimmu.2022.1019967
20. Zhang Y, Hu Y, Ma C, et al. Diagnostic, therapeutic predictive, and prognostic value of neutrophil extracellular traps in patients with gastric adenocarcinoma. Front Oncol. 2020;10:1036. doi:10.3389/fonc.2020.01036
21. Zhang Y, Guo L, Dai Q, et al. A signature for pan-cancer prognosis based on neutrophil extracellular traps. J Immunother Cancer. 2022;10(6). doi:10.1136/jitc-2021-004210
22. Shen XT, Xie SZ, Xu J, Yang LY, Qin LX. Pan-cancer analysis reveals a distinct neutrophil extracellular trap-associated regulatory pattern. Front Immunol. 2022;13:798022. doi:10.3389/fimmu.2022.798022
23. Subramanian A, Tamayo P, Mootha VK, et al. Gene set enrichment analysis: a knowledge-based approach for interpreting genome-wide expression profiles. Proc Natl Acad Sci U S A. 2005;102(43):15545–15550. doi:10.1073/pnas.0506580102
24. Cristinziano L, Modestino L, Antonelli A, et al. Neutrophil extracellular traps in cancer. Semin Cancer Biol. 2022;79:91–104. doi:10.1016/j.semcancer.2021.07.011
25. Yang D, Liu J. Neutrophil extracellular traps: a new player in cancer metastasis and therapeutic target. J Exp Clin Cancer Res. 2021;40(1):233. doi:10.1186/s13046-021-02013-6
26. Wang H, Zhang Y, Wang Q, Wei X, Wang H, Gu K. The regulatory mechanism of neutrophil extracellular traps in cancer biological behavior. Cell Biosci. 2021;11(1):193. doi:10.1186/s13578-021-00708-z
27. Fang C, Liu F, Wang Y, et al. A innovative prognostic symbol based on neutrophil extracellular traps (NETs)-related lncRNA signature in non-small-cell lung cancer. Aging. 2021;13(13):17864–17879. doi:10.18632/aging.203289
28. Chen N, He D, Cui J. A neutrophil extracellular traps signature predicts the clinical outcomes and immunotherapy response in head and neck squamous cell carcinoma. Front Mol Biosci. 2022;9:833771. doi:10.3389/fmolb.2022.833771
29. Albrengues J, Shields MA, Ng D, et al. Neutrophil extracellular traps produced during inflammation awaken dormant cancer cells in mice. Science. 2018;361(6409). doi:10.1126/science.aao4227
30. Munir H, Jones JO, Janowitz T, et al. Stromal-driven and Amyloid β-dependent induction of neutrophil extracellular traps modulates tumor growth. Nat Commun. 2021;12(1):683. doi:10.1038/s41467-021-20982-2
31. Mittal V. Epithelial mesenchymal transition in tumor metastasis. Annu Rev Pathol. 2018;13:395–412. doi:10.1146/annurev-pathol-020117-043854
32. Zhu T, Zou X, Yang C, et al. Neutrophil extracellular traps promote gastric cancer metastasis by inducing epithelial‑mesenchymal transition. Int J Mol Med. 2021;48(1). doi:10.3892/ijmm.2021.4960
33. Cools-Lartigue J, Spicer J, McDonald B, et al. Neutrophil extracellular traps sequester circulating tumor cells and promote metastasis. J Clin Invest. 2013;123(8):3446–3458. doi:10.1172/JCI67484
34. Cassetta L, Pollard JW. Targeting macrophages: therapeutic approaches in cancer. Nat Rev Drug Discov. 2018;17(12):887–904. doi:10.1038/nrd.2018.169
35. Teijeira Á, Garasa S, Gato M, et al. CXCR1 and CXCR2 chemokine receptor agonists produced by tumors induce neutrophil extracellular traps that interfere with immune cytotoxicity. Immunity. 2020;52(5):856–871.e858. doi:10.1016/j.immuni.2020.03.001
36. Kaltenmeier C, Yazdani HO, Morder K, Geller DA, Simmons RL, Tohme S. Neutrophil extracellular traps promote T cell exhaustion in the tumor microenvironment. Front Immunol. 2021;12:785222. doi:10.3389/fimmu.2021.785222
37. Houghton AM, Rzymkiewicz DM, Ji H, et al. Neutrophil elastase-mediated degradation of IRS-1 accelerates lung tumor growth. Nat Med. 2010;16(2):219–223. doi:10.1038/nm.2084
38. Papayannopoulos V, Metzler KD, Hakkim A, Zychlinsky A. Neutrophil elastase and myeloperoxidase regulate the formation of neutrophil extracellular traps. J Cell Biol. 2010;191(3):677–691. doi:10.1083/jcb.201006052
39. Yazdani HO, Roy E, Comerci AJ, et al. Neutrophil extracellular traps drive mitochondrial homeostasis in tumors to augment growth. Cancer Res. 2019;79(21):5626–5639. doi:10.1158/0008-5472.CAN-19-0800
40. Yoo DG, Floyd M, Winn M, Moskowitz SM, Rada B. NET formation induced by Pseudomonas aeruginosa cystic fibrosis isolates measured as release of myeloperoxidase-DNA and neutrophil elastase-DNA complexes. Immunol Lett. 2014;160(2):186–194. doi:10.1016/j.imlet.2014.03.003
41. Kaltenmeier CT, Yazdani H, van der Windt D, et al. Neutrophil extracellular traps as a novel biomarker to predict recurrence-free and overall survival in patients with primary hepatic malignancies. HPB (Oxford). 2021;23(2):309–320. doi:10.1016/j.hpb.2020.06.012
42. Moik F, Zöchbauer-Müller S, Posch F, Pabinger I, Ay C. Systemic inflammation and activation of haemostasis predict poor prognosis and response to chemotherapy in patients with advanced lung cancer. Cancers. 2020;12(6):1619. doi:10.3390/cancers12061619
 © 2023 The Author(s). This work is published and licensed by Dove Medical Press Limited. The full terms of this license are available at https://www.dovepress.com/terms.php and incorporate the Creative Commons Attribution - Non Commercial (unported, v3.0) License.
By accessing the work you hereby accept the Terms. Non-commercial uses of the work are permitted without any further permission from Dove Medical Press Limited, provided the work is properly attributed. For permission for commercial use of this work, please see paragraphs 4.2 and 5 of our Terms.
© 2023 The Author(s). This work is published and licensed by Dove Medical Press Limited. The full terms of this license are available at https://www.dovepress.com/terms.php and incorporate the Creative Commons Attribution - Non Commercial (unported, v3.0) License.
By accessing the work you hereby accept the Terms. Non-commercial uses of the work are permitted without any further permission from Dove Medical Press Limited, provided the work is properly attributed. For permission for commercial use of this work, please see paragraphs 4.2 and 5 of our Terms.