Back to Journals » Cancer Management and Research » Volume 13
A Novel miRNA–mRNA Axis Involves in Regulating Transcriptional Disorders in Pancreatic Adenocarcinoma
Authors Shang X, Shi LE, Taule D ![]() , Zhu ZZ
, Zhu ZZ
Received 21 April 2021
Accepted for publication 10 July 2021
Published 3 August 2021 Volume 2021:13 Pages 5989—6004
DOI https://doi.org/10.2147/CMAR.S316935
Checked for plagiarism Yes
Review by Single anonymous peer review
Peer reviewer comments 2
Editor who approved publication: Dr Chien-Feng Li
Xin Shang, Lan-Er Shi, Dina Taule, Zhang-Zhi Zhu
The First Affiliated Hospital of Guangzhou University of Chinese Medicine, Guangzhou, Guangdong, People’s Republic of China
Correspondence: Zhang-Zhi Zhu
The First Affiliated Hospital of Guangzhou University of Chinese Medicine, No. 12, Jichang Road, Guangzhou, Guangdong, 510405, People’s Republic of China
Tel +86-18620120683
Fax +86- 20-36591595
Email [email protected]
Background: Currently, there is still a lack of understanding about the mechanism and therapeutic targets of pancreatic adenocarcinoma (PAAD). The potential of miRNA–mRNA networks for the identification of regulatory mechanisms involved in PAAD development remains unexplored.
Methods: We compared differentially expressed miRNAs (DEMIs) and differentially expressed genes (DEGs) in PAAD and normal tissues from the Gene Expression Omnibus (GEO) database. Transcription factors (TFs) were obtained from FunRich. Gene Ontology (GO) and Kyoto Encyclopedia of Genes and Genomes (KEGG) pathway enrichment analyses of DEGs and DEMIs were implemented using Database for Annotation, Visualization and Integrated Discovery (DAVID). Then, key miRNAs and targeted mRNAs were identified by assessment of their expression and prognosis in UALCAN and Kaplan–Meier plotters. In the last step, the candidate miRNA–mRNA selected was confirmed by real-time quantitative polymerase chain reaction (qRT-PCR).
Results: We distinguished 62 significant DEMIs, 1314 upregulated DEGs, and 1110 downregulated DEGs. The top 10 TFs were identified. In total, there were 160 hub genes obtained by intersecting the set of 2224 predicted targets with the set of significant DEGs. And we selected 8 key miRNAs. Furthermore, low expression of miR-455-3p in PAAD tissue was closely connected with poor prognosis, and only 5 target mRNAs were predicted to be increased in PAAD tissue with poor prognosis. Therefore, a novel miRNA–hub gene regulatory network in PAAD was constructed. Finally, in vitro experiments indicated that miR-455-3p expression was decreased in PAAD sample. HOXC4, DLG4, DYNLL1 and FBXO45 were validated by qRT-PCR as highly probable targets of miR-455-3p.
Conclusion: A novel miRNA–mRNA axis has been discovered that may be involved in the regulation of transcriptional disorders and affected the survival of PAAD patients, which would provide a novel strategy for the treatment of PAAD.
Keywords: pancreatic adenocarcinoma, bioinformatics analysis, differentially expressed genes, differentially expressed microRNAs, hsa-miR-455-3p
Introduction
Pancreatic adenocarcinoma (PAAD) is a malignant digestive system disease with occult onset, invasive, and rapid progression.1 Among all types of cancer, PAAD has the lowest survival rate (9%) and highest mortality rate.2 This is mainly because clinical tumor-associated proteins do not have high diagnostic accuracy, so there is a need to explore more tumor markers to improve the early diagnosis of PAAD.3 Furthermore, adjuvant chemotherapy after surgical resection is traditionally the preferred alternative to treat PAAD in early stage, but the development of chemotherapy resistance makes the treatment in a dilemma.4 A retrospective study demonstrated that in patients with advanced PAAD, median overall survival was one year longer for those who received matched treatment than for those who received unmatched treatment or who had no operational changes.5 Therefore, in addition to more clinical biomarkers, new treatment strategies are needed. The benefits of genomic technology for accurate clinical diagnosis and targeted therapy have been acknowledged.6
MicroRNAs (miRNAs) are non-coding RNAs with short sequences (19–25 nucleotides), that inhibit or cut off the translation of target genes based on the degree of complementarity with the sequence of the target gene transcriptome. Therefore, the identification of appropriate miRNAs as tumor suppressor genes can help determine which treatments are more responsive to different tumors, thereby predicting the likelihood of drug resistance and guiding treatment decisions.7 Different miRNA expression profiles are present at different stages of pancreatic malignancy and expected to be used as prognostic markers, clinical targets and individualized therapy.8 miRNAs can complement the 3ʹ -untranslated region (3ʹ-UTR) of their target mRNA sequence to induce mRNA degradation or translation inhibition, thereby regulating gene expression.9 The analysis of miRNAs combined with mRNAs is crucial to better understand and predict the role of miRNAs in regulating gene expression.10 For example, silencing of miR-494 reduces binding to IGF2BP1 sequences, upregulates IGF2BP1 expression and promotes proliferation of pancreatic cancer cells through activating the Akt signaling pathway.11 However, the limited comprehending and validation of the complex biology of these miRNAs has hampered clinical application of bioinformatics, which can help us solve this problem by screening out the genes we need from the vast gene pool.
Gene expression synthesis (GEO: https://www.ncbi.nlm.nih.gov/). It is an authoritative database of gene expression, which is suitable for PAAD genomics research, helps to identify reliable biomarkers, and provides scientific basis for research.12 A considerable number of studies have shown that several miRNAs have vital functions for the occurrence and progression of PAAD.13–16 Given the continuous updates, including new miRNA–mRNA networks, application of different technology platforms, and different data processing and analysis methods, the lack of consistency is one of the reasons why the study of miRNA mRNA expression profile leads to non-specific and ineffective biomarkers. Therefore, it is needed urgently to strengthen the relationship between miRNA and mRNA chip, determine indicators for the early detection of PAAD, and improve the efficacy of targeted therapy.
In our project, we identified the pivotal miRNAs and target genes participated in the development of PAAD through the combination of bioinformatics analysis and molecular biology research technology. We aimed to explore the miRNA–mRNA interactions in PAAD, as well as to identify miRNAs for treatment-tailoring, in order to further grope for the molecular mechanism of PAAD and promote the update of treatment technology.
Materials and Methods
Microarray Data Information
Gene expression profile of PAAD tumor tissues and adjacent normal tissues: GSE41372 [GPL16142, NanoString nCounter Human miRNA assay (v1), NanoString Technologies, Seattle, WA, USA] and GSE43795 (GPL10558, Illumina HumanHT-12 V4.0 expression beadchip, Illumina Inc., San Diego, CA, USA) were downloaded from the GEO database (GEO, http://www.ncbi.nlm.nih.gov/geo/), an international public genomics database. A total of 18 samples were collected in GSE41372, including nine samples of pancreatic ductal adenocarcinoma and nine samples of normal pancreases. The gene expression profile of GSE43795 contained 31 samples, including 26 of pancreatic tumors and five of non-neoplastic pancreases (Supplementary Table 1). These data sets meet the following criteria: (1) belong to human pancreatic tissue samples; (2) include both pancreatic cancer and normal (or adjacent) samples; (3) the sample size of case group and control group is more than 3.
Differential Expression Analysis
The “limma” is a software package for data analysis, linear model, and differential representation of microarray data (http://bioinf.wehi.edu.au/limma) of R 4.0.2 software (http://www.R‑project.org/) to normalize the data and log2 transform the matrix files of each GEO dataset. Furthermore, we used these tools to screen out the differential expressed miRNAs (DEMIs) and the differential expressed genes (DEGs) between PAAD and pancreatic tissue in each GEO dataset, with |log fold‑change (FC)|>1, p<0.05, and adjusted p<0.05 as the thresholds for statistical significance.
Functional Enrichment for DEMIs
We screened for potential transcription factors (TFs) regulating DEMIs using the functional enrichment and interaction network analysis tool (FunRich) (version 3.1.3; http://www.funrich.org).
Gene ontology (GO) was used for functional enrichment analysis of DEMIs using the FunRich software. The resulting GO terms with p<0.05 were considered to be effectively enriched in the DEMIs.
Prediction of miRNA-Targeted Gene and miRNA–Hub Gene Network
The genes set at the intersection of the target gene set of DEMIs predicted by Funrich tool and the DEGs gene set was used as markedly differential expression target genes. A miRNA–mRNA regulatory network was composed of these overlapping DEGs and DEMIs, and network visualization was accomplished using the Cytoscape software (Cytoscape, Seattle, WA, USA). Then, the miRNAs with 6 or more nodes interacting with target genes were defined as hub miRNAs.
UALCAN (http://ualcan.path.uab.edu) is an interactive web whose resources were based on level 3 RNA-seq and clinical data from 31 cancer types of TCGA database, which was different from GEO database. It can be used to analyze the relationship between the expression of potential related genes and clinicopathological features in tumor and normal tissues. In this study, UALCAN was used to analyze the expression patterns of miRNA-455 and miRNA-217 in PAAD tissues. Difference of transcriptional expression was compared by students’ t-test and p <0.05 was considered as statistically significant.
Gene Ontology and Pathway Enrichment Analyses
We performed GO and KEGG pathway enrichment analyses of DEGs. Go function analysis is an effective method for gene annotation and feature recognition.17 KEGG integrates extensive databases on genomes, biological pathways, diseases, drugs and chemicals.18 In order to provide an effective method for the functional interpretation of gene or protein, we used Database for Annotation, Visualization and Integrated Discovery (DAVID; https://david.ncifcrf.gov/) online bioinformatics database to analyze the GO function and KEGG pathway enrichment of DEGs.19 p<0.05 was set as the cut-off criterion. We utilized DAVID bioinformatics resources 6.8 to annotate and analyze the biological functions of DEGS in PAAD development from three aspects: biological process (BP), cell component (CC) and molecular function (MF). The KEGG database was used for the pathway enrichment analysis. p<0.05 was considered statistically significant.
Survival Analysis
Prognostic values of miRNAs-mRNAs in PAAD were analyzed using Kaplan–Meier plotter database (http://kmplot.com/analysis/), which is a public database capable of analyzing the prognostic role of 54,000 genes in 21 cancer types. These miRNAs and mRNAs were searched in pancreatic cancer RNA sequence and miRNA data from the Pancreatic Cancer Project in the Kaplan–Meier plotter database. The hazard ratio (HR) and logRank P values for the 95% confidence interval are then automatically calculated and displayed on the web page as an image. LogRank P value <0.05 was statistically significant.
Cell Culture
Normal human pancreatic duct epithelial cells hTERT-HPNE (HPNE) and four kinds of PAAD cell lines (PANC1, ASPC-1, BXPC-3, MIAPACA-2) were purchased from Otwo Biotech (Shenzhen) Inc. They were cultured in RPMI Medium 1640 (GIBCO, Waltham, MA, USA) supplemented with 10% fetal bovine serum (GIBCO) and 1% antibiotics (penicillin and streptomycin) in a 5% CO2 incubator at 37°C.
Quantitative Real-Time Polymerase Chain Reaction (qRT-PCR)
Total small RNA was extracted from the purified human cell lines PANC1 and HPNE using an RNAiso for Small RNA (Takara Bio USA, Inc., San Jose, CA, USA). The synthesis of hsa-miRNA complementary DNAs was conducted using the Mir-X miRNA First-Strand Synthesis Kit (Takara Bio USA, Inc.), with a thermal cycler, with the following temperature protocol: 37°C for 60 min and 85°C for 5 min. qRT-PCR, using miR-specific primers and universal adaptor PCR primers (Takara Bio USA, Inc.), was performed using TB Green Advantage qPCR Premix (tailing reaction) referring to the manufacturer’s protocol (Takara Bio USA, Inc.), with the following parameters: 95°C for 30 s, followed by 40 cycles of 95°C for 5 s and 60°C for 34 s.
Total RNA was extracted using Total RNA Kit I (OMEGA Bio-tek USA, Inc., Norcross, GA, USA) following the manufacturer’s instructions. The total RNAs from each sample were reverse-transcribed to cDNA using the PrimeScript RT Master Mix (Takara Bio USA, Inc.). Reverse transcription reactions were performed at the following parameters: 37°C for 15 min and 85°C for 5 s. qRT-PCR was operated using the TB Green Premix Ex Taq II (Takara Bio USA, Inc.) at the following parameters: 95°C for 30 s followed by 40 cycles of 95°C for 5 s and 60°C for 34 s.
The gene expression is defined in accordance with the 2(-ΔΔCT) method, wherein the Ct value of a U6 small nuclear RNA and GAPDH were defined as the internal control. The sequences of the primers (Sangon Biotech, Shanghai, China) used for qRT-P CR are shown in Supplementary Table 2.
Statistical Analysis
Each experiment was repeated at least three times. Fold changes ≥2 and p<0.05 in miRNA and gene microarray data were defined as effectively differential expression. For the qRT-PCR data, statistical analysis was performed using the Statistical Package for Social Sciences version 20.0 (IBM, Armonk, NY, USA). The fold changes were calculated via relative quantification using the 2(-ΔΔCT) method. p<0.05 was considered statistically significant.
Results
DEMIs and DEGs
For the data set GSE41372, under the criteria of |logFC| >1, p<0.05, and adjusted p<0.05, a total of 62 DEMIs were obtained, including 47 upregulated and 15 downregulated miRNAs in the PAAD group compared with the control group (Figure 1A and B, Supplementary Table 3). For the dataset GSE43795, 2,453 DEGs, including 1,139 upregulated and 1314 downregulated DEGs, were obtained for the PAAD group compared with the control group (Figure 1C and D, Supplementary Table 4).
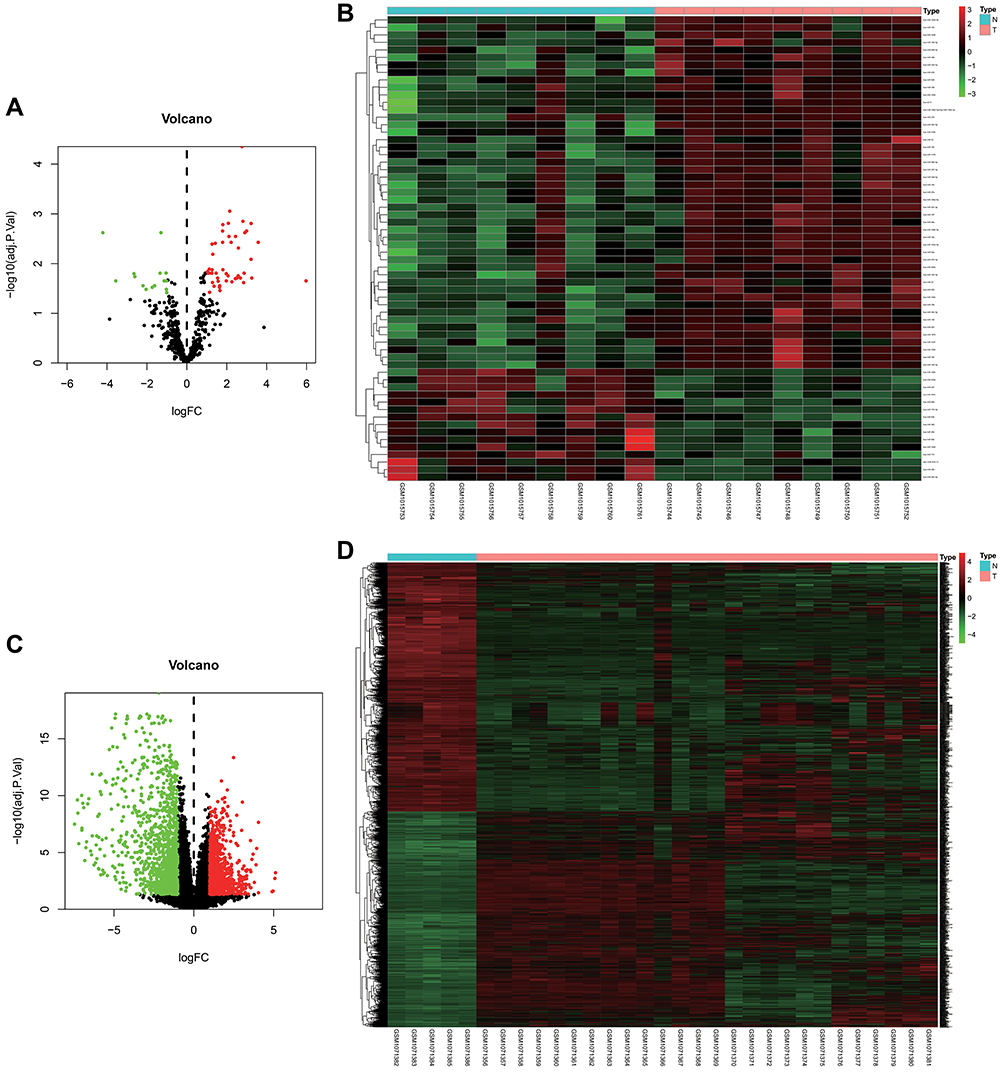 |
Figure 1 Identification of differentially expressed miRNAs (DEMIs) and differentially expressed genes (DEGs) in tumor tissues and adjacent nontumor tissues from pancreatic cancer patients. (A and C) Volcano plots of DEMIs and DEGs in GEO database. The red dots represent the upregulated genes based on an adjusted p < 0.05 and log FC > 1; the green dots represent the downregulated genes based on an adjusted p < 0.05 and log FC < −1; the black spots represent genes with no significant difference in expression. (B and D) The heat map of down- and upregulated DEMIs and DEGs in the integrated microarray analysis. Each column represents one dataset and each row represents one gene. The number in each rectangle represents the value of log2FC. Abbreviations: FC, fold change; GEO, Gene Expression Omnibus. |
Functional Enrichment Analysis of the DEMIs
We identified TFs for DEMIs, based on data from FunRich. The top 10 most significant TFs included EGR1, SP1, POU2F1, SP4, NKX6-1, RREB1, LHX3, SOX1, FOXA1, and HOXA3 (Figure 2).
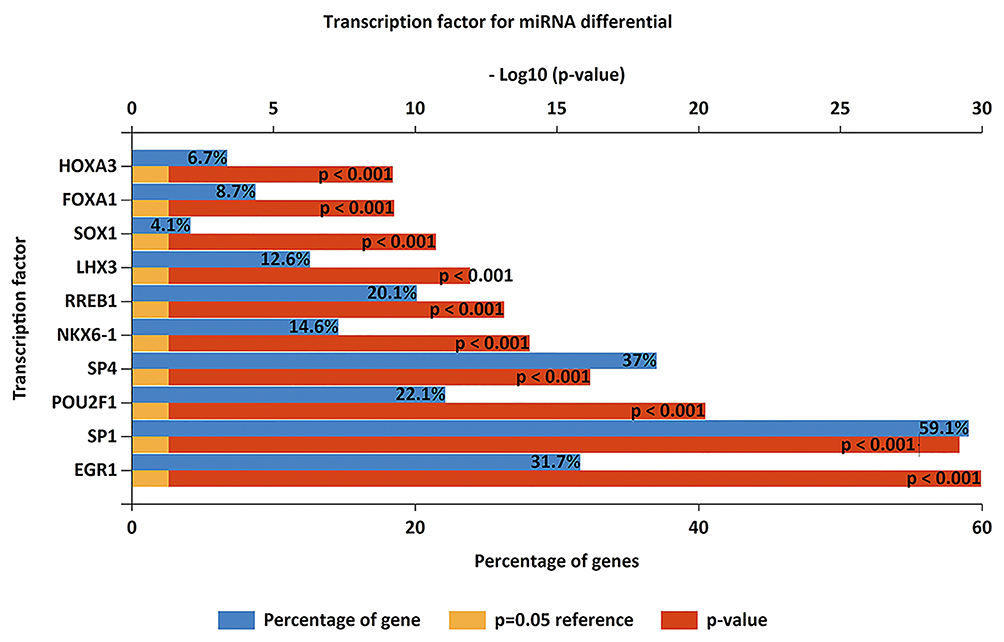 |
Figure 2 Enriched transcription factors by differentially expressed microRNAs target genes. The top 10 most significant transcription factors include EGR1, SP1, POU2F1, SP4, NKX6-1, RREB1, LHX3, SOX1, FOXA1, HOXA3. Abbreviations: EGR1, early growth response 1; SP1, Sp1 transcription factor; POU2F1, POU Class 2 Homeobox 1; SP4, Sp4 transcription factor; NKX6-1, NK6 Homeobox 1; RREB1, Ras Responsive Element Binding Protein 1; LHX3, LIM Homeobox 3; SOX1, SRY-Box Transcription Factor 1; FOXA1, Forkhead Box A1; HOXA3, Homeobox A3. |
The GO functional annotations of overlapping DEMIs were mainly classified into BP, CC, and MF. For BP, overlapping DEMIs were markedly correlated to regulation of “nucleobase”, “nucleoside, nucleotide, and nucleic acid metabolism”, “cell communication” and “signal transduction”. For CC, DEMIs were notably correlated to “nucleus”, “cytoplasm” and “Golgi apparatus”. MF analysis suggested that the DEMIs were involved in “transcription factor activity”, “transcription regulator activity”, “GTPase activity”, “ubiquitin-specific protease activity” and “RNA binding” (Figure 3A–C).
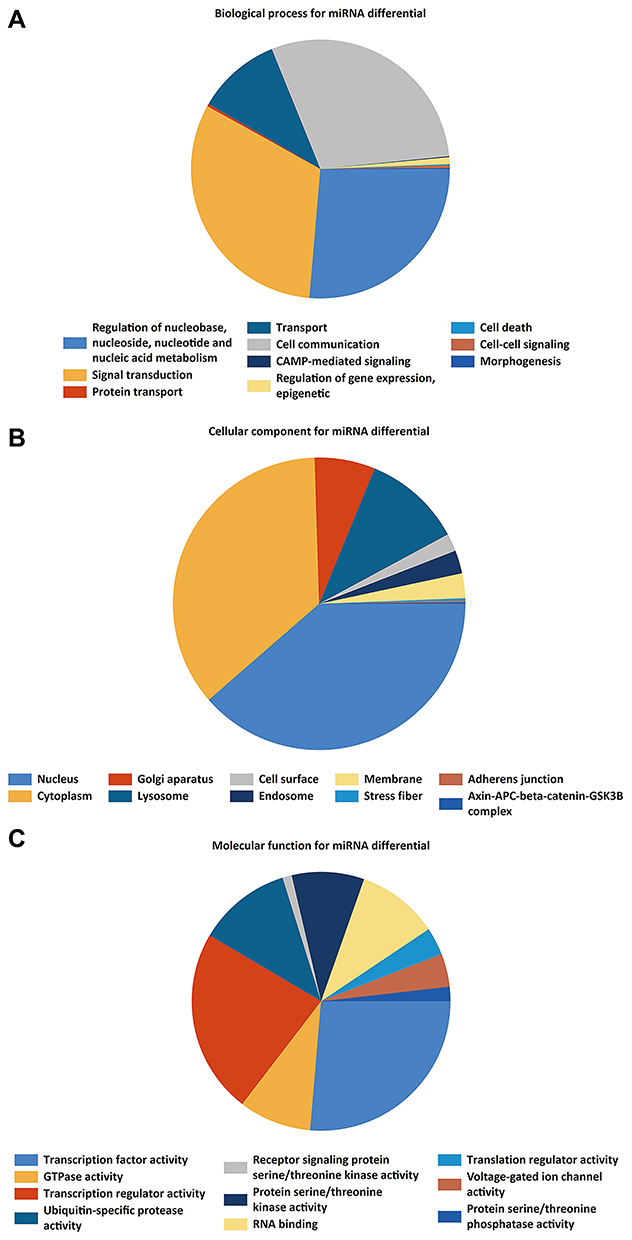 |
Figure 3 GO enrichment analysis of the DEMIs, (A) biological process. (B) cellular component. (C) molecular function. |
Target Gene Prediction and miRNA–Hub Gene Network
We predicted 2224 target genes of DEMIs using FunRich, and subsequently, the predicted target genes and DEGs were intersected to obtain hub genes. Consequently, 160 hub genes were obtained, Construction of miRNA–mRNA network with Cytoscape (Supplementary Table 5). We identified 16 miRNAs based on important target DEGs. Among them, 15 miRNAs (hsa-miR-490-3p, −455-3p, −342-3p, −331-3p, −324-5p, −217, −199b-5p, −199a-5p, −193a-5p, −190b, −142-5p, −142-3p, −140-3p, −125a-5p, and −107) regulated two or more of the central genes identified in our study. The nine miRNAs: hsa-miR-455-3p, −217, −199a-5p, −199b-5p, −142-3p, −140-3p, −125a-5p, and −107 each node with a miRNA degree greater than or equal to 6 were considered as hub miRNAs. The hub genes regulated by these miRNAs are shown in Figure 4. Among them, only miRNA-455 and miRNA-217 were low expressed, and their target genes were highly expressed in tumor tissues. The genes up-regulated in cancer are likely to be oncogenes, and miRNA is negatively correlated with mRNA. Therefore, these two target genes of miRNA-455 and miRNA-217 will be used in the following studies.
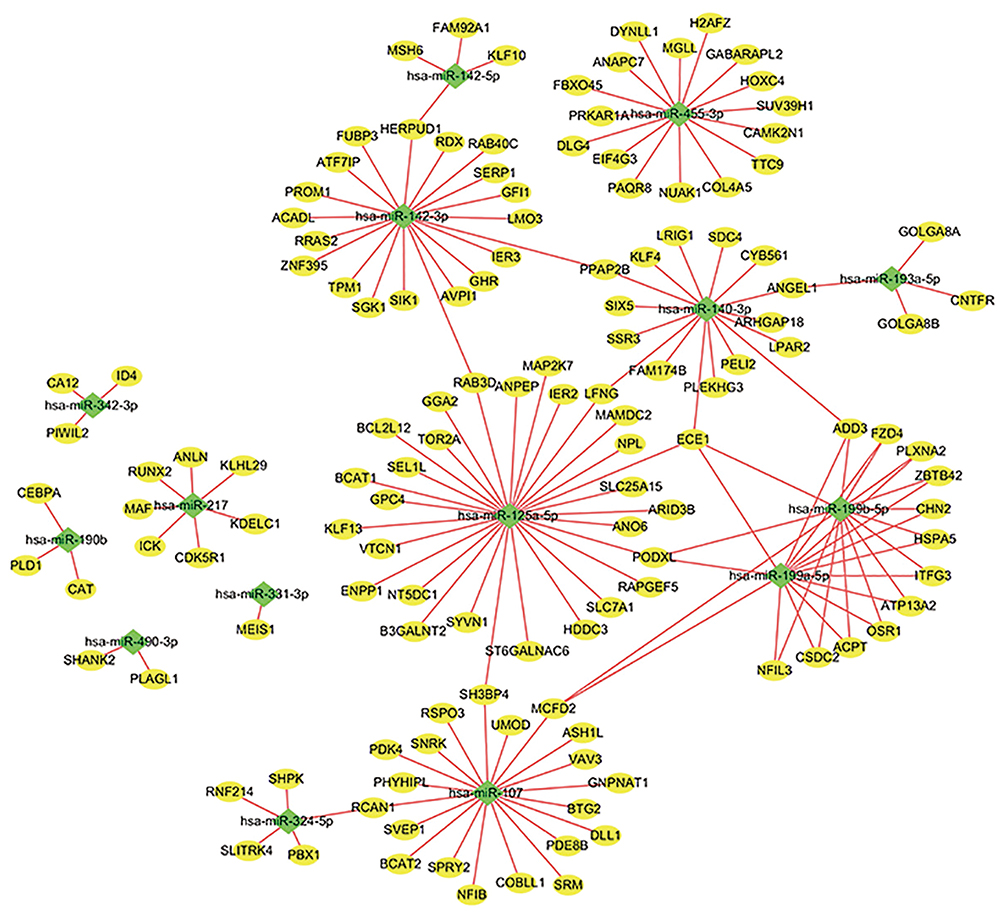 |
Figure 4 MiRNA–mRNA interaction network of key genes. To integrate the largest linker network in miRNA–mRNA interaction network. The shape of the node represents different types of genes: diamond, DEGs; oval, DEMIs. |
Prognostic Value of miRNA–mRNA Expression in Terms of OS in PAAD Patients
Identification of Key miRNAs
First, As shown in Figure 5A and B, the expression of miRNA-455-3p and miRNA-217 in PAAD tissues was down-regulated compared with that in normal tissues, and miRNA-455-3p was more significant (p< 0.05), which was considered as a key miRNA. Next, the relationship between expressions of miR-455-3p and miR-217 with prognosis of PAAD patients was analyzed. Our results showed that lower expressions of miR-455-3p was associated with poorer OS in PAAD patients (HR=0.59, 95% CI: 0.39–0.91, and p=0.019). The above results are basically consistent with the prediction.
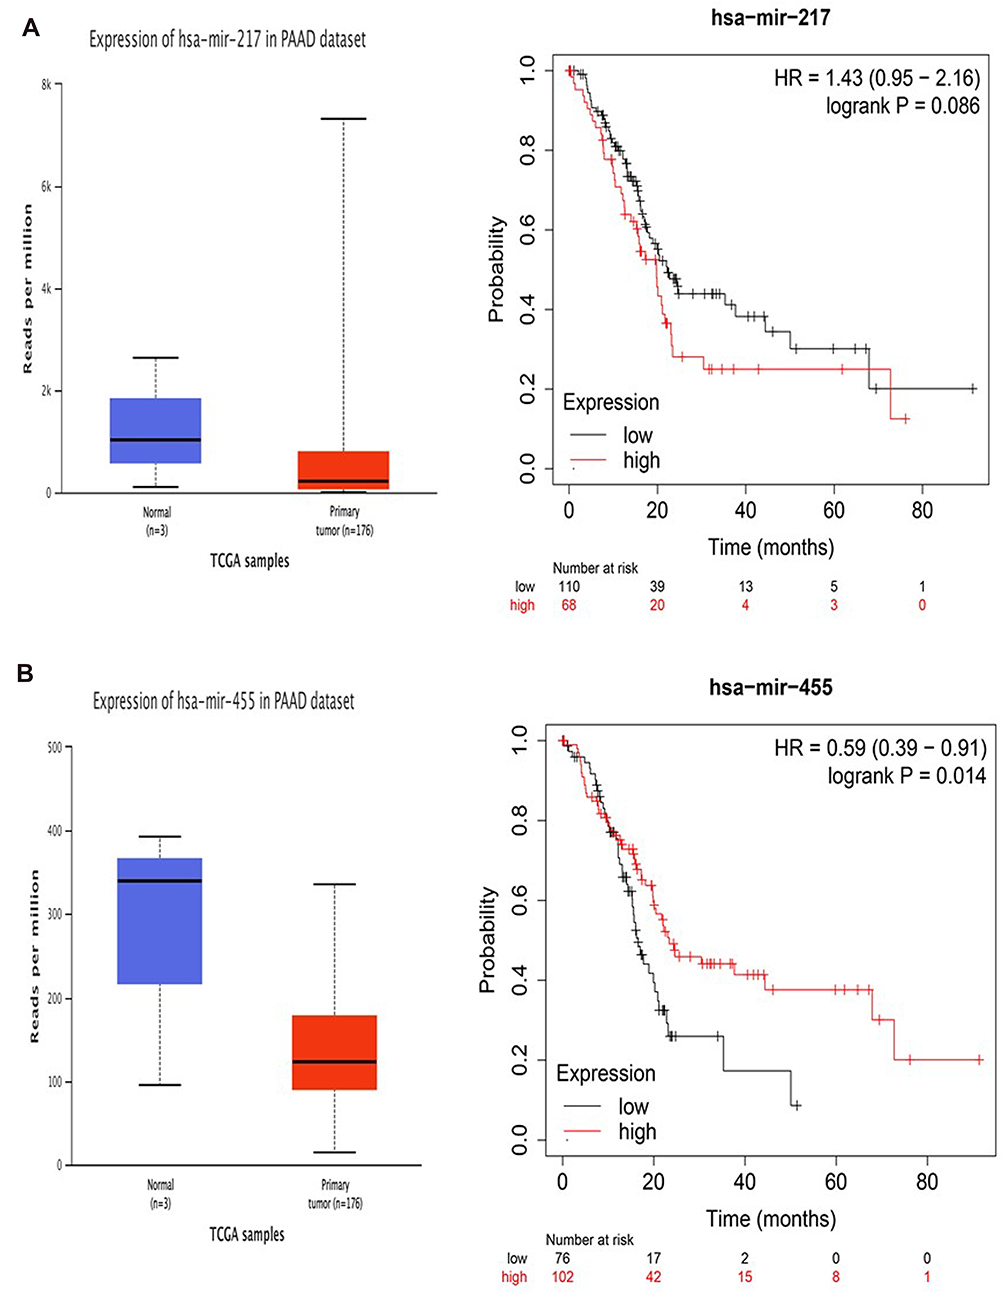 |
Figure 5 Identification of key miRNAs by evaluating their prognosis in PAAD. (A) miR-217. (B) miR-455-3p. |
Identification of Target mRNAs
The expression of target genes predicted by miRNA-455-3p was verified again by UALCAN. Nine of them were highly expressed in PAAD (P< 0.05). Five genes with high expression were HOXC4, DLG4, DYNLL1, MGLL and FBXO45, which were closely related to poor prognosis (P< 0.05) (Figure 6A–E).
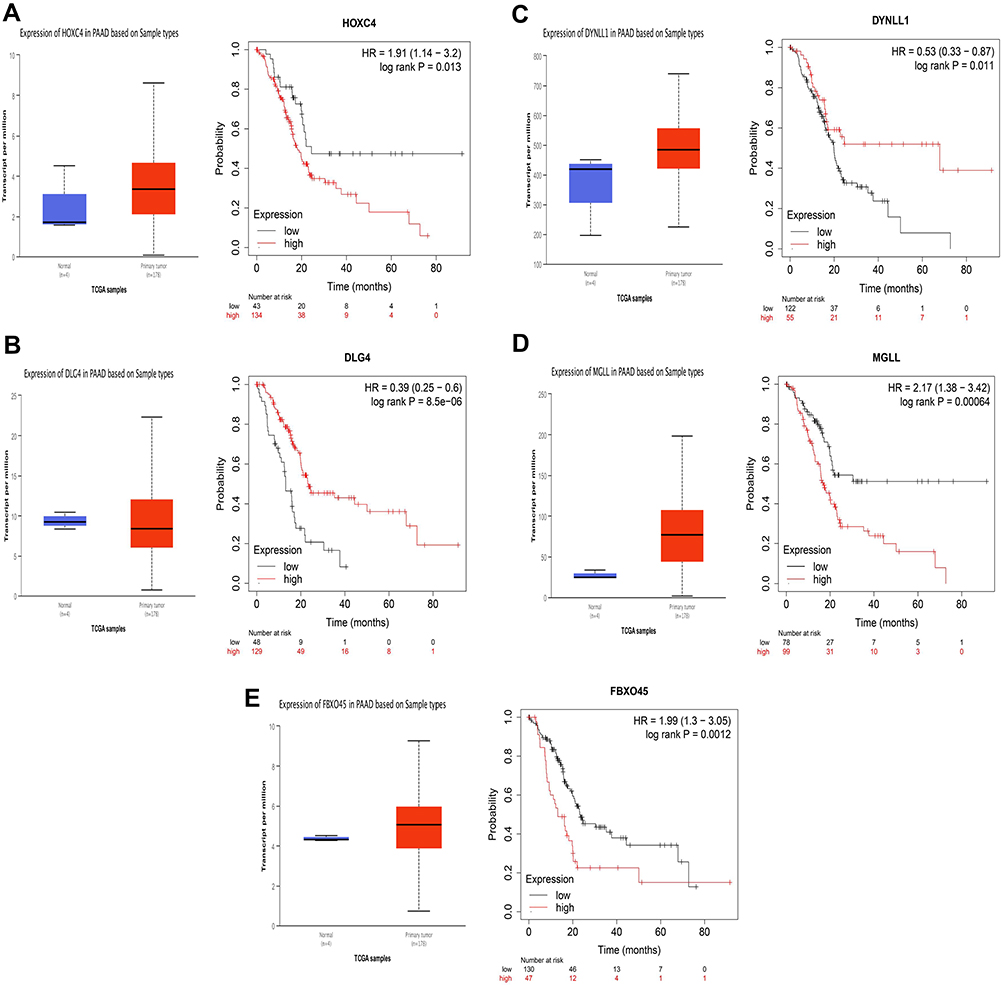 |
Figure 6 Identification of target mRNAs by evaluating their prognosis in PAAD. (A) HOXC4. (B) DLG4. (C) DYNLL1. (D) MGLL. (E) FBXO45. |
Gene Ontology and Pathway Enrichment Analysis for the Targeted Genes
A total of 86 enriched GO terms and four KEGG pathways were identified for the overlapped DEGs. Figure 5 lists the top 10 items, sorted according to the P-value. With respect to BPs, the target DEGs were primarily distributed in “positive regulation of transcription from RNA polymerase II promoter,” “transcription from RNA polymerase II promoter,” “negative regulation of transcription from RNA polymerase II promoter,” “negative regulation of transcription, DNA-templated,” “negative regulation of cell proliferation,” “small GTPase mediated signal transduction,” “regulation of cell differentiation,” “negative regulation of neuron differentiation,” “retrograde protein transport,” “ER to cytosol,” and “myeloid cell differentiation” (Figure 7A). Notably, all these BPs were closely interrelated.
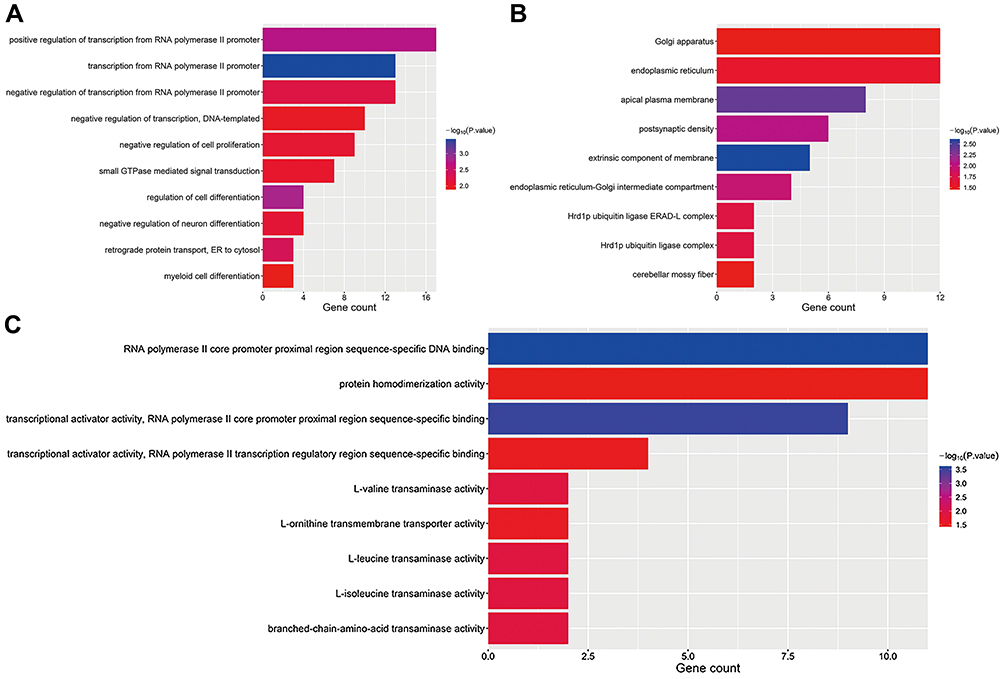 |
Figure 7 GO functional analysis of target DEGs. (A) Biological process. (B) Cellular component. (C) Molecular function. Abbreviations: GO, Gene Ontology; DEGs, differentially expressed genes. |
With respect to CCs, the target DEGs were primarily enriched in “Golgi apparatus,” “endoplasmic reticulum,” “apical plasma membrane, postsynaptic density,” “extrinsic component of membrane,” “endoplasmic reticulum-Golgi intermediate compartment,” “Hrd1p ubiquitin ligase ERAD-L complex,” “Hrd1p ubiquitin ligase complex,” and “cerebellar mossy fiber” (Figure 7B).
With respect to MFs, target DEGs were primarily enriched in “RNA polymerase II core promoter proximal region sequence-specific DNA binding,” “protein homodimerization activity, transcriptional activator activity,” “RNA polymerase II core promoter proximal region sequence-specific binding,” “transcriptional activator activity,” “RNA polymerase II transcription regulatory region sequence-specific binding,” “L-valine transaminase activity 2,” “L-ornithine transmembrane transporter activity,” “L-leucine transaminase activity,” “L-isoleucine transaminase activity,” and “branched-chain-amino-acid transaminase activity” (Figure 7C).
Supplementary Table 5 shows the enriched KEGG pathways of the overlaps. In the KEGG pathway enrichment analysis, target DEGs were mainly distributed in “Valine, leucine, and isoleucine biosynthesis,” “Transcriptional misregulation in cancer,” “Protein processing in endoplasmic reticulum,” and “Pantothenate and CoA biosynthesis” (Figure 8).
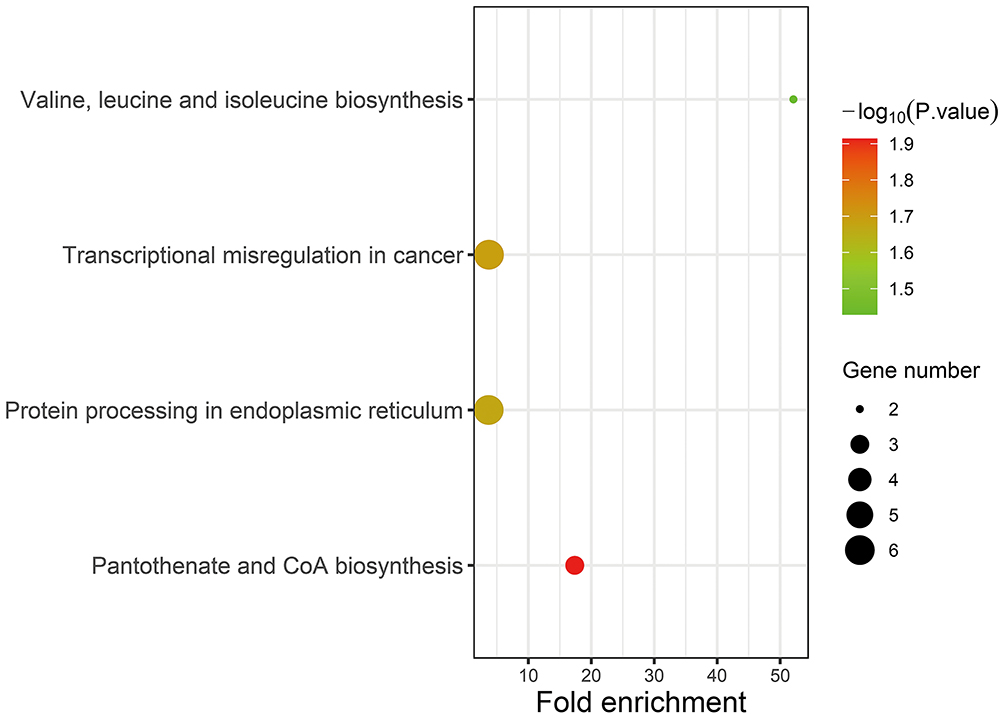 |
Figure 8 KEGG pathway enrichment analysis. Abbreviation: KEGG, Kyoto Encyclopedia of Genes and Genomes. |
Validation of the DEMIs and Target Genes
The results of qRT-PCR are presented in Figure 9 (Supplementary Table 6). miR-455-3p was designed for qRT-PCR analysis. Compared with hTERT-HPNE cells, the expression of miR-455 in PAAD cell lines was significantly decreased (P<0.01) (Figure 9A). HOXC4, DLG4, DYNLL1 and FBXO45, as the target genes of miR-455-3p, significantly increased the mRNA expression level in PANC1, ASPC-1, BXPC-3, MIAPACA-2 cells compared with hTERT HPNE cells (P<0.05) (Figure 9B–F). However, there was no significant difference in the expression of MGLL between the two samples (P˃0.05) (Figure 9C). Compared with that in normal human pancreatic duct epithelial cells (HPNE), the expression level of DYNLL1 was significantly upregulated in PAAD cell lines (P<0.05) and was most upregulated in the BXPC-3 cell line (P<0.01) (Figure 9D). Although the expression of FBXO45 in various cell lines was not statistically significant (P˃0.05), the expression level of the gene in pancreatic cancer cell lines was higher than that in normal cell lines (Figure 9E). The expression level of HOXC4 was most upregulated in the ASPC-1 cell line (P<0.01) (Figure 9F). These results are mostly consistent with the results of bioinformatics analysis, indicating that the candidates obtained were reliable.
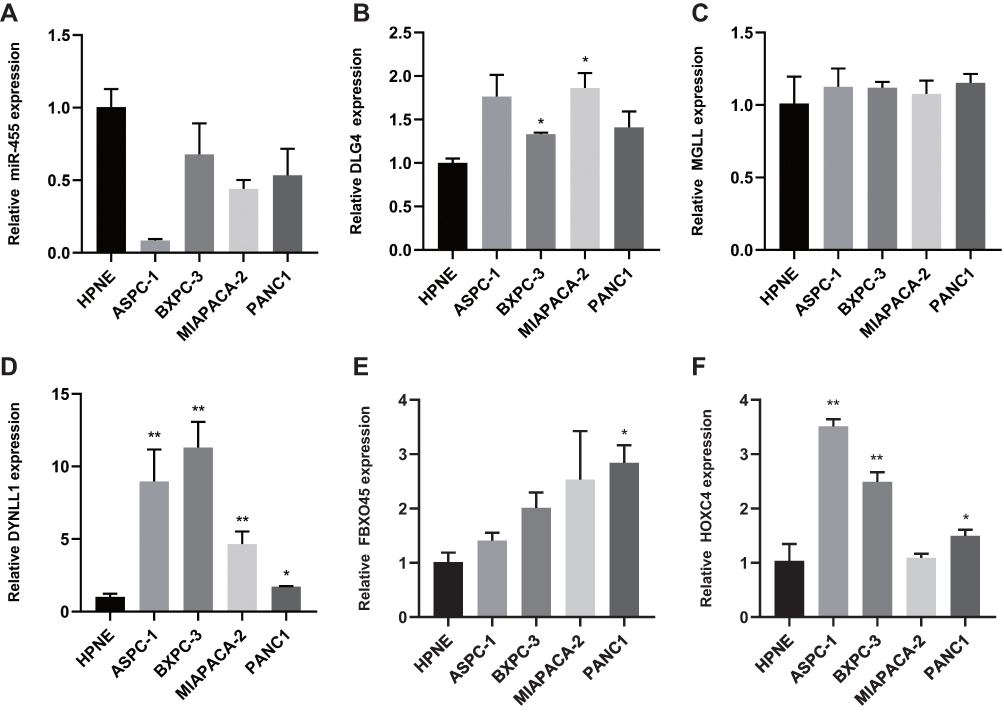 |
Figure 9 Expression of miRNAs and Target Genes in normal human pancreatic duct epithelial cells and PAAD cell lines. (A) Expression of miR455-3p in normal human pancreatic duct epithelial cells and PAAD cell lines by qRT-PCR. (B–F) qRT-PCR analysis of HOXC4, DLG4, DYNLL1, MGLL, FBXO45 mRNA expression in normal human pancreatic duct epithelial cells and PAAD cell lines (the values represent mean ± SD). The asterisks are used to indicate a statistically significant difference: * p < 0.05; ** p < 0.01. Abbreviations: HOXC4, Homeobox C4; DLG4, Discs Large MAGUK Scaffold Protein 4; DYNLL1, Dynein Light Chain LC8-Type 1; MGLL, Monoglyceride Lipase; FBXO45, F-Box Protein 45; qRT-PCR, quantitative real-time PCR. |
Discussion
In this study, DEMIs and DEMs in PAAD were detected and analyzed by microarray and bioinformatics tools. Sixty-two DEMIs and 2453 DEGs were obtained altogether between PAAD and normal tissues, via analysis of the datasets GSE41372 and GSE43795 from the GEO database using the “limma” package of R 4.0.2 software. Then, to better identify the mechanisms of DEMIs and target genes, with respect to PAAD development, TF networks of DEMIs were constructed to screen for possible TFs that might regulate downstream DEMIs. We found that early growth response 1 (EGR1), as one of the ten TFs, is tightly linked to the regulation of cell proliferation, differentiation, and apoptosis. EGR1 expression is rapidly triggered by various stimulus at the onset of early G1 phase and activates the downstream target genes involved in the signaling cascade.20 Overexpression of EGR1 contributes to proliferation of tumor cells; However, overexpression of EGR1 can reduce the growth, invasion and tumorigenicity of diverse cancers.21–23
Furthermore, we screened out the target genes of DEMIs by using target gene prediction tools. FunRich tool was used to select DEGs co-expressed between DEMI-targeted genes with DEGs. A total of 160 co-expressed DEGs were obtained as the hub genes. After identifying the targeted mRNA, a miRNA–mRNA regulatory network was acquired, in which downregulated miR-217 and miR-455-3p, as well as upregulated miR-107, miR-125a-5p, miR-140-3p, miR-142-3p, miR-199a-5p, and miR-199b-5p in the PAAD DEMIs had high correlation with the hub genes. miRNAs are involved in tumorigenesis and malignant transformation by binding to target gene sites. In particular, miR-217 and miR-455-3p were considered as the regulation of multiple central genes, and their expression was lower in normal pancreatic tissues and higher in pancreatic cancer tissues. Therefore, we speculate that miR-217 but miR-455-3p may take part in the development of PAAD by participating in the regulation of oncogenes.
In this study, compared with miR-217, the differential expression of miR-455-3p in PAAD and normal tissues was more significant, and its low expression was associated with poor prognosis of PAAD. Previously, a clinicopathological study had found that miR-217 is abnormally expressed in pancreatic precancerous lesions including pancreatic intraepithelial neoplasia and intraductal papillary mucinous neoplasms and that it is downregulated as the pancreatic cancer grade increases.24 Moreover, miR-217-5p (miR-217) can target EGR1 to alleviate the endothelial dysfunction induced by oxidized low-density lipoprotein.25 The expression of miR-455-3p is obviously decreased in the tissues and cells of hepatocellular carcinoma (HCC). This miRNA is able to impair HCC cell malignancy via suppression of insulin growth factor receptor expression, thereby disrupting glycolysis.26 However, in glioma patients, the miRNA was noted to be significantly upregulated, and an increasing expression of this miRNA was associated with decreasing five-year overall survival rates.27 The specific mechanism of miR-455-3p, with respect to PAAD, is still unclear. Therefore, further studies on the expression and mechanism of miR-455-3p may assist in examining it as a potential early biomarker and tumor suppressor gene.
Providing more in-depth evidence about the function of the co-expressed DEGs in PAAD, the functions of target genes were annotated, in addition to pathway analysis. GO enrichment analysis revealed that the target mRNAs were mostly distributed in the BPs associated with positive or negative regulation of transcription associated with RNA polymerase II promoter (RNAPII). Uncontrolled transcriptional elongation is known to be associated with cancer and other human diseases.28 Maintaining RNAPII pause and its release can dynamically regulate transcription elongation, which is a key step of gene expression.29 In a previous study, the loss of rich interaction domain containing protein 1A impaired the pause of RNAPII, leading to gene transcription disorder, which was associated with the occurrence of clear cell ovarian carcinoma.30 Furthermore, with the respect to MF, the most significantly enriched gene set was “RNAPII core promoter proximal region sequence-specific DNA binding”. In addition, we found a set of pathways associated with PAAD, wherein transcriptional misregulation accounted for a large proportion. Moreover, all these characteristic biological attributes were closely interrelated. In conclusion, the hub genes are likely to regulate RNAPII to induce promoter sequence-specific DNA binding, leading to transcriptional imbalance.
We further verified the differential expression of miR-455-3p in normal human pancreatic cells and human pancreatic cancer cells using qRT-PCR. Compared with the normal samples, the expression of miR-455-3p in human ductal endothelial carcinoma cell line was significantly increased. Moreover, HOXC4, DLG4, DYNLL1, MGLL and FBXO45, as targets of miR-455-3p, could be responsible for the development of PAAD. Furthermore, we analyzed the expression levels of target genes (HOXC4, DLG4, DYNLL1, MGLL and FBXO45) via qRT-PCR. As expected, the results verified that these hub genes were markedly differentially expressed in PAAD cells, which was consistent with the results of our bioinformatics analyses. It is speculated that miR-455-3p is involved in increasing the expression of HOXC4, DLG4, DYNLL1, and FBXO45, promoting transcriptional disorders in cancer. What was different from expectations was the expression of MGLL in human pancreatic cancer cell lines compared with normal cells. In cell experiments, we found that the expression level of HOXC4 mRNA in the tumor group was significantly higher than that in the normal sample, especially in AsPC-1, a human metastatic pancreatic adenocarcinoma cell line. Meanwhile, miR-455-3p showed a markedly decreased expression in the AsPC-1 cell line. Therefore, the miR-455-3p-HOXC4 axis is expected to be closely related to the metastasis and prognosis of human pancreatic cancer.
HOXC4 (homeobox C4) is a member of Hox genes family. HOXC4 is up-regulated in uveal melanoma, while knockdown of Hoxc4 expression can prevent the migration, proliferation, invasion and cell cycle progression of uveal melanoma cells.31 Hoxc4 is highly specific in non-cancerous urothelium and cancer tissue samples, and can be used for cancer risk assessment.32 However, the expression of HOXC4 in pancreatic ductal epithelium is not well understood, which can be further studied.
DLG4 (Discs Large MAGUK Scaffold Protein 4) has been linked to brain diseases in the past, such as Alzheimer’s disease, mental disorders, brain retardation, and attention deficit hyperactivity disorder.33–36 The DLG4 gene encodes postsynaptic density protein 95 (PSD95) in the process of neuronal plasticity. Epigenetic editing of DLG4/PSD95 is expected to be a potential therapy for human nervous system diseases.34 Few reports have proved that DLG4 is closely related to the development of human cancers, and this experiment found that DLG4 is also very likely to be related to PAAD.
The expression of DYNLL1 in HCC increases with the progression of tumor grade and stage, leading to decreased overall survival and progression-free survival in HCC patients.37 DYNLL1 is associated with chemoresistance in ovarian cancer treatment.38 DYNLL1 is an important anti-DNA terminal excision factor that affects gene recombination and the efficacy of chemotherapy against DNA damage.39 Reducing the expression of DYNLL1 may be an effective way to reduce chemical resistance.
FBXO45 interacts with Prostate apoptosis response protein 4 as a tumor suppressor gene in cytoplasm and mediates its ubiquitination and proteasome degradation, which can hinder the apoptosis of cancer cells.40 Experiments have shown that the high expression of FBXO45 in squamous cell lung cancer and is inversely correlated with prognosis and survival. This study suggested that the expression of this gene is increased in pancreatic cancer tissues and was associated with poor prognosis. Therefore, we speculate that miR-455-3p overexpression can be used as an effective inhibitor of FBXO45 to improve the survival rate of PAAD patients. In conclusion, the new miRNA mRNA network in this study may provide better therapeutic targets for patients with very poor prognosis of pancreatic cancer. miR-455-3p may be the key miRNA acting on multi-hub mRNAs and changing the prognostic development of PAAD, which is expected to be a tumor suppressor for targeted therapy of PAAD.
There are several limitations in our study. First, the sample size of this study is relatively small, only GSE 41372 and GSE 43795 microarray data. Second, we found that some genes had different results in different public databases, and it was impossible to evaluate the results of these databases. The data obtained in this study perform a comprehensive analysis of miRNA–mRNA network that may take part in the deterioration of PAAD. In conclusion, this study provides a novel miRNA–mRNA axis that may be involved in regulation of transcription disorders of PAAD and considered to be used in the clinical diagnosis and treatment of PAAD. However, the biological function and mechanism of PAAD remain to be further studied.
Abbreviations
PAAD, pancreatic adenocarcinoma; DEMIs, differentially expressed miRNAs; DEGs, differentially expressed genes; GEO, Gene Expression Omnibus; TFs, Transcription factors; GO, Gene Ontology; KEGG, Kyoto Encyclopedia of Genes and Genomes; DAVID, Database for Annotation, Visualization and Integrated Discovery; qRT-PCR, real-time quantitative polymerase chain reaction; miRNAs, MicroRNAs; 3ʹ-UTR, 3ʹ -untranslated region; BP, biological process; CC, cell component; MF, molecular function; HR, hazard ratio; HPNE cells, Normal human pancreatic duct epithelial cells hTERT-HPNE; PANC1 cells, human ductal epithelial cell carcinoma of pancreas.
Acknowledgments
Lingnan Medical Research Center of Guangzhou University of Chinese Medicine.
Funding
This work is supported by Grants from the National Natural Science Foundation of China [grant number 81873190].
Disclosure
The authors state that this study does not have any potential conflicts of interest, such as commercial or financial relationships.
References
1. Hruban RH, Gaida MM, Thompson E, et al. Why is pancreatic cancer so deadly? The pathologist’s view. J Pathol. 2019;248(2):131–141. doi:10.1002/path.5260
2. Siegel RL, Miller KD, Jemal A. Cancer statistics, 2020. CA Cancer J Clin. 2020;70:7–30.
3. Jelski W, Mroczko B. Biochemical diagnostics of pancreatic cancer - present and future. Clin Chim Acta. 2019;498:47–51. doi:10.1016/j.cca.2019.08.013
4. Zeng S, Pöttler M, Lan B, et al. Chemoresistance in pancreatic cancer. Int J Mol Sci. 2019;20.
5. Pishvaian MJ, Blais EM, Brody JR, et al. Overall survival in patients with pancreatic cancer receiving matched therapies following molecular profiling: a retrospective analysis of the know your tumor registry trial. Lancet Oncol. 2020;21(4):508–518. doi:10.1016/S1470-2045(20)30074-7
6. Ansari D, Torén W, Zhou Q, Hu D, Andersson R. Proteomic and genomic profiling of pancreatic cancer. Cell Biol Toxicol. 2019;35(4):333–343. doi:10.1007/s10565-019-09465-9
7. Daoud AZ, Mulholland EJ, Cole G, McCarthy HO. MicroRNAs in pancreatic cancer: biomarkers, prognostic, and therapeutic modulators. BMC Cancer. 2019;19.
8. Capula M, Mantini G, Funel N, Giovannetti E. New avenues in pancreatic cancer: exploiting microRNAs as predictive biomarkers and new approaches to target aberrant metabolism. Expert Rev Clin Pharmacol. 2019;12(12):1081–1090. doi:10.1080/17512433.2019.1693256
9. Mayr C. Regulation by 3ʹ-untranslated regions. Annu Rev Genet. 2017;51(1):171–194. doi:10.1146/annurev-genet-120116-024704
10. Afonso-Grunz F, Müller S. Principles of miRNA–mRNA interactions: beyond sequence complementarity. Cell Mol Life Sci. 2015;72(16):3127–3141. doi:10.1007/s00018-015-1922-2
11. Wan B-S, Cheng M, Zhang L. Insulin-like growth factor 2 mRNA-binding protein 1 promotes cell proliferation via activation of AKT and is directly targeted by microRNA-494 in pancreatic cancer. World J Gastroenterol. 2019;25(40):6063–6076. doi:10.3748/wjg.v25.i40.6063
12. Chen G, Ramírez JC, Deng N, et al. Restructured GEO: restructuring gene expression omnibus metadata for genome dynamics analysis. Database. 2019;2019. doi:10.1093/database/bay145
13. Liu J, Zhu C, Zhang L, et al. MicroRNA-1469-5p promotes the invasion and proliferation of pancreatic cancer cells via direct regulating the NDRG1/NF-κB/E-cadherin axis. Hum Cell. 2020;33(4):1176–1185. doi:10.1007/s13577-020-00399-7.
14. Li S, Li X, Xing X, Wang L. miR-597-5p inhibits cell growth and promotes cell apoptosis by targeting ELK1 in pancreatic cancer. Hum Cell. 2020;33(4):1165–1175. doi:10.1007/s13577-020-00395-x
15. Fang Y, Zhou W, Rong Y, et al.Exosomal miRNA-106b from cancer-associated fibroblast promotes gemcitabine resistance in pancreatic cancer.Exp Cell Res.2019;383(1):111543. doi:10.1016/j.yexcr.2019.111543
16. Hu H, Zhang Q, Chen W, et al. MicroRNA-301a promotes pancreatic cancer invasion and metastasis through the JAK/STAT3 signaling pathway by targeting SOCS5. Carcinogenesis. 2020;41(4):502–514. doi:10.1093/carcin/bgz121.
17. Ashburner M, Ball CA, Blake JA, et al. Gene ontology: tool for the unification of biology. The Gene Ontology Consortium. Nat Genet. 2000;25(1):25–29. doi:10.1038/75556.
18. Kanehisa M, Furumichi M, Tanabe M, Sato Y, Morishima K. KEGG: new perspectives on genomes, pathways, diseases and drugs. Nucleic Acids Res. 2017;45(D1):D353–D361. doi:10.1093/nar/gkw1092
19. Huang DW, Sherman BT, Tan Q, et al. DAVID bioinformatics resources: expanded annotation database and novel algorithms to better extract biology from large gene lists. Nucleic Acids Res. 2007;35(suppl_2):W169–W175. doi:10.1093/nar/gkm415.
20. Sekiya T, Kato K, Kawaguchi A, Nagata K. Involvement of CTCF in transcription regulation of EGR1 at early G1 phase as an architecture factor. Sci Rep-UK. 2019;9(1):329. doi:10.1038/s41598-018-36753-x
21. Chen D-G, Zhu B, Lv S-Q, et al. Inhibition of EGR1 inhibits glioma proliferation by targeting CCND1 promoter. J Exp Clin Cancer Res. 2017;36(1):186. doi:10.1186/s13046-017-0656-4.
22. Guan X, Deng H, Choi UL, et al. EZH2 overexpression dampens tumor-suppressive signals via an EGR1 silencer to drive breast tumorigenesis. Oncogene. 2020;39(48):7127–7141. doi:10.1038/s41388-020-01484-9.
23. Zhao DY, Jacobs KM, Hallahan DE, Thotala D. Silencing Egr1 attenuates radiation-induced apoptosis in normal tissues while killing cancer cells and delaying tumor growth. Mol Cancer Ther. 2015;14(10):2343–2352. doi:10.1158/1535-7163.MCT-14-1051
24. Chang X, Yu C, Li J, Yu S, Chen J. hsa-miR-96 and hsa-miR-217 expression down-regulates with increasing dysplasia in pancreatic intraepithelial neoplasias and intraductal papillary mucinous neoplasms. Int J Med Sci. 2017;14(5):412–418. doi:10.7150/ijms.18641
25. Yang X, Li D, Qi Y-Z, Chen W, Yang C-H, Jiang Y-H. MicroRNA-217 ameliorates inflammatory damage of endothelial cells induced by oxidized LDL by targeting EGR1. Mol Cell Biochem. 2020;475(1–2):41–51. doi:10.1007/s11010-020-03857-w
26. Hu Y, Yang Z, Bao D, Ni J-S, Lou J. miR-455-5p suppresses hepatocellular carcinoma cell growth and invasion via IGF-1R/AKT/GLUT1 pathway by targeting IGF-1R. Pathol Res Pract. 2019;215(12):152674. doi:10.1016/j.prp.2019.152674
27. Wang W, Mu S, Zhao Q, Xue L, Wang S. Identification of differentially expressed microRNAs and the potential of microRNA-455-3p as a novel prognostic biomarker in glioma. Oncol Lett. 2019;18:6150–6156.
28. Shilatifard A, Smith ER, Shilatifard A. Born to run: control of transcription elongation by RNA polymerase II. Nat Rev Mol Cell Biol. 2018;19:464–478.
29. Jonkers I, Lis JT. Getting up to speed with transcription elongation by RNA polymerase II. Nat Rev Mol Cell Bio. 2015;16(3):167–177. doi:10.1038/nrm3953
30. Trizzino M, Barbieri E, Petracovici A, et al. The tumor suppressor ARID1A controls global transcription via pausing of RNA polymerase II. Cell Rep. 2018;23(13):3933–3945. doi:10.1016/j.celrep.2018.05.097
31. Miller GJ, Miller HL, van Bokhoven A, et al. Aberrant HOXC expression accompanies the malignant phenotype in human prostate. Cancer Res. 2003;63:5879–5888.
32. Tsumura K, Arai E, Tian Y, et al. Establishment of permutation for cancer risk estimation in the urothelium based on genome-wide DNA methylation analysis. Carcinogenesis. 2019;40(11):1308–1319. doi:10.1093/carcin/bgz112.
33. Feyder M, Karlsson R-M, Mathur P, et al. Association of mouse Dlg4(PSD-95) gene deletion and human DLG gene variation with phenotypes relevant to autism spectrum disorders and Williams‘ syndrome. Am J Psychiatry. 2010;167(12):1508–1517. doi:10.1176/appi.ajp.2010.10040484.
34. Bustos FJ, Ampuero E, Jury N, et al. Epigenetic editing of the Dlg4/PSD95 gene improves cognition in aged and Alzheimer’s disease mice. Brain. 2017;140(12):3252–3268. doi:10.1093/brain/awx272
35. Krishnan ML, Van Steenwinckel J, Schang A, et al. Integrative genomics of microglia implicates DLG4 (PSD95) in the white matter development of preterm infants. Nat Commun. 2017;8. doi:10.1038/s41467-017-00422-w
36. Moutton S, Bruel AL, Assoum M, et al. Truncating variants of the DLG4 gene are responsible for intellectual disability with marfanoid features. Clin Genet. 2018;93(6):1172–1178. doi:10.1111/cge.13243
37. Berkel C, Cacan E. DYNLL1 is hypomethylated and upregulated in a tumor stage- and grade-dependent manner and associated with increased mortality in hepatocellular carcinoma. Exp Mol Pathol. 2020;117:104567. doi:10.1016/j.yexmp.2020.104567
38. Berkel C, Cacan E. In silico analysis of DYNLL1 expression in ovarian cancer chemoresistance. Cell Biol Int. 2020;44(8):1598–1605. doi:10.1002/cbin.11352
39. He YJ, Meghani K, Caron M-C, et al. DYNLL1 binds to MRE11 to limit DNA end resection in BRCA1-deficient cells. Nature. 2018;563(7732):522–526. doi:10.1038/s41586-018-0670-5.
40. Chen X, Sahasrabuddhe AA, Szankasi P, et al. Fbxo45-mediated degradation of the tumor-suppressor Par-4 regulates cancer cell survival. Cell Death Differ. 2014;21(10):1535–1545. doi:10.1038/cdd.2014.92.
 © 2021 The Author(s). This work is published and licensed by Dove Medical Press Limited. The
full terms of this license are available at https://www.dovepress.com/terms
and incorporate the Creative Commons Attribution
- Non Commercial (unported, 3.0) License.
By accessing the work you hereby accept the Terms. Non-commercial uses of the work are permitted
without any further permission from Dove Medical Press Limited, provided the work is properly
attributed. For permission for commercial use of this work, please see paragraphs 4.2 and 5 of our Terms.
© 2021 The Author(s). This work is published and licensed by Dove Medical Press Limited. The
full terms of this license are available at https://www.dovepress.com/terms
and incorporate the Creative Commons Attribution
- Non Commercial (unported, 3.0) License.
By accessing the work you hereby accept the Terms. Non-commercial uses of the work are permitted
without any further permission from Dove Medical Press Limited, provided the work is properly
attributed. For permission for commercial use of this work, please see paragraphs 4.2 and 5 of our Terms.