")
Back to Journals » Journal of Hepatocellular Carcinoma » Volume 10
A Novel Gene Pair CSTF2/DPE2A Impacts Prognosis and Cell Cycle of Hepatocellular Carcinoma
Authors Huang Y, Xu J, Xie C, Liao Y, Lin R, Zeng Y, Yu F
Received 12 April 2023
Accepted for publication 18 September 2023
Published 28 September 2023 Volume 2023:10 Pages 1639—1657
DOI https://doi.org/10.2147/JHC.S413935
Checked for plagiarism Yes
Review by Single anonymous peer review
Peer reviewer comments 3
Editor who approved publication: Prof. Dr. Jörg Trojan
Yangjin Huang,* Jun Xu,* Chunming Xie, Yuejuan Liao, Rong Lin, Yuan Zeng, Fujun Yu
Department of Gastroenterology, the First Affiliated Hospital of Wenzhou Medical University, Wenzhou, Zhejiang, People’s Republic of China
*These authors contributed equally to this work
Correspondence: Fujun Yu; Yuan Zeng, Tel/Fax +86 577-555791922, Email [email protected]; [email protected]
Background: Hepatocellular carcinoma (HCC), one of the commonest cancers at present, possesses elevated mortality. This study explored the predictive value of CSTF2/PDE2A for HCC prognosis.
Methods: In this study, clinical information and RNA sequencing expression profiles of HCC patients were acquired from common databases. Kaplan–Meier curve compound with time-dependent ROC curve, nomogram model, and univariate/multivariate Cox analysis were carried out to access the prediction capacity of CSTF2/PDE2A. The immune status, tumor microenvironment, drug sensitivity, biological function and pathway between HCC and adjacent non-tumorous tissue were analyzed and compared. Finally, RT-qPCR, Western blot, and apoptosis assays were performed to verify the effect on HCC cells of CSTF2/PDE2A.
Results: The optimal cut-off value of CSTF2, PDE2A and CSTF2/PDE2A was 6.95, 0.95 and 3.63, respectively. In TCGA and ICGC cohorts, the high group of CSTF2/PDE2A presented higher OS compared to low group. The area under the curve (AUC) for OS at 1-, 2-, and 3-years predicted by CSTF2/PDE2A were 0.731/0.695, 0.713/0.732 and 0.689/0.755, higher than the counterparts of the single gene CSTF2 and PDE2A. Multivariate Cox analysis revealed that CSTF2/PDE2A (HR = 1.860/3.236, 95% CI = 1.265– 2.733/1.575– 6.645) was an independent prognostic factor for HCC. The OS nomogram model created according to five independent factors including CSTF2/PDE2A showed excellent capacity for HCC prognosis. Furthermore, the immune status of the CSTF2/PDE2A high group was deleted, cell cycle-related genes and chemotherapy resistance were increased. Finally, cell experiments revealed distinct differences in the proliferation, apoptosis, protein and mRNA expression of HCC cells after si-CSTF2 transfection compared with the negative control.
Conclusion: Taken together, the gene pair CSTF2/PDE2A is able to forecast the prognosis of HCC and regulates cell cycle, which is promising as a novel prognostic predictor of HCC.
Keywords: hepatocellular carcinoma, gene pair, overall survival, cell cycle, immune status, prognosis
Introduction
Primary liver cancer possesses the sixth highest tumor incidence rate as well as ranks third in terms of cancer-related causes of death all over the world.1 Whereas hepatocellular carcinoma is the predominant pathologic category, consisting of about 90% of total cases.2 HCC cases tend to occur in underdeveloped areas such as Southeast Asia (comprising 10.8% of cases) and East Asia (comprising 54.8% of cases).3 It is also reported that in western countries more than a million people are dying yearly on account of HCC.4 Proverbially, as a sophisticated procedure, the development of HCC is related to various risk factors. In developing regions, chronic hepatitis B virus (HBV) and aflatoxin B1 (AFB1) play the foremost role in the development of HCC.5,6 While hepatitis C virus (HCV)7 and nonalcoholic fatty liver disease (NAFLD)8 contribute to HCC most in developed regions. Radiofrequency or microwave ablation, liver transplantation, and liver resection remain the first-line treatments of HCC.9 However, the poor prognosis of HCC has sparked our motivation to explore the underlying molecular mechanisms of HCC and discover innovative diagnostic predictors to discriminate HCC patients at disparate risk for precise therapeutic strategies.
Increasingly differentially expressed genes (DEGs) between HCC tissue and adjacent tissue are being demonstrated to associated with prognosis of HCC.10,11 Moreover, gene pairs such as autophagy, and immune and RNA-binding protein-related gene pairs also perform stable predictive capability of HCC prognosis.12–14 CSTF2, the 64,000 Mr. RNA-binding subunit of CSTF,15,16 plays a significant role in recognizing the GU-rich component downstream of the site of cleavage.17,18 It is reported that CSTF2 promotes HCC progression by affecting aerobic glycolysis.19 Additionally, CSTF2 facilitates malignant progression of HCC via activating PI3K/AKT/mTOR pathway.20 Phosphodiesterases (PDEs), consisting of 11 families (PDE1 to PDE11), are particular enzymes that play a significant part in the hydrolysis of cyclic guanosine monophosphate (cGMP) and/or cyclic adenosine monophosphate (cAMP).21 While PDE2A is an evolutionarily conserved cAMP and cGMP PDE that play a vital part in resisting tumor cell invasion and growth, it has been well related to the prognosis of HCC.22,23 Given the high expression of CSTF2 and the low expression of PDE2A in HCC, and CSTF2 and PDE2A can predict the prognosis of HCC, respectively,23,24 we speculated that the ratio of CSTF2 to PDE2A may possess a more accurate prediction ability for HCC prognosis than the single gene. Therefore, we combined CSTF2 and PDE2A into gene pair CSTF2/PDE2A to predict the HCC prognosis.
In this study, we utilized two public databases as the training group and the test group to evaluate the precision for forecasting the HCC survival rate of the gene pair CSTF2/PDE2A. Considering the higher area under the curve (AUC) of CSTF2/PDE2A at 1-, 2-, and 3-year OS compared to both CSTF2 and PDE2A, which presents a more accurate prediction of HCC prognosis, CSTF2/PDE2A was subjected to further analysis. Additionally, we investigated the relevancy of CSTF2/PDE2A with immune status and cancer chemo-resistance. To uncover the latent mechanism of gene pair, functional enrichment analysis was carried out. Finally, through cell transfection assay, the function of gene pair CSTF2/PDE2A in HCC cells was identified. We sincerely hope that the gene pair CSTF2/PDE2A may provide a novel predictor of HCC prognosis.
Methods
HCC Patient Data and Specimens
RNA sequencing data as well as relevant clinical information of 365 patients with Hepatocellular Carcinoma were provided from the Cancer Genome Atlas (TCGA) (https://portal.gdc.cancer.gov/repository) and were regarded for a training cohort. The gene expression profile using RNA sequencing and matched clinicopathological information of another 231 cancer specimens were acquired from the International Cancer Genome Consortium (ICGC) data portal (https://dcc.icgc.org/projects/LIRI-JP) and were regarded as a test cohort. In compliance with TCGA and ICGC data access policies and published handbooks, all data from TCGA and ICGC were legally obtained.
Gene Expression Analysis, Survival Analysis, and ROC Curves
Above all, the value of CSTF2/PDE2A was the expression of CSTF2 divided by the expression of PDE2A. With a false discovery rate <0.05, the gene expression analysis of CSTF2, PDE2A, and gene pair CSTF2/PDE2A used in HCC tissue and adjacent non-tumorous tissue was implemented employing the “limma” package. The optimal cut-off value of the survival curve was obtained via the “glmnet”, “survival” and “survminer” packages. And the high and low groups of CSTF2, PDE2A, and gene pair CSTF2/PDE2A were divided on the basis of the optimal cut-off value. Besides this, survival analysis was carried out employing the “survival” package as well as the “survminer” R package for the purpose of analyzing the OS of high-group and low-group of single gene CSTF2, PDE2A, and gene pair CSTF2/PDE2A, respectively. With the “survival” R and “timeROC” R package, a time-dependent ROC curve was enforced for exploring their forecast probability in HCC prognosis.
Independent Prognostic Factors Analysis
To validate CSTF2/PDE2A was an accurate independent prognostic factor for OS in HCC compared to other clinical features such as gender, age, tumor grade, and tumor stage, univariate and multivariate analyses with a Cox proportional hazard regression model were performed.
Establishment and Validation of Prognosis Nomogram Model
A prognostic nomogram to predict 1-, 2-, and 3-year survival was established using five prognostic factors containing age, gene pair CSTF2/PDE2A, gender, grade, and stage with the “survival” and “replot” packages for the sake of elucidating the prognostic ability of gene pairs more straightforward and clearer. The nomogram was produced via allotting a weighted score to every single prognostic parameter. The scales of age and CSTF2/PDE2A ranged from 15 to 85 and 0 to 100, respectively. Besides this, the scale of the 1-year, 2-year, and 3-year survival rates ranged from 0.5 to 0.9, 0.3 to 0.8, and 0.3 to 0.8, respectively, with the highest total score reaching 180 points. Importantly, the higher the overall score summed up from each prognostic factor point, the lower the survival probability. Moreover, to assess the prognosis ability of nomogram accurately, calibration and time-dependent ROC curves were used employing the “rms” and “timeROC” package. In brief, calibration graphs were performed for comparing the nomogram-predicted outcome with the practical outcome using a 45-degree line as an optimal model. The expected likelihood of collinearity was drawn graphically as an observable indicator for evaluating the alignment of the nomogram. Simultaneously, to detect the specificity and sensitivity of a nomogram, ROC curves were executed. The higher the degree of fitting between the calibration curve and the reference curve and the AUC of the ROC curve, the higher the prediction accuracy of the nomogram we manufactured.
Immune Status and Tumor Microenvironment Analysis
With the “GSVA” and “GSEABase” packages, immune cell and immune function scores of HCC tissue were computed using the ssGSEA method to calculate the expression values of specific genes. The immune cell and immune function differential analysis was conducted via the R “limma” package, aiming at the high and low groups. And tumor purity was inferred using the “estimate” R package. Spearman correlation was carried out to explore the relation between CSTF2/PDE2A and tumor purity.
Biological Function and Pathway Analyses
With the “limma” package, the differentially expressed genes (DEGs) between the high and low groups were obtained. Gene Ontology (GO) and Kyoto Encyclopedia of Genes and Genomes (KEGG) analyses were conducted using Gene set enrichment analysis (GSEA) with the “clusterProfiler” package targeting the DEGs between two groups.
Chemotherapy Sensitivity Analysis
Consisting of 60 diverse cancer cell lines from 9 diverse tumor species, the NCI-60 database was analyzed by the CellMiner (GIFURE) (https://discover.nci.nih.gov/cellminer/). For analyzing the relationship of the CSTF2/PDE2A expression with chemotherapy sensitivity, Pearson correlation was employed through the efficacy analysis of 263 drugs in clinical trials or authorized by the FDA (Supplementary Table 1).
Cell Culture and Transfection
Immortalized HCC cell line Huh7 kindly provided from Guangzhou Cellcook Biotech Co., Ltd. Cells were fostered in a suitable medium with the addition of 10% fetal bovine serum (FBS; Gibco) containing streptomycin (100 µg/mL) and penicillin (100 U/mL) for the sake of minimizing the risk of bacterial contamination, and culture conditions were employed in a humidification incubator at 37°C with 95% air and 5% CO2. For cell transfection, logarithmic cells were collected and seeded in 6-well plates at 2 × 10⁵ cells per well, following small interfering RNA (siRNA) negative including control (si-NC) and si-CSTF2 groups were added into incubator. After 12 h incubation, then mixture consisting of siRNA (100nM), Lipofectamine™ 3000 (Thermo Fisher Scientific, Inc.), and medium (Opti-mem) was added into cells. Following 6 h culturation at 37°C, the medium was replaced with fresh medium and cells was cultured at 37°C for another 48h. The effectiveness of the CSTF2 siRNA transfection was validated by Western blot and RT-qPCR.
Cell Proliferation Assay
Huh7 cells were plated into 96-well plates at 8000 cells per well and incubated over-night. Then, 10 μL cell counting kit 8 (CCK8, MedChemExpress, Cat# HY-K0301) solution was applied to each well for 2 h. The absorbance value representing cell numbers was determined at 450 nm utilizing a microplate reader (Bio-Rad Laboratories; Hercules, CA, USA).
Cell Apoptosis Analysis
As for cell apoptosis analysis, cells were collected and resuspended using culture medium containing Annexin V-FITC and Propidium Iodide dyes (10 μg/mL) (Lianke, Shanghai, PRC). Following 30 minutes incubation at 37°C in dark room, apoptosis of the cells was determined by Flow Cytometry (Beckman Coulter, California, USA) and analyzed using Flowjo v10 software (BD Biosciences, Heidelberg, BRD).
Western Blot Analysis
Total proteins of cells were extracted using cold RIPA lysis buffer (Solarbio, China) added with phosphatase inhibitor cocktail (GlpBio, United States) and PMSF (Beyotime, China), and the concentration of protein was measured by BCA assay (Beyotime, China) with 20 μg total proteins used for immunoblotting. The protein samples were separated by SDS-PAGE (10%) and transferred to the PVDF membranes (Millipore, United States). Then the PVDF membranes were blocked using 5% dried skim milk for 2 h and then incubated overnight at 4°C with corresponding primary antibodies presented in Table 1. After that, the membranes were washed three times with TBST and incubated using an HRP-IgG antibody for 2 h at room temperature. Then, the membranes were cleaned again with TBST as before. In the end, the proteins were detected with an ECL detection system. The intensities of protein were analyzed utilizing ImageJ software with β-actin used as the reference for normalizing protein expressions.
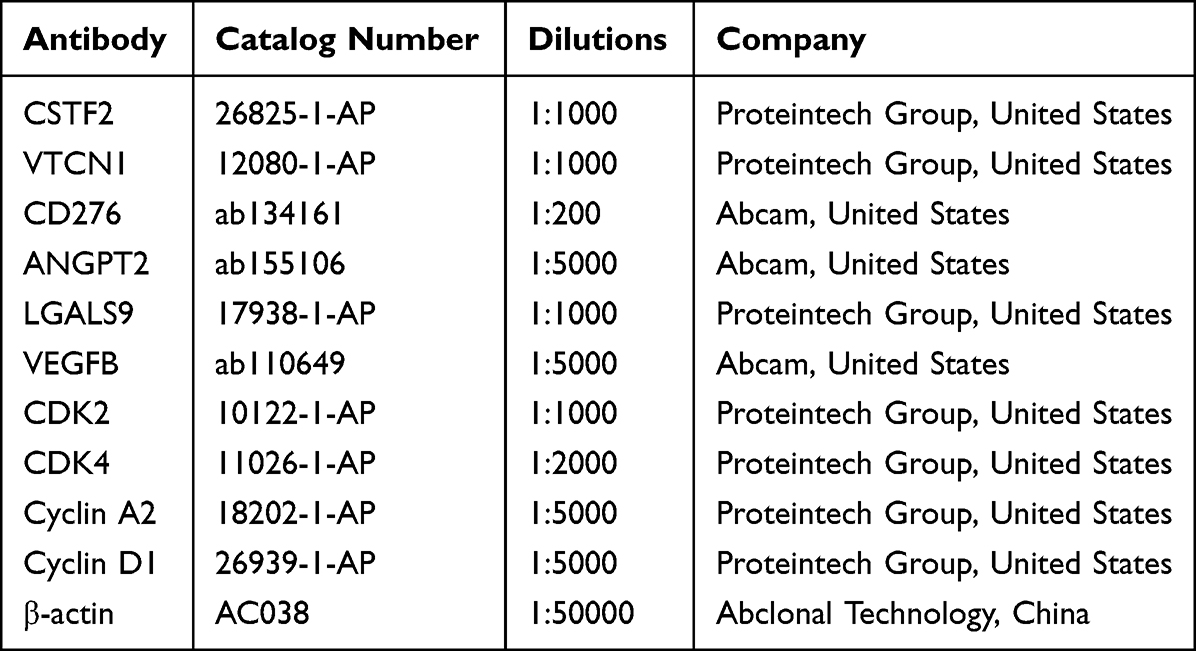 |
Table 1 The Information of Antibodies Used in the Present Experiment |
Quantitative Real-Time PCR (RT-qPCR)
With the TRIzol reagent (Thermo Scientific, Cat# 15596018), total RNA was abstracted from the cells. The concentration of extracted RNA was detected on Nanodrop. Then, using a Prime Script RT Reagent Kit (Takara, Cat#RR036A), the RNA was reverse-transcribed into complementary DNA based on the manufacturer’s protocol. Taking the cDNA, RT-qPCR was executed via the CellAmp™ Direct TB Green® RT-qPCR Kit (Takara, Cat# 3735A). The relative mRNA levels of the target mRNA were calculated using the 2-ΔΔCT method with GAPDH or β-actin used for normalization. The primers are summed up in Table 2.
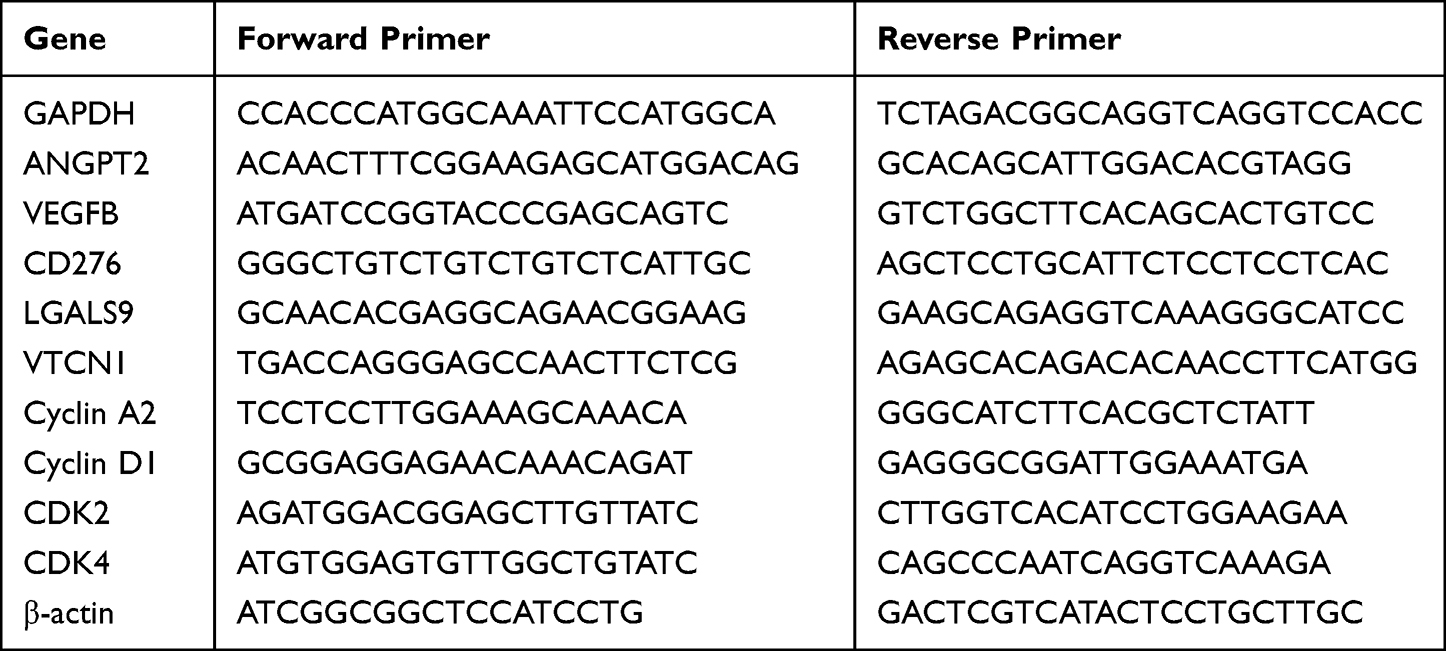 |
Table 2 The Detailed Information of the Primer Sequences Used in Real-Time Quantitative-Polymerase Chain Reaction |
Statistical Analysis
Paired Student’s t-test was performed to compare CSTF2, PDE2A and the value of CSTF2/PDE2A between tumor and adjacent tissue. Wilcoxon rank-sum test was used to compare variables between the high- and low-CSTF2/PDE2A groups and between other unmatched patient groups. Using Kaplan–Meier analysis and Log rank test, the OS in different groups were analyzed. Receiver operating characteristic (ROC) curves were analyzed by the Wilson/Brown method and 95% confidence intervals to evaluate the predictive significance of variables for OS. And univariate and multivariate analyses were conducted using Cox regression to filter independent prognosis factors of overall survival. The Mann–Whitney test was performed to make the ssGSEA scores of immune cells or immune pathways a comparison between the high and low groups, while p values were adjusted by the BH method. Correlation analysis was performed by the Pearson method and Spearman method. Comparisons between two groups were analyzed using unpaired Student’s t-test. And comparisons of multiple groups were analyzed by one-way analysis of variance (ANOVA) followed by Tukey’s post hoc test. We consider a two-tailed p-value <0.05 to be statistically significant.
Results
We assembled 365 data of HCC patients using The Cancer Genome Atlas (TCGA) and 231 HCC patients using the International Cancer Genome Consortium-Japan (LIRI-JP) in this research. The circumstantial clinicopathological features of patients are summed up in Table 3.
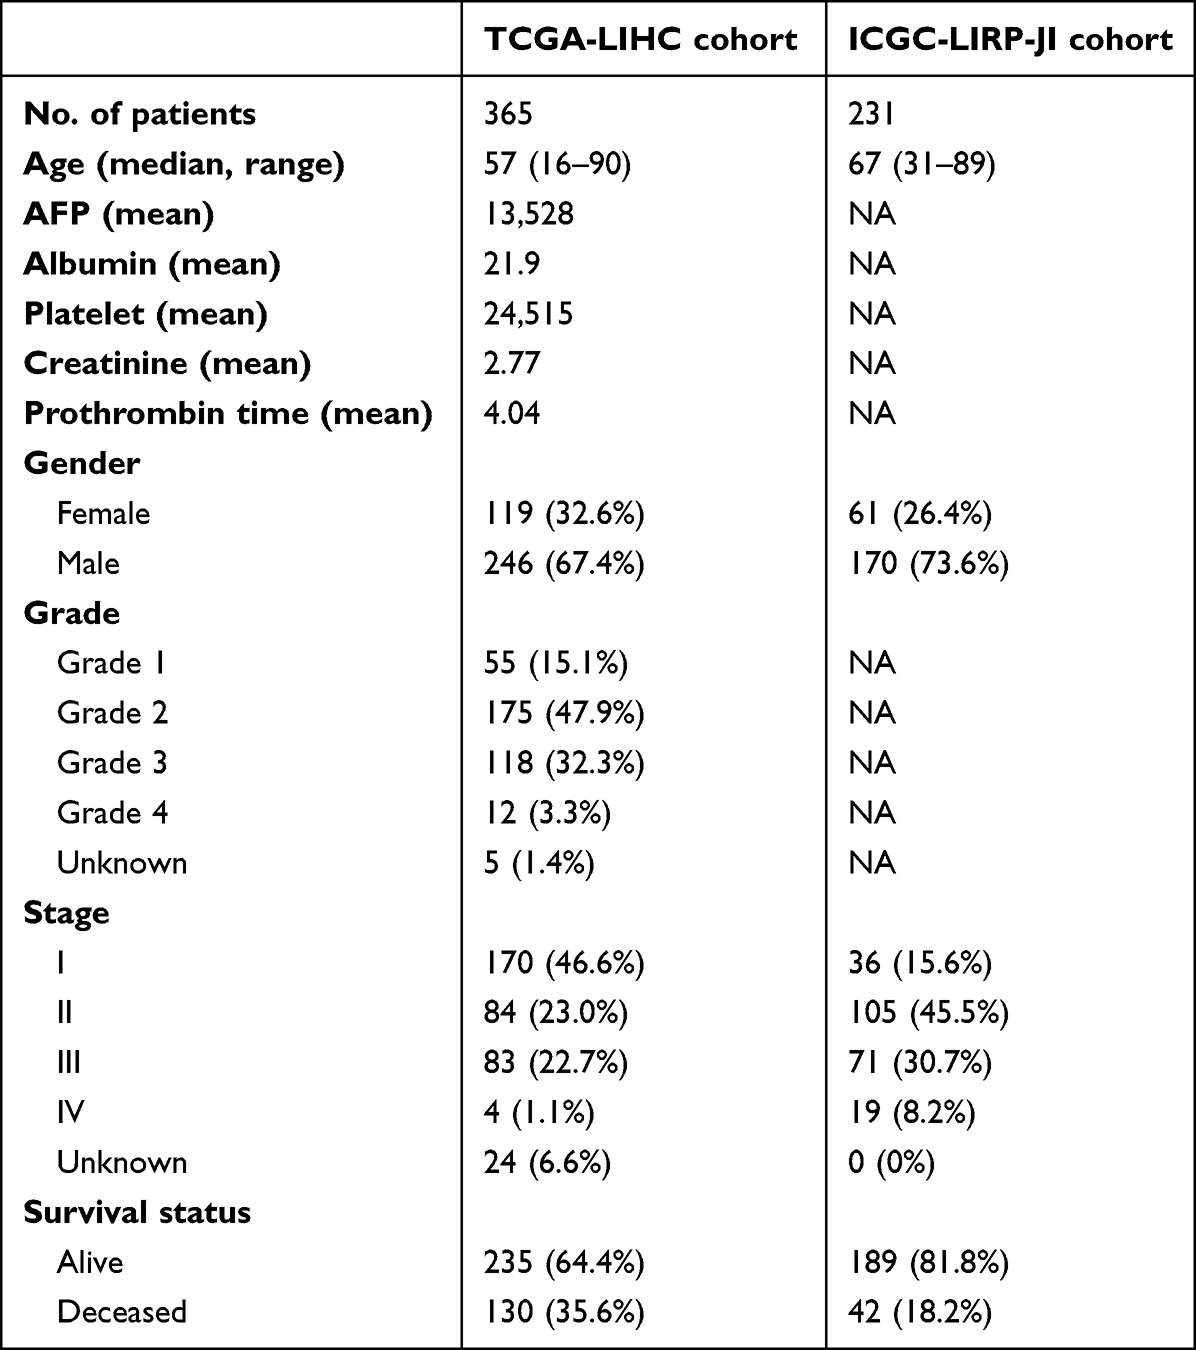 |
Table 3 Clinical Characteristics of the HCC Patients Used in This Study |
Gene Expression Analysis
First of all, gene expression analysis was performed to detect the expression levels of CSTF2, PDE2A, and CSTF2/PDE2A in HCC tissue and adjacent non-tumorous tissue. The results from the TCGA cohort illustrated that CSTF2 and CSTF2/PDE2A presented higher expression levels (P < 0.001) while the expression of PDE2A appeared at a lower level in HCC tissue in contrast with adjacent non-tumorous tissue (P < 0.001) (Figure 1A, B, E and F). Interestingly, from the ICGC cohort, identical results were obtained (Figure 1B and D).
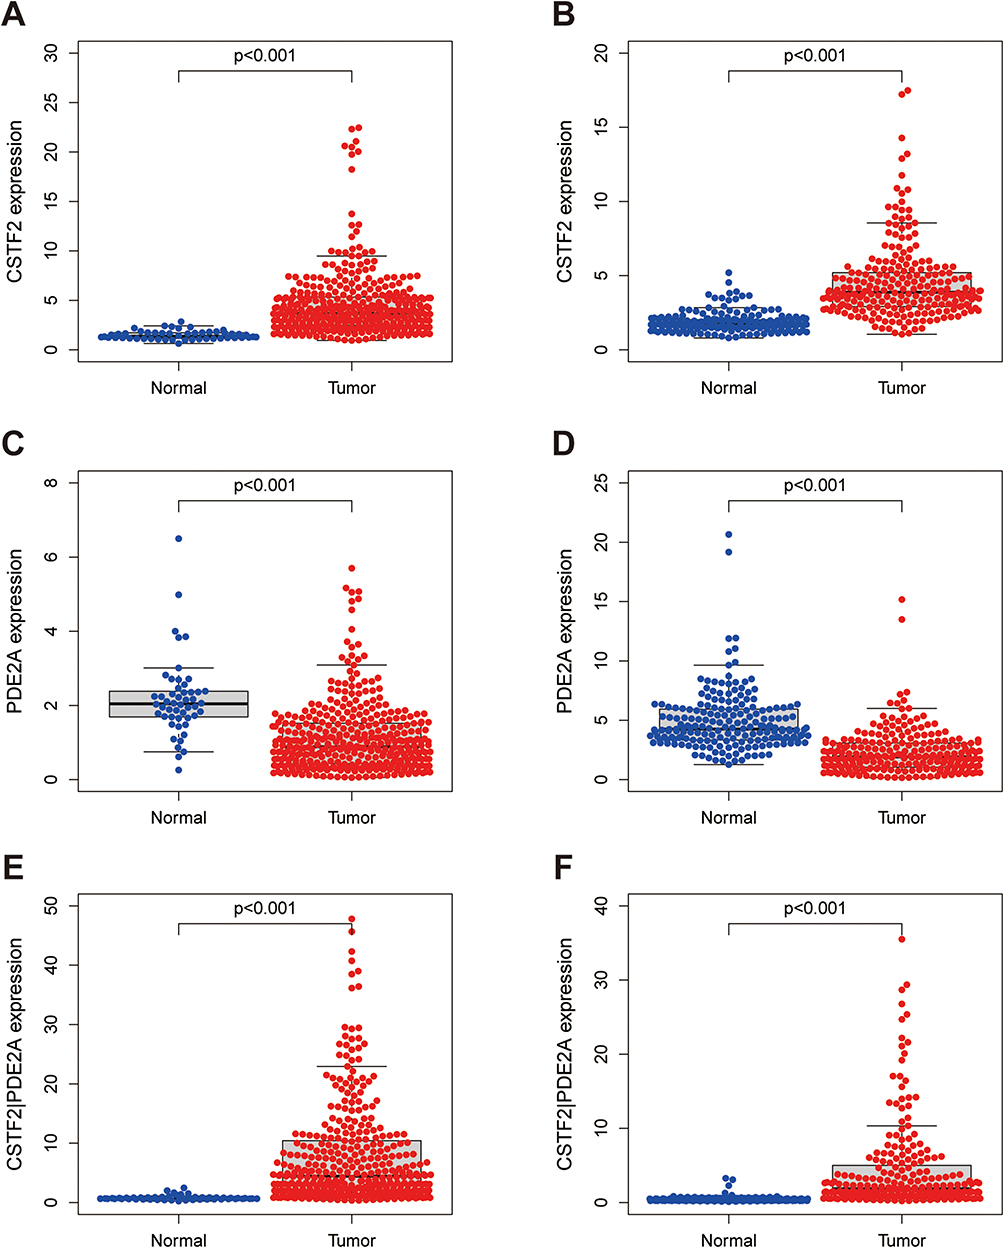 |
Figure 1 Differences in expression of CSTF2, PDE2A, and gene pair CSTF2/PDE2A between HCC tissue and adjacent normal tissue. The expression of (A) CSTF2, (C) PDE2A, (E) CSTF2/PDE2A in TCGA cohort. The expression of (B) CSTF2, (D) PDE2A, (F) CSTF2/PDE2A in ICGC cohort. |
Survival Analysis and ROC Curves
The high and low groups of single gene CSTF2, PDE2A, and gene pair CSTF2/PDE2A were obtained on the basis of the optimal cut-off value (Figure 2A–C). Survival analysis was conducted to analyze the OS of high-group and low-group of single gene CSTF2, PDE2A, and gene pair CSTF2/PDE2A, respectively. We found that the results of survival analysis were the same in the TCGA cohort and ICGC cohort. The Kaplan–Meier curves showed that OS was worse in the high group of CSTF2 and CSTF2/PDE2A compared to responding low counterparts (P < 0.001) (Figure 2D, F, G and I); inversely, the OS was higher in the high group of PDE2A than their low counterparts (P < 0.001) (Figure 2E and H).
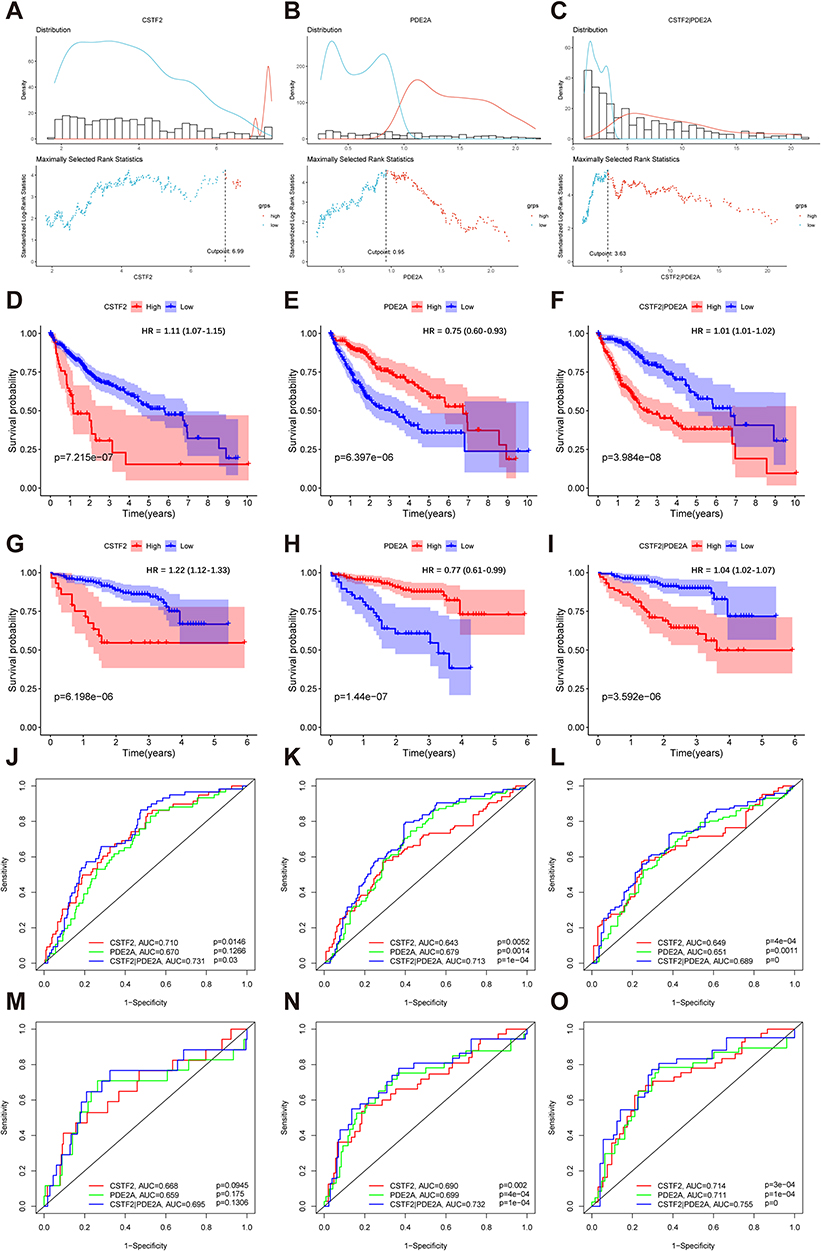 |
Figure 2 Survival analysis and time-dependent ROC curves of CSTF2, PDE2A, and gene pair CSTF2/PDE2A for OS in HCC. The optimal cut-off value of (A) CSTF2 expression, (B) PDE2A expression, and (C) CSTF2/PDE2A expression in HCC patients. Kaplan–Meier curves for OS of patients in the TCGA cohort with high and low (D) CSTF2 expression, (E) PDE2A expression, and (F) CSTF2/PDE2A expression. Kaplan–Meier curves for OS of patients in the ICGC cohort with high and low (G) CSTF2 expression, (H) PDE2A expression, and (I) CSTF2/PDE2A expression. Time-dependent ROC curves of CSTF2, PDE2A and gene pair CSTF2/PDE2A at (J) 1-year, (K) 2-year, and (L) 3-year OS in the TCGA cohort. Time-dependent ROC curves of CSTF2, PDE2A and gene pair CSTF2/PDE2A at (M) 1-year, (N) 2-year, and (O) 3-year OS in the ICGC cohort. |
To estimate the predictive capacity of CSTF2, PDE2A, and CSTF2/PDE2A, time-dependent ROC curves were employed. Firstly, in the TCGA cohort, the results indicated that the 1-year OS of CSTF2, PDE2A, and CSTF2/PDE2A reached an AUC of 0.710, 0.670, and 0.731, respectively (Figure 2J). The AUC of CSTF2, PDE2A, and CSTF2/PDE2A at 2-year OS arrived at 0.643, 0.679, and 0.713, respectively (Figure 2K). And the AUC of CSTF2, PDE2A, and CSTF2/PDE2A at 3-year OS was 0.649, 0.651, and 0.689, severally (Figure 2L). The ICGC cohort revealed similar results: the 1-year OS of CSTF2, PDE2A, and CSTF2/PDE2A reached an AUC of 0.668, 0.659, and 0.695, severally (Figure 2M). And the AUC of CSTF2, PDE2A and CSTF2/PDE2A at 2-year OS was 0.689, 0.699 and 0.732, respectively (Figure 2N). Furthermore, the AUC of CSTF2, PDE2A and CSTF2/PDE2A at 3-year OS arrived at 0.714, 0.711 and 0.755, respectively (Figure 2O). Based on the above results, the AUC of the gene pair CSTF2/PDE2A at 1-, 2-, 3-year is higher than the counterparts of the single gene CSTF2 and PDE2A, demonstrating that the gene pair CSTF2/PDE2A has a more accurate prediction of HCC prognosis.
Independent Prognostic Factors Analysis
To explore whether the gene pair CSTF2/PDE2A was an autonomous prognostic predictor related to OS, univariate and multivariate Cox analyses were performed. Above all, univariate Cox regression indicated that the CSTF2/PDE2A (TCGA cohort: HR = 2.147, 95% CI = 1.469–3.138, P < 0.001; ICGC cohort: HR = 3.796, 95% CI = 1.862–7737, P < 0.001) and the tumor stage (TCGA cohort: HR = 2.500, 95% CI = 1.721–3.632, P < 0.001; ICGC cohort: HR = 2.492, 95% CI = 1.351–4.599, P = 0.003) were independent prognostic factor for OS (Figure 3A and C). After modulating other confounding factors, the multivariate Cox analysis manifested the CSTF2/PDE2A (TCGA cohort: HR = 1.860, 95% CI = 1.265–2.733, P = 0.002; ICGC cohort: HR = 3.236, 95% CI = 1.575–6.645, P = 0.001) and the tumor stage (TCGA cohort: HR = 2.209, 95% CI = 1.508–3.236, P < 0.001; ICGC cohort: HR = 2.495, 95% CI = 1.309–4.754, P = 0.005) in both two cohorts were still remarkably related to OS (Figure 3B and D). Furthermore, ROC curves were employed for detecting the predictive ability of prognosis. The AUC of CSTF2/PDE2A at 1-year OS (TCGA set: AUC = 0.731; ICGC set: AUC = 0.732) and the AUC of CSTF2/PDE2A at 2-year OS (TCGA set: AUC = 0.713; ICGC set: AUC = 0.695) as well as the AUC of CSTF2/PDE2A at 3-year OS (TCGA set: AUC = 0.689; ICGC set: AUC = 0.755) were higher than the corresponding AUC of tumor stage, which proved CSTF2/PDE2A was the optimal independent prognostic factor for OS (Figure 3E–J).
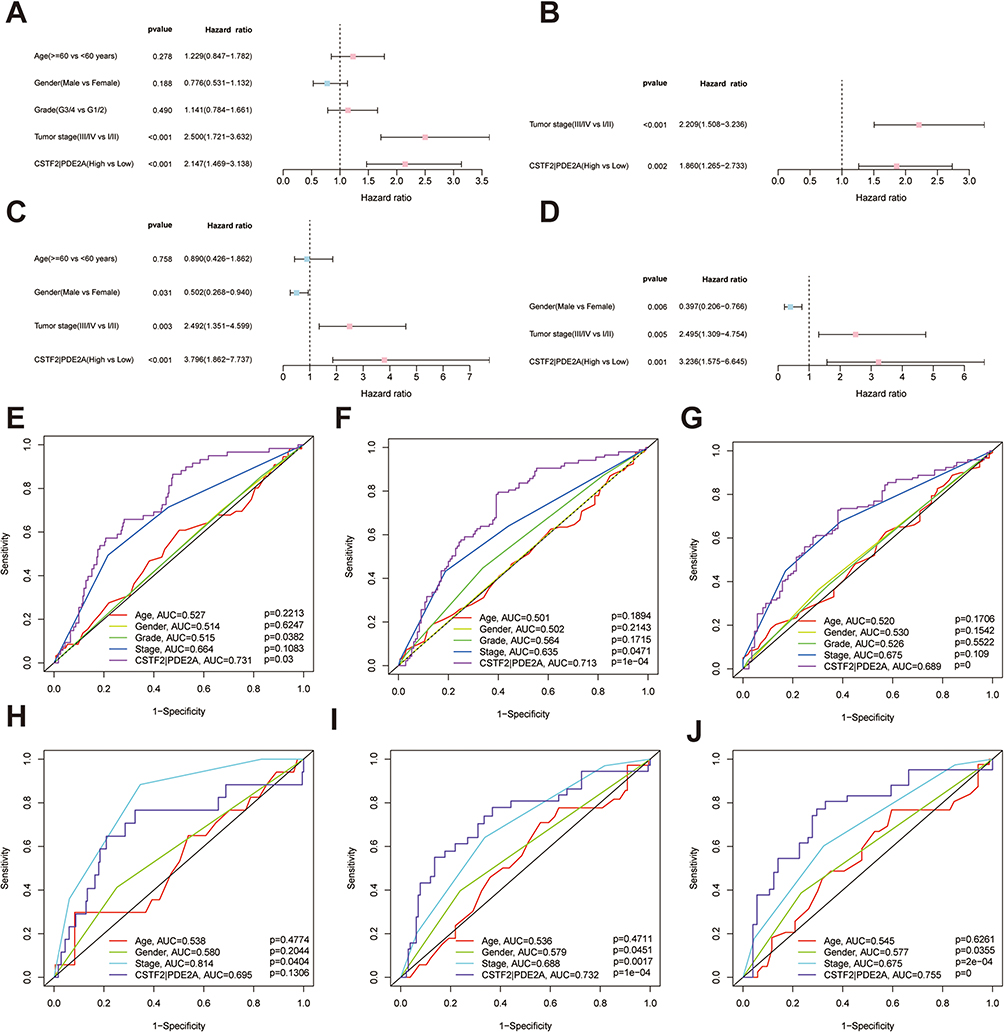 |
Figure 3 Univariate and multivariate Cox regression analysis for the prediction of OS probability and the AUC of clinical characteristics and gene pair CSTF2/PDE2 for OS. (A) Univariate and (B) multivariate Cox regression analyses to screen OS-related factors in the TCGA cohort. (C) Univariate and (D) multivariate Cox regression analyses to screen OS-related factors in the ICGC cohort. The AUC of clinical characteristics and CSTF2/PDE2 at (E) 1-year, (F) 2-year, and (G) 3-year OS in the TCGA cohort. The AUC of clinical characteristics and CSTF2/PDE2 at (H) 1-year, (I) 2-year, and (J) 3-year OS in the ICGC cohort. |
Correlation of CSTF2/PDE2A with Clinical Characteristics
Figure 4A–G showed the correlation of CSTF2/PDE2A with multiple clinical features of individuals with HCC acquired from the TCGA and ICGC. Patients with more advanced tumor stages (P = 0.001) and higher tumor grades (P = 0.001) invariably presented higher expressions of CSTF2/PDE2A in the TCGA cohort. Nevertheless, no significant relevancy was detected between CSTF2/PDE2A with age and gender in this analysis. Similar results were acquired from the ICGC cohort (There was no information related to the HCC grade contained in the ICGC cohort).
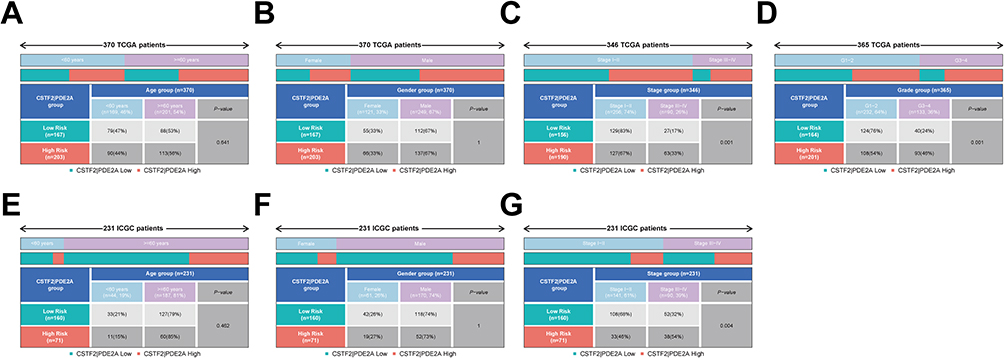 |
Figure 4 The expression of CSTF2/PDE2A in different groups stratified by clinical characteristics. TCGA cohort (A–D), ICGC cohort (E–G). (A and E) Age, (B and F) Gender, (C and G) Tumor stage, (D) Tumor grade. |
Establishment and Validation of the OS Nomogram Model
For illuminating the prognostic ability of gene pair CSTF2/PDE2A more directly and precisely, a prognostic nomogram for 1-, 2-, and 3-year survival was created according to five independent factors containing age, CSTF2/PDE2A, gender, grade, and stage (Figure 5A and B). According to the contribution of each variable to survival, specific points ranging from 0 to 100 were assigned for these variables. Unsurprisingly, the gene pair CSTF2/PDE2A was the most critical variable among these parameters. High-quality calibration plots in the OS nomogram model had been identified in both two cohorts (Figure 5C and H). Furthermore, the high AUC of nomogram at 1-year (TCGA cohort: AUC = 0.739; ICGC cohort: AUC = 0.765), 2-year (TCGA cohort: AUC = 0.707; ICGC cohort: AUC = 0.783) and 3-year (TCGA cohort: AUC = 0.719; ICGC cohort: AUC = 0.797) was detected in both TCGC cohort and ICGC cohort, respectively (Figure 5I–N), which elucidated that the OS nomogram model had an excellent capacity for predicting prognosis of a patient with HCC.
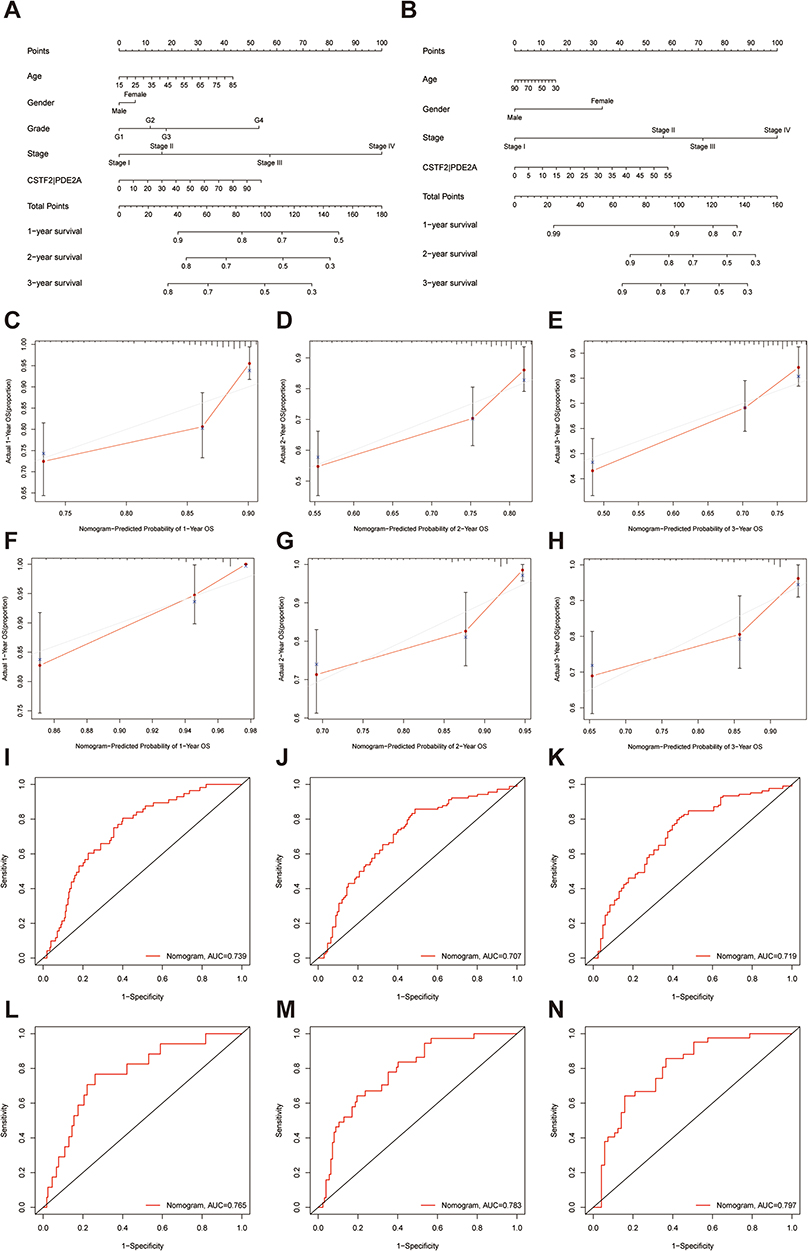 |
Figure 5 The nomogram models for OS and their calibration and ROC curves. Nomogram models combining the CSTF2/PDE2A and clinicopathological features for predicting the OS probability of HCC patients from (A) TCGA cohort and (B) the ICGC cohort. The calibration plots for the OS nomogram model at (C) 1-year, (D) 2-year, and (E) 3-year OS in the TCGA cohort. The calibration plots for the OS nomogram model at (F) 1-year, (G) 2-year, and (H) 3-year OS in the ICGC cohort. The ROC curves of OS nomogram model at (I) 1-year, (J) 2-year, and (K) 3-year OS in the TCGA cohort. The ROC curves of OS nomogram model at (L) 1-year, (M) 2-year, and (N) 3-year OS in the ICGC cohort. |
Immune Status and Tumor Microenvironment Analysis
Following, the relevancy of gene pair CSTF2/PDE2A with immune status, enrichment scores of various immune cell subpopulations as well as relevant functions were quantified utilizing single-sample gene set enrichment analysis (ssGSEA). The results from both two cohorts indicated that immune cells such as B cells, chemokine receptors, NK cells, mast cells, neutrophils, T-helper cells, and tumor infiltrating lymphocytes (TIL) as well as immune functions containing type I and II IFN response significantly reduced in the high group (P < 0.05) (Figure 6A and C). All downregulation of immune cells and relevant functions indicated that the prognosis of individuals with HCC might be affected to some extent by the tumor microenvironment and immune status.
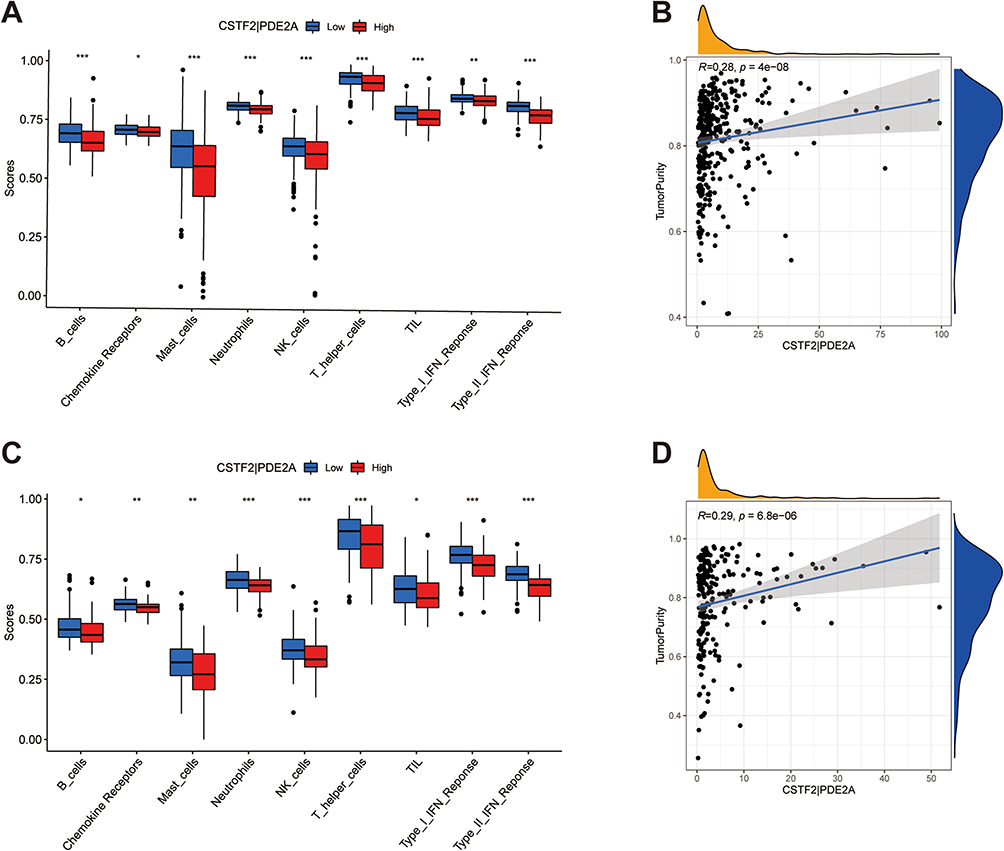 |
Figure 6 The immune status between high and low groups and the relationship of CSTF2/PDE2A with tumor purity. TCGA cohort (A and B), ICGC cohort (C and D). (A and C) The scores of 9 immune cells and related functions. (B and D) The association of CSTF2/PDE2A with tumor purity. P values are showed as: *P < 0.05; **P < 0.01; ***P < 0.001. |
To understand the specific correlation of CSTF2/PDE2A with tumor purity, Spearman correlation was performed. The results enunciated that CSTF2/PDE2A was positively relevant to tumor purity (P < 0.001) (Figure 6B and D).
Biological Function and Pathway Analysis
Gene Ontology (GO) and Kyoto Encyclopedia of Genes and Genomes (KEGG) analyses were employed between two different expression groups using Gene set enrichment analysis (GSEA). The GO function enrichment analysis demonstrated in the high group 10 primary GO functions were enriched accompanying FDR < 0.05 (Figure 7A and B). Specifically, GO function enrichment analysis manifested functions related to the cell cycle including the G2/M transition of the mitotic cell cycle, cell cycle G2/M phase transition, signal transduction by p53 class mediator, cell cycle checkpoint, G1/S transition of the mitotic cell cycle, cell cycle G1/S phase transition, G0 to G1 transition were highly enriched. Besides this, additional diverse functions such as type I interferon production, T cell receptor signaling pathway as well as antigen processing and presentation were also enriched. Furthermore, in the high group under a false discovery rate < 0.05, KEGG analysis identified 10 enriched KEGG pathways (Figure 7C and D). As shown in the KEGG pathway analysis, the high group significantly enriched cell cycle-related pathways. In addition, a few pathways associated with the cancer process containing the mTOR, AMPK, VEGF signaling pathway, viral carcinogenesis, and other functional types of pathways were also correlated with CSTF2/PDE2A. To further explore the intrinsic link between CSTF2/PDE2A and cell cycle, the enrichment scores of a variety of cell cycle-associated genes were quantified via ssGSEA. The results from both two cohorts showed that the scores of all investigated cell cycle-related genes including CDC20, CDC23, CDC25A, CCNA2, CCNB1, CCNB2, E2F1, E2F3, E2F4, E2F5, CDK1, CDK2, CDK4, CDK7, and CHEK1 were higher in the high group (P < 0.001) (Figure 7E and F). Therefore, it is logical to presume that CSTF2/PDE2A may participate in the adjustment of the cell cycle to accelerate the development of HCC.
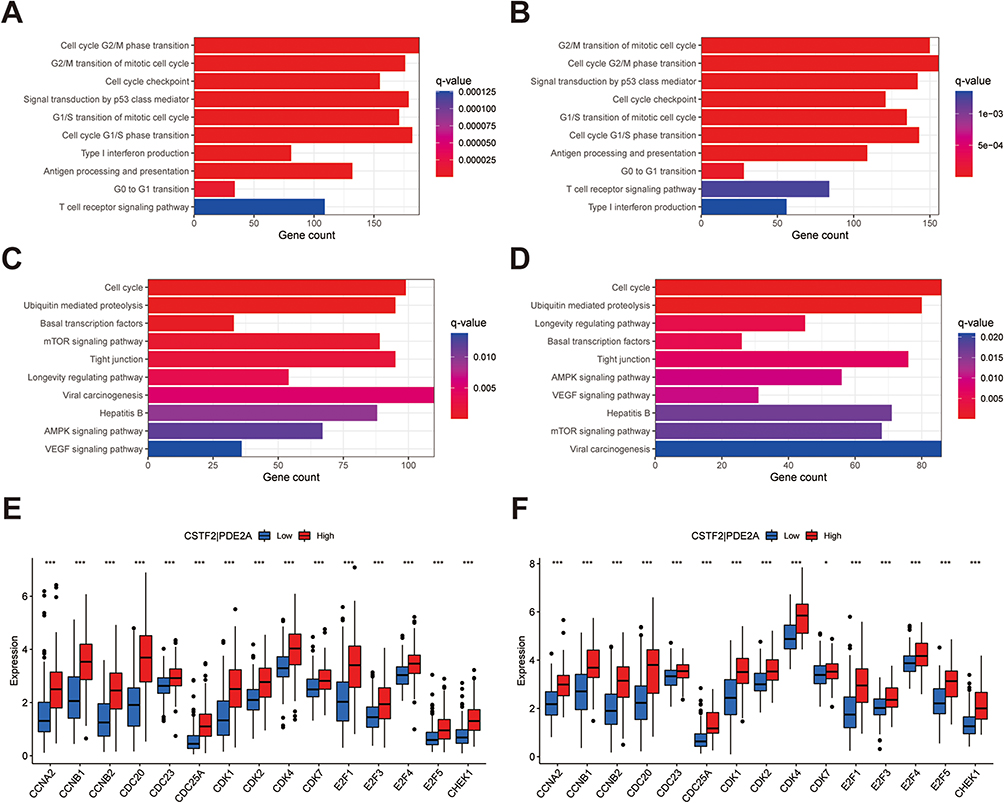 |
Figure 7 Gene set enrichment analysis of biological function and pathway. (A, C and E) TCGA cohort, (B, D and F) ICGC cohort. (A and B) GO, Gene Ontology. (C and D) KEGG, Kyoto Encyclopedia of Genes and Genomes. (E and F) The scores of 15 cell cycle-related genes. |
Chemotherapy Sensitivity Analysis
The correlation between the expression levels of CSTF2/PDE2A and chemotherapy sensitivity in NCI-60 database was analyzed using Pearson correlation. Figure 8A–E showed that with the expression of CSTF2/PDE2A increasing, some drug resistance of tumor cells to anti-tumor drugs including Erlotinib, Staurosporine, Pyrazoloacridine, Sonidegib, and Triciribine phosphate increased accordingly (P < 0.05), which indicated the CSTF2/PDE2A expression was positively correlated with chemotherapy resistance.
 |
Figure 8 Scatter plots of the association between the gene pair CSTF2/PDE2A expression and anti-tumor drugs sensitivity. (A)Erlotinib, (B) Staurosporine, (C) Pyrazoloacridine, (D) Sonidegib, (E) Triciribine phosphate. |
CSTF2/PDE2A is Associated with the Malignant Behavior of HCC
The cell line Huh7 was transfected with si-CSTF2#1 and si-CSTF2#2, and Western blot and RT-qPCR demonstrated that si-CSTF2#2 presented a better knockdown effect (Figure 9A and B). Then, the proliferation and apoptosis of Huh7 cells were detected, and the results hinted that the knockdown of CSTF2 significantly inhibited the proliferation and enhanced the apoptosis rate of Huh7 (Figure 9C and D).
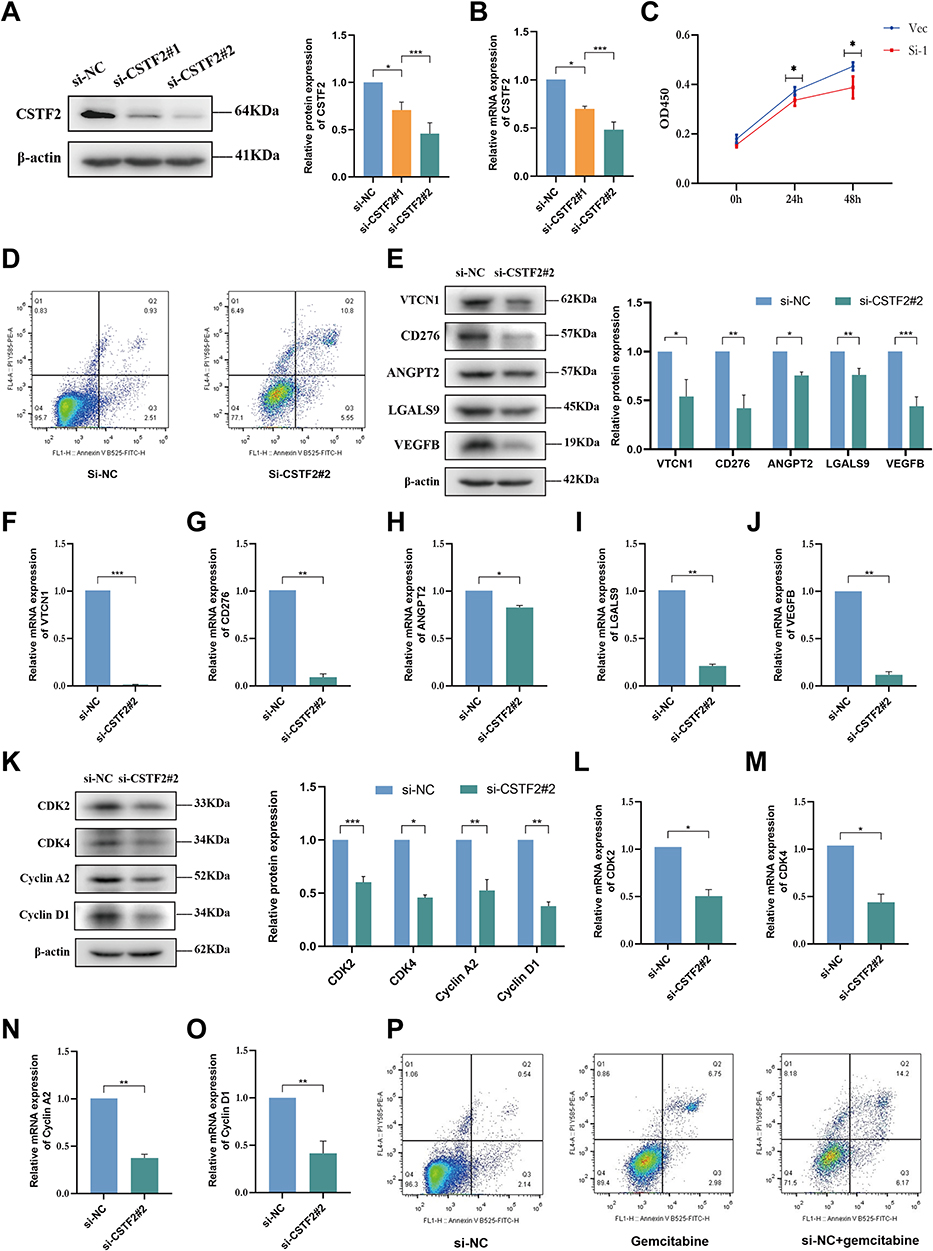 |
Figure 9 Cell experiments presenting the effect of CSTF2 knockdown in HCC cells. The efficiency of si-CSTF2 transfection in Huh7 cells was validated by (A) Western blot and (B) RT-qPCR (n = 3). (C) Cell viability assay was determined using CCK8 (n = 3). (D) Cell apoptosis was detected in Huh7 cells. (E) The protein levels of VTCN1, CD276, ANGPT2, LGALS9, and VEGFB in Huh7 cells were analyzes by Western blot (n = 3). (F–J) The mRNA levels of VTCN1, CD276, ANGPT2, LGALS9, and VEGFB in Huh7 cells were analyzed by RT-qPCR (n = 3). (K) Western blotting analysis of CDK2, CDK4, Cyclin A2, and Cyclin D1 in Huh7 cells (n = 3). (L–O) The relative mRNA expression of CDK2, CDK4, Cyclin A2, and Cyclin D1 in Huh7 cells was analyzed using RT-qPCR (n = 3). (P) The sensitivity of the Huh7 cells to gemcitabine. P values are showed as: *P < 0.05; **P < 0.01; ***P < 0.001. |
CSTF2/PDE2A Reduction Benefits Tumor Immune Status and Angiogenesis
Our foregoing study indicated that CSTF2/PDE2A was correlated with tumor immune status. Consequently, Western blot and RT-qPCR were implemented to verify the modification of tumor immune status-related genes following CSTF2 knockdown. The si-CSTF2 significantly reduced the protein and mRNA levels of immune-related genes including VTCN1, CD276, ANGPT2, and LGALS9 (Figure 9E–I). It is powerfully indicated that with the reduction of the CSTF2/PDE2A ratio, the tumor immune checkpoint will be suppressed significantly. Analogical results were acquired in tumor angiogenesis, angiogenesis-related gene such as VEGFB was down-regulated after si-CSTF2 (Figure 9E and J). The following results commonly demonstrated that the enhancive ratio of CSTF2/PDE2A plays a crucial part in the malignant behavior of tumors.
Reduced CSTF2/PDE2A Regulates Cell Cycle and Tumor Resistance
As mentioned before, we found that CSTF2/PDE2A was positively correlated with cell cycle-related gene and tumor resistance. Therefore, Western blot and RT-qPCR were performed to detect the effect of CSTF2/PDE2A on cell cycle in Huh7 cell line. The results indicated that si-CSTF2 decreased the protein and mRNA expression levels of cell cycle-related gene (Figure 9K–O). Then, we assessed the extent of chemotherapy drug resistance in tumor cells with flow cytometry. The results indicated that si-CSTF2 enhanced the sensitivity of Huh7 cells to gemcitabine (Figure 9P).
Discussion
HCC, a highly heterogeneous disease, has a greatly severe mortality rate.25 Despite making progress in diagnostic as well as surgical techniques, the prognosis of HCC still seems poor.26 The prognosis principally relies on the extent of surgical removal and countermeasures.27 Hence, precise survival prediction and novel treatment in time are vital for HCC patients with elevated risk. Crucially, an increasing number of gene pairs have been identified as prognostic markers of HCC. Considering the prediction abilities for HCC prognosis of CSTF2 and PDE2A,23,24 we combined them into gene pair CSTF2/PDE2A and further explore the prediction ability of it. Previous studies by others showed that 33 immune-related gene pair signatures, autophagy-related gene pairs signatures, and RNA binding protein gene pair signatures predict 5-year OS using AUC for HCC at 0.772, 0.765, and 0.82, respectively, which resembled our research.12–14 A previous study indicated that the AUC of AFP at 3-year OS in TCGA cohort is 0.571, which is lower than the AUC of gene pair CSTF2/PDE2A at 3-year OS (0.689).28 Another study indicated that the AUC of radiomics based on CT at 1-, 2-, 3-year OS was 0.729, 0.803, and 0.773, respectively, which is close to the AUC of CSTF2/PDE2A (1-year OS: 0.731, 2-year OS: 0.713, 3-year OS: 0.689).29 Apart from the excellent predictive ability of HCC prognosis, our study conducted a chemotherapy sensitivity analysis to probe the association of gene pairs with resistance. In our study, molecular predictive marker CSTF2/PDE2A of HCC were screened by genomics, and it provided a novel prognostic strategy for personalized medicine of HCC patients. In addition, our research combined genomics with clinical application, expanding the application of genomics.
In the current research, the TCGA cohort was considered as a training cohort, while the ICGC cohort was termed as a test cohort. Based on the optimal cut-off value, we split the individuals into high-group and low-group. Using gene expression analysis, survival analysis, and ROC curves for CSTF2, PDE2A, and CSTF2/PDE2A respectively, we identified that CSTF2/PDE2A has a better predictive ability for HCC prognosis compared to CSTF2 and PDE2A. Besides this, the results illustrated that the high group was relevant to the advanced TNM stage, higher tumor grade, and shorter OS period, indicating that high expression of CSTF2/PDE2A facilitated the poor prognosis of HCC. Moreover, CSTF2/PDE2A was proved to be an independent prognostic factor for HCC by independent prognostic analysis. Furthermore, the nomogram created according to five independent factors including CSTF2/PDE2A presented an excellent capacity for the prediction of HCC prognosis.
The significance of the tumor microenvironment in the development of modern cancer treatment options is gradually revealed, and increasing studies are underway to identify its components.30,31 As we all know, the tumor microenvironment is a complicated ecology, containing malignant cells adipocytes, lymphocytes, fibroblasts, tumor vasculature, dendritic cells, and cancer-related fibroblasts.32 TME compositions and the biomarkers of the immune system are vital to tumor diagnosis, assessment of prognosis as well as therapeutic effectiveness.33–35 We elucidated that the fractions of B cells, mast cells, chemokine receptors, TIL, neutrophils, T-helper cells, NK cells, type I IFN reaction, as well as type II IFN reaction decreased in the high group, suggesting CSTF2/PDE2A could transform the immune microenvironment to exert an influence on the prognosis of HCC. Consistently, various previous research has shown that the decrease of B cells,36 NK cells,37 T-helper cells,38,39 TIL,38 type I IFN reaction,40,41 and type II IFN reaction42 was related with the poor prognosis of HCC patients. However, the mast cells,43,44 chemokine receptors,45 and neutrophils46,47 play a role in accelerating tumorigenesis. For instance, chemokines directly coordinate the biological behavior of cancer cells containing survival, growth, migration, and invasion.48 It still takes up to explore the specific potential mechanism underlying the fact that in the high group the fractions of mast cells, chemokine receptors, and neutrophils were lower. Moreover, Western blot and RT-qPCR indicated that si-CSTF2 decreased the expression levels of immune-related genes containing VTCN1, CD276, ANGPT2, LGALS9. The percentage of cancer cells in tumor tissue is the definition of tumor purity, reflecting the specific circumstance of TME.49 It is well known that higher tumor purity corresponds to a poor prognosis of HCC.50 Consistently, the positive correlation of CSTF2/PDE2A with tumor purity in our research exactly signified that a high expression level of CSTF2/PDE2A leads to a poor prognosis of HCC.
To gain further insights into the internal potential mechanism of gene pair CSTF2/PDE2A regulating biological processes in HCC, GSEA enrichment analysis was employed. And the results demonstrated that signal pathways such as AMPK, VEGF, mTOR, and viral carcinogenesis were enriched in the high group. Interestingly, these pathways have been identified as being involved in the course of tumor progression.51–54 VEGF is correlated with aggressiveness, vascular density, metastasis, recurrence, and prognosis in the majority of tumors.55 And mTOR signal can facilitate tumor growth and development via a variety of mechanisms, covering the cancer cell migration, promotion of angiogenesis, lipid metabolism, glycolytic metabolism, growth factor receptor signaling as well as autophagy inhibition.56 Inversely, the activation of AMPK performs as a metabolic tumor inhibitor via modulating energy levels, enforcing metabolic checkpoints, and suppressing cell growth.57 More significantly, diverse cell cycle-related processes and signaling pathways were also visibly enriched, enlightening us that CSTF2/PDE2A could modulate biological processes in HCC by modulating the cell cycle. To validate the novel speculation, we furthermore detected the enrichment of cell cycle-related genes.
The cell cycle, containing four successive periods (namely, G1, S, G2, and M), is a sophisticated as well as well-organized regulation process and is predominantly modulated by diverse cyclin-dependent kinases (CDKs) and their corresponding functional cyclin partners.58,59 Previous research has demonstrated that the aberrant function of cell cycle regulators leads to tumorigenesis, making them prominent therapeutic targets in tumor therapy.59,60 Interestingly, in the high group, all explored cell cycle-related genes including CDC20, CDC23, CDC25A, CCNA2, CCNB1, CCNB2, E2F1, E2F3, E2F4, E2F5, CDK1, CDK2, CDK4, CDK7, and CHEK1 were overexpressed. And Western blot and RT-qPCR demonstrated that si-CSTF2 decreased the expression levels of cell cycle-related genes including CDK2, Cyclin A2, CDK4, Cyclin D1 in Huh 7 cells. So it is rational to presume that CSTF2/PDE2A could impact the regulation of cell cycle, causing uncontrolled tumor cell proliferation in HCC.
Despite multikinase depressors such as sorafenib become a first-line drug, and regorafenib used in sorafenib progressors shows benefits of OS with significant side effects, few efficient therapeutic methods were obtained for patients with advanced HCC.61,62 Through the chemotherapy sensitivity analysis in NCI-60 database, our team discovered that enhancive expression of CSTF2/PDE2A was related to incremental drug resistance with several anti-tumor drugs authorized by FDA containing Erlotinib, Staurosporine, Pyrazoloacridine, Sonidegib, and Triciribine phosphate. And the apoptosis assay indicated that si-CSTF2 increased the sensitivity of HCC cells to gemcitabine and reduced drug resistance. These results indicate that the gene pair CSFT2/PDE2A is promising for application as an original therapeutic target against oncology chemotherapy resistance in HCC.
Admittedly, there are some limitations in this research. Limited by experimental conditions, overexpression of PDE2A in HCC cells has not been carried out. And in vivo experiments involving human tissue and animals have not been conducted. In addition, the potential mechanisms of gene pair CSTF2/PDE2A in regulating cell cycle and immune status remain to be further investigated.
Conclusion
The gene pair CSTF2/PDE2A was demonstrated to be independently correlated with OS and be significantly valuable in functional enrichment analysis, immune status, tumor microenvironment as well as chemotherapy sensitivity, offering a new direction with prognosis prediction of HCC. In brief, our study elucidated the value of the gene pair CSTF2/PDE2A in the prognostic evaluation of HCC.
Abbreviations
HCC, hepatocellular carcinoma; TCGA, The Cancer Genome Atlas; ICGC, International Cancer Genome Consortium; DEGs, differentially expressed genes; OS, overall survival; AUC, area under the curve; ROC, receiver operating characteristic; HR, hazard ratio; CI, Confidence interval; GSEA, gene set enrichment analysis; ssGSEA, single-sample Gene Set Enrichment Analysis; GO, Gene Ontology; KEGG, Kyoto Encyclopedia of Genes and Genomes; FDR, false discovery rate; aDCs, plasmacytoid dendritic cells; CDK, cyclin-dependent kinase; NSCLC, nonsmall-cell lung cancer; PDE, phosphodiesterase; cAMP, cyclic adenosine monophosphate; cGMP, cyclic guanosine monophosphate; TNM, tumor-node-metastasis;TIL, tumor infiltrating lymphocytes.
Data Sharing Statement
The datasets generated and/or analyzed during the current study are available in the [https://portal.gdc.cancer.gov/repository], [https://dcc.icgc.org/projects/LIRI-JP], and [https://discover.nci.nih.gov/cellminer/].
Acknowledgments
Yangjin Huang and Jun Xu are co-first authors for this study. The project was supported by the National Natural Science Foundation of China (No. 81970527) and the Zhejiang Provincial Science and Technology Innovation Program (New Young Talent Program) for College Students (No. 2022R413A019).
Author Contributions
All authors made a significant contribution to the work reported, whether that is in the conception, study design, execution, acquisition of data, analysis and interpretation, or in all these areas; took part in drafting, revising, or critically reviewing the article; gave final approval of the version to be published; have agreed on the journal to which the article has been submitted; and agree to be accountable for all aspects of the work.
Disclosure
The authors declare that they have no competing interests in this work.
References
1. Sung H, Ferlay J, Siegel RL, et al. Global cancer statistics 2020: GLOBOCAN estimates of incidence and mortality worldwide for 36 cancers in 185 countries. CA Cancer J Clin. 2021;71(3):209–249. doi:10.3322/caac.21660
2. Petruzziello A. Epidemiology of Hepatitis B Virus (HBV) and Hepatitis C Virus (HCV) related hepatocellular carcinoma. Open Virol J. 2018;12(1):26–32. doi:10.2174/1874357901812010026
3. Chen Z, Xie H, Hu M, et al. Recent progress in treatment of hepatocellular carcinoma. Am J Cancer Res. 2020;10(9):2993–3036.
4. Dimitroulis D, Damaskos C, Valsami S, et al. From diagnosis to treatment of hepatocellular carcinoma: an epidemic problem for both developed and developing world. World J Gastroenterol. 2017;23(29):5282–5294. doi:10.3748/wjg.v23.i29.5282
5. Schweitzer A, Horn J, Mikolajczyk RT, et al. 1Estimations of worldwide prevalence of chronic hepatitis B virus infection: a systematic review of data published between 1965 and 2013. Lancet. 2015;386(10003):1546–1555. doi:10.1016/S0140-6736(15)61412-X
6. Wild CP, Miller JD, Groopman JD. CHAPTER 3. Effects of aflatoxins on aflatoxicosis and liver cancer. In: Mycotoxin Control in Low- and Middle-Income Countries. Lyon (FR); 2015:13.
7. Kanda T, Goto T, Hirotsu Y, et al. Molecular mechanisms driving progression of liver cirrhosis towards hepatocellular carcinoma in chronic hepatitis B and C infections: a review. Int J Mol Sci. 2019;20(6):1358. doi:10.3390/ijms20061358
8. Friedman SL, Neuschwander-Tetri BA, Rinella M, et al. Mechanisms of NAFLD development and therapeutic strategies. Nat Med. 2018;24(7):908–922. doi:10.1038/s41591-018-0104-9
9. Couri T, Pillai A. Goals and targets for personalized therapy for HCC. Hepatol Int. 2019;13(2):125–137. doi:10.1007/s12072-018-9919-1
10. Li Y, Zeng X. A novel cuproptosis-related prognostic gene signature and validation of differential expression in hepatocellular carcinoma. Front Pharmacol. 2022;13:1081952. doi:10.3389/fphar.2022.1081952
11. Zhou Y, Li X, Long G, et al. Identification and validation of a tyrosine metabolism-related prognostic prediction model and characterization of the tumor microenvironment infiltration in hepatocellular carcinoma. Front Immunol. 2022;13:994259. doi:10.3389/fimmu.2022.994259
12. Kang C, Jia X, Liu H. Development and validation of a RNA binding protein gene pair-associated prognostic signature for prediction of overall survival in hepatocellular carcinoma. Biomed Eng Online. 2020;19(1):68. doi:10.1186/s12938-020-00812-0
13. Luo Y, Liu F, Han S, et al. Autophagy-related gene Pairs signature for the prognosis of hepatocellular carcinoma. Front Mol Biosci. 2021;8:670241. doi:10.3389/fmolb.2021.670241
14. Sun XY, Yu S-Z, Zhang H-P, et al. A signature of 33 immune-related gene pairs predicts clinical outcome in hepatocellular carcinoma. Cancer Med. 2020;9(8):2868–2878. doi:10.1002/cam4.2921
15. Takagaki Y, MacDonald CC, Shenk T, et al. The human 64-kDa polyadenylylation factor contains a ribonucleoprotein-type RNA binding domain and unusual auxiliary motifs. Proc Natl Acad Sci U S A. 1992;89(4):1403–1407. doi:10.1073/pnas.89.4.1403
16. Monarez RR, MacDonald CC, Dass B. Polyadenylation proteins CstF-64 and τCstF-64 exhibit differential binding affinities for RNA polymers. Biochem J. 2007;401(3):651–658. doi:10.1042/BJ20061097
17. MacDonald CC, Wilusz J, Shenk T. The 64-kilodalton subunit of the CstF polyadenylation factor binds to pre-mRNAs downstream of the cleavage site and influences cleavage site location. Mol Cell Biol. 1994;14(10):6647–6654. doi:10.1128/mcb.14.10.6647-6654.1994
18. Yao C, Biesinger J, Wan J, et al. Transcriptome-wide analyses of CstF64-RNA interactions in global regulation of mRNA alternative polyadenylation. Proc Natl Acad Sci U S A. 2012;109(46):18773–18778. doi:10.1073/pnas.1211101109
19. Chen Z, Hao W, Tang J, et al. CSTF2 promotes hepatocarcinogenesis and hepatocellular carcinoma progression via Aerobic glycolysis. Front Oncol. 2022;12:897804. doi:10.3389/fonc.2022.897804
20. Zhang MH, Liu J. Cleavage stimulation factor 2 promotes malignant progression of liver hepatocellular carcinoma by activating phosphatidylinositol 3’-kinase/protein kinase B/mammalian target of rapamycin pathway. Bioengineered. 2022;13(4):10047–10060. doi:10.1080/21655979.2022.2063100
21. Wang J, Wu M, Lin X, et al. Low-concentration oxygen/ozone treatment attenuated radiculitis and mechanical allodynia via PDE2A-cAMP/cGMP-NF- κ B/p65 signaling in chronic radiculitis rats. Pain Res Manag. 2018;2018:5192814. doi:10.1155/2018/5192814
22. He J, Zhao H, Deng D, et al. Screening of significant biomarkers related with prognosis of liver cancer by lncRNA-associated ceRNAs analysis. J Cell Physiol. 2020;235(3):2464–2477. doi:10.1002/jcp.29151
23. Chen L, Zhou J, Zhao Z, et al. Low Expression of Phosphodiesterase 2 (PDE2A) promotes the progression by regulating mitochondrial morphology and ATP content and predicts poor prognosis in hepatocellular carcinoma. Cells. 2022;12(1). doi:10.3390/cells12010068
24. Zhang W, Wan Y, Zhang Y, et al. CSTF2 acts as a prognostic marker correlated with immune infiltration in hepatocellular carcinoma. Cancer Manag Res. 2022;14:2691–2709. doi:10.2147/CMAR.S359545
25. Zhang S, Liu Z, Wu D, et al. Single-cell RNA-Seq analysis reveals microenvironmental infiltration of plasma cells and hepatocytic prognostic markers in HCC with cirrhosis. Front Oncol. 2020;10:596318. doi:10.3389/fonc.2020.596318
26. Wang D, Bai N, Hu X, et al. Preoperative inflammatory markers of NLR and PLR as indicators of poor prognosis in resectable HCC. PeerJ. 2019;7:e7132. doi:10.7717/peerj.7132
27. Wang Z, Teng D, Li Y, et al. A six-gene-based prognostic signature for hepatocellular carcinoma overall survival prediction. Life Sci. 2018;203:83–91. doi:10.1016/j.lfs.2018.04.025
28. Yang S, Zhou Y, Zhang X, et al. The prognostic value of an autophagy-related lncRNA signature in hepatocellular carcinoma. BMC Bioinform. 2021;22(1):217. doi:10.1186/s12859-021-04123-6
29. Liu Y, Wei X, Zhang X, et al. CT radiomics combined with clinical variables for predicting the overall survival of hepatocellular carcinoma patients after hepatectomy. Transl Oncol. 2022;26:101536. doi:10.1016/j.tranon.2022.101536
30. Job S, Rapoud D, Dos Santos A, et al. Identification of Four Immune Subtypes Characterized by Distinct Composition and Functions of Tumor Microenvironment in Intrahepatic Cholangiocarcinoma. Hepatology. 2020. Vol. 72(3):965–981.
31. Nieman KM, Kenny HA, Penicka CV, et al. Adipocytes promote ovarian cancer metastasis and provide energy for rapid tumor growth. Nat Med. 2011;17(11):1498–1503. doi:10.1038/nm.2492
32. Arneth B. Tumor Microenvironment. Medicina. 2019;56(1):15. doi:10.3390/medicina56010015
33. Pottier C, Wheatherspoon A, Roncarati P, et al. The importance of the tumor microenvironment in the therapeutic management of cancer. Expert Rev Anticancer Ther. 2015;15(8):943–954. doi:10.1586/14737140.2015.1059279
34. Watnick RS. The role of the tumor microenvironment in regulating angiogenesis. Cold Spring Harb Perspect Med. 2012;2(12):a006676. doi:10.1101/cshperspect.a006676
35. Angell H, Galon J. From the immune contexture to the Immunoscore: the role of prognostic and predictive immune markers in cancer. Curr Opin Immunol. 2013;25(2):261–267. doi:10.1016/j.coi.2013.03.004
36. Garnelo M, Tan A, Her Z, et al. Interaction between tumour-infiltrating B cells and T cells controls the progression of hepatocellular carcinoma. Gut. 2017;66(2):342–351. doi:10.1136/gutjnl-2015-310814
37. Zhu LY, Zhou J, Liu Y-Z, et al. 自然杀伤细胞在原发性肝细胞肝癌中的浸润及其与预后的关系 [Prognostic significance of natural killer cell infiltration in hepatocellular carcinoma]. Ai Zheng. 2009;28(11):1198–1202. Chinese. doi:10.5732/cjc.009.10284
38. Fridman WH, Pagès F, Sautès-Fridman C, et al. The immune contexture in human tumours: impact on clinical outcome. Nat Rev Cancer. 2012;12(4):298–306. doi:10.1038/nrc3245
39. Mossanen JC, Kohlhepp M, Wehr A, et al. CXCR6 inhibits hepatocarcinogenesis by promoting natural killer T- and CD4(+) T-cell-dependent control of senescence. Gastroenterology. 2019;156(6):1877–1889 e4. doi:10.1053/j.gastro.2019.01.247
40. Street SE, Trapani JA, MacGregor D, et al. Suppression of lymphoma and epithelial malignancies effected by interferon gamma. J Exp Med. 2002;196(1):129–134. doi:10.1084/jem.20020063
41. Wang L, Wang Y, Song Z, et al. Deficiency of interferon-gamma or its receptor promotes colorectal cancer development. J Interferon Cytokine Res. 2015;35(4):273–280. doi:10.1089/jir.2014.0132
42. Huang R, Li Z, Zhu X, et al. Collagen type III alpha 1 chain regulated by GATA-binding protein 6 affects type II IFN response and propanoate metabolism in the recurrence of lower grade glioma. J Cell Mol Med. 2020;24(18):10803–10815. doi:10.1111/jcmm.15705
43. Abdul-Wahid A, Cydzik M, Prodeus A, et al. Induction of antigen-specific T H 9 immunity accompanied by mast cell activation blocks tumor cell engraftment. Int J Cancer. 2016;139(4):841–853. doi:10.1002/ijc.30121
44. Tu JF, Pan H-Y, Ying X-H, et al. Mast cells comprise the major of interleukin 17-producing cells and predict a poor prognosis in hepatocellular carcinoma. Medicine. 2016;95(13):e3220. doi:10.1097/MD.0000000000003220
45. Yang J, Zhang L, Jiang Z, et al. TCF12 promotes the tumorigenesis and metastasis of hepatocellular carcinoma via upregulation of CXCR4 expression. Theranostics. 2019;9(20):5810–5827. doi:10.7150/thno.34973
46. Fridlender ZG, Sun J, Kim S, et al. Polarization of tumor-associated neutrophil phenotype by TGF-beta: “N1” versus “N2”. TAN Cancer Cell. 2009;16(3):183–194. doi:10.1016/j.ccr.2009.06.017
47. Jiang H, Ning G, Wang Y, et al. Identification of an m6A-related signature as biomarker for hepatocellular carcinoma prognosis and correlates with sorafenib and anti-PD-1 immunotherapy treatment response. Dis Markers. 2021;2021:5576683. doi:10.1155/2021/5576683
48. Jiao X, Shu G, Liu H, et al. The diagnostic value of chemokine/chemokine receptor Pairs in hepatocellular carcinoma and colorectal liver metastasis. J Histochem Cytochem. 2019;67(5):299–308. doi:10.1369/0022155418824274
49. Gong Z, Zhang J, Guo W. Tumor purity as a prognosis and immunotherapy relevant feature in gastric cancer. Cancer Med. 2020;9(23):9052–9063. doi:10.1002/cam4.3505
50. Xiang S, Li J, Shen J, et al. Identification of prognostic genes in the tumor microenvironment of hepatocellular carcinoma. Front Immunol. 2021;12:653836. doi:10.3389/fimmu.2021.653836
51. Lin X, LI H-R, LIN X-F, et al. Silencing of Livin inhibits tumorigenesis and metastasis via VEGF and MMPs pathway in lung cancer. Int J Oncol. 2015;47(2):657–667. doi:10.3892/ijo.2015.3058
52. Wang Z, Wang N, Liu P, et al. AMPK and Cancer. Exp Suppl. 2016;107:203–226. doi:10.1007/978-3-319-43589-3_9
53. Murugan AK. mTOR: role in cancer, metastasis and drug resistance. Semin Cancer Biol. 2019;59:92–111. doi:10.1016/j.semcancer.2019.07.003
54. Smith AJ, Smith LA. Viral Carcinogenesis. Prog Mol Biol Transl Sci. 2016;144:121–168.
55. Apte RS, Chen DS, Ferrara N. VEGF in signaling and disease: beyond discovery and development. Cell. 2019;176(6):1248–1264. doi:10.1016/j.cell.2019.01.021
56. Hua H, Kong Q, Zhang H, et al. Targeting mTOR for cancer therapy. J Hematol Oncol. 2019;12(1):71. doi:10.1186/s13045-019-0754-1
57. Li W, Saud SM, Young MR, et al. Targeting AMPK for cancer prevention and treatment. Oncotarget. 2015;6(10):7365–7378. doi:10.18632/oncotarget.3629
58. Tessema M, Lehmann U, Kreipe H. Cell cycle and no end. Virchows Arch. 2004;444(4):313–323. doi:10.1007/s00428-003-0971-3
59. Zheng K, He Z, Kitazato K, et al. Selective autophagy regulates cell cycle in cancer therapy. Theranostics. 2019;9(1):104–125. doi:10.7150/thno.30308
60. Ingham M, Schwartz GK. Cell-cycle therapeutics come of age. J Clin Oncol. 2017;35(25):2949–2959. doi:10.1200/JCO.2016.69.0032
61. De Mattia E, Cecchin E, Guardascione M, et al. Pharmacogenetics of the systemic treatment in advanced hepatocellular carcinoma. World J Gastroenterol. 2019;25(29):3870–3896. doi:10.3748/wjg.v25.i29.3870
62. Boland P, Wu J. Systemic therapy for hepatocellular carcinoma: beyond sorafenib. Chin Clin Oncol. 2018;7(5):50. doi:10.21037/cco.2018.10.10
 © 2023 The Author(s). This work is published and licensed by Dove Medical Press Limited. The full terms of this license are available at https://www.dovepress.com/terms.php and incorporate the Creative Commons Attribution - Non Commercial (unported, v3.0) License.
By accessing the work you hereby accept the Terms. Non-commercial uses of the work are permitted without any further permission from Dove Medical Press Limited, provided the work is properly attributed. For permission for commercial use of this work, please see paragraphs 4.2 and 5 of our Terms.
© 2023 The Author(s). This work is published and licensed by Dove Medical Press Limited. The full terms of this license are available at https://www.dovepress.com/terms.php and incorporate the Creative Commons Attribution - Non Commercial (unported, v3.0) License.
By accessing the work you hereby accept the Terms. Non-commercial uses of the work are permitted without any further permission from Dove Medical Press Limited, provided the work is properly attributed. For permission for commercial use of this work, please see paragraphs 4.2 and 5 of our Terms.