Back to Journals » Journal of Inflammation Research » Volume 14
A Novel Clinical Radiomics Nomogram to Identify Crohn’s Disease from Intestinal Tuberculosis
Authors Zhu C, Yu Y, Wang S, Wang X, Gao Y, Li C, Li J, Ge Y, Wu X
Received 15 October 2021
Accepted for publication 17 November 2021
Published 3 December 2021 Volume 2021:14 Pages 6511—6521
DOI https://doi.org/10.2147/JIR.S344563
Checked for plagiarism Yes
Review by Single anonymous peer review
Peer reviewer comments 2
Editor who approved publication: Professor Ning Quan
Chao Zhu,1 Yongmei Yu,2 Shihui Wang,2 Xia Wang,1 Yankun Gao,1 Cuiping Li,1 Jianying Li,3 Yaqiong Ge,3 Xingwang Wu1
1Department of Radiology, The First Affiliated Hospital of Anhui Medical University, Hefei, 230022, People’s Republic of China; 2Department of Radiology, The First Affiliated Hospital of Wannan Medical College, Wuhu, 241001, People’s Republic of China; 3GE Healthcare China, Shanghai, 210000, People’s Republic of China
Correspondence: Xingwang Wu
Department of Radiology, The First Affiliated Hospital of Anhui Medical University, No. 218 Jixi Road, Shushan District, Hefei, Anhui Province, 230022, People’s Republic of China
Tel +86 138 56919001
Email [email protected]
Purpose: To establish a clinical radiomics nomogram to differentiate Crohn’s disease (CD) from intestinal tuberculosis (ITB).
Patients and Methods: Ninety-three patients with CD and 67 patients with ITB were recruited (111 in training cohort and 49 in test cohort). The region of interest (ROI) for the lesions in the ileocecal region was delineated on computed tomography enterography and radiomics features extracted. Radiomics features were filtered by the gradient boosting decision tree (GBDT), and a radiomics score was calculated by using the radiomics signature-based formula. We constructed a clinical radiomics model and nomogram combining clinical factors and radiomics score through multivariate logistic regression analysis, and the internal validation was undertaken by ten-fold cross validation. Analyses of receiver operating characteristic (ROC) curves and decision curve analysis (DCA) were used to evaluate the prediction performance. DeLong test was applied to evaluate the performance of the clinical, radiomics and combined model.
Results: The clinical radiomics nomogram, which was based on the 9 radiomics signature and two clinical factors, indicated that the clinical radiomics model had an area under the ROC curve (AUC) value of 0.96 (95% confidence interval [CI]: 0.93– 0.99) in the training cohort and 0.93 (95% CI: 0.86– 1.00) in validation cohort. The clinical radiomics model was superior to the clinical model and radiomics model, and the difference was significant (P = 0.006, 0.004) in the training cohort. DCA confirmed the clinical utility of clinical radiomics nomogram.
Conclusion: CTE-based radiomics model has a good performance in distinguishing CD from ITB. A nomogram constructed by combining radiomics and clinical factors can help clinicians accurately diagnose and select appropriate treatment strategies between CD and ITB.
Keywords: Crohn’s disease, intestinal tuberculosis, computed tomography, radiomics, nomogram
Introduction
In recent years, the incidence of Crohn’s disease (CD) has been increasing in some newly industrialized countries in Asia.1 However, about one-quarter of the world population is infected with tuberculosis bacilli, and 22 countries (including China) have been identified as high-risk countries for tuberculosis by the World Health Organization.2
Intestinal tuberculosis (ITB) and CD have similar manifestations in terms of clinical features, pathology, and endoscopy,3,4 but the treatment of each disease is different: CD is treated mainly with immunosuppressants, hormones, and biologic agents, whereas ITB is treated by antitubercular treatment (ATT). Often, ATT is used diagnostically because of the difficulty in differentiating CD from ITB. CD patients treated with anti-tuberculosis drugs will delay the disease but increase the risk of adverse drug reactions.5 ITB patients treated with hormones or biologic agents will see their economic burden increase and M. tuberculosis infection may be aggravated, or even cause systemic spread.6 Therefore, timely and accurate diagnosis of CD and ITB facilitates rapid selection of effective treatment.
The “gold standard” for the differential diagnosis of CD and ITB is to identify typical caseous necrotizing granulomas, positive acid-fast staining, or a positive M. tuberculosis culture in the lesion, but the prevalence of a positive culture is not high.5 Several studies have combined clinical, imaging, endoscopy, and pathology findings in a comprehensive differential diagnosis of CD and ITB,7–11 and the results showed good diagnostic efficacy. However, endoscopy is contraindicated in cases of severe bowel stenosis and penetration. Computed tomography enterography (CTE) can display the changes in the internal and external structure of the intestine and the corresponding complications.12 However, the CT features of the lesions caused by CD and ITB are similar, and both tend to occur in the ileocecal region. Diagnosing CD and ITB through conventional imaging methods are challenging.
Radiomics can be used to extract high-throughput features from images.13 Radiomics has been applied widely in colorectal cancer,14–17 but it is also being applied gradually to inflammatory bowel disease. For example, radiomics has been used to predict the loss of the secondary response to infliximab in CD,18 to measure intestinal fibrosis in CD,19 and to distinguish CD from ulcerative colitis,20 all of which had good diagnostic efficacy. However, use of radiomics to distinguish CD from ITB has not been undertaken.
We aimed to establish a clinical radiomics nomogram to differentiate Crohn’s disease from ITB for accurate and timely treatment of symptomatic patients.
Patients and Methods
Ethical Approval of the Study Protocol
The study protocol was approved (5,101,246) by the Clinical Medical Research Ethics Committee of the First Affiliated Hospital of Anhui Medical University (Hefei, China). Written informed consent was not required due to the retrospective nature of this study. The personal information of patients was strictly protected. The study was carried out in accordance with the tenets of the Declaration of Helsinki 1964 and its later amendments.
Inclusion and Exclusion Criteria
The inclusion criteria were: (i) patients with CD and ITB had not received ATT, immunosuppressive therapy, hormones, or biologic agents before CTE; (ii) patients without a gastrointestinal malignancy or other serious diseases of the liver or kidney. (iii) CTE images were of sufficient high quality for interpretation.
The exclusion criteria were: (i) unclear diagnosis or no follow-up diagnosis; (ii) CTE images showed no obvious lesions in the ileocecal region.
Patients
We retrospectively collected data on patients diagnosed with CD or ITB from June 2015 to May 2021 at three institutions. After screening of the inclusion and exclusion criteria stated above, 160 patients were included: 93 patients diagnosed with CD and 67 patients with ITB. Clinical data at baseline were sex, age, abdominal pain, diarrhea, fever, weight loss, bloody stools, perianal lesions, C-reactive protein (CRP) level, erythrocyte sedimentation rate (ESR), and T-SPOT® result.
Diagnostic Criteria for CD and ITB
The diagnosis of CD is a comprehensive evaluation based on clinical, endoscopic, and histological characteristics.21,22 Patients undergoing ATT due to confusion between the diagnosis of ITB and CD had to have all of the following characteristics for a final diagnosis of CD: (i) no clinical response to ATT, worsening of ATT symptoms, or symptoms after the improvement phase of ATT; (ii) an alternative diagnosis could not be made; (iii) an appropriate clinical response to subsequent initiation of CD therapy.
Patients diagnosed with ITB had to have corresponding clinical manifestations and include one of the following:23 (i) caseous granuloma based on histology; (ii) positive acid-fast bacilli based on histology; (iii) positivity for M. tuberculosis based on histology; (iv) evidence of confirmed tuberculosis elsewhere; (v) Endoscopic mucosal healing and lasting clinical remission (≥1 year) after treatment completion with no symptomatic recurrence.
CTE
CTE was undertaken using a conventional protocol. All patients underwent standardized preparation of the intestine before examination. Patients fasted for 12 h before CTE, and isotonic solution (1500 mL) was administered in equal doses 45, 30, and 15 min before CTE. A Revolution® CT system (GE Healthcare, Chicago, IL, USA) was used for CTE in the First Affiliated Hospital of Anhui Medical University. An Optima CT680 Series (GE Healthcare) was employed in the High-tech Hospital of the First Affiliated Hospital of Anhui Medical University. A Somatom® Definition Flash CT system (Siemens, Hamburg, Germany) was used in the First Affiliated Hospital of Wannan Medical College. The tube voltage was 100–140 kV, tube current was 150–300 mA, the acquisition matrix was 512 × 512, layer thickness and layer spacing were 5 mm, respectively. Contrast agent (320 mgI/mL) was injected at 1.5 mL/kg bodyweight via peripheral veins at 3.0 mL/s. Similar to other small intestinal radiomics studies,19 We used venous phase CTE images after a delay of 70 seconds to delineate lesions and extract image features.
Imaging Analyses, Segmentation, and Feature Extraction
Two radiologists (with more than 5 years of experience in CT imaging) analyzed the imaging features and selected the region of interest (ROI) for lesions using ITK-SNAP 3.6.0 (www.itksnap.org/). A three-dimensional (3D) ROI was obtained for each lesion (Figure 1). A senior radiologist (20 years of experience in CT imaging) reviewed the imaging features and the ROI selections for lesions, and the three physicians were unaware of the confirmed results.
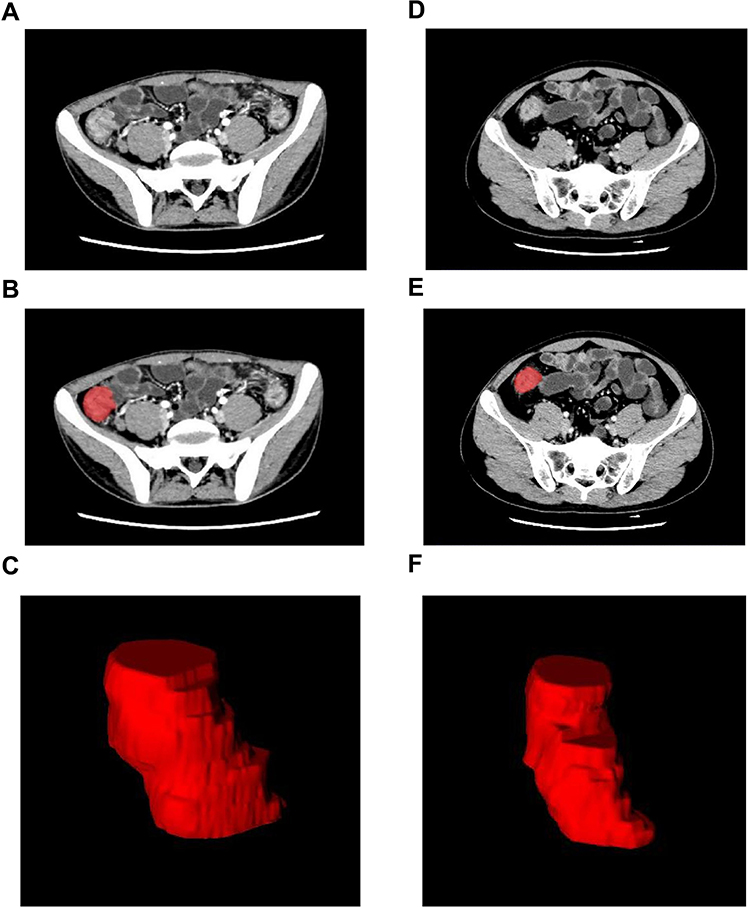 |
Figure 1 Three-dimensional segmentation of the CD and ITB. (A and D) CD and ITB venous ileocecal lesions. (B and E) Layer by layer delineation of lesions. (C and F) 3D ROI of ileocecal lesions. |
In order to ensure the consistency of the ROI selections for lesions and avoid bias, we selected the lesions in the ileocecal region, including the terminal ileum, the cecum and the cecum-ascending colon junction. We excluded CTE images with non-significant lesions in the ileocecal region. The range of ROI included the intestinal wall of the lesions, but did not include the lumen. The inter-class and intra-class correlation coefficients (ICCs) were employed to evaluate the consistency and repeatability of the results delineated. We randomly selected images from 30 patients. The ROI selections was performed by reader 1 and reader 2. Reader 1 then repeated the same procedure 2 weeks later. There is a good agreement of the feature extraction when the ICCs is greater than 0.75. The ROI selections of the remaining images was performed by reader 1.
To eliminate the influence of data from different sources on radiomics results, all images underwent resampling (to a voxel size of 1 × 1×1 mm) and image normalization before extraction of radiomics features. The image data is normalized using z-score in the following form: z= (x-μ)/σ (x: sample value; μ: population mean; σ: population standard deviation). PHIgo Workstation 1.1.0 (GE Healthcare) was used for feature extraction.
The imaging features of CD and ITB were analyzed, including small-intestine segmental lesions (SISLs), focal ileocecal lesions, the “comb” sign, the “target” sign, sinus-tract abscesses, intestinal obstruction, intestinal strictures, and lymphadenopathy.
Selection of Clinical Factors and Establishment of the Clinical Model
Clinical factors including clinical baseline data and CT imaging features for CD and ITB are listed in Table 1. After univariate analysis, the clinical factors between CD and ITB with P < 0.1 were introduced into multivariate logistic regression analysis, and multicollinearity was evaluated based on the variance inflation factor (VIF) and features with VIF >10 was removed when constructing the regression model. Those with P < 0.05 were identified as independent predictors from which the clinical-factors prediction model was established.
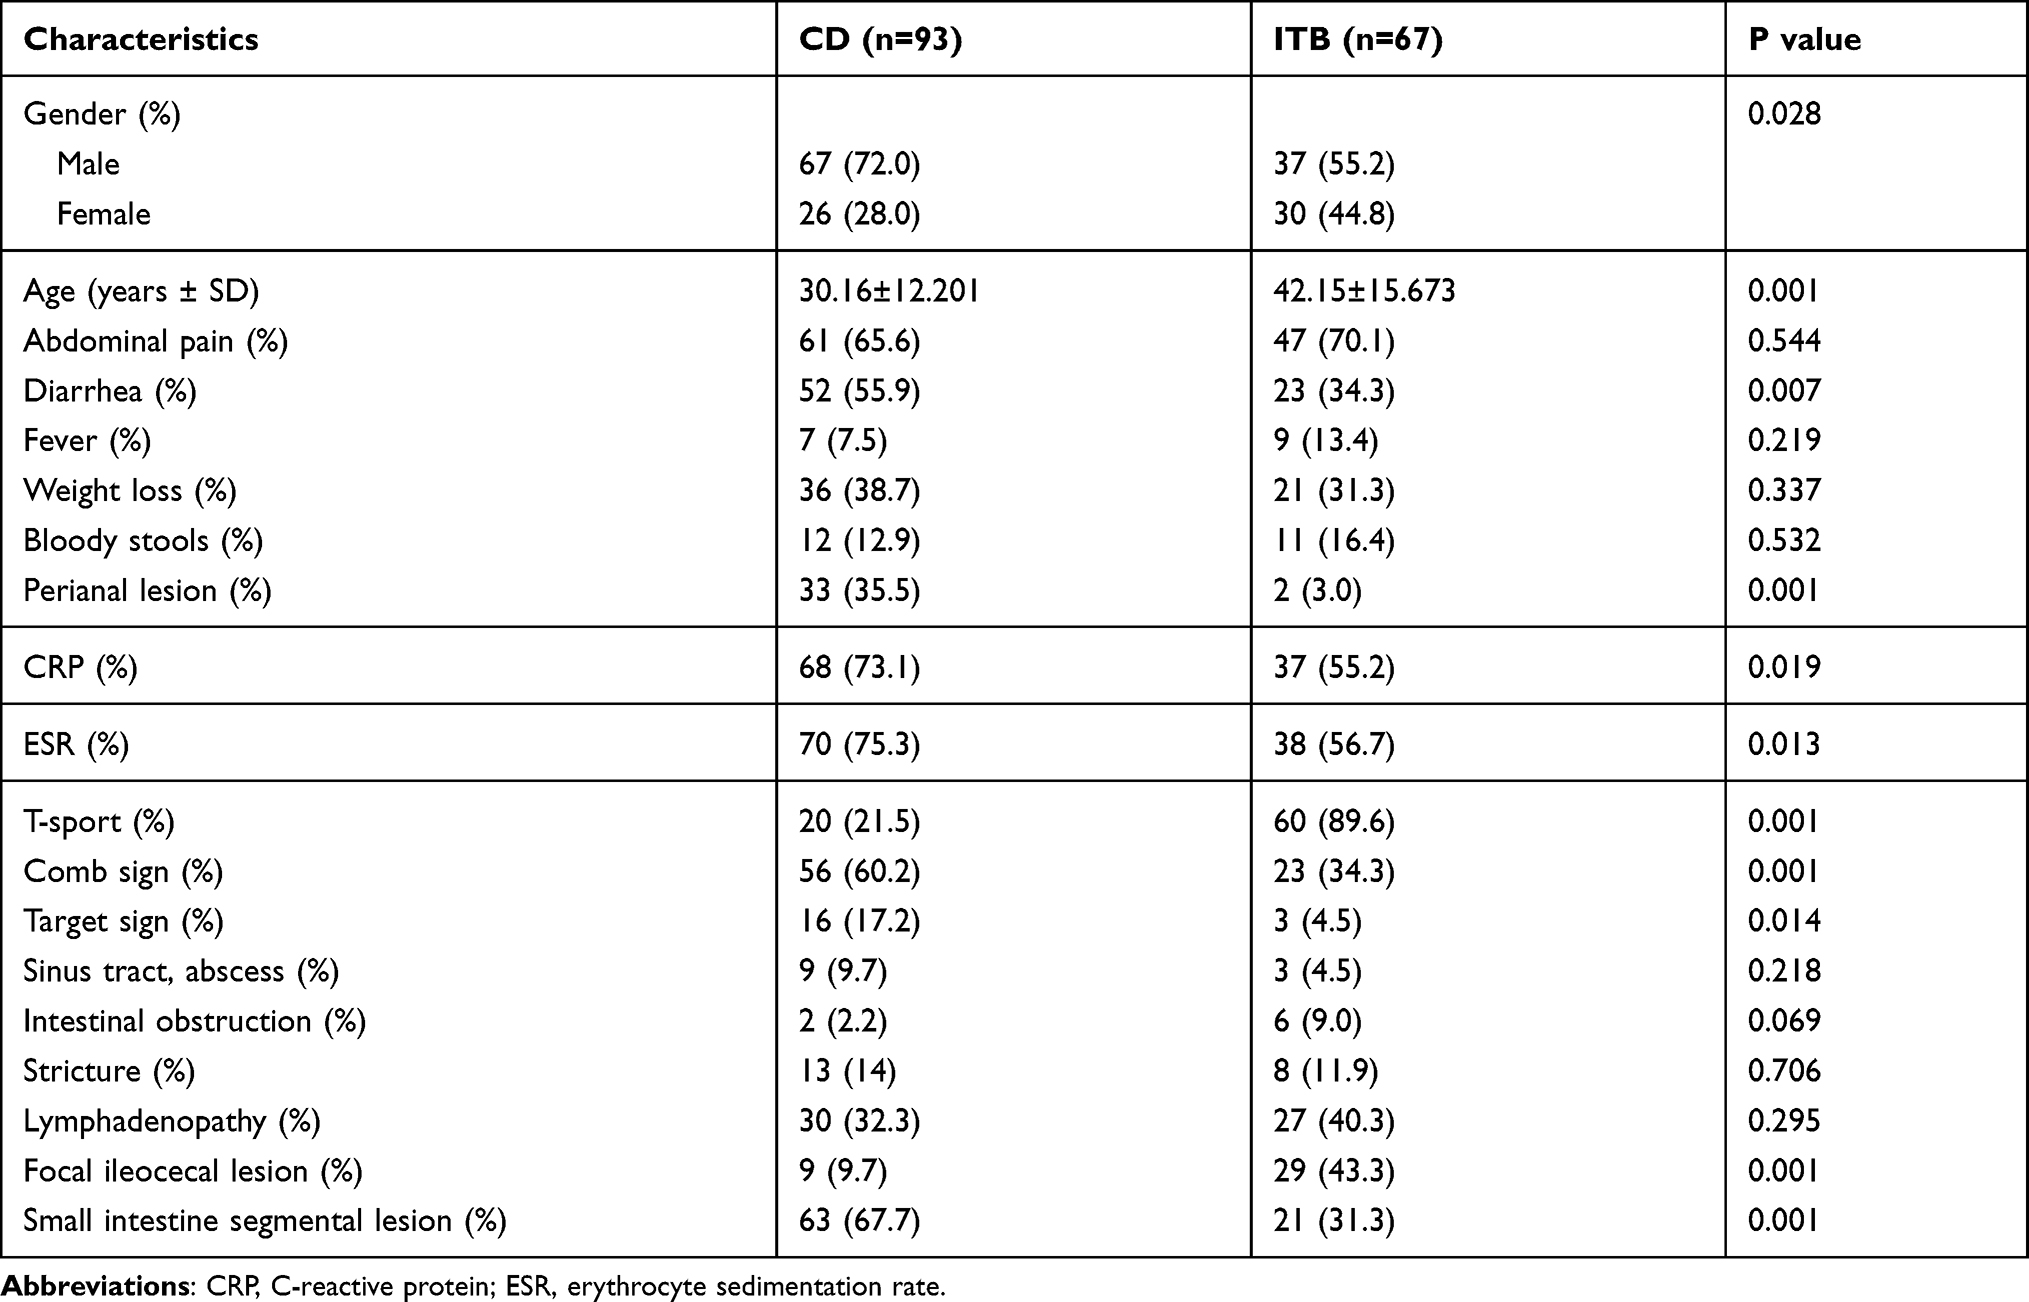 |
Table 1 Clinical Features of Patients with Crohn’s Disease and Intestinal Tuberculosis |
Data Preprocessing, Feature Selection, and Establishment of the Radiomics Model
IPMs 2.4.0 (GE Healthcare) was employed for data preprocessing and feature selection. The dataset was assigned randomly to the training cohort or test cohort at a ratio of 7:3. All cases in the training cohort were used to train the prediction model. All cases in the test cohort were used to evaluate the performance of the model independently.
Variables with zero variance were excluded before the analysis and replaced with the median-fill method. Finally, z-score was adopted to standardize the data.
First, features with ICCs >0.75 were retained, and the univariate logistic analysis was used to filter features with p<0.05. Then, a Gradient Boosting Decision Tree24 and multivariate logistic analysis were used to filter the most useful features furtherly. Independent risk predict factors (p<0.05) were retained. Finally, a radiomics score was calculated by using the radiomics signature–based formula.
Radiomics score was used to establish a radiomics prediction model by multivariate logistic regression.
Establishment of a Clinical Radiomics Model and Nomogram
The two clinical factors selected in the clinical model were combined with the radiomics score in the radiomics model to establish the clinical radiomics model through multivariate logistic regression analysis. Internal verification was carried out through tenfold cross-validation. Analyses of receiver operating characteristic (ROC) curves and decision curve analysis (DCA) were used to evaluate the prediction performance of the training cohort and test cohort. The DeLong test was employed to compare the diagnostic performance of the clinical model, radiomics model, and clinical radiomics model.
Finally, the two selected clinical factors and radiomics score were combined to construct the clinical radiomics nomogram by multivariate logistic regression analysis.
Statistical Analyses
Statistical analyses were conducted using SPSS 25.0 (IBM, Armonk, NY, USA) or R 3.5.1. (R Institute for Statistical Computing, Vienna, Austria). Continuous variables are expressed as the mean ± standard deviation. Categorical variables are expressed as numbers or percentages. Categorical variables were compared with nonparametric tests. The Student’s t- test or Mann–Whitney U-test was used to compare continuous variables. P < 0.05 (two-tailed) indicated significance.
Results
Clinical Factors and Establishment of the Clinical Model
After screening, 160 eligible patients with CD or ITB were included: 93 patients with CD and 67 patients with ITB (Figure 2). The clinical factors included for all patients are shown in Table 1. Two independent predictors were screened out by univariate and multivariate logistic regression analysis in training cohort, with significant differences between CD and ITB (P < 0.05). These two predictors were T-SPOT result (odds ratio (OR) = 0.012, 95% confidence interval (CI) = 0.002–0.063, P < 0.001), and SISL (OR = 15.680, 95% CI = 3.305–74.399, P = 0.001).
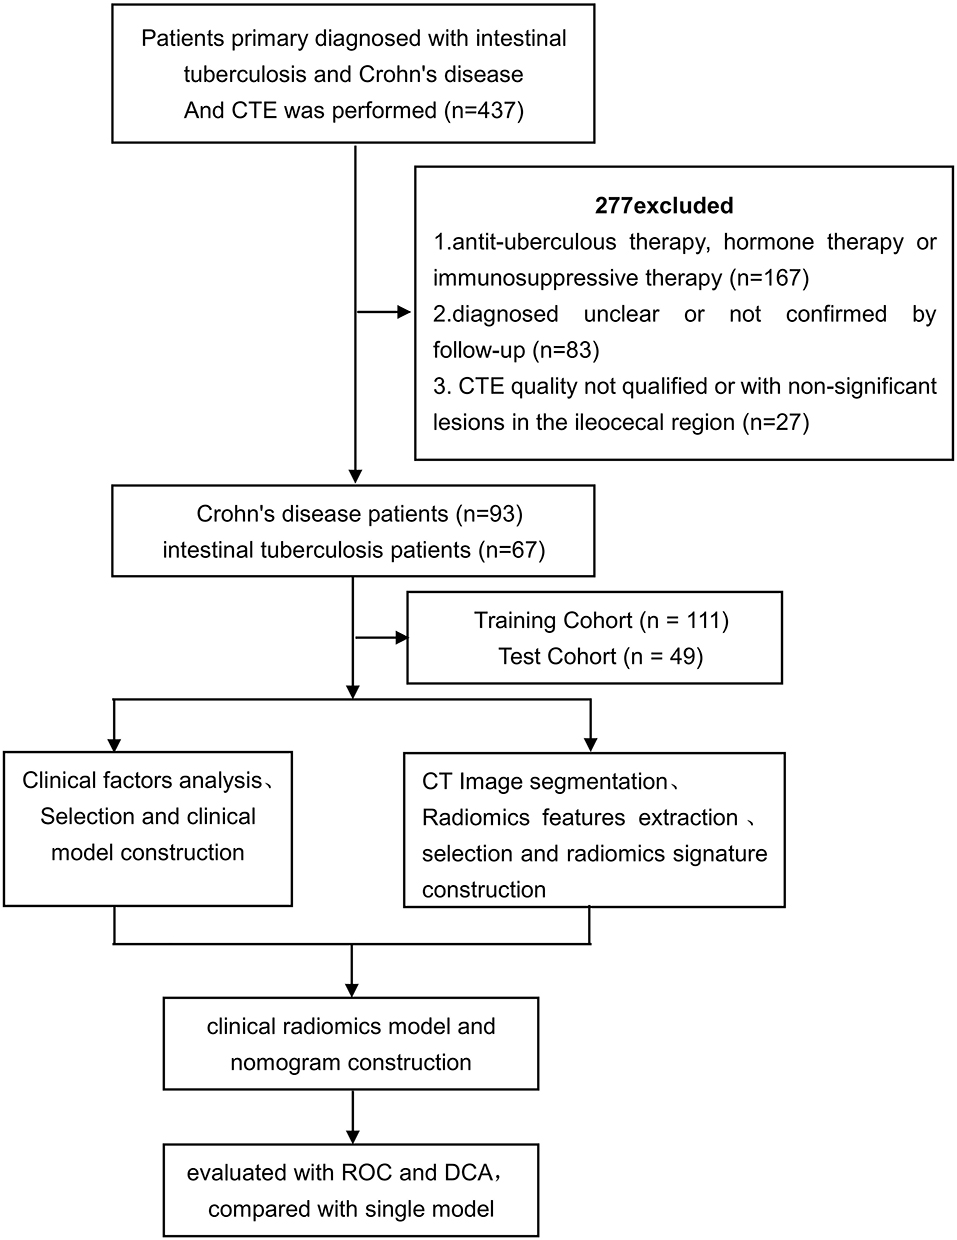 |
Figure 2 The flow diagram of study. |
Constructed Radiomics Model
A total of 1595 features were obtained from each ROI. Nine features were obtained through feature filtering (Table 2). The formula given below provides specific feature names.
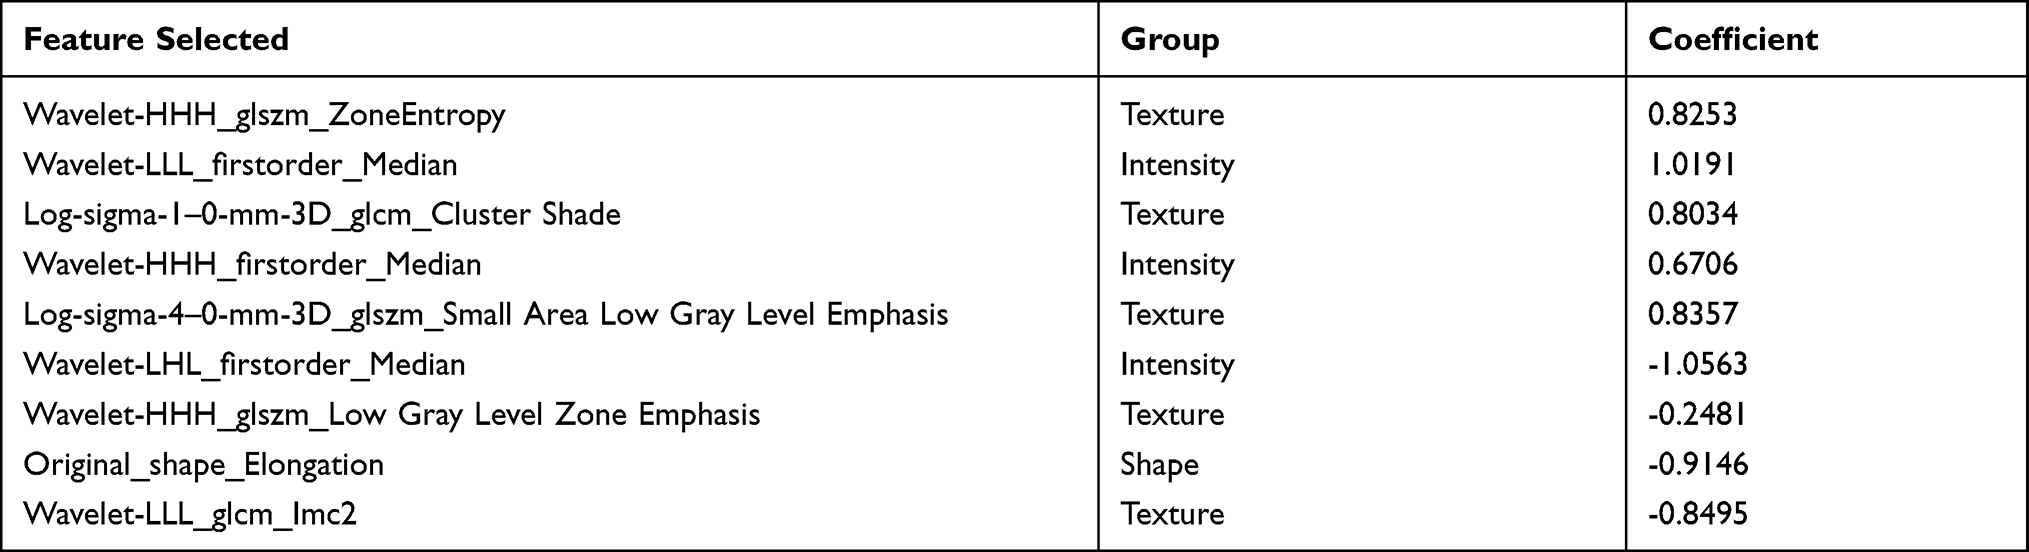 |
Table 2 Radiomic Features Selection from the CTE in the Training Cohort |
The radiomics score for each patient was calculated using the following formula:
Radiomics score = 0.3734 + (0.8253×wavelet-HHH_glszm_ZoneEntropy) + (1.0191×wavelet-LLL_firstorder_Median) + (0.8034×log-sigma-1-0-mm-3D_glcm_Cluster Shade) + (0.6706×wavelet-HHH_firstorder_Median) + (0.8357×log-sigma-4-0-mm-3D_glszm_Small Area Low Gray Level Emphasis) − (1.0563×wavelet-LHL_firstorder_Median) − (0.2481×wavelet-HHH_glszm_Low Gray Level Zone Emphasis) − (0.9146×original_shape_Elongation) − (0.8495×wavelet-LLL_glcm_Imc2)
There was a significant difference in the radiomics score between CD and ITB in both training cohort (OR = 2.719, 95% CI = 1.852–3.991, P < 0.001) and validation cohort (OR = 2.236, 95% CI = 1.421–3.518, P = 0.001).
Assessment of the Performance of the Established Model
An ROC curve was used to analyze and evaluate the performance of the clinical model, the radiomics model, and the clinical radiomics model of the training cohort and validation cohort (Table 3). The ROC curve indicated that the clinical radiomics model had good performance and applicability with an area under the ROC curve (AUC) value of 0.96 (95% CI: 0.93–0.99) in the training cohort and 0.93 (95% CI: 0.86–1.00) in validation cohort. The AUC curves and DCA of the three models in the training cohort and validation cohort are shown in Figures 3 and 4, respectively. The DeLong test was used to compare the three models. In the training cohort, the clinical radiomics model was superior to the clinical model and radiomics model, and the difference was significant (P = 0.006, 0.004). In the validation cohort, the clinical radiomics model was no significant difference between the clinical model and radiomics model (P = 0.056, 0.056). No significant difference in AUC values was found between the radiomics model and the clinical model in the training cohort (p = 0.66) and in validation cohort (p = 0.38). DCA demonstrated the value of the clinical radiomics model.
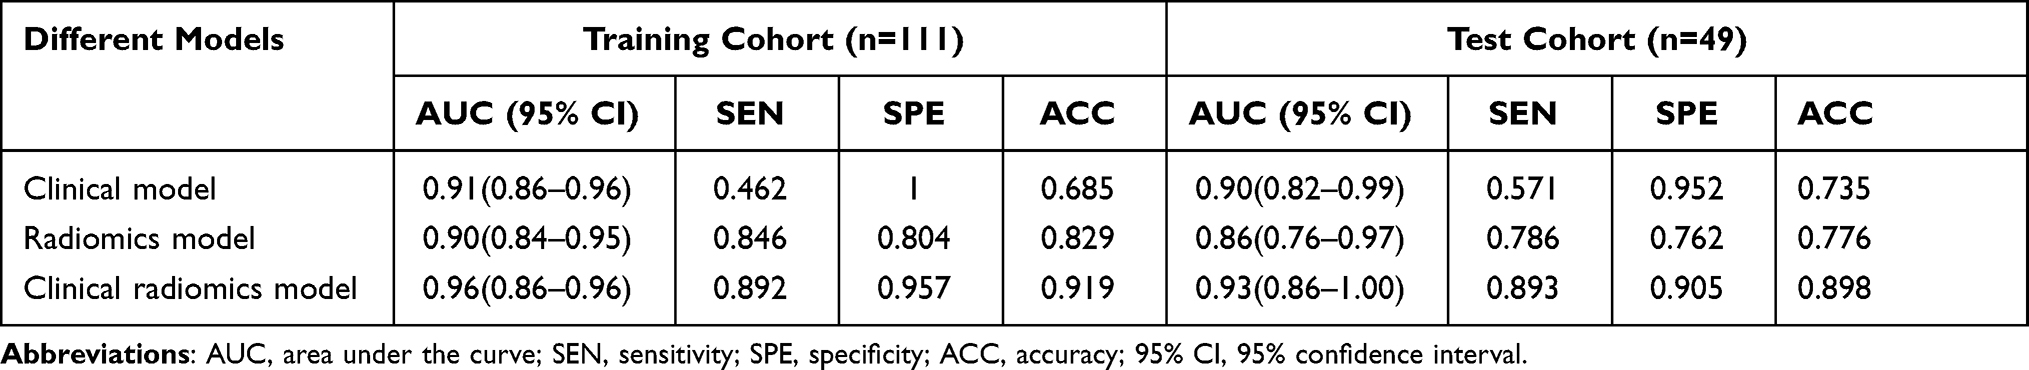 |
Table 3 Performance of the Clinical Model, Radiomics Model, and Clinical Model in the Training Cohort and Test Cohort |
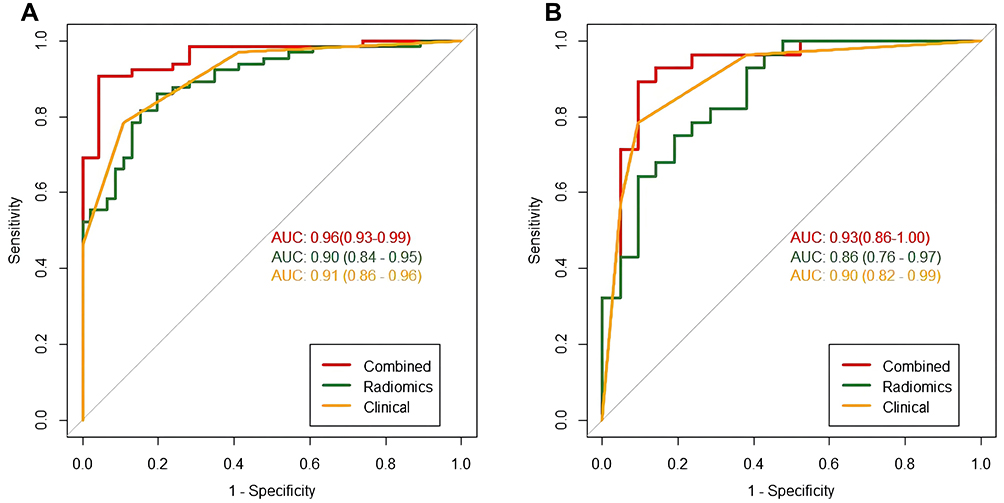 |
Figure 3 The ROC curves of the three models. (A) Three models ROC curves in the training cohort. (B) Three models ROC curves in the validation cohort. |
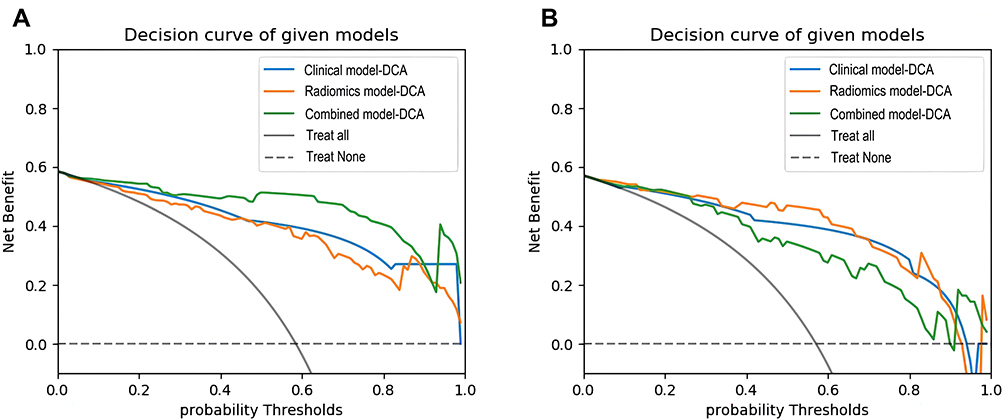 |
Figure 4 The decision curve analysis for three models. (A) Three models DCA in the training cohort. (B) Three models DCA curves in the validation cohort. |
Constructed Clinical Radiomics Nomogram
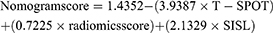
The clinical radiomics nomogram was constructed by multivariate logistic regression analysis using T-SPOT data, SISL and radiomics score (Figure 5).
 |
Figure 5 The clinical radiomics nomogram. |
The nomogram score for each patient was calculated using the following formula:
Discussion
We applied radiomics to inflammatory lesions of the intestinal tract in a noninvasive manner to differentiate CD from ITB. To improve the predictive performance, we combined the radiomics model with the clinical factors model, and showed good predictive performance in the training cohort and test cohort. The value of clinical application was confirmed by the clinical radiomics nomogram and DCA.
CD is a granulomatous inflammatory disease of the intestinal tract. It is caused by the combined effects of genetic factors, intestinal flora, intestinal immune disorders, and other factors.25 The morbidity of CD is characterized by repeated attacks and progressive aggravation, with many complications, such as intestinal stenosis, abscesses, fistulae, and perianal lesions.26 Intestinal tuberculosis is a chronic intestinal inflammation caused by the entry of Mycobacterium tuberculosis into the intestine.27 ITB can lead to complications such as intestinal obstruction and tuberculous peritonitis. ITB can be cured if diagnosed early and treated appropriately. Scholars from South Korea28 found that the number of patients with ITB misdiagnosed as CD was increasing (OR = 1.06, 95% CI: 1.01–1.11, P = 0.013), and that 20.5% of patients in the ITB group received hormone and immunosuppressive therapy due to misdiagnosis as CD. Scholars have found29 that use of ATT for people diagnosed with CD is harmful in the long-term, and can lead to the formation of pathological bowel stenoses. Therefore, distinguishing CD from ITB in a timely and accurate manner is extremely important.
Studies2,30,31 have used proteomic profiling of serum, interleukin-22 receptor-α1, and the gut microbiota to identify CD and ITB. Patel et al32 showed that tuberculosis polymerase chain reaction (PCR) and BACTEC culture had the great performance in diagnosis of ITB. It is reported that PCR was also significantly higher than histopathology in detecting TB fistulas.33 However, using a single indicator to distinguish between the two diseases is not comprehensive. Jung et al27 integrated seven clinical indicators and achieved 98% sensitivity and 92.4% specificity in the validation dataset for the differential diagnosis between CD and ITB. In a 6-year multicenter prospective study, researchers in China8 used clinical findings, laboratory results, endoscopy results, CTE features, and histology to derive diagnostic models and a nomogram. They showed that the specificity, sensitivity, and accuracy of differentiating CD from ITB was 100%, 84.2%, and 87.8%, respectively. Endoscopy is an invasive examination that can reveal changes in the intestinal lumen but cannot observe lesions in the entire intestinal wall or outside the intestinal lumen. A biopsy of lesions is subjective. For stenoses or penetrating lesions, endoscopy is also inaccessible.
Considering that endoscopy and pathology are invasive and identification of the two diseases is limited,34 endoscopy and pathology data were not included in our study. In the univariate analysis of clinical features, young patients, diarrhea, perianal lesions, comb sign, target sign, SISL, increased ESR, and increased CRP level were more common in patients with CD. T-SPOT-positivity and focal ileocecal lesion were more common in ITB patients. Our data had similarities with findings from previous studies.27,35,36 In multivariate logistic analysis, among clinical factors, T-SPOT data and SISLs could be used as independent predictors to differentiate CD from ITB, which is consistent with the work of He et al.8 The clinical radiomics nomogram, which was based on the 9 radiomics signature and two clinical factors, indicated that the clinical radiomics model had good efficacy and applicability with an AUC value of 0.96 (95% CI: 0.93–0.99) in the training cohort and 0.93 (95% CI: 0.86–1.00) in validation cohort.
In the training cohort of CD and ITB cases, the clinical radiomics model was superior to the clinical model and radiomics model. This observation indicated that inclusion of clinical factors into the radiomics model could improve the prediction performance for CD and ITB. In the validation cohort, although the clinical radiomics model was no significant difference between the clinical model and radiomics model, but the specificity of clinical model was low. The sensitivity, specificity, and accuracy of the clinical radiomics model were 0.893, 0.905, and 0.898, respectively, which were higher than those of the clinical model and radiomics model, respectively. No significant difference in AUC values was found between the radiomics model and the clinical model in the training cohort and in validation cohort, but the sensitivity and accuracy of clinical model were low than radiomics model. The prediction performance of the radiomics model was more balanced than that of the clinical model. DCA showed that the clinical radiomics model had more net benefits than those of the radiomics model and clinical model. Therefore, application of the novel nomogram was an intuitive and efficacious method to assist radiologists and gastroenterologists in differentiating CD from ITB.
Our study had three main limitations. First, we employed 3D segmentation technology in the ileocecal region, and excluded CTE images with non-significant lesions in the ileocecal region. Segmentation of all lesions requires more complex operation and time than those of ileocecal region segmentation. Further research focusing on the differences between the performance of ileocecal region and all lesions is required. Automatic segmentation of lesions using artificial intelligence is expected to solve this problem in the future. Second, this was a retrospective study which needs to be verified in prospective studies. Third, the sample size was small, so further research with more patients is required.
Conclusions
We developed a new clinical radiomics model combining clinical factors and radiomics features that can distinguish CD from ITB intuitively, noninvasively, and accurately. Our model could provide more accurate auxiliary diagnostic information for clinically precise treatment.
Acknowledgments
We would like to thank the editorial for English language editing and the participants who contributed to our study.
Author Contributions
All authors contributed to data analysis, drafting or revising the article, have agreed on the journal to which the article will be submitted, gave final approval of the version to be published, and agree to be accountable for all aspects of the work.
Funding
This research received no external funding.
Disclosure
Dr Jianying Li is an Employee of GE Healthcare, the manufacturer of the CT scanner used in this study. The authors report no conflicts of interest in this work.
References
1. Ng SC, Shi HY, Hamidi N, et al. Worldwide incidence and prevalence of inflammatory bowel disease in the 21st century: a systematic review of population-based studies. Lancet. 2017;390(10114):2769–2778. doi:10.1016/s0140-6736(17)32448-0
2. He C, Wang H, Yu C, et al. Alterations of gut microbiota in patients with intestinal tuberculosis that different from Crohn’s disease. Front Bioeng Biotechnol. 2021;9:673691. doi:10.3389/fbioe.2021.673691
3. Zhao Y, Xu M, Chen L, Liu Z, Sun X. Levels of TB-IGRA may help to differentiate between intestinal tuberculosis and Crohn’s disease in patients with positive results. Therap Adv Gastroenterol. 2020;13:1756284820922003. doi:10.1177/1756284820922003
4. Holt DQ, Moore GT, Strauss BJ, Hamilton AL, De Cruz P, Kamm MA. Visceral adiposity predicts post-operative Crohn’s disease recurrence. Aliment Pharmacol Ther. 2017;45(9):1255–1264. doi:10.1111/apt.14018
5. Pratap Mouli V, Munot K, Ananthakrishnan A, et al. Endoscopic and clinical responses to anti-tubercular therapy can differentiate intestinal tuberculosis from Crohn’s disease. Aliment Pharmacol Ther. 2017;45(1):27–36. doi:10.1111/apt.13840
6. Lorenzetti R, Zullo A, Ridola L, et al. Higher risk of tuberculosis reactivation when anti-TNF is combined with immunosuppressive agents: a systematic review of randomized controlled trials. Ann Med. 2014;46(7):547–554. doi:10.3109/07853890.2014.941919
7. Mao R, Liao WD, He Y, et al. Computed tomographic enterography adds value to colonoscopy in differentiating Crohn’s disease from intestinal tuberculosis: a potential diagnostic algorithm. Endoscopy. 2015;47(4):322–329. doi:10.1055/s-0034-1391230
8. He Y, Zhu Z, Chen Y, et al. Development and validation of a novel diagnostic nomogram to differentiate between intestinal tuberculosis and Crohn’s disease: a 6-year Prospective Multicenter Study. Am J Gastroenterol. 2019;114(3):490–499. doi:10.14309/ajg.0000000000000064
9. Huang X, Liao WD, Yu C, et al. Differences in clinical features of Crohn’s disease and intestinal tuberculosis. World J Gastroenterol. 2015;21(12):3650–3656. doi:10.3748/wjg.v21.i12.3650
10. Zhao XS, Wang ZT, Wu ZY, et al. Differentiation of Crohn’s disease from intestinal tuberculosis by clinical and CT enterographic models. Inflamm Bowel Dis. 2014;20(5):916–925. doi:10.1097/mib.0000000000000025
11. Larsson G, Shenoy T, Ramasubramanian R, et al. Routine diagnosis of intestinal tuberculosis and Crohn’s disease in Southern India. World J Gastroenterol. 2014;20(17):5017–5024. doi:10.3748/wjg.v20.i17.5017
12. Mao R, Gao X, Zhu ZH, et al. CT enterography in evaluating postoperative recurrence of Crohn’s disease after ileocolic resection: complementary role to endoscopy. Inflamm Bowel Dis. 2013;19(5):977–982. doi:10.1097/MIB.0b013e318280758c
13. Gillies RJ, Kinahan PE, Hricak H. Radiomics: images are more than pictures, they are data. Radiology. 2016;278(2):563–577. doi:10.1148/radiol.2015151169
14. Horvat N, Veeraraghavan H, Khan M, et al. MR imaging of rectal cancer: radiomics analysis to assess treatment response after neoadjuvant therapy. Radiology. 2018;287(3):833–843. doi:10.1148/radiol.2018172300
15. Zhang Y, He K, Guo Y, et al. A novel multimodal radiomics model for preoperative prediction of lymphovascular invasion in rectal cancer. Front Oncol. 2020;10:457. doi:10.3389/fonc.2020.00457
16. Huang YQ, Liang CH, He L, et al. Development and validation of a radiomics nomogram for preoperative prediction of lymph node metastasis in colorectal cancer. J Clin Oncol. 2016;34(18):2157–2164. doi:10.1200/jco.2015.65.9128
17. Liu Z, Zhang XY, Shi YJ, et al. Radiomics analysis for evaluation of pathological complete response to neoadjuvant chemoradiotherapy in locally advanced rectal cancer. Clin Cancer Res. 2017;23(23):7253–7262. doi:10.1158/1078-0432.Ccr-17-1038
18. Chen Y, Li H, Feng J, Suo S, Feng Q, Shen J. A novel radiomics nomogram for the prediction of secondary loss of response to infliximab in Crohn’s disease. J Inflamm Res. 2021;14:2731–2740. doi:10.2147/jir.S314912
19. Li X, Liang D, Meng J, et al. Development and validation of a novel computed-tomography enterography radiomic approach for characterization of intestinal fibrosis in Crohn’s disease. Gastroenterology. 2021. doi:10.1053/j.gastro.2021.02.027
20. Li H, Mo Y, Huang C, et al. An MSCT-based radiomics nomogram combined with clinical factors can identify Crohn’s disease and ulcerative colitis. Ann Transl Med. 2021;9(7):572. doi:10.21037/atm-21-1023
21. Caprilli R, Gassull MA, Escher JC, et al. European evidence based consensus on the diagnosis and management of Crohn’s disease: special situations. Gut. 2006;55 Suppl 1(Suppl1):i36–i58. doi:10.1136/gut.2005.081950c
22. Dignass A, Van Assche G, Lindsay JO, et al. The second European evidence-based consensus on the diagnosis and management of Crohn’s disease: current management. J Crohns Colitis. 2010;4(1):28–62. doi:10.1016/j.crohns.2009.12.002
23. Logan VS. Anorectal tuberculosis. Proc R Soc Med. 1969;62(12):1227–1230.
24. Li T, Yang K, Stein JD, Nallasamy N. Gradient boosting decision tree algorithm for the prediction of postoperative intraocular lens position in cataract surgery. Transl Vis Sci Technol. 2020;9(13):38. doi:10.1167/tvst.9.13.38
25. Torres J, Mehandru S, Colombel JF, Peyrin-Biroulet L. Crohn’s disease. Lancet. 2017;389(10080):1741–1755. doi:10.1016/s0140-6736(16)31711-1
26. Veauthier B, Hornecker JR. Crohn’s disease: diagnosis and management. Am Fam Physician. 2018;98(11):661–669.
27. Jung Y, Hwangbo Y, Yoon SM, et al. Predictive factors for differentiating between Crohn’s disease and intestinal tuberculosis in Koreans. Am J Gastroenterol. 2016;111(8):1156–1164. doi:10.1038/ajg.2016.212
28. Seo H, Lee S, So H, et al. Temporal trends in the misdiagnosis rates between Crohn’s disease and intestinal tuberculosis. World J Gastroenterol. 2017;23(34):6306–6314. doi:10.3748/wjg.v23.i34.6306
29. Gupta A, Pratap Mouli V, Mohta S, et al. Antitubercular therapy given to differentiate Crohn’s disease from intestinal tuberculosis predisposes to stricture formation. J Crohns Colitis. 2020;14(11):1611–1618. doi:10.1093/ecco-jcc/jjaa091
30. Yu ZQ, Wang WF, Dai YC, Chen XC, Chen JY. Interleukin-22 receptor 1 is expressed in multinucleated giant cells: a study on intestinal tuberculosis and Crohn’s disease. World J Gastroenterol. 2019;25(20):2473–2488. doi:10.3748/wjg.v25.i20.2473
31. Zhang F, Xu C, Ning L, et al. Exploration of serum proteomic profiling and diagnostic model that differentiate Crohn’s disease and intestinal tuberculosis. PLoS One. 2016;11(12):e0167109. doi:10.1371/journal.pone.0167109
32. Patel B, Yagnik VD. Clinical and laboratory features of intestinal tuberculosis. Clin Exp Gastroenterol. 2018;11:97-103. doi:10.2147/ceg.S154235
33. Garg P, Goyal A, Yagnik VD, Dawka S, Menon GR. Diagnosis of anorectal tuberculosis by polymerase chain reaction, GeneXpert and histopathology in 1336 samples in 776 anal fistula patients. World J Gastrointest Surg. 2021;13(4):355–365. doi:10.4240/wjgs.v13.i4.355
34. Pulimood AB, Peter S, Ramakrishna B, et al. Segmental colonoscopic biopsies in the differentiation of ileocolic tuberculosis from Crohn’s disease. J Gastroenterol Hepatol. 2005;20(5):688–696. doi:10.1111/j.1440-1746.2005.03814.x
35. Li X, Liu X, Zou Y, et al. Predictors of clinical and endoscopic findings in differentiating Crohn’s disease from intestinal tuberculosis. Dig Dis Sci. 2011;56(1):188–196. doi:10.1007/s10620-010-1231-4
36. Makharia GK, Srivastava S, Das P, et al. Clinical, endoscopic, and histological differentiations between Crohn’s disease and intestinal tuberculosis. Am J Gastroenterol. 2010;105(3):642–651. doi:10.1038/ajg.2009.585
 © 2021 The Author(s). This work is published and licensed by Dove Medical Press Limited. The
full terms of this license are available at https://www.dovepress.com/terms
and incorporate the Creative Commons Attribution
- Non Commercial (unported, 3.0) License.
By accessing the work you hereby accept the Terms. Non-commercial uses of the work are permitted
without any further permission from Dove Medical Press Limited, provided the work is properly
attributed. For permission for commercial use of this work, please see paragraphs 4.2 and 5 of our Terms.
© 2021 The Author(s). This work is published and licensed by Dove Medical Press Limited. The
full terms of this license are available at https://www.dovepress.com/terms
and incorporate the Creative Commons Attribution
- Non Commercial (unported, 3.0) License.
By accessing the work you hereby accept the Terms. Non-commercial uses of the work are permitted
without any further permission from Dove Medical Press Limited, provided the work is properly
attributed. For permission for commercial use of this work, please see paragraphs 4.2 and 5 of our Terms.