")
Back to Journals » International Journal of General Medicine » Volume 14
A Novel Autophagy-Related Long Non-Coding RNA Signature to Predict Prognosis and Therapeutic Response in Esophageal Squamous Cell Carcinoma
Authors Shi X , Liu X , Pan S, Ke Y, Li Y, Guo W, Wang Y, Ruan Q, Zhang X, Ma H
Received 16 August 2021
Accepted for publication 6 October 2021
Published 16 November 2021 Volume 2021:14 Pages 8325—8339
DOI https://doi.org/10.2147/IJGM.S333697
Checked for plagiarism Yes
Review by Single anonymous peer review
Peer reviewer comments 2
Editor who approved publication: Dr Scott Fraser
Xiaobo Shi,1 Xiaoxiao Liu,1 Shupei Pan,1 Yue Ke,1 Yuxing Li,1 Wei Guo,1 Yuchen Wang,1 Qinli Ruan,1 Xiaozhi Zhang,2 Hongbing Ma1
1Department of Radiation Oncology, The Second Affiliated Hospital of Xi’an Jiaotong University, Xi’an, People’s Republic of China; 2Department of Radiation Oncology, The First Affiliated Hospital of Xi’an Jiaotong University, Xi’an, People’s Republic of China
Correspondence: Hongbing Ma
Department of Radiation Oncology, The Second Affiliated Hospital of Xi’an Jiaotong University, No. 157, Xi Wu Road, Xi’an, 710004, Shaanxi, People’s Republic of China
Tel +86 13991845066
Email [email protected]
Background: Considering the significance of autophagy and long non-coding RNAs (lncRNAs) in the biology of esophageal squamous cell carcinoma (ESCC), the present study aimed to identify a new autophagy-related lncRNA signature to forecast the clinical outcomes of ESCC patients and to guide individualized treatment.
Methods: The expression profiles were obtained from Gene Expression Omnibus (GEO) and The Cancer Genome Atlas (TCGA) database. We extracted autophagy-related genes from the Human Autophagy Database and identified autophagy-related lncRNAs through Spearman correlation analysis. Univariate, least absolute shrinkage and selection operator and multivariate Cox regression analyses were performed on GSE53625 to construct an autophagy-related lncRNAs prognostic signature. The model was subjected to bootstrap internal validation, and the expression levels of lncRNAs were verified by TCGA database. The potential molecular mechanism of the model was explored by gene set enrichment analysis (GSEA). Spearman correlation coefficient examined the correlation between risk score and ferroptosis-associated genes as well as the response to immunotherapy and chemotherapy.
Results: We identified and validated an autophagy-related lncRNAs prognostic signature in 179 patients with ESCC. The prognosis of patients in the low-risk group was significantly better than that in the high-risk group (p-value < 0.001). The reliability of the model was verified by Brier score and ROC. GSEA results showed significant enrichment of cancer- and autophagy-related signaling pathways in the high-risk group and metabolism-related pathways in the low-risk group. Correlation analysis indicated that the model can effectively forecast the effect of immunotherapy and chemotherapy. About 35.41% (74/209) ferroptosis-related genes were significantly correlated with risk scores.
Conclusion: In brief, we constructed a novel autophagy-related lncRNAs signature (LINC02024, LINC01711, LINC01419, LCAL1, FENDRR, ADAMTS9-AS1, AC025244.1, AC015908.6 and AC011997.1), which could improve the prediction of clinical outcomes and guide individualized treatment of ESCC patients.
Keywords: autophagy, esophageal squamous cell carcinoma, lncRNA, prognosis, therapeutic response
Introduction
Esophageal carcinoma is the most common malignant tumor of the digestive system, which includes two principal pathological subtypes: squamous cell carcinoma and adenocarcinoma.1 In China, the main pathological type of esophageal cancer is esophageal squamous cell carcinoma (ESCC), accounting for more than 90% of the total cases.2 In the past few decades, although the diagnosis and treatment strategies of ESCC have made great progress, the overall survival rate is still poor, with a 5-year survival rate of only about 15–25%.3–5 Hence, the development of new effective prognostic biomarkers to guide ESCC treatment is imperative.
Autophagy is a physiological process during which cells use lysosomes to degrade damaged organelles and macromolecular substances.6 Currently, autophagy appears to play dual roles in tumorigenesis, maintenance, and tumor progression. In the process of tumor initiation and malignant transformation, autophagy exerted a tumor-suppressive role. However, in the process of tumor progression, autophagy can act as an oncogenic mechanism by promoting tumor cell metastasis and inhibiting tumor cell apoptosis.7 Current literature shows that autophagy is associated with the diagnosis, treatment and prognosis of ESCC patients.8
Long non-coding RNAs (lncRNAs) generally refer to the non-coding RNAs, which are at least 200 nucleotides in length.9 With the continuous deepening of research in recent years, lncRNAs have engaged much attention. There is a growing literature that lncRNAs play a key role in gene regulation, thus affecting a variety of biological processes, including tumor cell proliferation, differentiation, metastasis and apoptosis.10,11 Recent studies also indicate that lncRNA can play a regulatory role in complex networks of autophagy by interacting with multiple autophagy-related DNA, RNA, or proteins.12 For example, LINC00337 can induce autophagy and chemotherapeutic resistance to cisplatin in ESCC cells by upregulating the expression of TPX2.13 However, studies on the relationship between ESCC and autophagy-related lncRNAs (ARlncRNAs) are particularly scarce, which still need to be further elucidated.
Here, we comprehensively analyzed the expression profile of ARlncRNAs in 179 patients with ESCC to construct and validate an autophagy-related prognostic model. The present study aimed to enable patients with ESCC to benefit from individualized treatment and thus improve prognosis.
Materials and Methods
Data Preparation
We downloaded the RNA expression profiles and clinical data of ESCC from the GSE53625 dataset and The Cancer Genome Atlas (TCGA) database, respectively. The GSE53625 dataset contained normalized gene expression data of 179 ESCC patients, but the batch effect was still present, so the “limma” package was employed to remove the batch effect (Figure S1 and Table S1).14,15 RNA-sequence data of TCGA-ESCC samples were analyzed as previously described.16 222 autophagy-related genes (ARGs) were searched from the Human Autophagy Database (HADB, http://www.autophagy.lu/). Next, we adopted the Spearman correlation test to determine potential ARlncRNAs and the filter criteria for correlation coefficient and p-value were set at 0.3 and 0.001, respectively. Owing to the freely accessible resources TCGA and GEO databases, the study let off institutional review board approval.
Differentially Expressed ARlncRNAs
By using the “limma” package to compare the matched tumors and normal tissues of 179 ESCC patients, we screened differentially expressed autophagy-related lncRNAs (DEARlnRNAs) with both |log2FC| more than 1 and false discovery rate (FDR) less than 0.05.
Construction of Prognostic Signature
DEARlncRNAs were analyzed by univariate Cox regression analysis, and lncRNAs with p < 0.05 were defined as prognostic biomarkers. In order to avoid overfitting, we adopted the least absolute shrinkage and selection operator (LASSO) and multivariate Cox analysis method based on Akaike Information Criteria (AIC) to narrow the range of lncRNA, thus selecting the optimal prognostic risk model. Furthermore, a prognostic model was established by multiplying multivariate Cox regression coefficients by the expression level of each variable.
Validation and Assessment of the Prognostic Model
The risk score of each patient with ESCC was calculated according to the prognostic formula, and all ESCC patients were separated into two groups (high-risk group or low-risk group) based on the median risk score. To evaluate the prognostic value of the model, we plotted the Kaplan–Meier survival curves and receiver operating characteristic (ROC) curves. Meanwhile, we assessed model calibration using the Brier score and calibration curves. The model was internally validated using the Bootstrap method based on 1000 resampling, and AUC and Brier scores for the prognostic model were calculated by the “riskRegression” package.17 Clinical correlation analyses were performed to compare whether there were differences in risk score between clinical variables and the survival prediction ability of prognostic factors was further compared. To demonstrate whether the prognostic model could be assumed as a standalone prognostic variable, univariate and multivariate Cox regression analyses were implemented by combining the risk score with clinicopathological variables, and the results were drawn forest maps.
Gene Set Enrichment Analysis
To explore the possible mechanisms between high and low-risk groups of ESCC patients, we employed the “clusterProfiler” package to perform GSEA based on the Kyoto Encyclopedia of Genes and Genomes (KEGG) (v7.2) gene set collections.
Immune Infiltration and Therapeutic Response
The relative proportion of 22 tumor-Infiltrating Immune Cells (TICs) in 179 ESCC samples was evaluated with CIBERSORT algorithm.18,19 After a quality screening (p < 0.05), 107 cases of ESCC could be used for subsequent analysis. Wilcoxon test was implemented to compare the different abundances of 22 TICs types between high and low-risk groups. To assess the effect of immunotherapy, we detected the correlation of risk scores with immunotherapy-related targets, such as PD-1 (programmed cell death 1) and CD274 molecule (best known as PD-L1) using the Spearman correlation method. Meanwhile, the “pRRophetic” package was adopted to estimate the chemotherapeutic responses based on half maximal inhibitory concentration (IC50) of chemotherapy drugs for each ESCC patient available in the Genomics of Drug Sensitivity in Cancer (GDSC) database.
Relationship Between the Risk Score and Ferroptosis
Ferroptosis is a newly introduced form of programmed cell death discovered in recent years. Accumulating studies have revealed that ferroptosis can inhibit tumor growth or promote tumor proliferation in tumor development, and there is crosstalk with autophagy at the molecular level.20,21 Then, Spearman correlation examined the correlation of risk scores with ferroptosis-associated genes that were identified from the FerrDb website (http://www.zhounan.org/ferrdb/index.html).
Construction of the ARlncRNA-mRNA Co-Expression Network
We analyzed the relationship between the nine ARlncRNAs and co-expression of ARGs through co-expression network and Sankey diagram. Furthermore, Gene ontology (GO) and KEGG pathway analysis of the co-expressed ARGs were performed using the “clusterProfiler” package.22–24
Validation of Core lncRNAs
The expression levels of nine ARlncRNAs in tumor and normal tissues were verified in TCGA ESCC cohort. Furthermore, the ESCC samples from the TCGA cohort were categorized into two groups (the high and low-expression groups) based on the median expression level of a single lncRNA and K-M analysis was implemented to verify the survival prediction ability of core lncRNAs.
Statistical Analysis
All statistical analyses and visualization of results in this study were performed with R software version 4.0.2. Statistical significance was set at p-value <0.05. Wilcoxon test was used for two independent samples or the paired data. P < 0.05 and Benjamini-Hochberg adjusted p < 0.05 were considered as the cut-off criterion for enrichment analysis.
Results
Identification of 481 DEARlncRNAs
Figure 1 presents the overall procedures in this study. The expression profiles of 6615 lncRNAs and 189 ARGs were obtained from GSE53625. Then, Spearman correlation analysis between the lncRNAs and ARGs was performed and 5031 ARlncRNAs were identified. Next, a total of 481 DEARlncRNAs were identified between tumor tissues and normal tissues, of which 169 lncRNAs were upregulated and 312 lncRNAs were downregulated, respectively (Table S2). Volcano and heatmap plots are shown (Figure 2A and B).
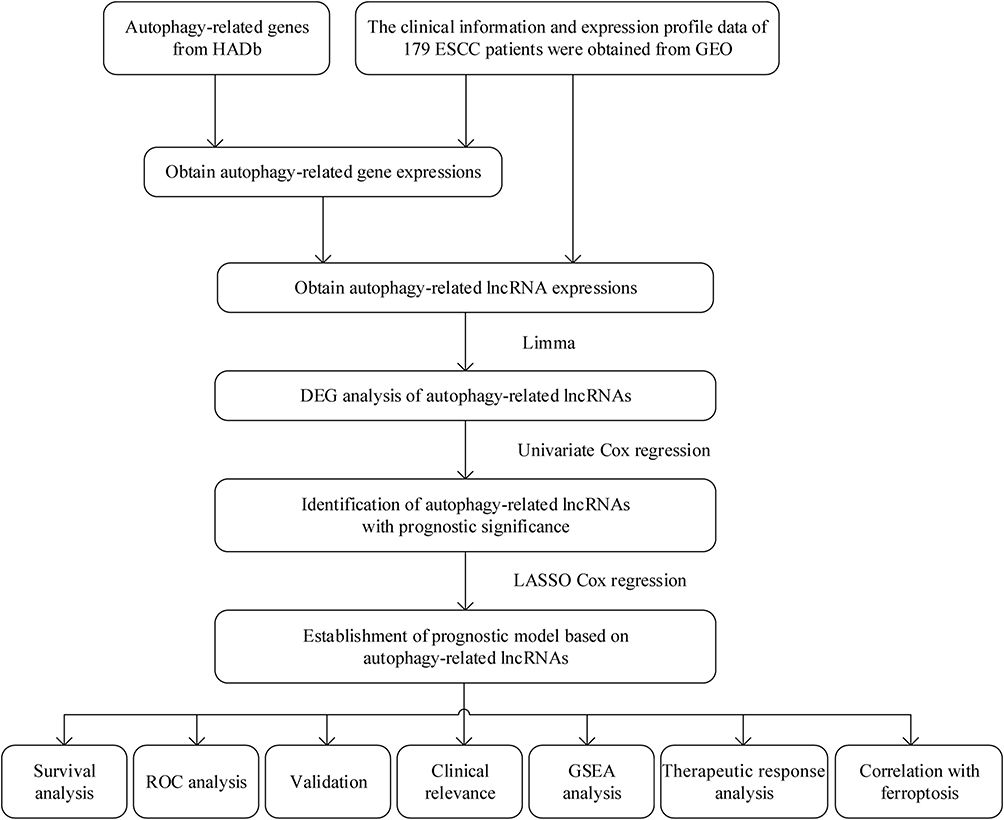 |
Figure 1 Flow diagram of the overall procedures. |
 |
Figure 2 Selection of DEARlncRNAs and construction of prognostic signature. (A) Volcano plot of DEARlncRNAs between tumor tissues and normal tissues. Upregulation as red dot and downregulation as blue dot. (B) Heatmap of top 30 DEARlncRNAs between tumor tissues and normal tissues. (C) Distribution map of LASSO coefficients. (D) LASSO coefficient values and the selection of the best parameter (lambda). (E) Cox regression analysis of ARlncRNAs visualized as forest plot. |
Construction and Validation of Prognostic Signature for ARlncRNAs
In total, 64 prognostic DEARlncRNAs in ESCC were extracted by univariate analysis of which the significance filtering condition was p < 0.05 (Table S3). Subsequently, the prognostic signature based on 9 ARlncRNAs was established using Lasso and stepwise multivariate Cox regression analysis (Figure 2C–E). The formula of the prognostic model was given as follows: Risk score = [0.21219 × LINC02024] + [0.46308 × LINC01711] + [- 0.10103 × LINC01419] + [- 0.11997 × LCAL1] + [0.19070 × FENDRR] + [0.15634 × ADAMTS9-AS1] + [- 0.12891 × AC025244.1] + [- 0.10636 × AC015908.6] + [0.49029 × AC011997.1]. Furthermore, we found that LINC02024, LINC01711, FENDRR, ADAMTS9-AS1 and AC011997.1 were risk factors for HR > 1, while LINC01419, LCAL1, AC025244.1 and AC015908.6 were favorable factors with HR < 1 (Table 1 and Figure 3).
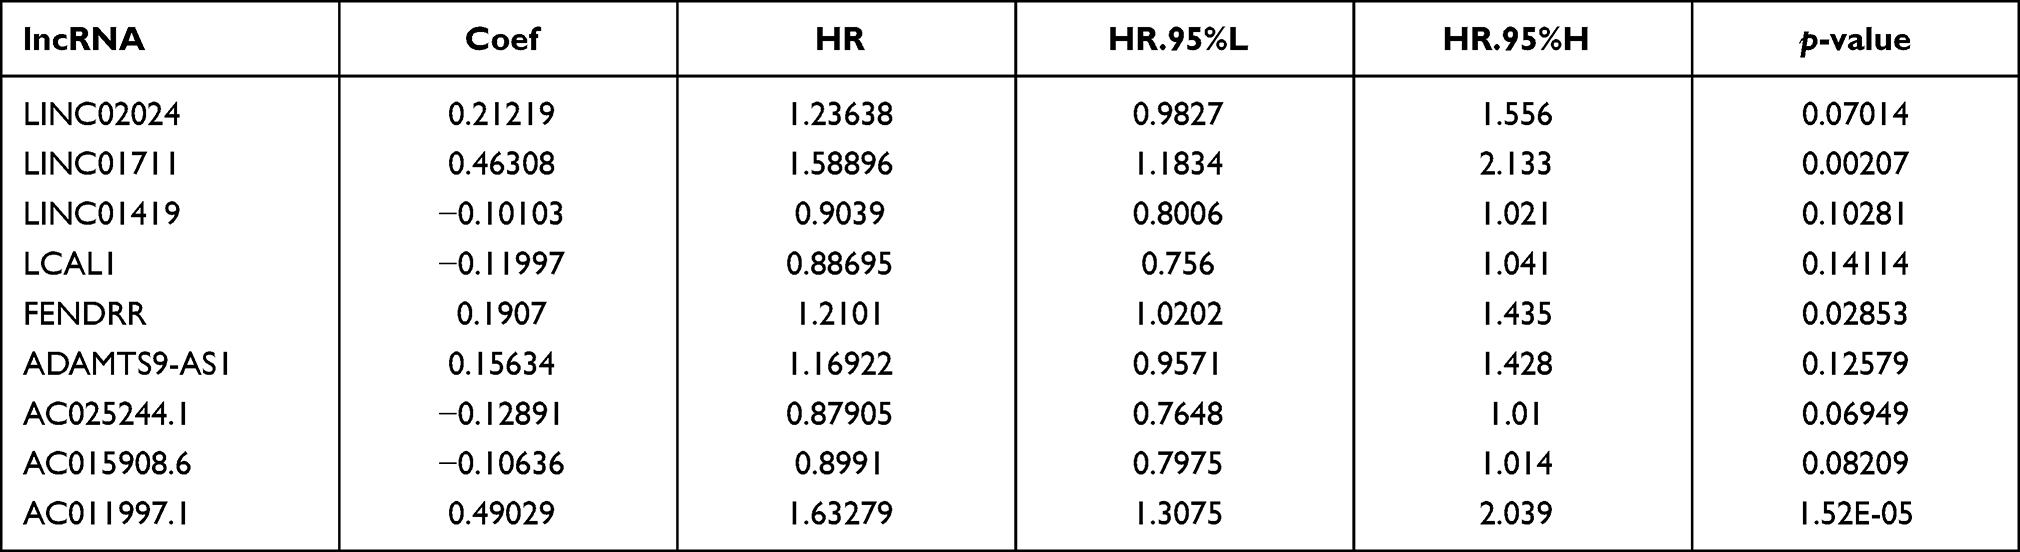 |
Table 1 Multivariate Cox Results of Prognostic ARlncRNAs Based on GSE53625 Dataset |
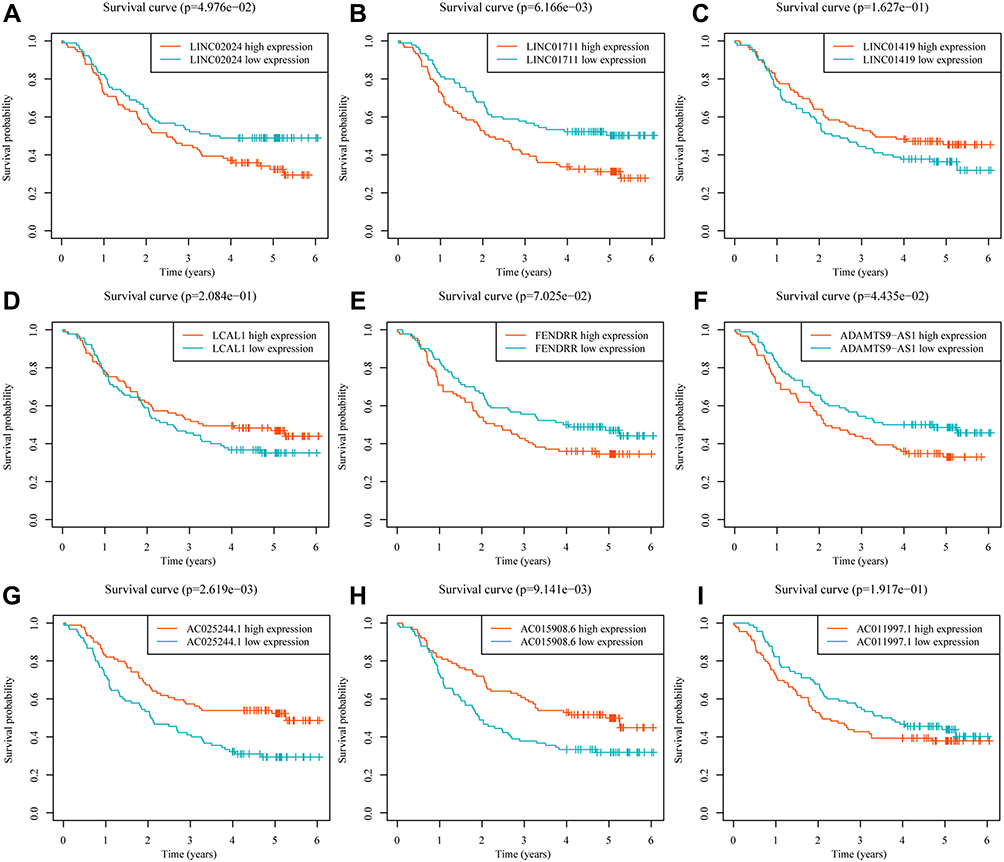 |
Figure 3 Kaplan-Meier survival curves of 9 ARlncRNAs identified in GSE53625 dataset. (A) LINC02024; (B) LINC01711; (C) LINC01419; (D) LCAL1; (E) FENDRR; (F) ADAMTS9-AS1; (G) AC025244.1; (H) AC015908.6; (I) AC011997.1. |
We computed each patient’s risk score using the prognostic signature and separated all ESCC patients into a high-risk group (n = 89) and low-risk group (n = 90) based on the median risk score. According to the K-M survival curve, patients in the low-risk group had a longer survival time than those in the high-risk group (p < 0.001, Figure 4A). By plotting ROC curves, we found that AUC values of 1-, 3-, and 5-year survival rates in the original dataset were 0.755, 0.772, and 0.796, respectively, which illustrated the medium predictive accuracy of the prognostic model (Figure 4B). Figure 4C presents the distribution of risk scores, the survival status and the expression values of nine lncRNAs of patients. The calibration curves of the prognosis model for the prediction of 1-, 3- and 5-year OS rates demonstrated good agreement in the original dataset with Brier scores of 0.151, 0.192, and 0.18, respectively (Figure 4D). Through bootstrapping verification, the AUCs and Brier scores for predicting 1-, 3- and 5-year OS were 0.708, 0.715, 0.738, 0.166, 0.222 and 0.208, respectively, indicating that the model had good discrimination and calibration (Figure 4E).
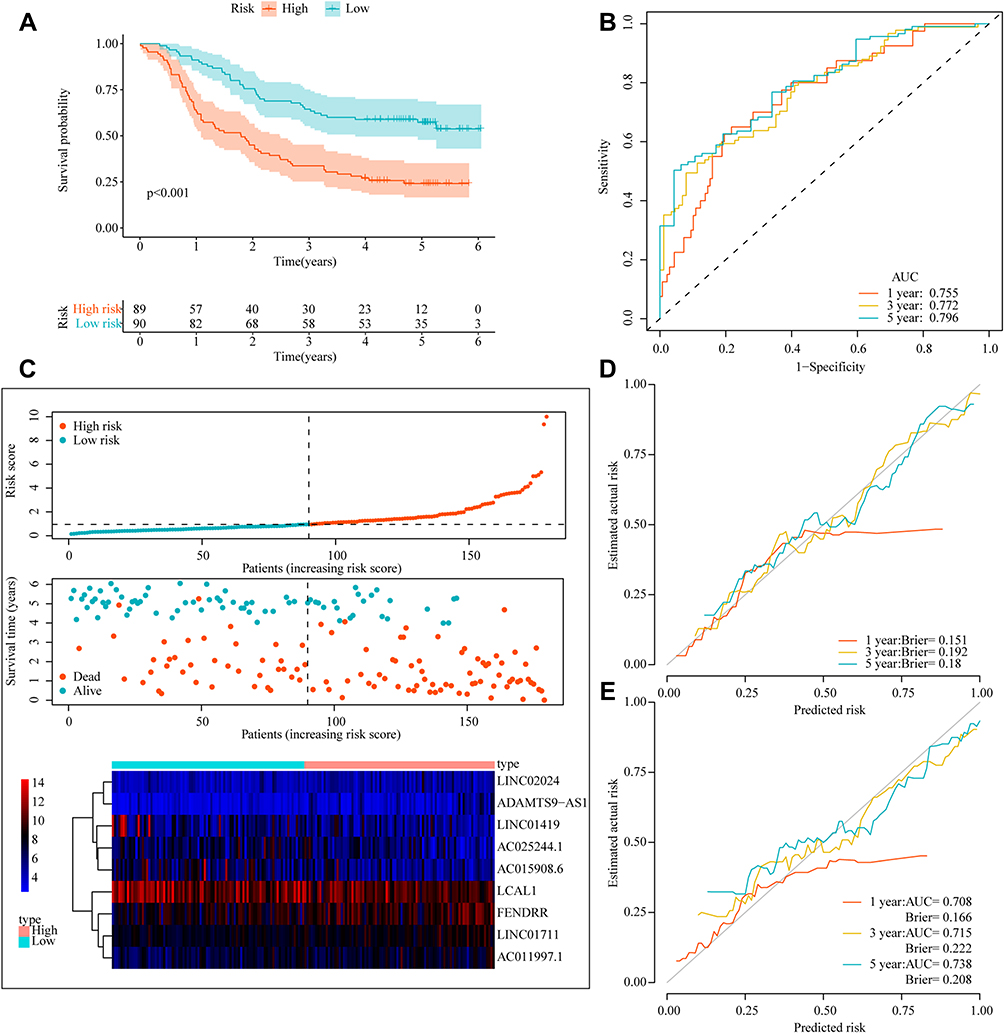 |
Figure 4 Appraisal of prognostic signature in179 ESCC patients. (A) Kaplan-Meier survival analysis in the original dataset. (B) ROC curves for 1-, 3-, and 5-year survival in the original dataset. (C) Risk score analysis (risk curve; scatter plot of vital status by risk score; heatmap of the 9 lncRNAs expression). (D) Calibration curves of prognostic signature in the original dataset. (E) Calibration curves for internal validation by the Bootstrap method. |
Independence of the Model
We conducted a correlation analysis between the risk score and clinicopathological features, and found that the risk score was related to survival outcomes (p < 0.001), T stage (p = 0.022, p = 0.013) and grade (p = 0.02) (Figures 5A–C and S2). Univariate Cox regression indicated that advanced age, higher tumor stage, N stage, grade, and higher risk score were risk factors for poor survival (Figure 5D). Furthermore, we performed a multivariate Cox regression analysis and found that the risk score could serve as an independent prognostic factor in ESCC patients, whereas the clinical parameters were not (Figure 5E). By means of ROC curves with multiple measures, we visualized that the AUC values of risk score were significantly higher than those of other clinical parameters, which furnished evidence to support that the foretelling effect of the prognostic signature had medium accuracy (Figure 5F).
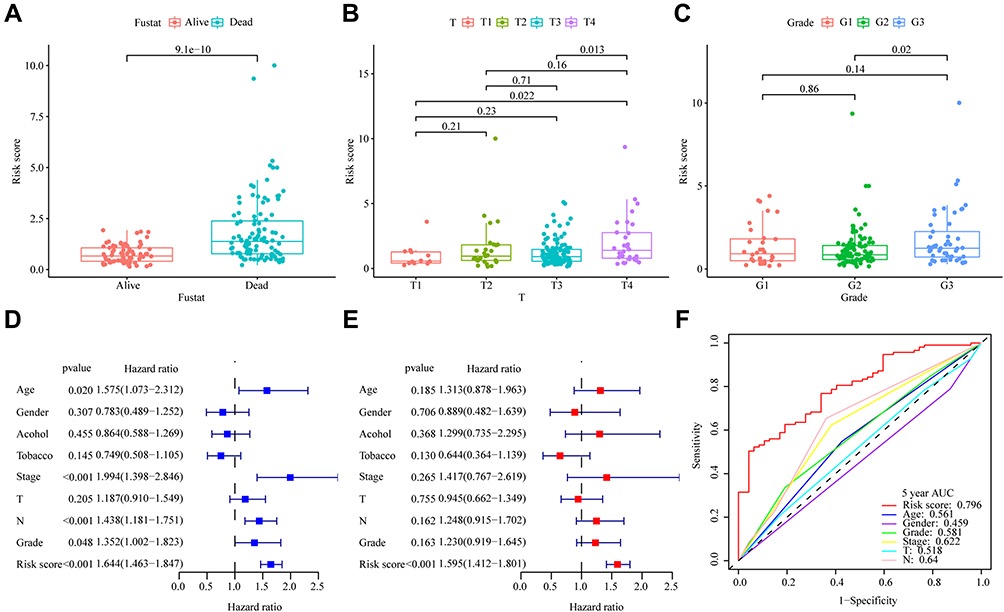 |
Figure 5 Clinical significance and independent prognostic analysis of prognostic signature. (A) survival outcome; (B) T stages; (C) grade; (D) The univariate and (E) multivariate Cox regression analysis of risk score and clinical parameters by using overall survival (OS) of ESCC patients. Age was analyzed as a categorical variable: age≥60 =1, age<60=0; Tumor stage, T stage, N stage, grade, and risk score were analyzed as continuous variables. (F) ROC analysis of 5-year OS for the model and the clinical parameters. |
Gene Set Enrichment Analysis
The GSEA results revealed that cancer- and autophagy-related signaling pathways were obviously enriched in the high-risk ESCC patients, including ECM receptor interaction, TGF- β signaling pathway and focal adhesion (Figure 6A). Meanwhile, metabolism-related signaling pathways were obviously enriched in the low-risk ESCC patients, including Arachidonic acid metabolism, Retinol metabolism, linoleic acid metabolism and drug metabolism cytochrome p450 signaling pathway (Figure 6B). Details of the enrichment analysis are given in Table S4.
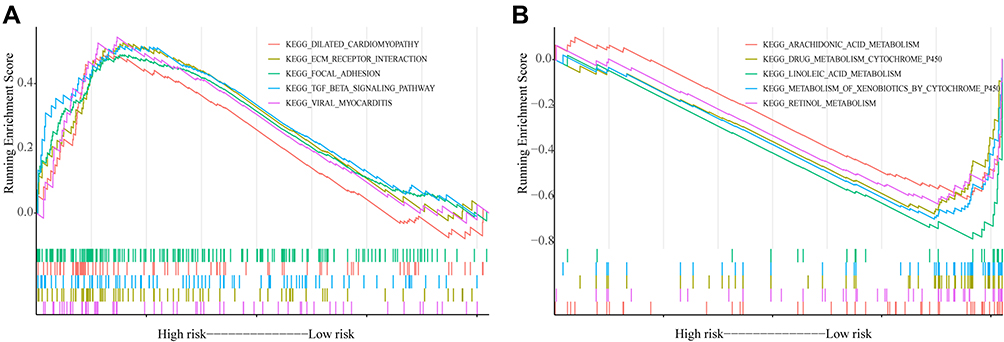 |
Figure 6 Gene set enrichment analysis based on risk scores. (A) the result of high-risk group; (B) the result of low-risk group. |
Immune Cell Infiltration and Therapeutic Response Analysis
Figure 7A shows the relative content distribution of 22 TICs in the GSE53625 cohort. After quality screening (p < 0.05), 107 samples (51 low-risk samples and 56 high-risk samples) of ESCC were then used to analyze the immune cells infiltration. We found that the infiltration level of plasma cells was upregulated, while the infiltration level of macrophages M2 cells was downregulated in the low-risk group compared with the high-risk group (Figure 7B). Then, correlation analysis revealed the mRNA expression levels of PD-1 (R = −0.25, p < 0.001) were negatively related to the risk score (Figure 7C), while no statistical difference was shown between the mRNA expression levels of PD-L1 and risk score (Figure 7D). Meanwhile, the results regarding the chemosensitivity of three commonly used drugs for ESCC treatment (cisplatin, paclitaxel and docetaxel) indicated that the estimated IC50 values of cisplatin were lower in the high-risk group (Figures 7E and S3). The above results revealed that the signature may be a valuable indicator to assess patients’ response to immunotherapy and chemotherapy.
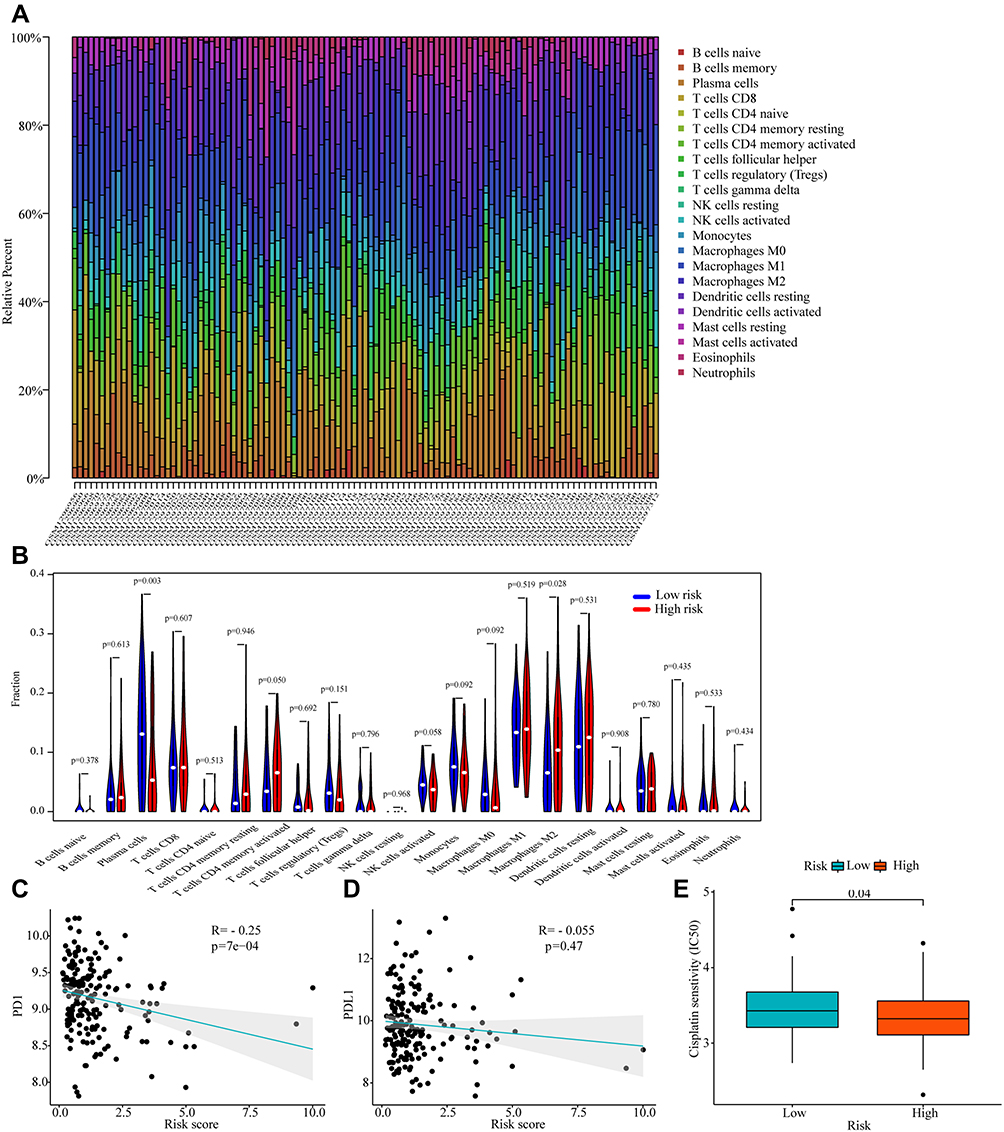 |
Figure 7 Correlations between risk score and tumor-infiltrating immune Cell (TIC) and response to immunotherapy and chemotherapy. (A) The relative content distribution of 22 TICs of ESCC samples. (B) Differential analysis of immune cells proportions in the high and low-risk groups. (C and D) Correlation plots of the risk score and the expression levels of PD-1 and PD-L1. (E) Chemotherapeutic sensitivity of cisplatin in the high and low-risk groups. |
Identification of the Ferroptosis Correlation with the Prognostic Signature
Among the 209 ferroptosis-related genes, 74 (35.41%) genes were significantly associated with risk scores, of which 32 and 42 genes separately were positively and negatively associated with risk scores. As shown in Figure 8, HIC1, ACSL3, NNMT, ANO6 and CDO1 are the leading five ferroptosis-related genes that have a positive association with the risk score, while the top five ferroptosis-related genes that are negatively associated with the risk score are HAMP, ALOX12B, MAFG, HILPDA and DUOX1.
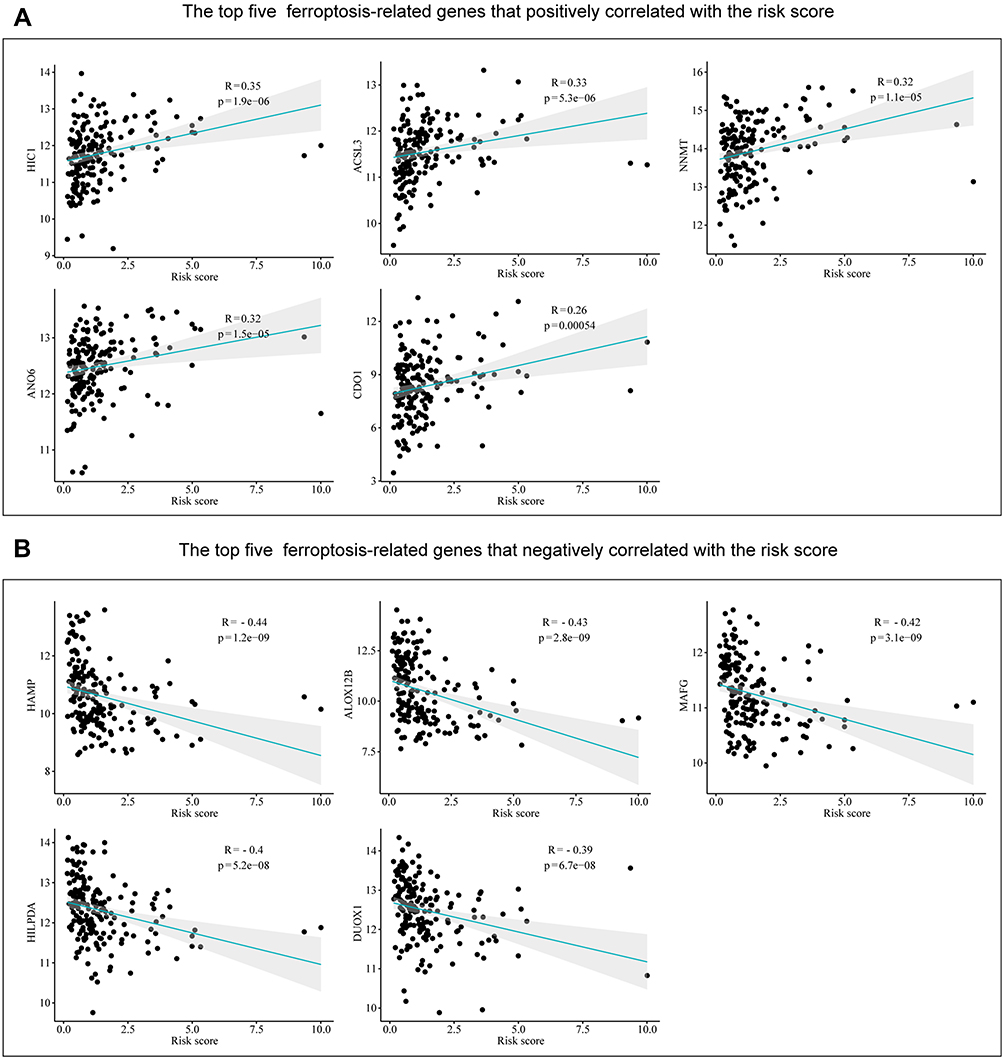 |
Figure 8 Correlations between risk score and ferroptosis-related genes in ESCC. (A) The top five positive correlations. (B) The top five negative correlations. |
ARlncRNA-mRNA Co-Expression Network
We developed a co-expression network containing nine ARlncRNAs and 42 ARGs and the Sankey plots indicated the correlation between them and risk types (protective or risk) (Figure 9A and B). GO biological process enrichment analysis of 42 ARGs showed that they were mainly involved in the autophagy, process utilizing autophagic mechanism, cellular response to starvation and macroautophagy (Figure 9C). KEGG analysis revealed that these ARGs mainly participated in the Autophagy-animal, Autophagy-other, FoxO and Cellular senescence signaling pathway (Figure 9D). Details of the enrichment analysis are given in Table S5.
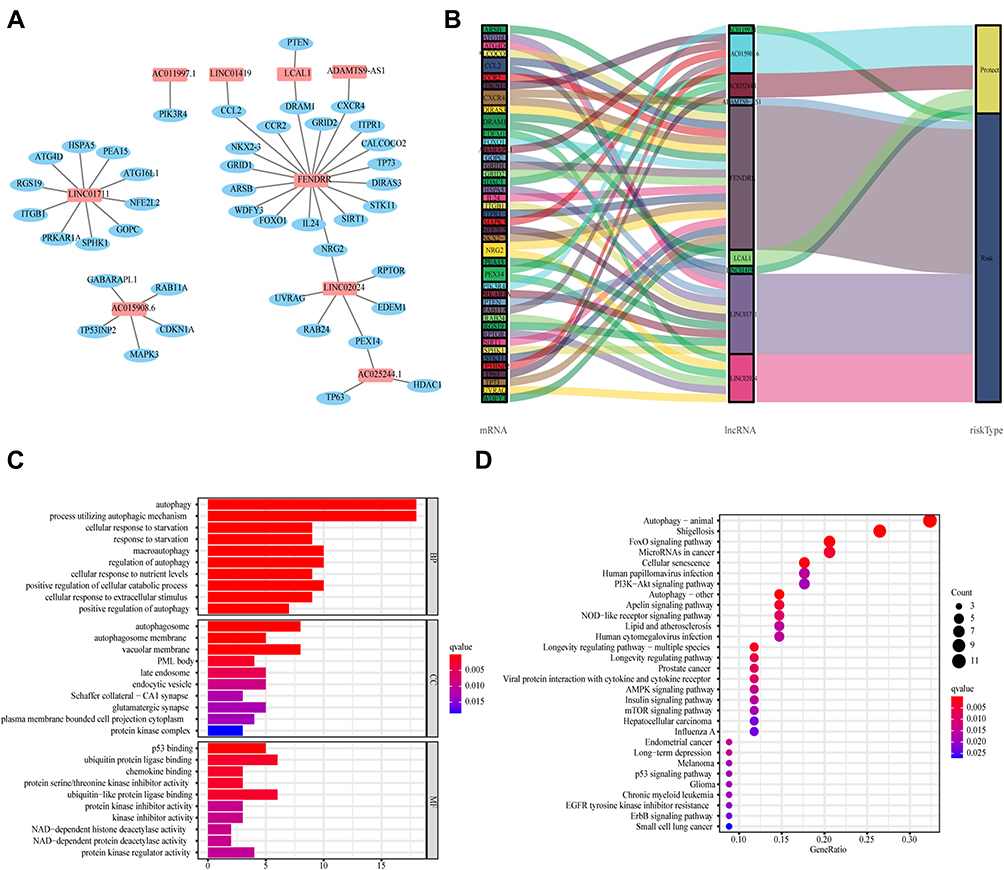 |
Figure 9 ARlncRNA-mRNA co-expression network. (A) Co-expression network contained 9 ARlncRNAs and 42 autophagy mRNAs. LncRNA as red rectangle and mRNA as blue ellipse. (B) Sankey diagram of genes in co-expression network and risk types. (C and D) GO and KEGG enrichment analysis of 42 autophagy-related genes. |
Validation of Core lncRNAs
We extracted the expression levels of 9 ARlncRNAs in tumor tissues and normal tissues from GSE53625 dataset and found that LINC01711, LINC01419, LCAL1, AC025244.1 and AC011997.1 were highly expressed in ESCC, while LINC02024, FENDRR, ADAMTS9-AS1 and AC015908.6 were lowly expressed in ESCC (Figure 10). Furthermore, we extracted the expression profiles of six of these lncRNAs from TCGA ESCC dataset. Among them, 4 lncRNAs (LINC01711, LINC01419, AC025244.1 and AC011997.1) were up-regulated in ESCC, and 2 lncRNAs (FENDRR and ADAMTS9-AS1) were down-regulated in ESCC, which was consistent with the differential expression pattern in the GSE53625 dataset (Figure 11A–F). In addition, K-M plots demonstrated that three lncRNAs (LINC01419, FENDRR, and AC011997.1) had similar prognostic values as those in the GSE53625 dataset (Figure 11G–I).
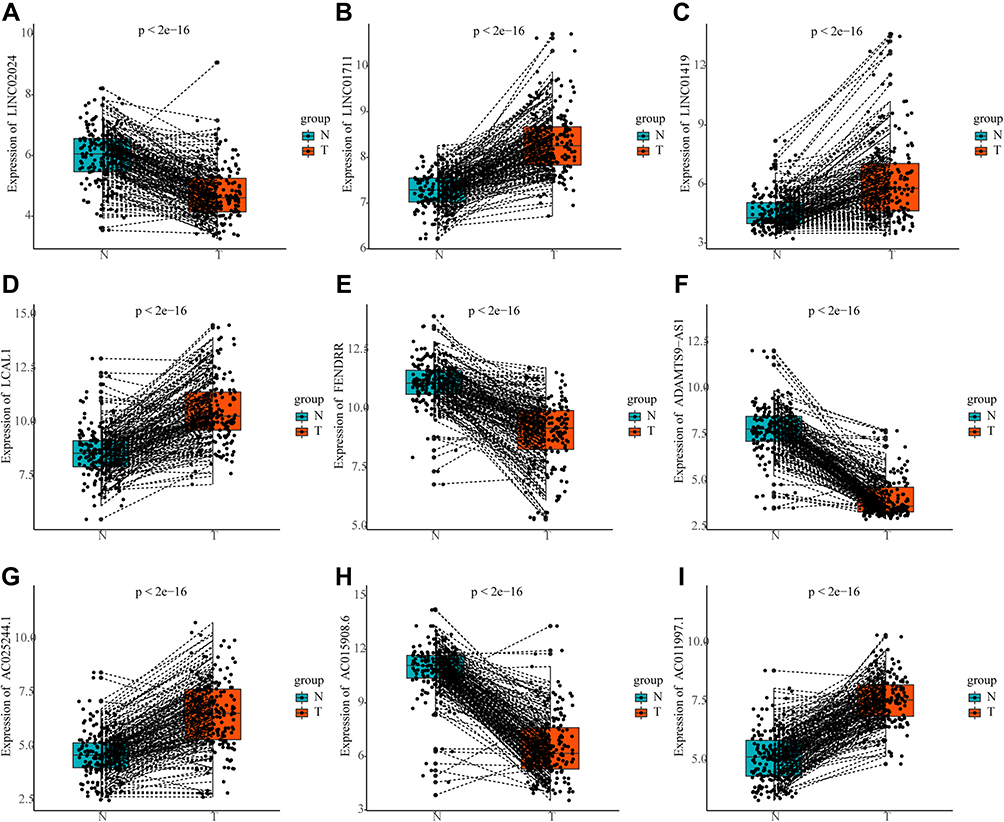 |
Figure 10 The expression profiles of 9 ARlncRNAs in tumor tissues and normal tissues from GSE53625 dataset. (A) LINC02024; (B) LINC01711; (C) LINC01419; (D) LCAL1; (E) FENDRR; (F) ADAMTS9-AS1; (G) AC025244.1; (H) AC015908.6; (I) AC011997.1. |
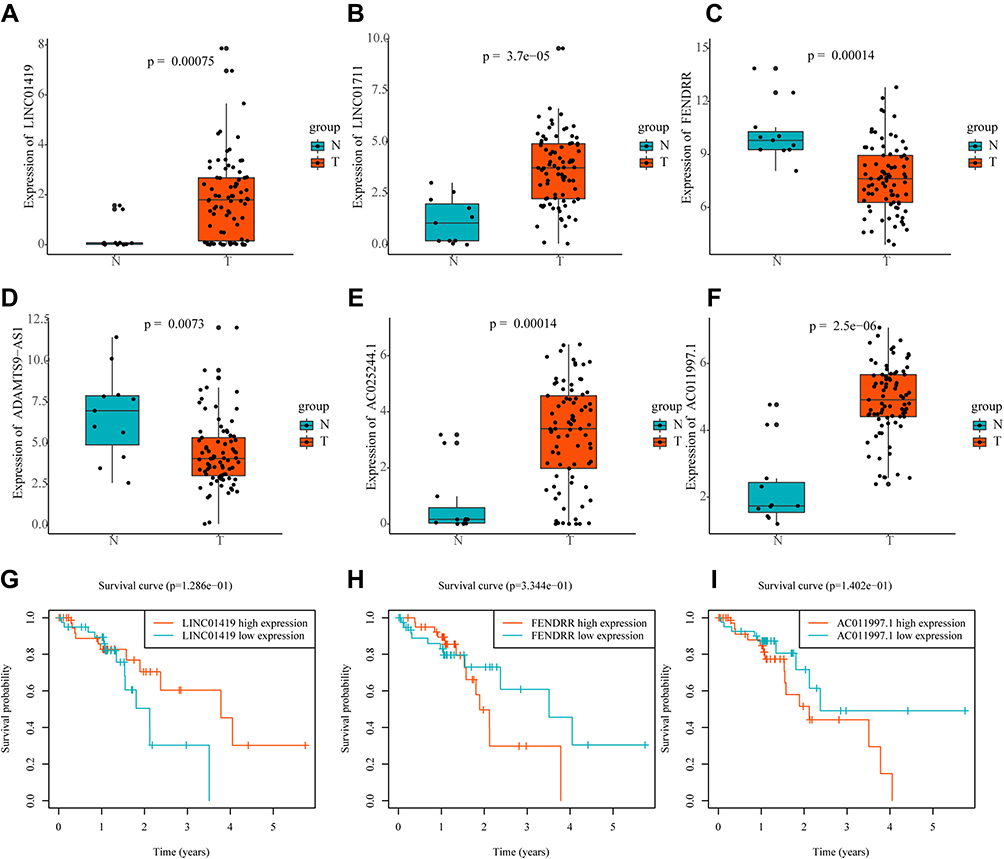 |
Figure 11 The expression profiles and Kaplan-Meier survival curves of ARlncRNAs in TCGA ESCC dataset. The expression profiles of ARlncRNAs in tumor tissues and normal tissues ((A) LINC01419; (B) LINC01711; (C) FENDRR; (D) ADAMTS9-AS1; (E) AC025244.1; (F) AC011997.1). Kaplan-Meier survival curves of ARlncRNAs ((G) LINC01419; (H) FENDRR; (I) AC011997.1). |
Discussion
In China, ESCC is the most common pathological subtype of esophageal cancer, and patients with ESCC often have a short survival due to unclear pathogenesis and insensitivity to treatment. Considering the significance of autophagy and lncRNA in the biology of ESCC and the fact that several studies have shown that models composed of ARlncRNAs could indicate prognosis in multiple cancer types,25–28 the development of a robust prognostic biomarker composed of ARlncRNAs to guide ESCC treatment is imperative.
In our present study, we constructed a novel prognostic model composed of nine ARlncRNAs, which showed good prognostic performance and was a significant independent prognostic factor for predicting OS in ESCC patients. The model was subjected to bootstrap internal validation on the original GEO dataset, and the expression levels of core lncRNAs were verified on the TCGA ESCC dataset. Correlation analysis showed that the risk score of ARlncRNAs model was associated with survival outcomes, T stage, and tumor grade. The GSEA results revealed the prognostic signature may be involved in the cancer-related signaling pathways, autophagy-related signaling pathways and metabolism-related signaling pathways. Correlation analysis showed that the risk score was negatively correlated with the level of PD-1mRNA expression, and the risk score could predict the sensitivity of cisplatin therapy. In summary, our research demonstrated that autophagy dysfunction was important during the process of ESCC. Most importantly, our study was the first to demonstrate that prognostic signature composed of nine ARlncRNAs had predictive value for survival prognosis, tumor-infiltrating immune cells, immunotherapy response, and drug sensitivity of ESCC.
Among the nine autophagy-related lncRNAs that make up the prognostic model, only LINC01419, LCAL1, FENDRR and ADAMTS9-AS1 have been reported in ESCC or other cancers. Existing literatures have shown that LINC01419 is overexpressed and associated with malignant phenotypes in hepatocellular carcinoma, gastric cancer and ESCC.29–31 Li et al revealed that LCAL1 was elevated in lung cancer tissues, and overexpressed LCAL1 may suppress autophagic cell death via AMPK/ULK1 pathway.32 Consistent with our results, the expression of FENDRR was significantly down-regulated in liver cancer, colon cancer and gastric cancer.33–35 Xu et al indicated that low FENDRR expression in gastric cancer was related to poor prognosis and this study disclosed that low expression of FENDRR predicted good prognosis in ESCC, which may require further investigation.36 ADAMTS9-AS1 has been reported as a prognostic risk factor in several tumors, including ESCC, prostate cancer and colorectal cancer.37–39
CIBERSORT result indicated that the risk score was related to immune cell infiltration (plasma cells and macrophages M2 cells) in ESCC. Plasma cells can produce antibodies and thus improve the immune response, which may explain the upward trend of plasma cells in the infiltrating abundance of the low-risk group in this article.40 M2 macrophages have been demonstrated to exhibit pro-tumoral activity, and have been related to poor prognosis of ESCC.41,42 Since the efficacy of drugs is related to the degree of drug sensitivity of patients and individual differences, it is essential to detect the drug sensitivity for patients requiring immunotherapy and chemotherapy. Our study indicated that the mRNA expression level of PD-1 was negatively related to the risk score, and the estimated IC50 values of cisplatin were lower in the high-risk group. These data suggest that further studies will be interesting to explore specific mechanisms of risk signature and tumor-infiltrating Immune Cells, and the risk score may provide potential guidance for personalized treatments of ESCC.
Ferroptosis is a newly introduced form of programmed cell death discovered in recent years. Accumulating studies have revealed ferroptosis could inhibit tumor growth or promote tumor proliferation in tumor development, and there is crosstalk with autophagy at the molecular level.20,21 In this study, we found that 35.41% (74/209) ferroptosis-related genes were significantly associated with risk scores, which may further provide more information for targeting ferroptosis therapy.
Nonetheless, there are still some limitations in this study. First, although we have used the bootstrap method to verify the robustness of the prognostic model established in 179 ESCC patients, and the expression levels of key lncRNAs have been verified on TCGA ESCC dataset, external datasets are still needed to further validate the prognostic signature. Second, the role and mechanism of lncRNAs that constitute the prognostic signature of esophageal squamous cell carcinoma needs to be explored in depth.
Conclusion
In brief, we constructed a novel prognostic signature composed of nine autophagy-related lncRNAs for ESCC and verified its reliability, which might provide a novel approach for effective prediction of clinical outcomes and individualized therapeutic strategies selection.
Data Sharing Statement
The results presented here are based upon data generated by the TCGA and GEO. TCGA-ESCC (https://www.cancer.gov/tcga) and the data sets of GSE53625 from GEO (https://www.ncbi.nlm.nih.gov/geo/) are publicly open and available.
Ethical Statement
TCGA and GEO belong to public databases. Patients involved in the database have obtained ethical approval. Users can download relevant data for free for research and publishing relevant articles. Our study is based on open-source data and approved by the Ethics Committee of The Second Affiliated Hospital of Xi’an Jiaotong University.
Acknowledgments
The authors acknowledge GEO and TCGA databases for providing their platforms and contributors for uploading their meaningful datasets.
Funding
This study was supported by the National Natural Science Foundation of China (No.81872471).
Disclosure
The authors report no conflicts of interest in this work.
References
1. Bray F, Ferlay J, Soerjomataram I, Siegel RL, Torre LA, Jemal A. Global cancer statistics 2018: GLOBOCAN estimates of incidence and mortality worldwide for 36 cancers in 185 countries. CA Cancer J Clin. 2018;68(6):394–424. doi:10.3322/caac.21492
2. Malhotra GK, Yanala U, Ravipati A, Follet M, Vijayakumar M, Are C. Global trends in esophageal cancer. J Surg Oncol. 2017;115(5):564–579. doi:10.1002/jso.24592
3. Chen W, Zheng R, Baade PD, et al. Cancer statistics in China, 2015. CA Cancer J Clin. 2016;66(2):115–132. doi:10.3322/caac.21338
4. Huang F-L, Yu S-J. Esophageal cancer: risk factors, genetic association, and treatment. Asian J Surg. 2018;41(3):210–215. doi:10.1016/j.asjsur.2016.10.005
5. Fitzmaurice C, Dicker D, Pain A, et al. The global burden of cancer 2013. JAMA Oncol. 2015;1(4):505–527. doi:10.1001/jamaoncol.2015.0735
6. Parzych KR, Klionsky DJ. An overview of autophagy: morphology, mechanism, and regulation. Antioxid Redox Signal. 2014;20(3):460–473. doi:10.1089/ars.2013.5371
7. Amaravadi R, Kimmelman AC, White E. Recent insights into the function of autophagy in cancer. Genes Dev. 2016;30(17):1913–1930. doi:10.1101/gad.287524.116
8. Saxena R, Klochkova A, Murray MG, et al. Roles for autophagy in esophageal carcinogenesis: implications for improving patient outcomes. Cancers. 2019;11(11):1697. doi:10.3390/cancers11111697
9. Guttman M, Rinn JL. Modular regulatory principles of large non-coding RNAs. Nature. 2012;482(7385):339–346. doi:10.1038/nature10887
10. Huarte M. The emerging role of IncRNAs in cancer. Nat Med. 2015;21(11):1253–1261. doi:10.1038/nm.3981
11. Zhang H, Chen Z, Wang X, Huang Z, He Z, Chen Y. Long non-coding RNA: a new player in cancer. J Hematol Oncol. 2013;6(1):37. doi:10.1186/1756-8722-6-37
12. Sun T. Long noncoding RNAs act as regulators of autophagy in cancer. Pharmacol Res. 2018;129:151–155. doi:10.1016/j.phrs.2017.11.009
13. Yang C, Shen S, Zheng X, et al. Long non-coding RNA LINC00337 induces autophagy and chemoresistance to cisplatin in esophageal squamous cell carcinoma cells via upregulation of TPX2 by recruiting E2F4. FASEB J. 2020;34(5):6055–6069. doi:10.1096/fj.201900731RR
14. Li J, Chen Z, Tian L, et al. LncRNA profile study reveals a three-lncRNA signature associated with the survival of patients with oesophageal squamous cell carcinoma. Gut. 2014;63(11):1700–1710. doi:10.1136/gutjnl-2013-305806
15. Ritchie ME, Phipson B, Wu D, et al. limma powers differential expression analyses for RNA-sequencing and microarray studies. Nucleic Acids Res. 2015;43(7):e47. doi:10.1093/nar/gkv007
16. Shi X, Li Y, Sun Y, et al. Genome-wide analysis of lncRNAs, miRNAs, and mRNAs forming a prognostic scoring system in esophageal squamous cell carcinoma. Peer J. 2020;8:e8368. doi:10.7717/peerj.8368
17. Wang J, Li Y, Fu W, et al. Prognostic nomogram based on immune scores for breast cancer patients. Cancer Med. 2019;8(11):5214–5222. doi:10.1002/cam4.2428
18. Thorsson V, Gibbs DL, Brown SD, et al. The immune landscape of cancer. Immunity. 2018;48(4):812–830.e814. doi:10.1016/j.immuni.2018.03.023
19. Newman AM, Steen CB, Liu CL, et al. Determining cell type abundance and expression from bulk tissues with digital cytometry. Nat Biotechnol. 2019;37(7):773–782. doi:10.1038/s41587-019-0114-2
20. Jiang M, Qiao M, Zhao C, Deng J, Li X, Zhou C. Targeting ferroptosis for cancer therapy: exploring novel strategies from its mechanisms and role in cancers. Transl Lung Cancer Res. 2020;9(4):1569–1584. doi:10.21037/tlcr-20-341
21. Zhou Y, Shen Y, Chen C, et al. The crosstalk between autophagy and ferroptosis: what can we learn to target drug resistance in cancer? Cancer Biol Med. 2019;16(4):630–646. doi:10.20892/j.issn.2095-3941.2019.0158
22. Carbon S, Douglass E, Dunn N, et al. The gene ontology resource: 20 years and still GOing strong. Nucleic Acids Res. 2019;47(D1):D330–D338. doi:10.1093/nar/gky1055
23. Kanehisa M, Furumichi M, Tanabe M, Sato Y, Morishima K. KEGG: new perspectives on genomes, pathways, diseases and drugs. Nucleic Acids Res. 2017;45(D1):D353–D361. doi:10.1093/nar/gkw1092
24. Yu G, Wang L-G, Han Y, He Q-Y. clusterProfiler: an R package for comparing biological themes among gene clusters. OMICS. 2012;16(5):284–287. doi:10.1089/omi.2011.0118
25. Langer R, Streutker CJ, Swanson PE. Autophagy and its current relevance to the diagnosis and clinical management of esophageal diseases. In: Giuli R, Gregersen H, editors. 13th Oeso World Conference: The Esophagiome Ii. Vol. 1381; 2016:113–121.
26. Khan T, Relitti N, Brindisi M, et al. Autophagy modulators for the treatment of oral and esophageal squamous cell carcinomas. Med Res Rev. 2020;40(3):1002–1060. doi:10.1002/med.21646
27. Deng X, Bi Q, Chen S, et al. Identification of a five-autophagy-related-lncRNA signature as a novel prognostic biomarker for hepatocellular carcinoma. Front Mol Biosci. 2020;7:611626. doi:10.3389/fmolb.2020.611626
28. Yu J, Mao W, Xu B, Chen M. Construction and validation of an autophagy-related long noncoding RNA signature for prognosis prediction in kidney renal clear cell carcinoma patients. Cancer Med. 2021;10(7):2359–2369. doi:10.1002/cam4.3820
29. Dang H, Chen L, Tang P, et al. LINC01419 promotes cell proliferation and metastasis in hepatocellular carcinoma by enhancing NDRG1 promoter activity. Cell Oncol. 2020;43(5):931–947. doi:10.1007/s13402-020-00540-6
30. Wang -L-L, Zhang L, Cui X-F. Downregulation of long noncoding RNA LINC01419 inhibits cell migration, invasion, and tumor growth and promotes autophagy via inactivation of the PI3K/Akt1/mTOR pathway in gastric cancer. Ther Adv Med Oncol. 2019;11:175883591987465. doi:10.1177/1758835919874651
31. Chen JL, Lin ZX, Qin YS, et al. Overexpression of long noncoding RNA LINC01419 in esophageal squamous cell carcinoma and its relation to the sensitivity to 5-fluorouracil by mediating GSTP1 methylation. Ther Adv Med Oncol. 2019;11:1758835919838958. doi:10.1177/1758835919838958
32. Li J-Y, Luo Z-Q. LCAL1 enhances lung cancer survival via inhibiting AMPK-related antitumor functions. Mol Cell Biochem. 2019;457(1–2):11–20. doi:10.1007/s11010-019-03507-w
33. Qian G, Jin X, Zhang L. LncRNA FENDRR upregulation promotes hepatic carcinoma cells apoptosis by targeting miR-362-5p via NPR3 and p38-MAPK pathway. Cancer Biother Radiopharm. 2020;35(9):629–639. doi:10.1089/cbr.2019.3468
34. Yin SL, Xiao F, Liu YF, Chen H, Guo GC. Long non-coding RNA FENDRR restrains the aggressiveness of CRC via regulating miR-18a-5p/ING4 axis. J Cell Biochem. 2020;121(8–9):3973–3985. doi:10.1002/jcb.29555
35. Luo T, Zhao J, Lu Z, et al. Characterization of long non-coding RNAs and MEF2C-AS1 identified as a novel biomarker in diffuse gastric cancer. Transl Oncol. 2018;11(5):1080–1089. doi:10.1016/j.tranon.2018.06.007
36. Xu TP, Huang MD, Xia R, et al. Decreased expression of the long non-coding RNA FENDRR is associated with poor prognosis in gastric cancer and FENDRR regulates gastric cancer cell metastasis by affecting fibronectin1 expression. J Hematol Oncol. 2014;7(1):63. doi:10.1186/s13045-014-0063-7
37. Li Z, Yao Q, Zhao S, Wang Y, Li Y, Wang Z. Comprehensive analysis of differential co-expression patterns reveal transcriptional dysregulation mechanism and identify novel prognostic lncRNAs in esophageal squamous cell carcinoma. Onco Targets Ther. 2017;10:3095–3105. doi:10.2147/ott.s135312
38. Zhou Z, Wu X, Zhou Y, Yan W. Long non-coding RNA ADAMTS9-AS1 inhibits the progression of prostate cancer by modulating the miR-142-5p/CCND1 axis. J Gene Med. 2021;23(5):e3331. doi:10.1002/jgm.3331
39. Chen W, Tu Q, Yu L, et al. LncRNA ADAMTS9-AS1, as prognostic marker, promotes cell proliferation and EMT in colorectal cancer. Hum Cell. 2020;33(4):1133–1141. doi:10.1007/s13577-020-00388-w
40. Ribatti D. The discovery of plasma cells: an historical note. Immunol Lett. 2017;188:64–67. doi:10.1016/j.imlet.2017.06.006
41. Zhou J, Zheng S, Liu T, et al. Infiltrated M2 tumour-associated macrophages in the stroma promote metastasis and poor survival in oesophageal squamous cell carcinoma. Histol Histopathol. 2019;34(5):563–572. doi:10.14670/hh-18-061
42. Yang H, Zhang Q, Xu M, et al. CCL2-CCR2 axis recruits tumor associated macrophages to induce immune evasion through PD-1 signaling in esophageal carcinogenesis. Mol Cancer. 2020;19(1):41. doi:10.1186/s12943-020-01165-x
 © 2021 The Author(s). This work is published and licensed by Dove Medical Press Limited. The full terms of this license are available at https://www.dovepress.com/terms.php and incorporate the Creative Commons Attribution - Non Commercial (unported, v3.0) License.
By accessing the work you hereby accept the Terms. Non-commercial uses of the work are permitted without any further permission from Dove Medical Press Limited, provided the work is properly attributed. For permission for commercial use of this work, please see paragraphs 4.2 and 5 of our Terms.
© 2021 The Author(s). This work is published and licensed by Dove Medical Press Limited. The full terms of this license are available at https://www.dovepress.com/terms.php and incorporate the Creative Commons Attribution - Non Commercial (unported, v3.0) License.
By accessing the work you hereby accept the Terms. Non-commercial uses of the work are permitted without any further permission from Dove Medical Press Limited, provided the work is properly attributed. For permission for commercial use of this work, please see paragraphs 4.2 and 5 of our Terms.