")
Back to Journals » Diabetes, Metabolic Syndrome and Obesity » Volume 14
A Nonlinear Relationship Between Serum 25-Hydroxyvitamin D and Urine Albumin to Creatinine Ratio in Type 2 Diabetes: A Cross-Sectional Study in China
Authors Liang Q , Hu H , Wu H, Chen X, Wang W, Le Y, Yang S, Jia L
Received 25 February 2021
Accepted for publication 21 May 2021
Published 9 June 2021 Volume 2021:14 Pages 2581—2593
DOI https://doi.org/10.2147/DMSO.S308390
Checked for plagiarism Yes
Review by Single anonymous peer review
Peer reviewer comments 2
Editor who approved publication: Prof. Dr. Antonio Brunetti
Qian Liang,1– 3,* Haofei Hu,4,* Han Wu,1– 3 Xuan Chen,1– 3 Wei Wang,1– 3 Ying Le,1– 3 Shufen Yang,1– 3 Lijing Jia1– 3
1Department of Endocrinology, Shenzhen People’s Hospital, Shenzhen, 518020, Guangdong Province, People’s Republic of China; 2Department of Endocrinology, The First Affiliated Hospital of Southern University of Science and Technology, Shenzhen, 518020, Guangdong Province, People’s Republic of China; 3Department of Endocrinology, The Second Affiliated Hospital of Jinan University, Shenzhen, 518020, Guangdong Province, People’s Republic of China; 4Department of Nephrology, Shenzhen Second People’s Hospital, Shenzhen, 518000, Guangdong Province, People’s Republic of China
*These authors contributed equally to this work
Correspondence: Lijing Jia
Department of Endocrinology, Shenzhen People’s Hospital, 1017 Dongmen North Road, Luohu District, Shenzhen, Guangdong Province, People’s Republic of China
Email [email protected]
Background: Diabetic kidney disease often presents as increased urine albumin to creatinine ratio (UACR). 25-hydroxyvitamin D (25(OH)D) is considered as the best indicator of vitamin D status. Previous studies have shown that 25(OH)D is related to the UACR. However, evidence concerning the connection between 25(OH)D and UACR is still limited in the Chinese population.
Materials and Methods: A total of 549 participants with type 2 diabetes were enrolled in the study from Shenzhen People’s Hospital, China. The participants were grouped by the tertiles of 25(OH)D level. The association between 25(OH)D and UACR was examined by multiple linear regression. A generalized additive model (GAM) was used to verify a non-linear relationship. We conducted a subgroup analysis to evaluate the robustness of the results.
Results: After adjusting for relevant variables, 25(OH)D was negatively correlated with UACR (β = − 8.7, 95% CI (− 12.0, − 5.4)). A non-linear relationship was discovered between 25(OH)D and UACR, and the 25(OH)D threshold was 67. The effect sizes and confidence intervals on the left and right sides of the inflection point were − 13.9 (− 18.2, − 9.6) and 8.9 (− 1.1, 18.9), respectively. Subgroup analysis showed a stronger correlation could be detected in males. The same trend also could be found in patients older than 70 years old, those with using ACEI/ARB, with history of hypertension, with SBP ≥ 140 mmHg and eGFR < 60 mL/min/1.73m2.
Conclusion: The relationship between 25(OH)D and UACR is non-linear. 25(OH)D was negatively related to UACR when 25(OH)D is less than 67 nmol/L.
Keywords: 25-hydroxyvitamin D, urine albumin to creatinine ratio, nonlinearity
Introduction
Diabetes mellitus (DM) has become one of the most common chronic diseases in the world. According to the diabetes atlas of the International Diabetes Federation (IDF) in 2019, there are approximately 463 million diabetics globally. With an average growth of 51%, the number of cases in China has reached 116.4 million, ranking first in the world.1 Diabetic kidney disease (DKD) is the most common microvascular complication in type 2 diabetes mellitus (T2DM), and it is leading the cause of chronic kidney disease (CKD) and end-stage renal disease (ESRD).2 The American Diabetes Association (ADA) defines DKD as chronic kidney disease caused by diabetes, which is typically marked by an estimated glomerular filtration rate (eGFR) less than 60 mL/(min ·1.73m2), or UACR higher than 30mg/g for more than 3 months duration.3 Once DKD is diagnosed, the mortality rate will increase significantly.4 Therefore, early detection and screening of DKD is of great practical significance to delay its progress.5
25(OH)D is synthesized by 25-hydroxylase catalyzing vitamin D, which is considered as the best indicator of vitamin D status.6 Growing studies have suggested that vitamin D can stimulate insulin synthesis and secretion, so the low level of serum 25(OH)D is linked to impaired glucose and insulin metabolism. Vitamin D supplementation can help alleviate insulin resistance.7–10 Increased UACR is the main clinical characteristic of DKD, and it can reflect the early kidney changes in T2DM.3 In recent years, researchers have revealed that the level of serum 25(OH)D is closely related to DKD, and vitamin D deficiency is an independent risk factor for DKD.11,12 The Third National Health and Nutrition Examination Survey (NHANES III) found that vitamin D deficiency would increase the risk of albuminuria.13 A meta-analysis presented that vitamin D supplementation can reduce UACR in chronic kidney disease.14 Previous studies have shown that the intrarenal renin-angiotensin system (RAS) is the crucial mediator of progressive renal injury, especially proteinuria in DKD.15 Vitamin D receptor (VDR) mediates the activity of vitamin D, and both VDR agonists and RAS inhibitors can delay the progress of DKD and reduce urine protein in a diabetic mouse model.16,17 Diabetic mice with a VDR deletion mutation end up with severe renal damage due to increased RAS activity in the kidney.18
Some researchers have revealed that serum 25(OH)D is negatively correlated with UACR,19,20 but they did not investigate the linear and nonlinear relationships between 25(OH)D and UACR in T2DM. Therefore, our research set out to study whether 25(OH)D is independently linked to UACR and the deeper relationships between 25(OH)D and UACR in T2DM from China. Our findings may provide evidence for enhanced DKD prevention and treatment in the Chinese population.
Methods
Research Design and Selected Participants
A cross-sectional study was performed to address the relationship between 25(OH)D and UACR in our research. The target-independent variable is serum 25(OH)D, and the dependent variable is UACR. The data of participants with T2DM were non-selectively and consecutively collected from Endocrinology Department, Shenzhen People’s Hospital, Shenzhen, China. The data in the database was anonymous in order to protect participants’ privacy. Data is stored in the hospital’s electronic medical record system. Since this is a cross-sectional study, the possibility of selection bias and observation bias is reduced. The hospital institutional review board agreed and approved the implementation of the study. For such research, according to national laws and institutional requirements, no formal consent is required. The study also preserved patients’ privacy and kept it confidential in accordance with the Declaration of Helsinki.21 A total of 765 participants were involved in the study before we screened participants according to inclusion and exclusion criteria. The participants were selected if they 1) were diagnosed with T2DM consistent with the 1999 World Health Organization (WHO) diagnostic criteria, 2) were > 18 years old when first diagnosed with diabetes, 3) did not experience any hemodialysis or peritoneal dialysis treatment, and 4) had complete records of both 25(OH)D and UACR. The exclusion criteria included: uremia, malignancy, stroke, cardiovascular disease, renal transplant, renal vascular disease, urinary tract obstruction, hyperparathyroidism, hypoparathyroidism, abnormal calcium metabolism and pregnancy. None of the participants received calcium supplementation, vitamin D supplementation, anti-osteoporosis therapy, or hormone replacement therapy. Finally, 549 participants were selected for the data analysis based on the inclusion and exclusion criteria.
General Clinical Features
We reviewed the medical history of each patient. We recorded the following date: gender, age, diabetic duration, family history of diabetes, history of hypertension, Angiotensin-Converting Enzyme Inhibition/Angiotensin Receptor Blocker (ACEI/ARB) use, sodium-glucose cotransporter 2 (SGLT-2) inhibitor use, glucagon-like peptide 1 (GLP-1) receptor agonists use, weight, height, systolic blood pressure (SBP), and diastolic blood pressure (DBP). After resting for at least 20 minutes on admission, SBP and DBP were measured at the right brachial artery by using mercury. Height and weight were obtained using standard procedures. According to the general standard, body mass index (BMI) is calculated by weight (kg)/height (m2).
Laboratory Measurements
After fasting for at least 8 hours, the venous blood was collected to detect serum 25(OH)D level, fasting blood glucose (FBG), glycosylated hemoglobin (HbA1c), fasting C peptide (FCP), serum uric acid (SUA), serum creatinine (SCr), serum calcium, total cholesterol (TC), triglyceride (TG), high-density lipoprotein (HDL), and low-density lipoprotein (LDL) in the clinical laboratory of Shenzhen People’s Hospital. Estimated glomerular filtration rates (eGFR) were calculated using SCr levels determined by the simplified MDRD formula as follows: eGFR [mL/(min ·1.73m2)]=186 × (SCr/88.4) − 1.154 × age − 0.203 for male, and eGFR was multiplied by 0.742 for female. Enzymatic methods were applied to measure FBG, SCr, SUA, TG, TC, HDL, and LDL. HbA1c was determined by high-performance liquid chromatography, and FCP was measured by radioimmunoassays. Determination of serum calcium level by ion electrode method. Electrochemiluminescence was used to determine 25(OH)D. We use the LIAISON chemiluminescence analyzer to detect 25(OH)D. The instrument was provided by Stillwater, Minnesota, America. We use 25-hydroxy total vitamin D control set to ensure the precision, accuracy and performance, in accordance with the operation manual of the automatic chemiluminescence analyzer. According to the NCCLS-EP5-A2 and the American Clinical Laboratory Standardization Institute (CLSI), precision verification was carried out. At the same time, the accuracy was verified by the RIQAS international inter-office quality assessment. So, the performance of the instrument can be objectively evaluated. The morning urine samples of participants were collected for 2 consecutive days, and the UACR levels were measured by immunoturbidimetry. The mean UACR of 2 days was used for analysis.
Ankle brachial index (ABI) was measured by an automatic waveform analyzer (Parry Medical Technology, PERIMED AB, PF5001, Sweden).
The vibration perception threshold (VPT) was measured by a digital vibration threshold detector (Dimeidel Technology, Sensiometer A200, Beijing, China). When VPT was < 10V, it was defined as fine; 10V ≤ VPT < 15V was defined as mild; 15V ≤ VPT < 25V was defined as moderate; VPT ≥ 25V was defined as severe. ABI and VPT were measured by the same nurse in the Endocrinology Department.
Statistical Analysis
The first step was to deal with missing values for other variables. If the missing data were continuous variables, we would supplement them with mean or median. If they were categorical variables, we treated the missing data as a new set of categorical variables, which was represented by NA.22
Then, all the participants were stratified by tertiles of 25(OH)D. Continuous variables were expressed as mean ± standard deviation (normal distribution) or median (quartile) (skewed distribution). Categorical variables were expressed as frequency or percentages. One-way ANOVA (normal distribution), Kruskal–Wallis H (skewed distribution) test and chi-square tests (categorical variables) were used to identify the differences among different 25(OH)D groups. We use the multiple linear regression model to study the effect of 25(OH)D on UACR, and 95% confidence intervals (CI) of adjusted effect size (β) were used to describe the level of UACR. At the same time, we presented the results of not adjusted, partially adjusted, and completely adjusted models based on the recommendation of the STROBE statement.23 When the corresponding effect size (β) changed by at least 10%, the covariances needed to be adjusted.24 We also performed a sensitivity analysis to verify the robustness of the data analysis. We converted the 25(OH)D value into a categorical variable by tertile in order to calculate the P for trend. Because 25(OH)D was a continuous variable, we also tried to use the generalized additive model (GAM) to identify the nonlinear relationship between 25(OH)D and UACR. If the relationship was nonlinear, a two-piecewise linear regression model was performed to calculate the threshold effect of 25(OH)D on UACR based on the smoothing plot. When the relationship between 25(OH)D and the UACR level began to change and became conspicuous in a smoothed curve, the recursion algorithm would automatically calculate the saturation level of 25(OH)D, where the maximum model likelihood will be used. In addition, the best model was determined by the P-value of log-likelihood ratio tests. If the P-value of the log-likelihood ratio test was less than 0.05, it was judged that there was a significant difference between the linear fitting model and the non-linear fitting model, and the non-linear fitting model was needed to calculate the relationship between 25(OH)D and UACR. We also used hierarchical interaction analysis to further explore the robustness of the results in different subgroups (gender, age, diagnostic duration, ACEI/ARB use, SGLT-2 inhibitor use, GLP-1 receptor agonists use, history of hypertension, SBP, DBP, and eGFR). We converted continuous variables into categorical variables based on clinical point cut or binary. In addition to the stratification factors themselves, each stratification was adjusted for all affected factors. The likelihood ratio test was used to examine the modification and interaction of each subgroup.
All of the analyses were performed with the statistical software package R (http://www. R-project.org, The R Foundation) and Empower-Stats (http://www.empowerstats.com, X&Y Solutions, Inc., Boston, MA). P values less than 0.05 were considered statistically significant.
Results
Selected Participants
We collected information from T2DM aged 18–90 years old hospitalized in the Endocrinology Department of Shenzhen People’s Hospital from July 2018 to April 2019. Finally, 549 patients were included in the study based on the strict inclusion and exclusion criteria (Figure 1).
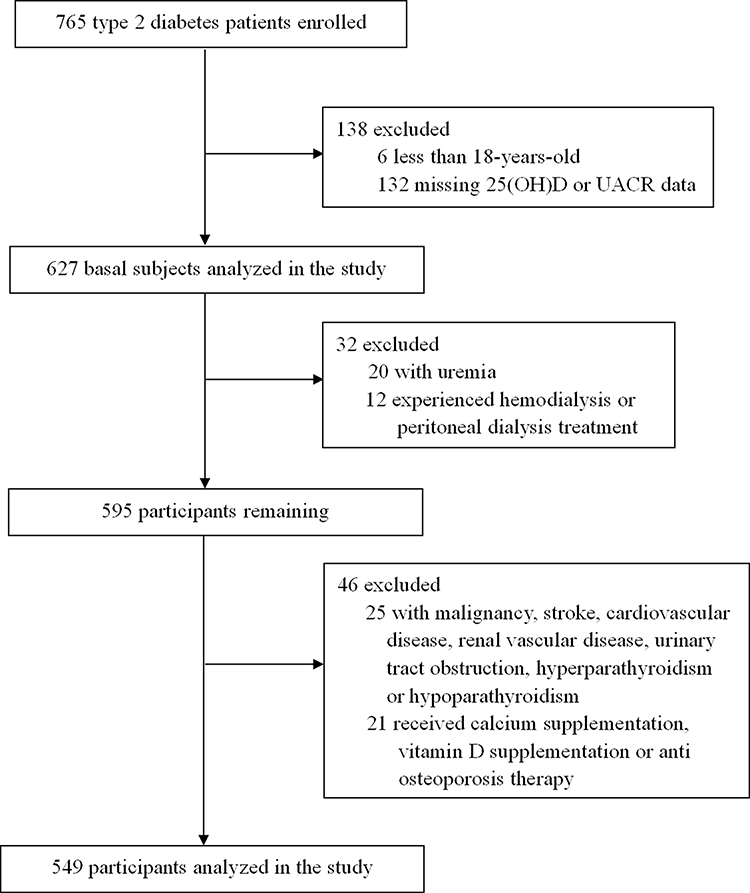 |
Figure 1 Flowchart of research participants selection. |
Baseline Characteristics
The average age of participants included in the study was 58 ± 12 years old, of which 61.4% were male, and 38.6% were female. The average level of 25(OH)D is 53.6 nmol/L, and the average level of UACR is 217.4 mg/g. The missing data of other indicators are as follows, 5 missing HbA1c, 14 missing SUA, 3 missing TG, TC, HDL, LDL, 22 missing VPT, and 28 missing ABI. We divided the participants into subgroups using the 25(OH)D tertiles (≤ 46.2, 46.3–61.3, > 61.3). The baseline characteristics of the 549 participants by tertiles of 25(OH)D levels are displayed in Table 1. We found that patients with the highest 25(OH)D levels commonly had lower UACR, FBG, HbA1c, TG, TC, and LDL levels, while they had a longer diabetes duration, higher HDL and ABI (right). No Statistical significances were found in gender, age, blood pressure (both SBP and DBP), BMI, FCP, SCr, eGFR, serum calcium, SUA, ABI (left), family history of diabetes, history of hypertension, ACEI/ARB use, SGLT-2 inhibitor use, GLP-1 receptor agonists use and VPT among the different 25(OH)D groups.
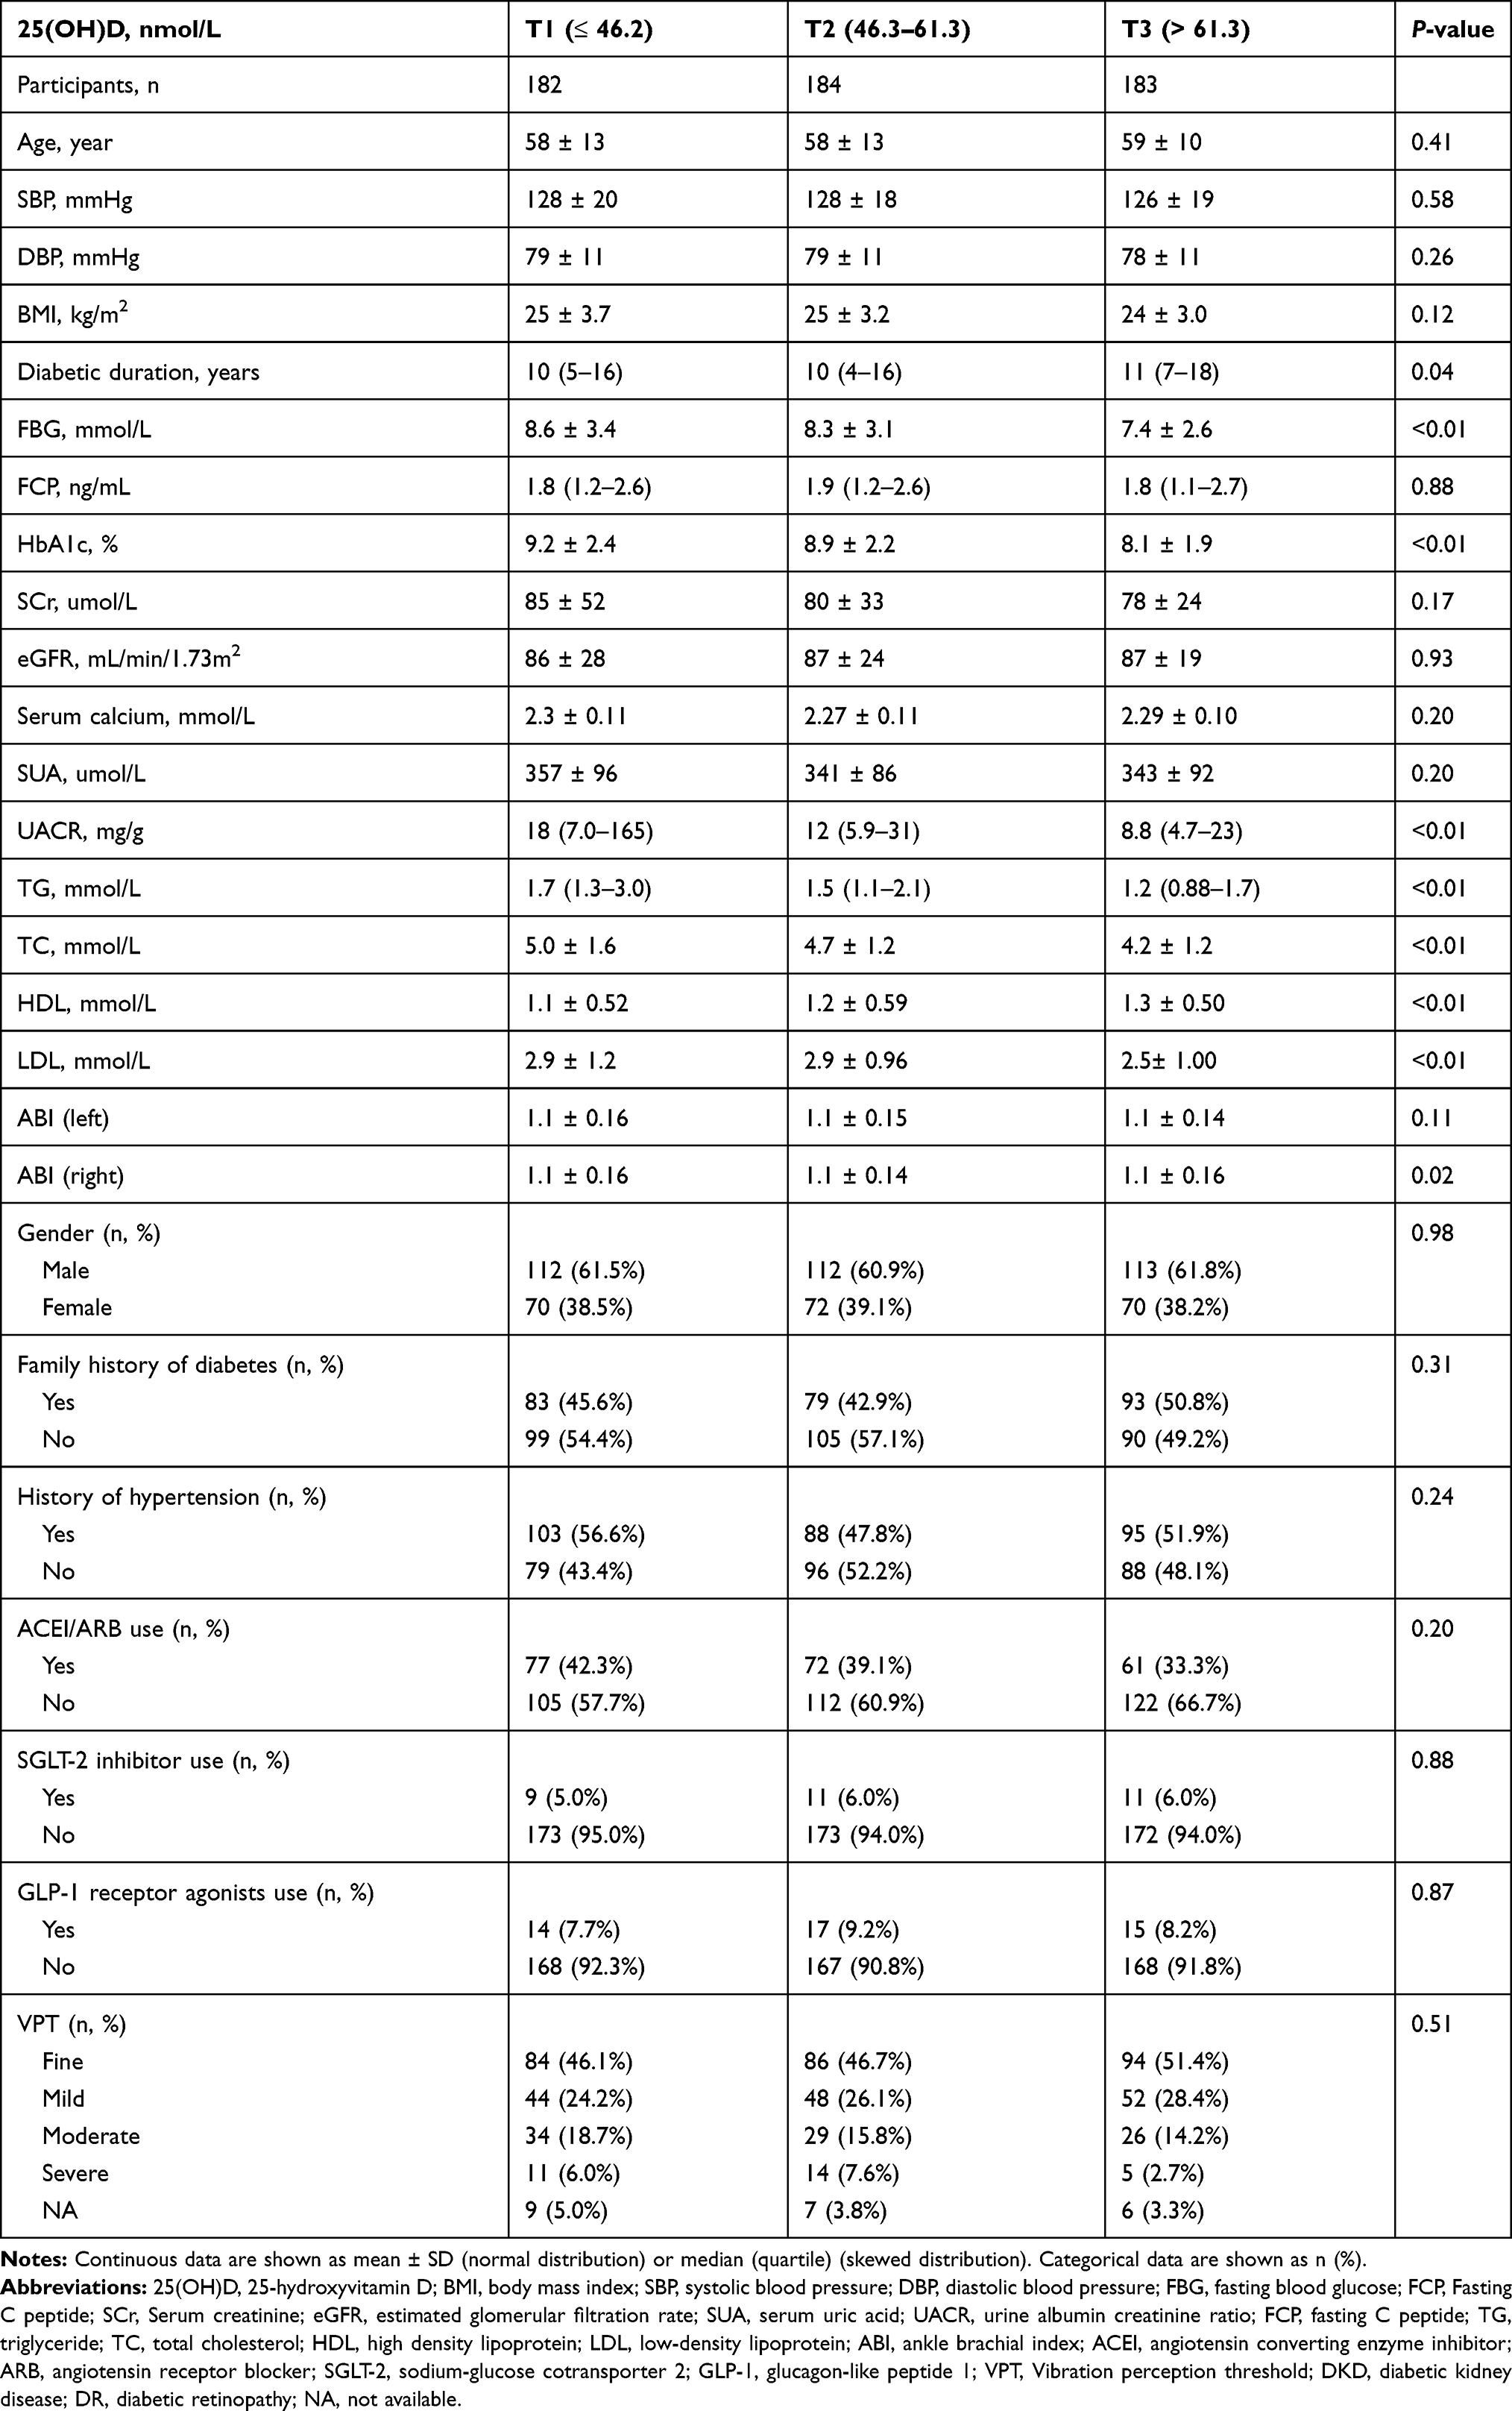 |
Table 1 The Baseline Characteristics of Participants According to 25(OH)D Tertiles |
Univariate Analysis
The univariate analysis is presented in Table 2. We found SBP, DBP, FCP, SCr, SUA, TG, TC, and LDL levels were positively correlated with UACR, while 25(OH)D, eGFR and ABI (left and right) were negatively correlated with UACR. Furthermore, we found that females had lower UACR levels than males, but the history of hypertension and using ACEI/ARB had higher UACR levels.
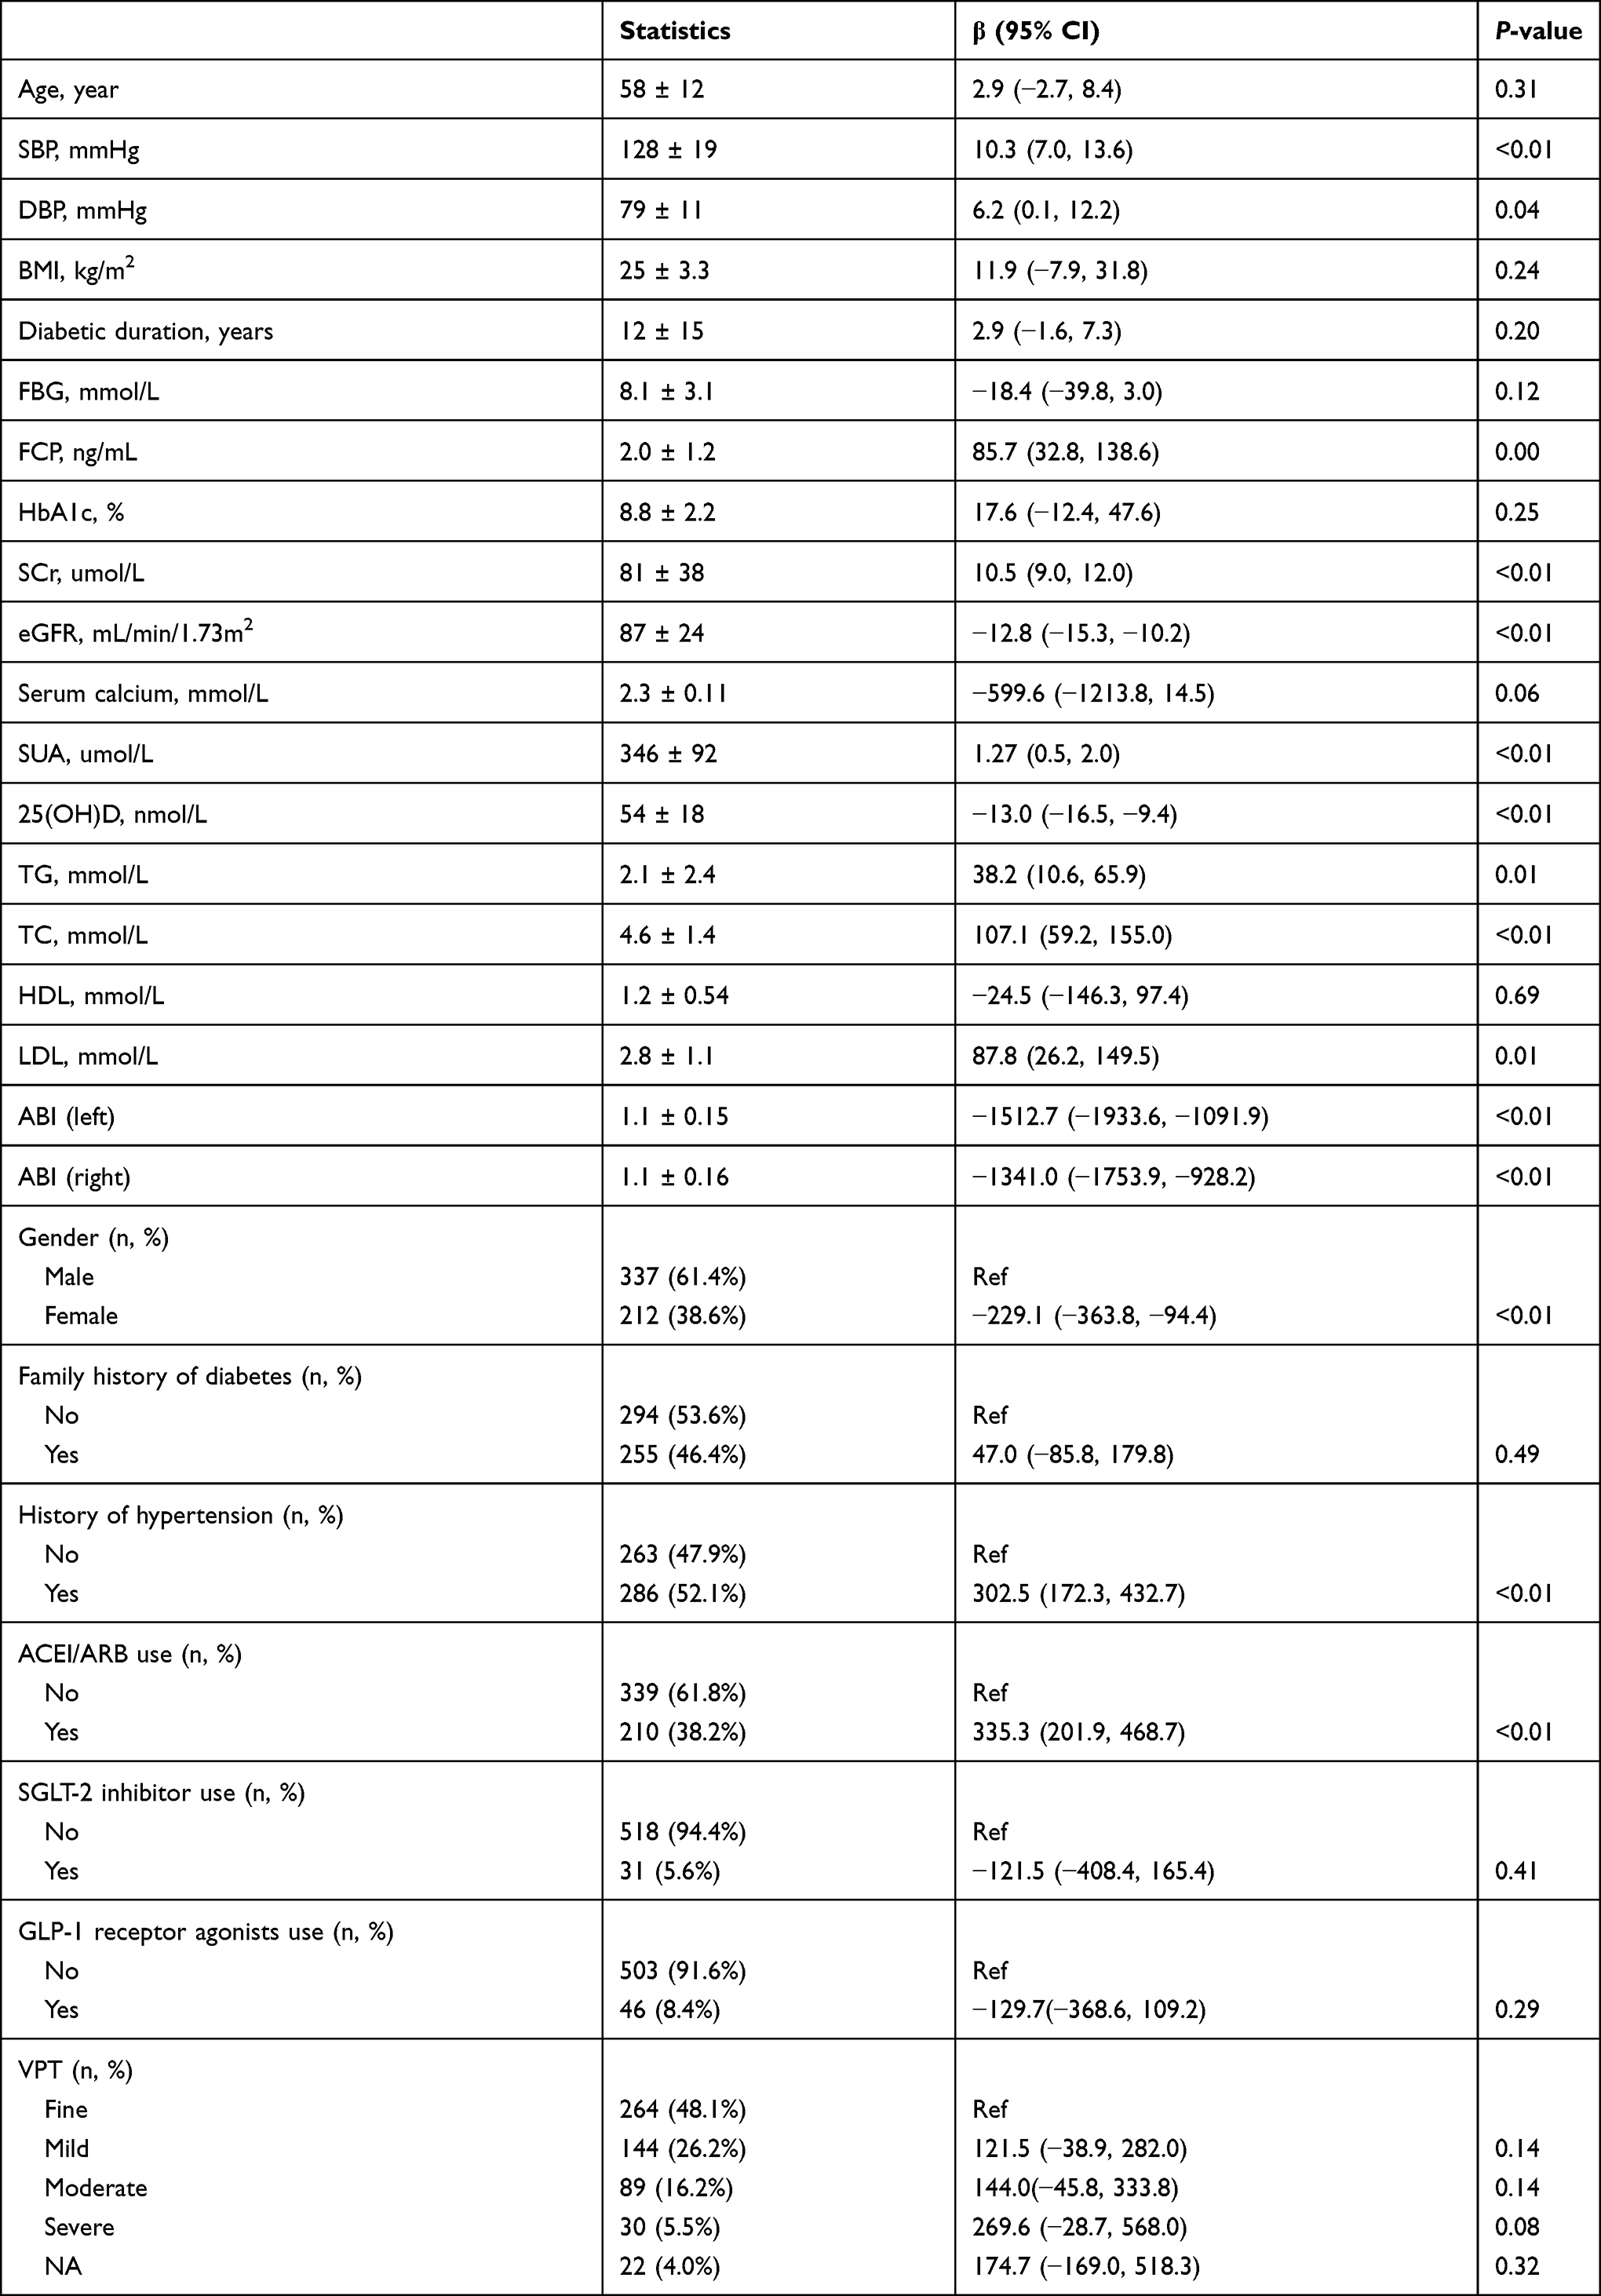 |
Table 2 The Results of Univariate Analysis of UACR |
The Relationship Between 25(OH)D and UACR
A multiple linear regression model was used to evaluate the relationship between 25(OH)D and UACR, including not adjusted and adjusted models, which are shown in Table 3. 25(OH)D showed a negative correlation with UACR (β= −13.0, 95% confidence interval (CI): −16.5 to −9.4, P <0.01) in the crude model. Compared with the crude model, model I (adjusted gender, age) showed no obvious changes (β= −13.0, 95% CI: −16.5 to −9.4, P<0.01). In model II, after adjusting for all variables (adjusted gender, age, diabetic duration, history of hypertension, ACEI/ARB use, SGLT-2 inhibitor use, GLP-1 receptor agonists use, FBG, FCP, SBP, DBP, SCr, serum calcium, TG, LDL, SUA, ABI, and VPT), we still found the same correlation (β= −8.7, 95% CI: (−12.0 to −5.4, P<0.01). In other words, for every 1 nmol/L increased in 25(OH)D, UACR decreased by 8.7 mg/g. For the sake of sensitivity analysis, we also used 25(OH)D as a categorical variable (tertiles). In model II, compared with the T1 (reference group), the estimated decrease of UACR in the T2 and T3 were 197.9 and 253.5, respectively, and we found that the trend between the tertiles was significant (P for trend was <0.01). The results were not consistent with the results of 25(OH)D as a continuous variable. The non-equidistant variation of the effect size indicated that there might be a nonlinear relationship between 25(OH)D and UACR.
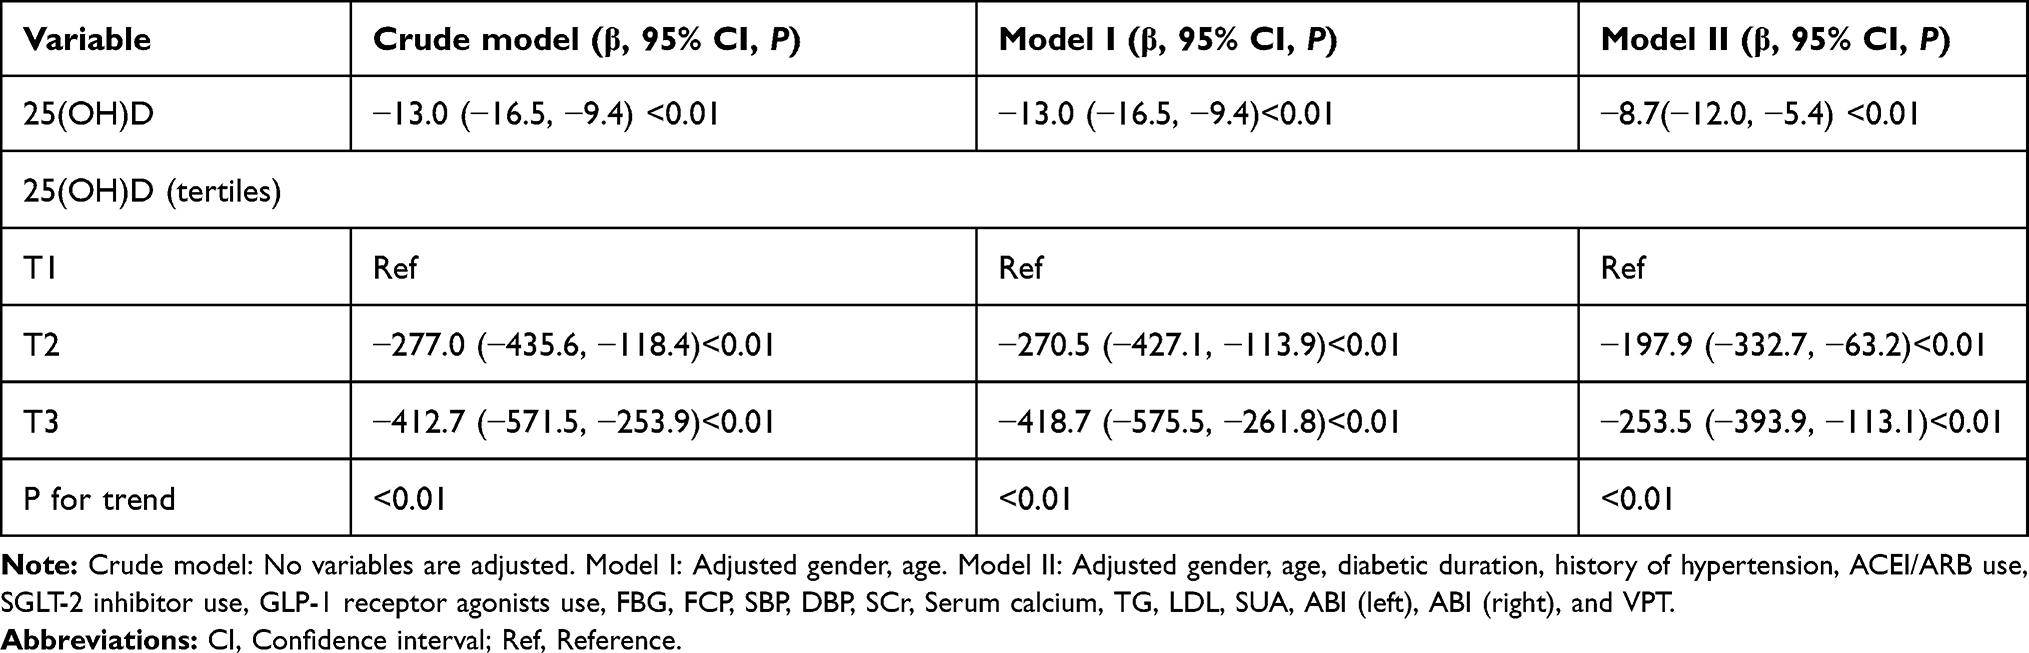 |
Table 3 Relationship Between 25(OH)D and UACR in Different Models of Multivariate Analysis |
Non-Linear Relationship Between 25(OH)D and UACR
In this study, as 25(OH)D is a continuous variable, we also used the generalized additive model (GAM) to judge if it existed a non-linear relationship between 25(OH)D and UACR. The smooth curve through the analysis of GAM showed that 25(OH)D had a non-linear relationship with UACR (adjusted for gender, age, diabetic duration, history of hypertension, ACEI/ARB use, SGLT-2 inhibitor use, GLP-1 receptor agonists use, FBG, FCP, SBP, DBP, SCr, serum calcium, TG, LDL, SUA, ABI (left), ABI (right), and VPT) (Figure 2). We compared the linear regression model and two-stage linear regression to analyze the relationship between 25(OH)D and UACR. The P for the log-likelihood ratio is less than 0.01 (Table 4). We detected that the inflection point of 25(OH)D was 67 in a two-stage linear regression model. On the left side of the inflection point, 25(OH)D was negatively correlated with UACR (β= −13.9, 95% CI: −18.2 to −9.6, P < 0.01), while on the right side, no association was found between 25(OH)D and UACR (β= 8.9, 95% CI: −1.1 to 18.9, P=0.08).
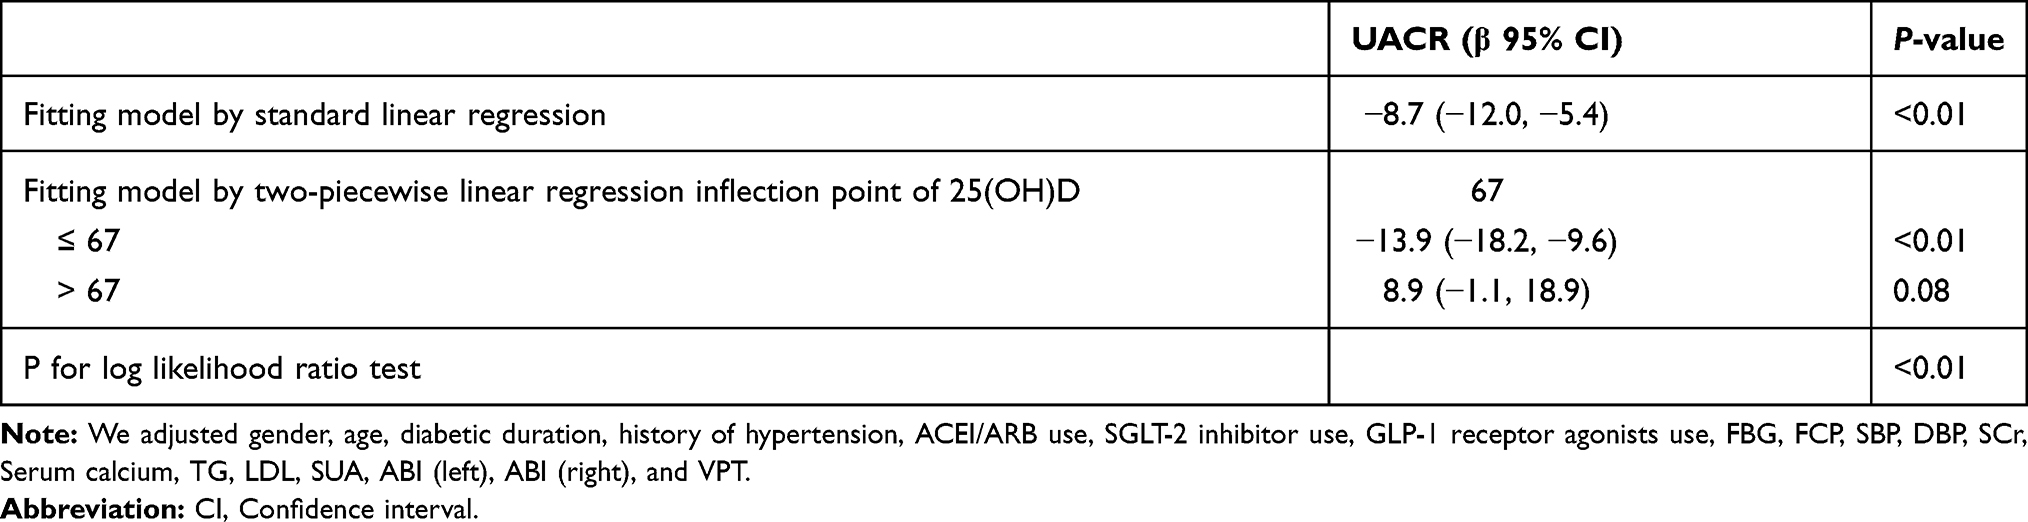 |
Table 4 Two-Piecewise Linear Regression Model to Evaluate Relationship Between 25(OH)D and UACR |
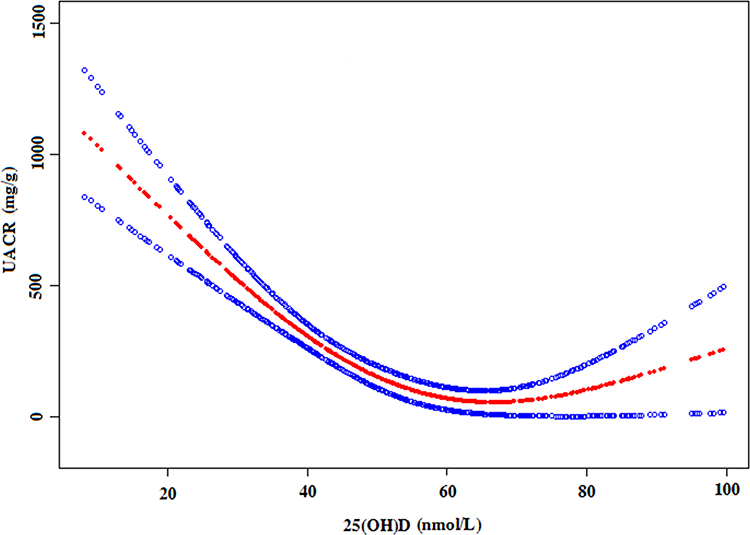 |
Figure 2 The non-linear relationship between 25(OH)D and UACR. |
Subgroup and Interaction Analysis
We explored other factors that might affect the association between 25(OH)D and UACR by subgroup analysis. We used gender, age, diabetic duration, ACEI/ARB use, SGLT-2 inhibitor use, GLP-1 receptor agonists use, history of hypertension, SBP, DBP, and eGFR as stratified variables to explore the trend of effect sizes in these variables (Figure 3). We found interactions for gender, age, ACEI/ARB use, history of hypertension, SBP, and eGFR (all P values for interaction < 0.05). Stronger associations between 25(OH)D and UACR were present in the male, ≥ 70 years old, patients with ACEI/ARB use, patients with history of hypertension, patients with SBP ≥140 mmHg, and patients with eGFR < 60mL/min/1.73m2. Weaker associations were apparent in females, ≥ 50 and < 60 years old, patients with no ACEI/ARB use, patients with no history of hypertension, patients with SBP <140mmHg, and patients with eGFR ≥ 60 mL/min/1.73m2.
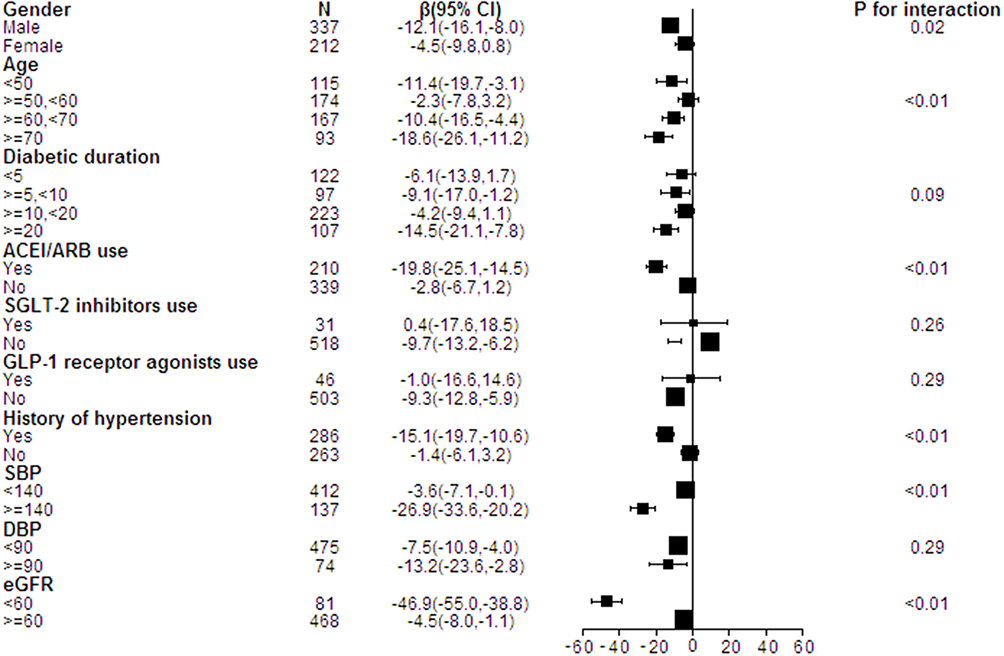 |
Figure 3 Forest plots for subgroup analysis and interaction analysis of 25(OH)D on UACR. |
Discussion
The findings revealed 25(OH)D was negatively associated with UACR in T2DM after adjusting for relevant variables in a linear regression model. When 25(OH)D increased by 1 nmol/L, UACR decreased by 8.7 mg/g. In addition, for the sake of sensitivity analysis, we also discovered that 25(OH)D had a non-linear relationship with UACR because the trend of the effect sizes was inconsistent between the two sides of the GAM model [left (β= −13.9, 95% CI: −18.2 to −9.6, P < 0.01); right (β= 8.9, 95% CI: −1.1 to 18.9, P=0.08)]. Our result indicated a saturation effect on the independent correlation between 25(OH)D and UACR. And we obtained the threshold of 25(OH)D was 67 nmol/L. When 25(OH)D < 67 nmol/L, 25(OH)D were negatively correlated with UACR, 25(OH)D increased by 1nmol/L, UACR decreased by 13.9mg/g. While 25(OH)D > 67 nmol/L, the correlation between 25(OH)D and UACR was no significant. Subgroup analysis was used to better understand trends in serum 25(OH)D and UACR levels in different populations. Stronger associations were noted for males, ≥70 years old, patients with ACEI/ARB use, with history of hypertension, SBP ≥140 mmHg, and patients with eGFR < 60mL/min/1.73m2. Weaker associations were noticed in females, ≥50 and < 60 years old, patients with no ACEI/ARB use, with no history of hypertension, SBP <140mmHg, and patients with eGFR ≥ 60 mL/min/1.73m2.
Serum 25(OH)D level test has been generally acknowledged as the most reasonable indicator of vitamin D status. At present, it is generally accepted that serum 25(OH)D <50 nmol/L is vitamin D deficiency, 50–75 nmol/L is insufficiency, and > 75nmol/L is sufficient.25 According to this standard, it is estimated that approximately 50–80% of the global population suffers from vitamin D deficiency or insufficiency due to aging, diet composition, insufficient sun exposure, reduced outdoor exercise and other causes.26 The phenomenon of vitamin D deficiency or insufficiency is especially common in China, and it varies greatly from region to region.27–30 Existing studies have indicated that low serum 25(OH)D level was associated with increased risk of macrovascular, microvascular disease events, and peripheral neuropathy in T2DM.31,32 25(OH)D level is closely related to the occurrence of diabetic complications.
In recent years, studies have illustrated the relationship between 25(OH)D and UACR. Some prospective observational studies have reported that vitamin D supplementation can significantly reduce UACR in T2DM in the United Kingdom.33 A multinational, placebo-controlled, double-blind trial came to the same conclusion.34 In the Chinese population, Wan et al suggested that lower serum 25(OH)D concentrations were significantly associated with increased UACR in a sample of 4767 diabetic participants in a cross-sectional study after adjusting for potential confounders.35 Similar findings were also reported in the studies of Peng and Xie et al in China.17,36 Our multiple linear regression model showed a significant and strong association between 25(OH)D and UACR, consistent with these findings. However, some additional studies are inconsistent with our findings. Joergensen et al reported that severe vitamin D deficiency was not associated with UACR in two prospective observational follow-up studies.37,38 We analyzed the researches that are inconsistent with our findings. We speculated that the different results might be due to the following factors: 1) the study population and methods were diverse. The inconsistent studies were prospective observational studies in Denmark. 2) These other studies did not clarify the non-linear relationship between 25(OH)D and UACR. 3) Compared with our work, these studies did not take into account the effect of FCP, SBP, DBP, diabetic duration, history of hypertension, ACEI/ARB use, SGLT-2 inhibitor use, GLP-1 receptor agonists use, TG, LDL, SUA, ABI, and VPT on 25(OH)D and UACR. However, previous studies have confirmed that these variables are related to 25(OH)D and UACR. Ultimately, our findings further confirmed that 25(OH)D is significantly associated with UACR in a Chinese cohort.
Several mechanisms could explain the association between the 25(OH)D and DKD. In vitro, compared with diabetic wild-type mice, vitamin D receptor knockout diabetic mice had more severe proteinuria and glomerulosclerosis, which occurred via thickening of the glomerular basement membrane coupled with elevated production of renin and angiotensinogen.38 Furthermore, 25(OH)D can decrease proteinuria by suppressing the renin-angiotensin system (RAS) and TGF-β in mesangial and juxtaglomerular cells.39 Ruster et al reported that 25(OH)D partially antagonized nuclear factor κB activation induced by advanced glycation end products (AGEs) in mouse podocytes.40
In the present study, we used a two-piecewise linear regression model to show a nonlinear relation between 25(OH)D and UACR. We found the inflection point obtained from GAM after adjusting for potential confounders (gender, age, diabetic duration, history of hypertension, ACEI/ARB use, SGLT-2 inhibitor use, GLP-1 receptor agonists use, FBG, FCP, SBP, DBP, SCr, serum calcium, TG, LDL, SUA, ABI (left), ABI (right), and VPT) was 67 nmol/L. Our study shows that only when serum 25(OH)D concentration is below 67 nmol/L, the level of UACR will increase. Herrmann et al indicated that patients with 25(OH)D concentration <50 nmol/L had a higher incidence of macrovascular and microvascular complications than those ≥ 50 nmol/L.31 This is somewhat similar to our study, suggesting that vitamin D deficiency may increase UACR levels. Our study is helpful to remind the type 2 diabetes patients with 25(OH)D below 67 nmol/L to pay more attention to prevent the occurrence of diabetic kidney disease. The clinical value of this study can be expressed in the following aspects: 1) as far as we know, it is the first time a nonlinear relation between 25(OH)D and UACR in patients with T2DM has been observed, and 2) the result of the study will be helpful to establish a diagnostic or predictive model of DKD in the future.
Our research has the following advantages: 1) we emphasized the nonlinearity in the study, which was consistent with previous studies41,42 and better illustrated the relationship between dose and response. 2) Since these results are susceptible to potential confounding factors, rigorous statistical adjustment was used to minimize residual confounders. 3) We examined 25(OH)D as both a continuous and categorical variable to reduce the contingency in the data analysis and enhance the results’ robustness. 4) Subgroup and interaction analysis make better use of the data, allowing for a stable conclusion.
Of course, potential limitations should be acknowledged. Firstly, our study is a cross-sectional study, so the causal relationship between 25(OH) D and UACR cannot be confirmed. Secondly, as our study is a single-center study, the results may not apply to the entire Chinese population. Thirdly, we lacked multiple measurements of UACR to increase the stability and specificity of the data. Fourth, potential confounding factors affecting 25(OH)D levels, such as sun exposure, outdoor exercise, nutritional status, dietary habits, seasonal alternation, serum phosphorus, and parathyroid hormone, were not included in this analysis. Finally, other unknown confounding factors affect the results, such as magnesium,43 so larger and more rigorous design studies are still needed.
In conclusion, we found that the relationship between 25(OH)D and UACR is non-linear. When the 25(OH)D level was lower than 67 nmol/L, 25(OH)D had a significantly negative correlation with UACR. When it was higher than 67 nmol/L, the negative correlation between the two was disappeared. Besides, stronger associations were found in males, ≥ 70 years old, those with ACEI/ARB use, with history of hypertension, SBP ≥140 mmHg, and patients with eGFR < 60mL/min/1.73m2. However, additional multicenter, prospective, and randomized controlled studies are needed to further explore the causal relationship between 25(OH)D and UACR to provide an even clearer scientific understanding of such relationships to apply this knowledge to the treatment and prevention of DKD.
Acknowledgments
Our study was supported by the National Nature Science Foundation of China (grant number 81550035), Shenzhen Science and Technology Innovation Commission (grant number JCYJ20160422150209240), Discipline Construction Ability Enhancement Project of Shenzhen Municipal Health and Family Planning Commission (grant number SZXJ2017031).
Disclosure
The authors declare that there is no conflict of interest.
References
1. International Diabetes Federation. IDF DIABETES ATLAS, 9th edition 2019. Available from: https://www.diabetesatlas.org/en/.
2. Collins AJ, Foley RN, Herzog C, et al. US renal data system 2010 annual data report. Am J Kidney Dis. 2011;57(1):A8,e1–526. doi:10.1053/j.ajkd.2010.10.007
3. Tuttle KR, Bakris GL, Bilous RW, et al. Diabetic kidney disease: a report from an ADA consensus conference. Am J Kidney Dis. 2014;64(4):510–533. doi:10.1053/j.ajkd.2014.08.001
4. Afkarian M, Sachs MC, Kestenbaum B, et al. Kidney disease and increased mortality risk in type 2 diabetes. J Am Soc Nephrol. 2013;24(2):302–308. doi:10.1681/ASN.2012070718
5. Park CW. Diabetic kidney disease: from epidemiology to clinical perspectives. Diabetes Metab J. 2014;38(4):252–260. doi:10.4093/dmj.2014.38.4.252
6. Borella E, Nesher G, Israeli E, et al. Vitamin D: a new anti-infective agent? Ann N Y Acad Sci. 2014;1317(1):76–83. doi:10.1111/nyas.12321
7. Talaei A, Mohamadi M, Adgi Z. The effect of vitamin D on insulin resistance in patients with type 2 diabetes. Diabetol Metab Syndr. 2013;5(1):8. doi:10.1186/1758-5996-5-8
8. Mirhosseini N, Vatanparast H, Mazidi M, et al. The effect of improved serum 25-hydroxyvitamin D status on glycemic control in diabetic patients: a meta-analysis. J Clin Endocrinol Metab. 2017;102(1):3097–3110. doi:10.1210/jc.2017-01024
9. Danescu LG, Levy S, Levy J, et al. Vitamin D and diabetes mellitus. Endocrine. 2009;35(1):11–17. doi:10.1007/s12020-008-9115-5
10. Meis M, Grant William B. Linking the metabolic syndrome and obesity with vitamin D status: risks and opportunities for improving cardiometabolic health and well-being. Diabetes Metab Syndr Obes. 2019;12(1):1437–1447. doi:10.2147/DMSO.S176933
11. Jung C, Kim KJ, Kim BY, et al. Relationship between vitamin D status and vascular complications in patients with type 2 diabetes mellitus. Nutr Res. 2016;36(2):117–124. doi:10.1016/j.nutres.2015.11.008
12. Cigolini M, Iagulli MP, Miconi V, et al. Serum 25-Hydroxyvitamin D3 concentrations and prevalence of cardiovascular disease among type 2 diabetic patients. Diabetes Care. 2006;7(3):722–724. doi:10.1016/S1567-5688(06)80267-9
13. De BIH, Ioannou GN, Kestenbaum B, et al. 25-hydroxyvitamin D levels and albuminuria in the Third National Health and Nutrition Examination Survey (NHANESIII). Am J Kidney Dis. 2007;50(1):69–77. doi:10.1053/j.ajkd.2007.04.015
14. Xu L, Wan X, Huang Z, et al. Impact of vitamin D on chronic kidney diseases in non-dialysis patients: a meta-analysis of randomized controlled trials. PLoS One. 2013;8(4):e61387. doi:10.1371/journal.pone.0061387
15. Cao Z, Cooper ME. Pathogenesis of diabetic nephropathy. J Diabetes Investig. 2011;2(4):243–247. doi:10.1111/j.2040-1124.2011.00131.x
16. Deb DK, Sun T, Wong KE, et al. Combined vitamin D analog and AT1 receptor antagonist synergistically block the development of kidney disease in a model of type 2 diabetes. Kidney Int. 2010;77(11):1000–1009. doi:10.1038/ki.2010.22
17. Xie S, Huang L, Cao W, et al. Association between serum 25-hydroxyvitamin D and diabetic kidney disease in Chinese patients with type 2 diabetes. PLoS One. 2019;14(4):e0214728. doi:10.1371/journal.pone.0214728
18. Wang Y, Deb DK, Zhang Z, et al. Vitamin D receptor signaling in podocytes protects against diabetic nephropathy. J Am Soc Nephrol. 2012;23(12):1977–1986. doi:10.1681/ASN.2012040383
19. Kondo M, Toyoda M, Miyatake H, et al. The prevalence of 25-hydroxyvitamin D deficiency in Japanese patients with diabetic nephropathy. Intern Med. 2016;55(18):2555–2562. doi:10.2169/internalmedicine.55.6346
20. Fernández-Juárez G, Luño J, Barrio V, et al. 25 (OH) vitamin D levels and renal disease progression in patients with type 2 diabetic nephropathy and blockade of the renin-angiotensin system. Clin J Am Soc Nephrol. 2013;8(11):1870–1876. doi:10.2215/CJN.00910113
21. Guimarães RRP, Santos A, Santos A, et al. Reuse of clinical records for scientific research: legal issues related to the authorization of the holders and anonymisation. Acta Med Port. 2018;31(6):299–302. doi:10.20344/amp.10147
22. Erviti J, Alonso A, Oliva B, et al. Oral bisphosphonates are associated with increased risk of subtrochanteric and diaphyseal fractures in elderly women: a nested case–control study. BMJ Open. 2013;3(1):e002091. doi:10.1136/bmjopen-2012-002091
23. Yokoyama M, Watanabe T, Otaki Y, et al. Association of the aspartate aminotransferase to alanine aminotransferase ratio with BNP level and cardiovascular mortality in the general population: the yamagata study 10-year follow-up. Dis Markers. 2016;2016:4857917. doi:10.1155/2016/4857917
24. Von Elm E, Altman Douglas G, Matthias E, et al. Strengthening the Reporting of Observational Studies in Epidemiology (STROBE) statement: guidelines for reporting observational studies. BMJ. 2007;335(7624):806–808. doi:10.1136/bmj.39335.541782.AD
25. Holick MF, Binkley NC, Bischoff-Ferrari HA, et al. Evaluation, treatment, and prevention of vitamin D deficiency: an Endocrine Society clinical practice guideline. J Clin Endocrinol Metab. 2011;96(7):1911–1930. doi:10.1210/jc.2011-0385
26. Van Schoor N, Lips P. Global overview of Vitamin D Status. Endocrinol Metab Clin North Am. 2017;46(4):845–870. doi:10.1016/j.ecl.2017.07.002
27. Fang F, Wei H, Wang K, et al. High prevalence of vitamin D deficiency and influencing factors among urban and rural residents in Tianjin, China. Arch Osteoporos. 2018;13(1):64. doi:10.1007/s11657-018-0479-8
28. Chen J, Yun C, He Y, et al. Vitamin D status among the elderly Chinese population: a cross-sectional analysis of the 2010–2013 China national nutrition and health survey (CNNHS). Nutr J. 2017;16(1):3–8. doi:10.1186/s12937-016-0224-3
29. Ning Z, Song S, Miao L, et al. High prevalence of vitamin D deficiency in urban health checkup population. Clin Nutr. 2016;35(1):859–863. doi:10.1016/j.clnu.2015.05.019
30. Man P, van der Meer IM, Lips P, et al. Vitamin D status and bone mineral density in the Chinese population: a review. Arch Osteoporos. 2016;11(1):14. doi:10.1007/s11657-016-0265-4
31. Herrmann M, Sullivan DR, Veillard AS, et al. Serum 25-hydroxyvitamin D: a predictor of macrovascular and microvascular complications in patients with type 2 diabetes. Diabetes Care. 2015;38(3):521–528. doi:10.2337/dc14-0180
32. He R, Hu Y, Zeng H, et al. Vitamin D deficiency increases the risk of peripheral neuropathy in Chinese patients with type 2 diabetes. Diabetes Metab Res Rev. 2017;33(2):1–9. doi:10.1002/dmrr.2820
33. Kim MJ, Frankel AH, Donaldson M, et al. Oral cholecalciferol decreases albuminuria and urinary TGF-β1 in patients with type 2 diabetic nephropathy on established renin-angiotensin-aldosterone system inhibition. Kidney Int. 2011;80(8):851–860. doi:10.1038/ki.2011.224
34. de Zeeuw D, Agarwal R, Amdahl M, et al. Selective vitamin D receptor activation with paricalcitol for reduction of albuminuria in patients with type 2 diabetes (VITAL study): a randomised controlled trial. Lancet. 2010;376(9752):1543–1551. doi:10.1016/S0140-6736(10)61032-X
35. Wan H, Wang Y, Zhang K, et al. Associations between vitamin D and microvascular complications in middle-aged and elderly diabetic patients. Endocr Pract. 2019;25(1):809–816. doi:10.4158/EP-2019-0015
36. Peng Y, Li L. Serum 25-hydroxyvitamin D level and diabetic nephropathy in patients with type 2 diabetes mellitus. Int Urol Nephrol. 2015;47(6):983–989. doi:10.1007/s11255-015-0983-3
37. Joergensen C, Gall MA, Schmedes A, et al. Vitamin D levels and mortality in type 2 diabetes. Diabetes Care. 2010;33(10):2238–2243. doi:10.1007/s11172-006-0546-y
38. Joergensen C, Hovind P, Schmedes A, et al. Vitamin D levels, microvascular complications, and mortality in type 1 diabetes. Diabetes Care. 2011;34(5):1081–1085. doi:10.2337/dc10-2459
39. Zhang Z, Sun L, Wang Y, et al. Renoprotective role of the vitamin D receptor in diabetic nephropathy. Kidney Int. 2008;73(2):163–171. doi:10.1038/sj.ki.5002572
40. Rüster C, Franke S, Reuter S, et al. Vitamin D3 partly antagonizes advanced-glycation endproducts-induced NFκB activation in mouse podocytes. Nephron. 2016;134(1):105–116. doi:10.1159/000448106
41. Zheng JS, Imamura F, Sharp SJ, et al. Association of plasma vitamin d metabolites with incident type 2 diabetes: EPIC-interact case-cohort Study. J Clin Endocrinol Metab. 2019;104(4):1293–1303. doi:10.1210/jc.2018-01522
42. Ekmekcioglu C, Haluza D, Kundi M. 25-hydroxyvitamin d status and risk for colorectal cancer and type 2 diabetes mellitus: a systematic review and meta-analysis of epidemiological Studies. Int J Environ Res Public Health. 2017;14(2):127. doi:10.3390/ijerph14020127
43. Dai Q, Zhu X, Manson JE, et al. Magnesium status and supplementation influence vitamin D status and metabolism: results from a randomized trial. Am J Clin Nutr. 2018;108(6):1249–1258. doi:10.1093/ajcn/nqy274
 © 2021 The Author(s). This work is published and licensed by Dove Medical Press Limited. The full terms of this license are available at https://www.dovepress.com/terms.php and incorporate the Creative Commons Attribution - Non Commercial (unported, v3.0) License.
By accessing the work you hereby accept the Terms. Non-commercial uses of the work are permitted without any further permission from Dove Medical Press Limited, provided the work is properly attributed. For permission for commercial use of this work, please see paragraphs 4.2 and 5 of our Terms.
© 2021 The Author(s). This work is published and licensed by Dove Medical Press Limited. The full terms of this license are available at https://www.dovepress.com/terms.php and incorporate the Creative Commons Attribution - Non Commercial (unported, v3.0) License.
By accessing the work you hereby accept the Terms. Non-commercial uses of the work are permitted without any further permission from Dove Medical Press Limited, provided the work is properly attributed. For permission for commercial use of this work, please see paragraphs 4.2 and 5 of our Terms.