Back to Journals » Infection and Drug Resistance » Volume 19
A Nomogram to Predict Day-7 Total Bilirubin in Hepatitis B Virus-Related Cirrhosis: An Early Treatment-Response Assessment Tool
Authors Yang Y, He C, Yang Y, Zhao Y, Dong X, Liang D ![]()
Received 24 March 2026
Accepted for publication 15 June 2026
Published 30 June 2026 Volume 2026:19 611768
DOI https://doi.org/10.2147/IDR.S611768
Checked for plagiarism Yes
Review by Single anonymous peer review
Peer reviewer comments 2
Editor who approved publication: Dr Oliver Planz
Yinghao Yang,1 Changning He,2 Yang Yang,3 Yuanyuan Zhao,3 Xiaofeng Dong,1 Dong Liang1
1Department of Infectious Diseases, No.988 Hospital of Joint Logistic Support Force, Zhengzhou, People’s Republic of China; 2Department of Emergency Medicine, No.988 Hospital of Joint Logistic Support Force, Zhengzhou, People’s Republic of China; 3Department of Medical Service, No.988 Hospital of Joint Logistic Support Force, Zhengzhou, People’s Republic of China
Correspondence: Dong Liang, Department of Infectious Diseases, No.988 Hospital of Joint Logistic Support Force, 602 Zhengshang Road, Zhengzhou, 450000, People’s Republic of China, Email [email protected]
Purpose: To develop and validate a nomogram using routine admission indicators to predict total bilirubin on day 7 (TBil-Day7) in hepatitis B virus-related liver cirrhosis (HBV-LC) patients, enabling early identification of inadequate short-term TBil response and providing a reference for intensive treatment.
Material and Methods: We retrospectively enrolled 284 HBV-LC patients, randomly assigned 7:3 to training (n=198) and internal validation (n=86) cohorts. Candidate variables were clinical and laboratory parameters available within 24 hours of admission, with TBil-Day7 as the outcome. Predictors were selected via least absolute shrinkage and selection operator (LASSO) regression, and a multiple linear regression model was built and visualized as a nomogram. Model performance was evaluated using the coefficient of determination (R2), root mean square error (RMSE), mean absolute error (MAE), and the proportion of predicted values falling within ± 20 μmol/L of the observed TBil-Day7 values.
Results: LASSO regression identified four predictors: admission TBil, direct bilirubin (DBil), aspartate aminotransferase (AST), and international normalized ratio (INR). The prediction equation was: TBil-Day7 (μmol/L) = − 23.0159 + 0.5721×TBil + 0.5847×DBil + 0.0601×AST + 14.0707×INR. The training cohort had an R2 of 0.932. In the internal validation cohort, R2=0.75, RMSE=38.06 μmol/L, MAE=21.27 μmol/L, and 74.4% of predictions were within ± 20 μmol/L of actual values. The calibration curve showed good agreement between predicted and observed TBil-Day7.
Conclusion: This nomogram, incorporating four routine admission indicators (TBil, DBil, AST, INR), can predict TBil-Day7 in HBV-LC patients with reasonable accuracy. It facilitates early identification of high-risk patients with insufficient TBil decline and allows estimation of short-term treatment response at admission.
Keywords: LASSO, linear models, liver disease, prognosis
Introduction
Liver cirrhosis is the end stage of chronic liver disease, pathologically characterized by diffuse fibrosis, pseudolobule formation, and hepatic vascular remodeling.1,2 In China, chronic hepatitis B virus (HBV) infection remains the leading cause of cirrhosis, resulting in a substantial disease burden from HBV-related liver cirrhosis (HBV-LC).3,4 In 2021, the seroprevalence of HBsAg in the general Chinese population was 3.0%, with an estimated 43.3 million individuals still living with HBV infection, of whom approximately 5 million had progressed to HBV-LC.5,6 As cirrhosis advances, patients may progress to the decompensated stage, manifesting severe complications such as hepatic encephalopathy and esophagogastric variceal bleeding.7,8 Globally, cirrhosis accounted for approximately 2.4% of all deaths in 2019.9
In patients with decompensated cirrhosis, precipitating factors such as infection, bleeding, and drug-induced liver injury frequently trigger acute-on-chronic liver failure (ACLF), leading to rapid clinical deterioration.10,11 Among those hospitalized non-electively for acute decompensation, approximately 30% develop ACLF either at admission or during their hospital stay. Once ACLF develops, the 28-day and 90-day mortality rates are as high as 32.8% and 51.2%, respectively.12 The early phase of hospitalization represents a golden window for deciding whether to initiate intensive therapies such as artificial liver support.13 However, there is currently a lack of quantitative criteria to guide such therapeutic escalation. The widely used Child-Pugh and Model for End-Stage Liver Disease (MELD) scores are primarily designed to assess 3- to 6-month mortality risk and hepatic functional reserve, limiting their ability to provide early warning of disease severity and treatment response in the short term (eg, within 1–2 weeks of admission)14,15 Therefore, a tool that leverages routine admission data to predict short-term treatment response is urgently needed.
Total bilirubin (TBil) is a core biomarker reflecting hepatocyte injury and metabolic function.16 During the progression of cirrhosis, hepatocyte dysfunction and necrosis impair bilirubin uptake, conjugation, and excretion, leading to a persistent elevation in serum TBil.17 The TBil level not only indicates disease severity but also serves as an intuitive marker of treatment response: a progressive decline in TBil generally suggests therapeutic efficacy, whereas a sustained increase signals ineffective intervention and ongoing liver injury. One study employed latent class mixed models to identify three distinct bilirubin trajectories in patients with HBV-related ACLF—declining, stable, and fluctuating—and demonstrated that trajectory classification enhanced the discriminatory performance of conventional prognostic scores.18 Another study integrated baseline characteristics with the dynamic changes in biomarkers to construct a dynamic prediction model for ACLF, which significantly outperformed traditional scores in predicting 90-day prognosis at day 3, week 1, and week 2 of admission.19
The aforementioned work has largely focused on utilizing longitudinal changes in bilirubin to predict long-term mortality. However, a critical gap remains: whether the total bilirubin on day 7 (TBil-Day7) can be accurately predicted within the first 24 hours of admission. Day 7 serves as the first complete observation window in clinical practice for assessing early treatment response and deciding on treatment adjustments (eg, initiating artificial liver support, adjusting antibiotics, or modifying hepatoprotective strategies). Thus, early prediction of total bilirubin on day 7 (TBil-Day7) within the first 24 hours of admission would enable identification of patients with a poor response. If TBil-Day7 can be reliably estimated at admission, a patient’s anticipated response to initial therapy could be assessed in advance. For those predicted to have an inadequate decline in bilirubin, there would still be a vital opportunity to initiate intensive interventions such as artificial liver support, potentially altering the disease trajectory.
To address this gap, we retrospectively analyzed the medical records of hospitalized patients with HBV-LC. Our aim was to develop a prediction model using routine indicators available within the first 24 hours of admission—including sex, age, complete blood count, liver and kidney function tests, electrolytes, number of hepatoprotective agents, and Child-Pugh score—by selecting variables through least absolute shrinkage and selection operator (LASSO) regression. Using TBil-Day7, a single, continuous, and easily interpretable biomarker, as the prediction target, we constructed a nomogram. This tool enables clinicians to rapidly predict TBil-Day7 levels within the first 24 hours of admission, facilitating the early identification of patients with an insufficient TBil decline and providing a quantitative basis for the early consideration of intensive therapy (eg, artificial liver support) or timely adjustment of treatment regimens.
Materials and Methods
Study Population and Data Source
We retrospectively reviewed the medical records of patients with liver cirrhosis hospitalized at the 988th Hospital between January 2020 and December 2025. The inclusion criteria were as follows: (1) a clinical diagnosis of HBV-LC according to the Chinese Guidelines for Clinical Diagnosis, Treatment, and Management of Cirrhosis (2025);20 and (2) a hospital stay of at least 7 days, with complete liver function test results both on admission and on Day 7. The exclusion criteria were: (1) coexistence of hepatocellular carcinoma or other malignancies; (2) age < 18 or > 80 years, as well as pregnancy or lactation; and (3) missing key data. Ultimately, 284 patients were enrolled, forming the study cohort (Figure 1). All laboratory parameters were measured on the day of admission (Day 1) before any therapeutic interventions were initiated.
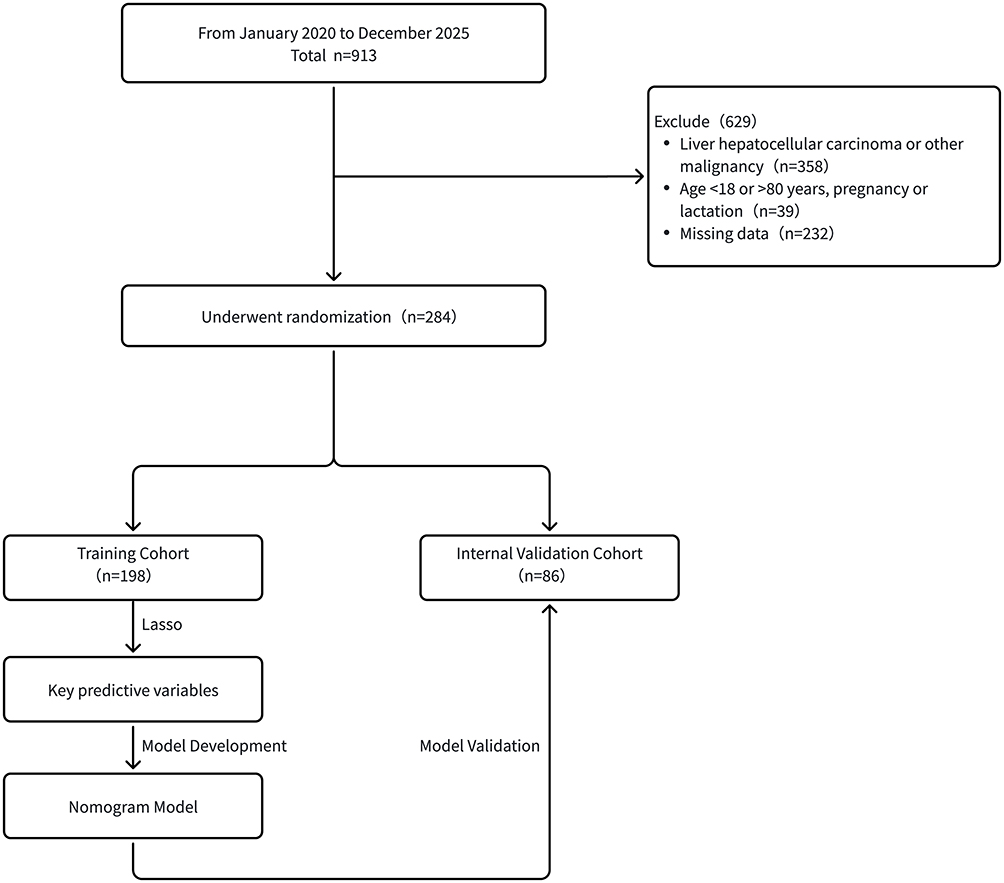 |
Figure 1 Flowchart of patient enrollment, exclusion, and cohort division. |
This study was conducted in accordance with the ethical principles of the Declaration of Helsinki (promulgated in 1975, 6th revision in 2008) and was approved by the Ethics Committee of the 988th Hospital (Approval No. PLA988LLSP20260206). The requirement for informed consent was waived due to the retrospective nature of the analysis. Patient data confidentiality was strictly maintained in accordance with the ethics committee requirements.
Data Collection and Outcome
The following variables, obtainable within the first 24 hours of admission, were extracted from the electronic medical record system: sex, age, and the first laboratory measurements upon admission—such as TBil, direct bilirubin (DBil), aspartate aminotransferase (AST), alanine aminotransferase (ALT), albumin, creatinine, international normalized ratio (INR), and other readily available laboratory parameters. Additionally, the number of hepatoprotective agents included in the initial treatment regimen established after admission was recorded. Based on our hospital’s electronic medical records, hepatoprotective agents included glutathione, ursodeoxycholic acid, ademetionine, polyene phosphatidylcholine, glycyrrhizic acid preparations (eg, magnesium isoglycyrrhizinate), silymarin, and N-acetylcysteine Each distinct hepatoprotective agent that is identified by its generic name was counted as one, regardless of dosage. If a patient received two different agents, even if they belong to the same therapeutic class such as two different glycyrrhizic acid preparations, they were counted as two. The Child-Pugh score, calculated from the initial laboratory tests, was also collected.21 All blood samples were obtained and analyzed on the day of admission before the initiation of any treatment.
The primary outcome measure was the total bilirubin level remeasured on Day 7 of hospitalization, designated as TBil-Day7, which served as an early surrogate endpoint for treatment response.
Statistical Analysis and Model Development
The 284 patients were randomly divided into a training cohort and an internal validation cohort at a 7:3 ratio. This split ratio is commonly adopted in prediction model studies to balance the need for sufficient training data to ensure model stability with the requirement for an independent sample to robustly evaluate model performance. Continuous variables were first tested for normality. Those following a normal distribution were presented as mean ± standard deviation and compared using the independent samples t-test; non-normally distributed variables were presented as median (Q1, Q3) and compared using the Mann–Whitney U-test. Categorical variables were expressed as counts (percentages) and compared using the chi-square (χ2) test.
In the training cohort, TBil-Day7 was set as the dependent variable, and all candidate variables available at admission were used as independent variables. After data standardization, variable selection was performed using LASSO regression (via the glmnet package in R, with alpha = 1).22 A 10-fold cross-validation procedure was employed to determine the optimal penalty parameter λ; the model corresponding to λ.min, which minimized the cross-validation error, was selected, and variables with non-zero coefficients were retained. The selected predictors were then entered into an ordinary least squares multiple linear regression model (using the ols function in the rms package) to derive unbiased regression coefficients and construct the final prediction model for nomogram development.
Nomogram Construction and Validation
The final linear regression model was visualized as a nomogram using the rms package in R. To verify model assumptions, scatter plots of predicted versus actual values, residuals versus fitted values, a histogram of residuals, and normal Q-Q plots were generated for the training cohort.
Model performance was evaluated in the independent internal validation cohort using the following metrics: the coefficient of determination (R2), root mean square error (RMSE), mean absolute error (MAE), mean bias, and the proportion of predicted values falling within ±20 μmol/L of the observed TBil-Day7 levels. The following plots were also generated to assess predictive performance: a scatter plot of residuals versus fitted values with a Lowess smooth line, a Bland-Altman plot, a scatter plot comparing predicted and observed values, a histogram of residuals with a kernel density curve, and a decile calibration plot.
All statistical tests were two-sided, and a P-value < 0.05 was considered statistically significant. The main analyses were performed using R software (version 4.2.3), with some baseline comparisons and supplementary graphics generated using IBM SPSS Statistics 24.0 and GraphPad Prism 8.0.
Results
Baseline Characteristics
A total of 284 patients were enrolled and randomly divided into a training cohort (198 patients, 69.72%) and an internal validation cohort (86 patients, 30.28%). The Shapiro–Wilk test was applied to assess the normality of continuous variables, and the detailed results are shown in Supplementary Table S1. The baseline characteristics of the two cohorts are summarized in Table 1. No statistically significant differences were observed in age, sex, or key admission laboratory parameters between the training and internal validation cohorts, indicating balanced randomization (all p > 0.05).
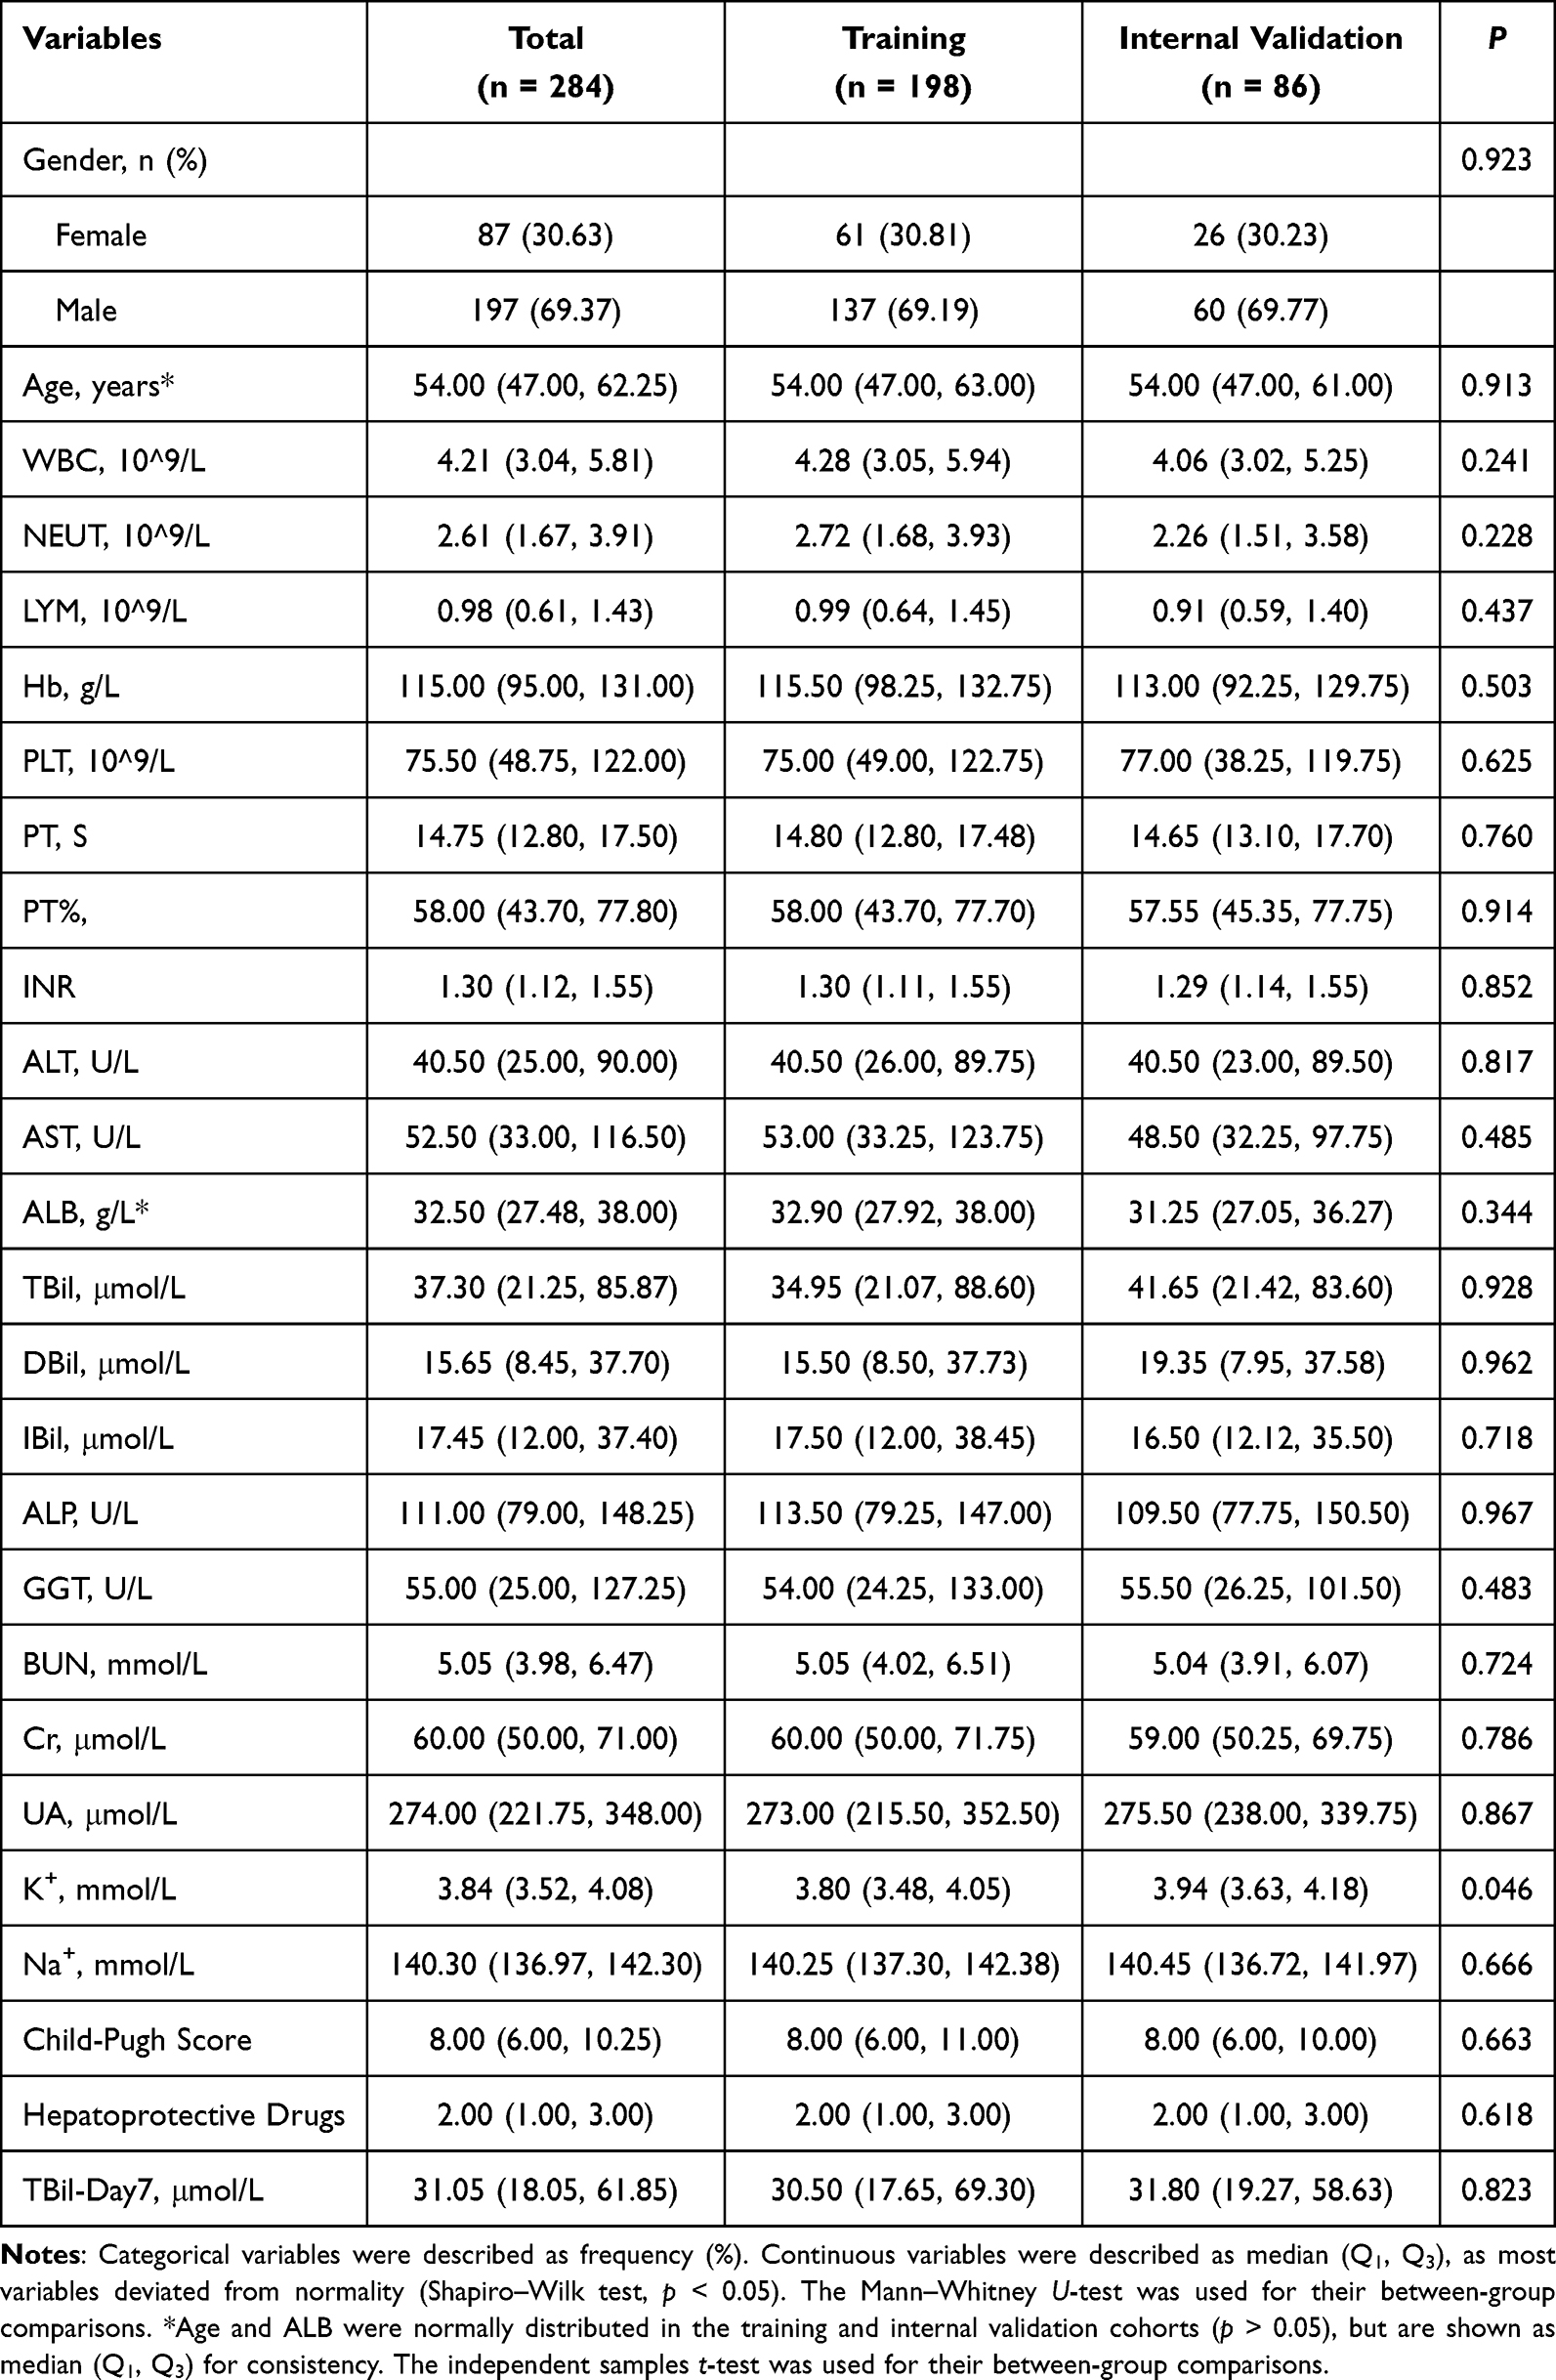 |
Table 1 Baseline Characteristics of the Total Cohort, Training Cohort, and Internal Validation Cohort |
Based on the diagnostic criteria in the Chinese Guidelines for Clinical Diagnosis, Treatment, and Management of Cirrhosis (2025),20 patients were further categorized into compensated cirrhosis and decompensated cirrhosis subgroups (Figure 2). Comparisons of clinical characteristics and laboratory findings between these subgroups (non-normally distributed, Mann–Whitney U-test) revealed significant differences in TBil, DBil, AST, INR, and TBil-Day7 (p < 0.05). In contrast, ALT did not differ significantly between the two subgroups (p = 0.444 in the training cohort; p = 0.800 in the internal validation cohort). Baseline characteristics of the subgroups are provided in Supplementary Tables S2 and S3.
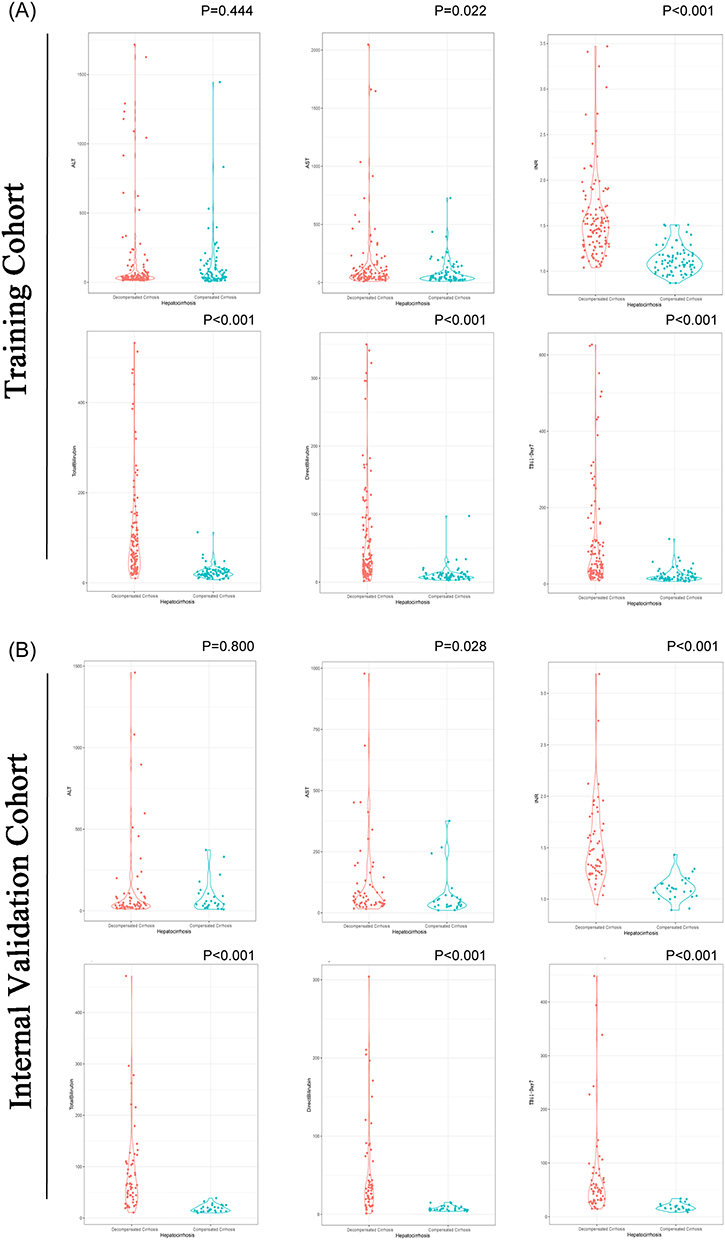 |
Figure 2 Distribution of Key Predictors in Compensated vs. Decompensated Cirrhosis. (A) Training cohort. (B) Internal validation cohort. Due to skewed distributions, all variables are shown as median (Q1, Q3) and between‑group comparisons were performed using the Mann‑Whitney U-test. Abbreviations are provided in the Abbreviations section at the end of the main text. |
Variable Selection and Model Development
In the training cohort, with TBil-Day7 as the dependent variable, all candidate admission variables were standardized and entered into a LASSO regression. Using 10-fold cross-validation, λ.min was selected, and four predictors with non-zero coefficients were retained (Figure 3): TBil, DBil, AST, and INR. Their LASSO coefficients are presented in Supplementary Table S4.
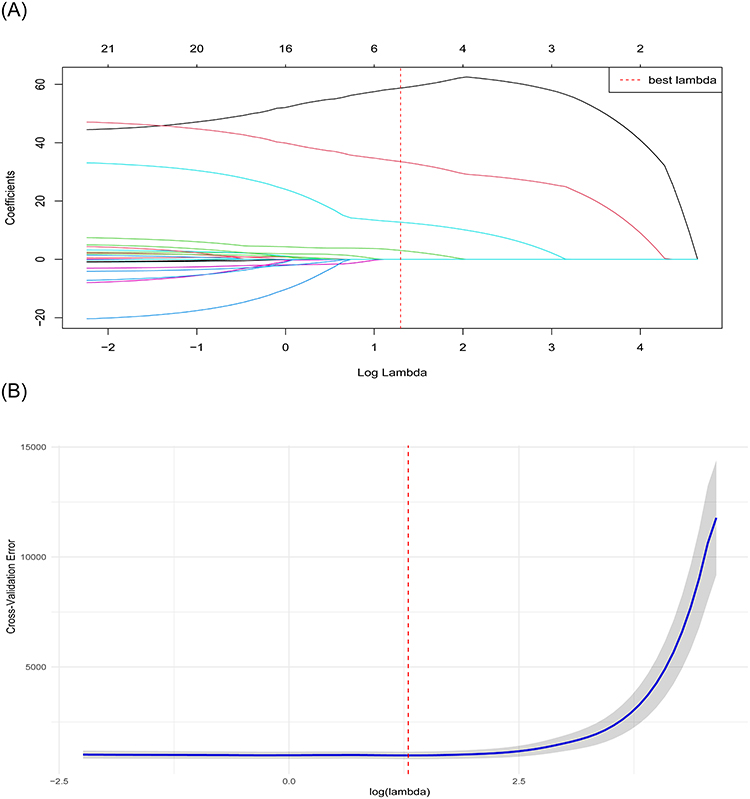 |
Figure 3 LASSO regression for variable selection. (A) Coefficient path plot. (B) Cross‑validation error plot. The optimal λ.min selected four predictors: TBil, DBil, AST, and INR. |
These four variables were subsequently entered into a multiple linear regression model. All four—TBil, DBil, AST, and INR—emerged as independent predictors of TBil-Day7 (all p < 0.05). The final prediction equation was:
TBil-Day7 (μmol/L) = −23.0159 + 0.5721 × TBil (μmol/L) + 0.5847 × DBil (μmol/L) + 0.0601 × AST (U/L) + 14.0707 × INR
Nomogram Construction
A nomogram was constructed based on the above regression model (Figure 4A). To use the nomogram, the value of each predictor (TBil, DBil, AST, and INR) is located on its respective axis, and a vertical line is drawn upward to the “Points” axis to obtain the individual score. The scores for all predictors are summed to yield the total points, from which a vertical line is then drawn downward to the “Predicted TBil-Day7” axis to read the corresponding predicted value.
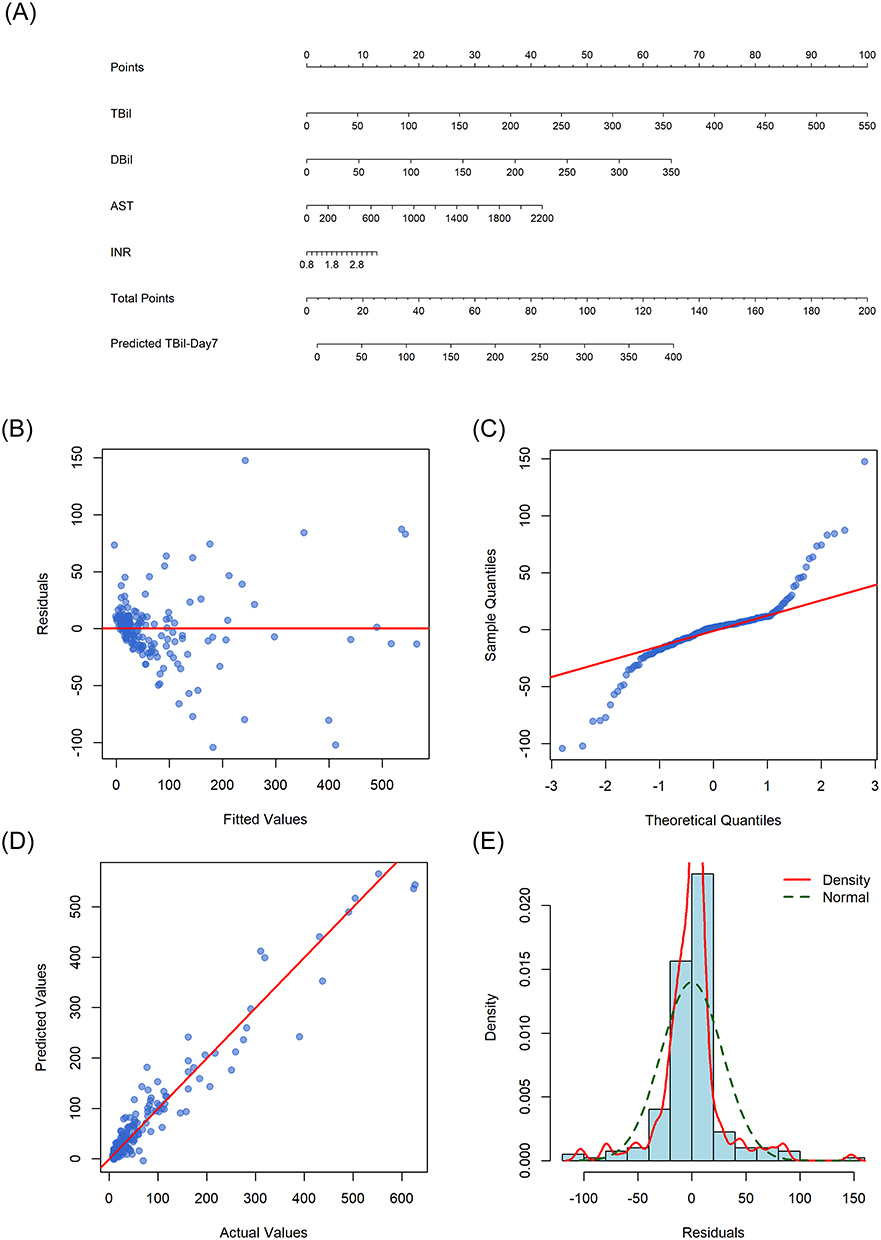 |
Figure 4 Nomogram and internal validation diagnostic plots for predicting day 7 total bilirubin in the training cohort. (A) Nomogram developed in the training cohort (n = 198) to predict day 7 total bilirubin (TBil‑Day7). (B) Residuals vs. fitted. (C) Q‑Q plot. (D) Predicted vs. actual. (E) Residual histogram. |
Model Performance and Internal Validation
In the training cohort, the model demonstrated excellent goodness-of-fit, with a coefficient of determination R2 = 0.932, RMSE = 28.388 μmol/L, and MAE = 17.297 μmol/L. The diagnostic plots for the training cohort (Figure 4B–E) suggested generally acceptable model fit, albeit with some minor deviations. The residuals were distributed around zero, though a slight increase in spread was observed at higher predicted values (Figure 4B). The normal Q-Q plot showed that most points followed the diagonal line, with only mild deviations at the tails (Figure 4C). The predicted versus actual values plot demonstrated a reasonable correlation, with most points clustering near the y = x line (Figure 4D). The histogram of residuals was roughly symmetric around zero and approximated a normal distribution (Figure 4E). Collectively, these findings indicated that the model assumptions were largely met, and the fit was considered acceptable for clinical prediction purposes, while acknowledging the presence of modest heteroscedasticity.
The model also demonstrated robust performance in the internal validation cohort. The residual-versus-fitted plot (Figure 5A) showed residuals randomly distributed around zero, with the Lowess smooth line approximately horizontal, suggesting no apparent systematic bias. The Bland-Altman plot (Figure 5B) revealed a mean difference (bias) of −6.3 μmol/L, indicating a mild systematic overestimation by the predicted values; the 95% limits of agreement ranged from −80.3 to 67.7 μmol/L, which was considered clinically acceptable The scatter plot of predicted versus actual TBil-Day7 values (Figure 5C) showed that the data points were closely distributed around the diagonal line, with a Pearson correlation coefficient of 0.888, R2 = 0.75, RMSE = 38.06 μmol/L, and MAE = 21.27 μmol/L. Regarding error distribution, the median absolute error was 10.689 μmol/L (interquartile range: 4.955–20.339 μmol/L). The clinical accuracy assessment revealed that 74.4% of the predicted values fell within ±20 μmol/L of the actual TBil-Day7 values. The histogram of residuals with the superimposed kernel density curve and a normal reference curve (Figure 5D) demonstrated an approximately normal distribution.
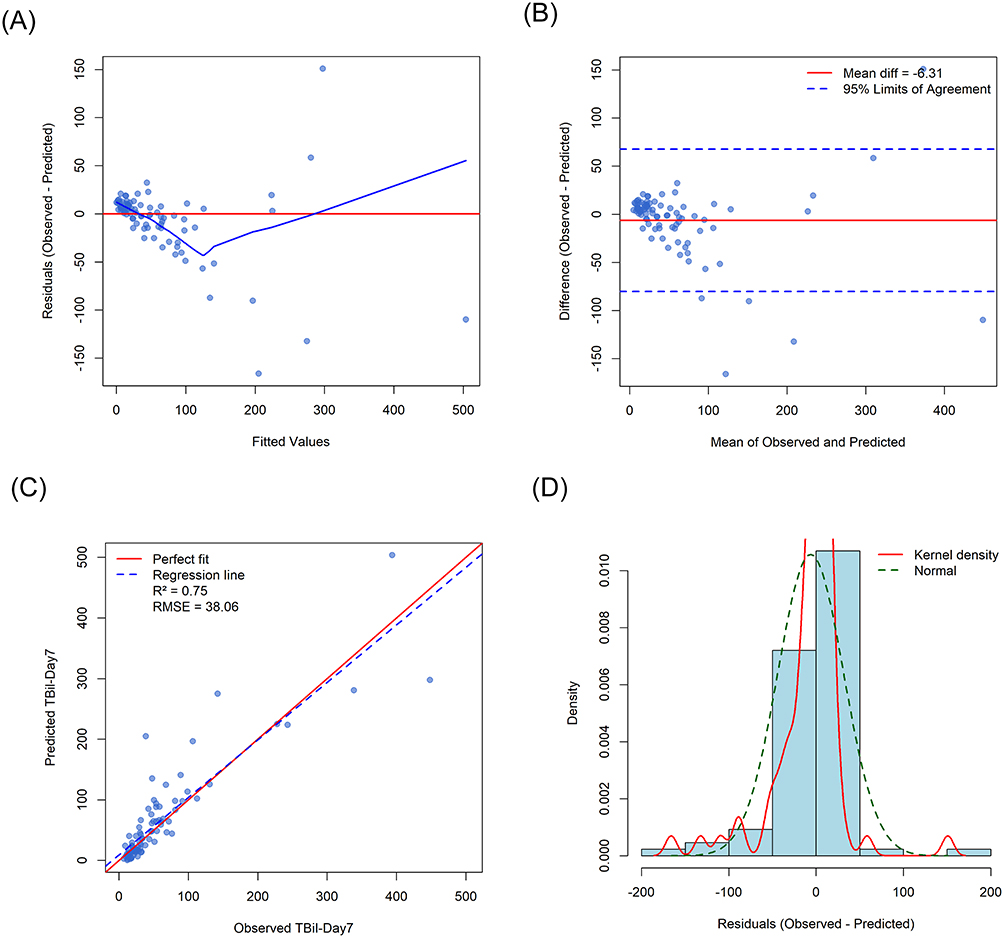 |
Figure 5 Model diagnostics and agreement analysis in the internal validation cohort. (A) Residuals vs. fitted. (B) Bland‑Altman. (C) Predicted vs. observed. (D) Residual histogram. |
Furthermore, the decile calibration plot for the internal validation cohort (Supplementary Figure S1) showed that the observed means of each decile closely followed the ideal diagonal line, confirming excellent calibration without obvious systematic over- or underestimation. Taken together, these metrics indicate that the nomogram has good predictive accuracy and calibration in the internal validation.
To visually illustrate the predictive accuracy at the individual level, we randomly selected 10 patients from the internal validation cohort and compared their predicted TBil-Day7 values with the corresponding actual measurements (Supplementary Table S5). Among these 10 patients, the median absolute error was 6.13 μmol/L, the mean absolute error was 16.23 μmol/L, the RMSE was 35.37 μmol/L, and the R2 was 0.893. These individual-level error metrics were largely consistent with those of the entire validation cohort, further supporting the practical utility of the nomogram in routine clinical decision-making.
Discussion
In this study, based on real-world data from hospitalized patients with HBV-LC, we developed and internally validated a nomogram model for predicting TBil-Day7. Through LASSO regression for variable selection and multiple linear regression for modeling, four routine indicators available on the day of admission were ultimately incorporated: TBil, DBil, AST, and INR. The model demonstrated robust predictive performance and satisfactory calibration in both the training and internal validation cohorts, providing a simple and intuitive quantitative tool for the early identification of patients with a poor initial treatment response.
Each of the four selected variables has a well-established pathophysiological basis. TBil and DBil directly reflect the degree of impairment in hepatic bilirubin uptake, conjugation, and excretion, serving as core markers of liver injury severity.23 A persistently elevated bilirubin level not only signals ongoing hepatocyte necrosis but is also closely associated with the liver’s regenerative capacity.24 Among the transaminases, AST has a longer half-life than ALT and is widely distributed in hepatocyte mitochondria, enabling it to more persistently and sensitively reflect hepatocyte injury and necrosis.25,26 This may explain why ALT was not retained in the final model.27 INR reflects the liver’s capacity to synthesize coagulation factors and is a classic indicator of hepatic insufficiency, having been incorporated into established prognostic scores such as the MELD score.28 The variables selected by LASSO regression align closely with clinical understanding, underscoring the intrinsic rationality of the variable selection process.
Beyond the clinical interpretability of the predictors, another key feature of this study lies in the choice of the prediction outcome. While many prediction models for complications and prognosis of LC patients have been developed, most are based on retrospective analysis of large public databases, such as Medical Information Mart for Intensive Care IV (MIMIC-IV).29–31 Typically, these models typically predict whether a patient will die during hospitalization, how long that patient may live after discharge, and whether there is a greater risk of particular complications, such as acute kidney injury or upper gastrointestinal bleeding.32,33 These outcomes are often binary or time-to-event in nature, and the methodologies used are predominantly logistic regression or Cox proportional hazards models.34,35
In daily clinical practice, however, physicians are not merely confronted with binary decisions such as whether a patient will survive. Instead, they continuously face questions such as: “Is the current treatment working? Will the bilirubin level rise or fall in the coming days? Should preparations for an invasive procedure such as artificial liver support be initiated now, or is a watch-and-wait approach more appropriate? Can this patient be discharged next week?” A model that provides a quantitative prediction of TBil-Day7—a key indicator of hepatic functional recovery—offers a tangible reference point for these everyday clinical decisions. The present study addresses this gap: by relying solely on the initial laboratory data obtained at admission, the expected TBil-Day7 can be calculated instantly at the bedside, substantially advancing the time window for clinical decision-making.
The model’s predictive performance robustly supports this clinical application. In the training cohort, R2 reached 0.932, while in the internal validation cohort, R2 was 0.75, with an RMSE of 38.06 μmol/L and an MAE of 21.27 μmol/L. The moderate decline in R2 from the training to the independent validation set is a normal phenomenon and, importantly, suggesting that the drop in performance is not clinically substantial. The calibration curve and Bland-Altman plot further confirmed the absence of significant systematic bias. With respect to clinical accuracy, 74.4% of predicted values fell within ±20 μmol/L of the observed values, and the median absolute error was only 10.689 μmol/L, indicating the model’s practical utility in daily decision-making.
The nomogram format transforms a complex regression equation into a visual calculation scale on paper or screen, requiring no additional software and fitting seamlessly into the clinical workflow.36,37 Using the nomogram, a clinician can obtain a predicted value within seconds: if the predicted TBil-Day7 shows a substantial decline from the admission level, the current treatment is likely effective, and continued observation may be warranted; if the predicted value remains high or increases, a poor treatment response should be anticipated, and timely escalation of therapy (eg, initiating artificial liver support) or evaluation for liver transplantation should be considered; if the predicted value approaches the normal range, it may provide a basis for developing an early discharge plan.
Several limitations of this study should be acknowledged. Most importantly, the nomogram was developed without an independent external validation cohort, which critically limits the generalizability of the findings. Furthermore, the nomogram is designed to predict TBil-Day7, and this study did not directly demonstrate that its use translates into improved clinical outcomes or better treatment decisions. Additional limitations include the single-center retrospective design with a relatively limited sample size (n = 284); the incorporation of hepatoprotective agents only as a count without accounting for specific drug types, dosages, or treatment duration; and the lack of information on antiviral regimens, the occurrence of complications, and dynamic adjustments to treatment protocols, all of which may influence actual changes in TBil. Moreover, the candidate variable list did not exhaust all potential predictors, such as inflammatory markers or serum markers of liver fibrosis. In future work, we plan to integrate key coagulation parameters—such as INR and prothrombin activity—with the TBil-Day7 prediction model developed in this study to construct a composite prediction system that simultaneously assesses bilirubin clearance and recovery of hepatic synthetic function. This would provide a more comprehensive tool for evaluating early treatment response in patients with HBV-LC, and its clinical utility will be further examined through prospective validation.
Conclusion
In this study, we successfully developed and internally validated a nomogram model for predicting TBil-Day7 levels in patients with HBV-LC, based on routine indicators obtainable within the first 24 hours of admission (TBil, DBil, AST, and INR). The model demonstrated satisfactory calibration and clinically acceptable accuracy on internal validation, enabling quantitative bedside prediction of the TBil level one week after admission at the time of admission itself. It provides a simple, intuitive decision-support tool for the early identification of high-risk patients with an insufficient short-term TBil response, thereby securing a critical time window for the timely initiation of intensive therapies such as artificial liver support.
Abbreviations
HBV, hepatitis B virus; HBV-LC, hepatitis B virus-related liver cirrhosis; ACLF, acute-on-chronic liver failure; MELD, Model for End-Stage Liver Disease; LASSO, least absolute shrinkage and selection operator; RMSE, root mean square error; MAE, mean absolute error; R2, coefficient of determination; Q-Q plot, quantile-quantile plot; MIMIC-IV, Medical Information Mart for Intensive Care IV; WBC, white blood cell count; NEUT, neutrophil count; LYM, lymphocyte count; Hb, hemoglobin; PLT, platelet count; PT, prothrombin time; INR, international normalized ratio; ALT, alanine aminotransferase; AST, aspartate aminotransferase; ALB, albumin; TBil, total bilirubin; DBil, direct bilirubin; IBil, indirect bilirubin; ALP, alkaline phosphatase; GGT, gamma-glutamyl transferase; BUN, blood urea nitrogen; Cr, creatinine; UA, uric acid; K⁺, potassium; Na⁺, sodium; Child-Pugh Score; Hepatoprotective Drugs; TBil-Day7, total bilirubin on day 7.
Data Sharing Statement
The raw data supporting the conclusions of this article will be made available by the corresponding authors, without undue reservation. Please contact [email protected].
Ethics Approval and Informed Consent
The study protocol conforms to the ethical guidelines of the 1975 Declaration of Helsinki (6th revision, 2008) as reflected in a priori approval by the ethics committee of No.988 Hospital (approval number PLA988LLSP20260206). Informed consent was waived for this retrospective analysis. Patient data confidentiality was strictly maintained in accordance with the ethics committee requirements.
Funding
This research received no specific grant from any funding agency in the public, commercial, or not-for-profit sectors.
Disclosure
We declare that we have no conflict of interest in connection with this paper, and we received no payment or services from a third party in relation to this study.
References
1. Parola M, Pinzani M. Liver fibrosis: pathophysiology, pathogenetic targets and clinical issues. Mol Aspects Med. 2019;65:37–13. doi:10.1016/j.mam.2018.09.002
2. Ginès P, Krag A, Abraldes JG, et al. Liver cirrhosis. Lancet. 2021;398(10308):1359–1376. doi:10.1016/s0140-6736(21)01374-x
3. Dai EH, Guo XR, Wang JT, et al. Investigate of the etiology and prevention status of liver cirrhosis. Zhonghua Yi Xue Za Zhi. 2023;103(12):913–919. doi:10.3760/cma.j.cn112137-20221017-02164
4. Hsu YC, Huang DQ, Nguyen MH. Global burden of hepatitis B virus: current status, missed opportunities and a call for action. Nat Rev Gastroenterol Hepatol. 2023;20(8):524–537. doi:10.1038/s41575-023-00760-9
5. ZQ Liu, CQ Lin, XH Mao, et al. Changing prevalence of chronic hepatitis B virus infection in China between 1973 and 2021: a systematic literature review and meta-analysis of 3740 studies and 231 million people. Gut. 2023;72(12):2354–2363. doi:10.1136/gutjnl-2023-330691
6. Xiao J, Wang F, Wong NK, et al. Global liver disease burdens and research trends: analysis from a Chinese perspective. J Hepatol. 2019;71(1):212–221. doi:10.1016/j.jhep.2019.03.004
7. Engelmann C, Clària J, Szabo G, et al. Pathophysiology of decompensated cirrhosis: portal hypertension, circulatory dysfunction, inflammation, metabolism and mitochondrial dysfunction. J Hepatol. 2021;75 Suppl 1(Suppl 1):S49–s66. doi:10.1016/j.jhep.2021.01.002
8. Cheng R, Xu J, Tan N, et al. Predictive nomograms for clinical outcomes in hepatitis B-related cirrhosis patients receiving antiviral therapy. Infect Drug Resist. 2021;14:2707–2719. doi:10.2147/IDR.S316026
9. GDaI C. Global burden of 369 diseases and injuries in 204 countries and territories, 1990-2019: a systematic analysis for the global burden of disease study 2019. Lancet. 2020;396(10258):1204–1222. doi:10.1016/s0140-6736(20)30925-9
10. McCoy MS, Angeli P, Trebicka J. Acute and non-acute decompensation of liver cirrhosis. Liver Int. 2025;45(3):e15861. doi:10.1111/liv.15861
11. Zhang Y, Tan W, Wang X, et al. Metabolic biomarkers significantly enhance the prediction of HBV-related ACLF occurrence and outcomes. J Hepatol. 2023;79(5):1159–1171. doi:10.1016/j.jhep.2023.07.011
12. Moreau R, Gao B, Papp M, et al. Acute-on-chronic liver failure: a distinct clinical syndrome. J Hepatol. 2021;75 Suppl 1:S27–S35.
13. European Association for the Study of the Liver. EASL clinical practice guidelines on acute-on-chronic liver failure. J Hepatol. 2023;79(2):461–491. doi:10.1016/j.jhep.2023.04.021.
14. Moore O, Ma WS, Read S, et al. The unwell patient with advanced chronic liver disease: when to use each score? BMC Med. 2025;23(1):413. doi:10.1186/s12916-025-04185-w
15. Mazumder NR, Fontana RJ. MELD 3.0 in advanced chronic liver disease. Annu Rev Med. 2024;75:233–245. doi:10.1146/annurev-med-051322-122539
16. Hamoud AR, Weaver L, Stec DE, et al. Bilirubin in the liver-gut signaling axis. Trends Endocrinol Metab. 2018;29(3):140–150. doi:10.1016/j.tem.2018.01.0027
17. Zampino R, Patauner F, Durante-Mangoni E. Clinical trajectories in liver cirrhosis: an evidence-based reappraisal for the internist. Eur J Intern Med. 2025;136:31–36. doi:10.1016/j.ejim.2025.04.028
18. Song YQ, Fu XY, Yan SY, et al. Clinical utility of the trajectory of serum bilirubin and international normalized ratio values in hepatitis B virus-related acute-on-chronic liver failure. Int J Gen Med. 2025;18:643–658. doi:10.2147/IJGM.S490328
19. Yu Z, Zhang Y, Cao Y, et al. A dynamic prediction model for prognosis of acute-on-chronic liver failure based on the trend of clinical indicators. Sci Rep. 2021;11(1):1810. doi:10.1038/s41598-021-81431-0
20. Xu X, Ding H, You H, et al. Chinese guidelines for clinical diagnosis, treatment, and management of cirrhosis (2025). J Clin Transl Hepatol. 2026;14(1):96–115. doi:10.14218/JCTH.2025.00517
21. Ferrarese A, Bucci M, Zanetto A, et al. Prognostic models in end stage liver disease. Best Pract Res Clin Gastroenterol. 2023;67:101866. doi:10.1016/j.bpg.2023.101866
22. Hui K, Hong C, Xiong Y, et al. LASSO-based machine learning algorithm for prediction of PICS associated with sepsis. Infect Drug Resist. 2024;17:2701–2710. doi:10.2147/IDR.S464906
23. Ma Y, Du L, Zhou S, et al. Association of direct bilirubin to total bilirubin ratio with 90-day mortality in patients with acute-on-chronic liver failure. Front Med Lausanne. 2023;10:1286510. doi:10.3389/fmed.2023.1286510
24. Lammers WJ, van Buuren HR, Hirschfield GM, et al. Levels of alkaline phosphatase and bilirubin are surrogate end points of outcomes of patients with primary biliary cirrhosis: an international follow-up study. Gastroenterology. 2014;147(6):1338–49.e5;quize15. doi:10.1053/j.gastro.2014.08.029
25. Govaere O, Cockell S, Tiniakos D, et al. Transcriptomic profiling across the nonalcoholic fatty liver disease spectrum reveals gene signatures for steatohepatitis and fibrosis. Sci Transl Med. 2020;12(572). doi:10.1126/scitranslmed.aba4448
26. Ampuero J, Lucena A, Berenguer M, et al. Predictive factors for decompensating events in patients with cirrhosis with primary biliary cholangitis under different lines of therapy. Hepatology. 2024;80(4):791–806. doi:10.1097/hep.0000000000000826
27. Giannini EG, Testa R, Savarino V. Liver enzyme alteration: a guide for clinicians. CMAJ. 2005;172(3):367–379. doi:10.1503/cmaj.1040752
28. O’Leary JG, Greenberg CS, Patton HM, et al. AGA clinical practice update: coagulation in cirrhosis. Gastroenterology. 2019;157(1):34–43.e1. doi:10.1053/j.gastro.2019.03.070
29. Li X, Li X, Zhao W, Wang D. Development and validation of a nomogram for predicting in-hospital death in cirrhotic patients with acute kidney injury. BMC Nephrol. 2024;25(1):175. doi:10.1186/s12882-024-03609-8
30. Feng LH, Lu Y, Ren S, et al. Development and validation of a dynamic online nomogram for predicting acute kidney injury in cirrhotic patients upon ICU admission. Front Med Lausanne. 2023;10:1055137. doi:10.3389/fmed.2023.1055137
31. Sun M, Liu S, Min J, et al. Predicting in-hospital mortality in patients with alcoholic cirrhosis complicated by severe acute kidney injury: development and validation of an explainable machine learning model. Front Med Lausanne. 2025;12:1570928. doi:10.3389/fmed.2025.1570928
32. Wan YP, Wang AJ, Zhang W, et al. Development and validation of a nomogram for predicting overall survival in cirrhotic patients with acute kidney injury. World J Gastroenterol. 2022;28(30):4133–4151. doi:10.3748/wjg.v28.i30.4133
33. Peng J, Jin H, Zhang N, et al. Development and evaluation of a predictive model of upper gastrointestinal bleeding in liver cirrhosis. BMC Gastroenterol. 2025;25(1):142. doi:10.1186/s12876-025-03677-6
34. Biesheuvel CJ, Vergouwe Y, Steyerberg EW, et al. Polytomous logistic regression analysis could be applied more often in diagnostic research. J Clin Epidemiol. 2008;61(2):125–134. doi:10.1016/j.jclinepi.2007.03.002
35. Austin PC, van Buuren S. Logistic regression vs. predictive mean matching for imputing binary covariates. Stat Meth Med Res. 2023;32(11):2172–2183. doi:10.1177/09622802231198795
36. Jiang S, Wang J, Zhang Z, et al. Development and validation of a nomogram to predict significant liver inflammation in patients with chronic hepatitis B. Infect Drug Resist. 2023;16:5065–5075. doi:10.2147/IDR.S417007
37. Wu J, Zhang H, Li L, et al. A nomogram for predicting overall survival in patients with low-grade endometrial stromal sarcoma: a population-based analysis. Cancer Commun. 2020;40(7):301–312. doi:10.1002/cac2.12067
 © 2026 The Author(s). This work is published and licensed by Dove Medical Press Limited. The
full terms of this license are available at https://www.dovepress.com/terms
and incorporate the Creative Commons Attribution
- Non Commercial (unported, 4.0) License.
By accessing the work you hereby accept the Terms. Non-commercial uses of the work are permitted
without any further permission from Dove Medical Press Limited, provided the work is properly
attributed. For permission for commercial use of this work, please see paragraphs 4.2 and 5 of our Terms.
© 2026 The Author(s). This work is published and licensed by Dove Medical Press Limited. The
full terms of this license are available at https://www.dovepress.com/terms
and incorporate the Creative Commons Attribution
- Non Commercial (unported, 4.0) License.
By accessing the work you hereby accept the Terms. Non-commercial uses of the work are permitted
without any further permission from Dove Medical Press Limited, provided the work is properly
attributed. For permission for commercial use of this work, please see paragraphs 4.2 and 5 of our Terms.