Back to Journals » Journal of Inflammation Research » Volume 18
A Nomogram for Early Prediction of Infected Pancreatic Necrosis Based on Contrast-Enhanced CT Radiomics and Inflammatory Indicators
Authors Yao Q ![]() , Duan Y, Jin C, Li X, Wei S, Shi Y, Zhang Y, Zhang J
, Duan Y, Jin C, Li X, Wei S, Shi Y, Zhang Y, Zhang J ![]() , Liu C
, Liu C ![]()
Received 4 May 2025
Accepted for publication 6 September 2025
Published 3 October 2025 Volume 2025:18 Pages 13651—13663
DOI https://doi.org/10.2147/JIR.S538345
Checked for plagiarism Yes
Review by Single anonymous peer review
Peer reviewer comments 2
Editor who approved publication: Professor Ning Quan
Qing Yao,1 Yue Duan,2 Chao Jin,3 Xiang Li,3 Shiyu Wei,1 Yinghuan Shi,2 Yuelang Zhang,4 Jingyao Zhang,1 Chang Liu5
1Department of SICU, The First Affiliated Hospital of Xi’an Jiaotong University, Xi’an, 710061, People’s Republic of China; 2National Key Laboratory for Novel Software Technology, Nanjing University, Nanjing, 210008, People’s Republic of China; 3Department of Radiology, The First Affiliated Hospital of Xi’an Jiaotong University, Xi’an, 710061, People’s Republic of China; 4Department of Radiology, The Second Affiliated Hospital of Xi’an Jiaotong University, Xi’an, 710000, People’s Republic of China; 5Department of Hepatobiliary Surgery and Liver Transplantation, The Second Affiliated Hospital of Xi’an Jiaotong University, Xi’an, 710000, People’s Republic of China
Correspondence: Chang Liu, Department of Hepatobiliary Surgery and Liver Transplantation, The Second Affiliated Hospital of Xi’an Jiaotong University, Xi’an, 710000, People’s Republic of China, Tel +86-29-87678231, Fax +86-29-87678599, Email [email protected] Jingyao Zhang, Department of SICU, The First Affiliated Hospital of Xi’an Jiaotong University, Xi’an, 710061, People’s Republic of China, Tel +86-29-85323900, Fax +86-29-85324642, Email [email protected]
Purpose: This study aimed to establish a nomogram for early and accurate identification of infected pancreatic necrosis (IPN) among patients with acute necrotizing pancreatitis (ANP) by integrating clinical data and radiomic information from contrast-enhanced computed tomography (CECT).
Patients and Methods: This retrospective single-center study included 203 ANP patients who underwent CECT. Patients were divided into training (n=142) and test set (n=61). Radiomic features were extracted from CECT images using PyRadiomics. Three machine learning classifiers were employed to construct a radiomic signature. Clinical factors were identified through regression analysis. A combined nomogram was developed using multivariate logistic regression. ROC and calibration curves were plotted to assess the efficacy of the model. Decision curve analysis (DCA) was applied to identify the clinical value and utility.
Results: In the training and test set, 56 (39.43%) and 23 (37.70%) patients developed into IPN, respectively. The optimal Rad score was achieved by the LightGBM classifier. APACHE II and MCTSI scores were independent predictors of IPN. The combined clinical-radiomic nomogram achieved the best predictive efficacy, with an AUC of 0.877 in the training set and 0.829 in the test set. The calibration curve proved good accordance, and the decision curve demonstrated great clinical utility.
Conclusion: The clinical-radiomic combined nomogram performed well in predicting IPN in patients with ANP. It could potentially serve as a quantitative, non-invasive tool for early IPN prediction in patients with ANP.
Keywords: pancreatitis, infected pancreatic necrosis, contrast-enhanced computed tomography, radiomic, machine learning, nomogram
Introduction
Acute pancreatitis (AP) ranks among the most common gastrointestinal emergencies, with a rising global incidence rate each year.1 Between 10% and 20% of patients with AP may develop severe necrotizing pancreatitis (ANP), and within this subgroup, approximately 33% may experience infected pancreatic necrosis (IPN). As a serious local complication, IPN increases the risk of infection spread and pancreatic fistula formation, and it may lead to systemic complications such as metabolic disorders, systemic inflammatory response syndrome (SIRS), and multiple organ dysfunction syndrome (MODS), resulting in a mortality rate ranging from 13% to 35%.2
The early diagnosis of IPN continues to present significant challenges. The presence of gas bubbles within or adjacent to the pancreatic or peripancreatic collections on contrast-enhanced CT imaging serves as a valuable indicator for diagnosing IPN.3 However, in the initial stages following disease onset, conventional manual assessment demonstrates limited sensitivity, ranging from approximately 25% to 56% for identifying IPN.4 Fine needle aspiration (FNA), followed by Gram stain and culture, is not preferred for diagnosing IPN due to its high false-negative rates, which range from 20% to 50%, as well as the potential risk of causing infection.2,5 Levels of procalcitonin (PCT),6 C-reactive protein (CRP),7 and arterial lactate8 have been recognized as a relatively precise and easily accessible biomarkers for predicting IPN. However, it is important to note that these levels can also be elevated in other sites of infection and may rise during the initial weeks due to SIRS and MODS.
Radiomic analysis is a powerful method for extracting extensive information from imaging data, facilitating the discovery of subtle relationships between image features and disease status that may be imperceptible to the radiologist.9,10 There do exist differences in the parenchymal alterations between patients with and without IPN. These underlying distinctions could potentially be captured and represented by radiomic features. Nomogram further integrates multiple variables into intuitive graphical calculators, offering individualized probability estimates of outcomes. Hu et al constructed a nomogram that combines radiomic and clinical variables to forecast the recurrence of acute pancreatitis. This nomogram demonstrated enhanced predictive accuracy and offers individualized risk assessments, thereby facilitating personalized treatment strategies and potentially improving patient prognoses.11 While several radiomic studies have been developed to predict the severity of AP,12 the recurrence of AP,11,13 and extrapancreatic necrosis in AP,14 few published radiomic studies have focused specifically on predicting IPN.
Therefore, this study aimed to establish a nomogram for the early and improved prediction of IPN among patients with ANP based on a combination of clinical inflammatory indicators and radiomic information of CECT.
Materials and Methods
Study Design and Data Collection
This retrospective single-center study adhered to the principles outlined in the Declaration of Helsinki. The Institutional Review Board of the First Affiliated Hospital of Xi’an Jiaotong University sanctioned the research protocol, and the need for written informed consent was deserted. Patients diagnosed with ANP between May 2022 and December 2024 were screened for inclusion. Diagnosis of ANP was based on the revised Atlanta classification (RAC).15 ANP involves pancreatic parenchymal necrosis (PPN) and/or extrapancreatic necrosis (EXPN).16 On CECT, pancreatic necrosis is characterized by reduced or absent enhancement of the pancreatic parenchyma. Extrapancreatic necrosis includes both peripancreatic and adjacent retroperitoneal fat necrosis, which is identified by the presence of fat infiltration, as well as fluid and/or solid accumulation. The inclusion criteria were: (1) age > 18 years, (2) first-time occurrence, and (3) abdominal CECT examination within 7 days after symptom onset.17 The exclusion criteria were as follows: (1) pre-existing conditions including chronic pancreatitis, prior pancreatic surgery, hepatic cirrhosis, malignant tumors, or other ailments potentially causing peritoneal effusion; (2) presence of infectious disease upon admission; (3) presence of gastrointestinal fistula; (4) substandard image quality; and (5) incomplete essential clinical data.
Infected pancreatic necrosis was confirmed by: 1) detection of extraluminal gas in pancreatic and/or peripancreatic tissues via CECT, or 2) positive culture from fine-needle aspiration (FNA) under CT/ultrasound guidance or samples acquired during the first invasive therapeutic interventions.18 Baseline clinical data was collected, including age, sex, etiology, severity, laboratory test results, acute physiological and chronic health evaluation (APACHE II) score, bedside index for severity in acute pancreatitis (BISAP) score, and modified CT severity index (MCTSI) score. A gastroenterologist with eight years of clinical experience calculated each patient’s APACHE II and BISAP scores within 48 h of admission. This research included 203 patients, with 79 patients diagnosed with IPN and 124 patients Non-IPN. These patients were casually parted to a training set and an internal test set in a 7:3 ratio. The patient recruitment flowchart was shown in Figure 1.
 |
Figure 1 Flowchart of the study population. Abbreviations: AP, acute pancreatitis; ANP, acute necrotizing pancreatitis; IPN, infected pancreatic necrosis. |
Image Acquisition and Segmentation
Every subject underwent abdominal CECT examination employing a 256-detector row CT scanner (Philips iCT 256 or Revolution CT; GE Healthcare). CT scans were evaluated and gathered retrospectively using the picture archiving and communication system (PACS). Pictures from the portal venous phase were chosen for analysis to enhance necrosis identification. Region of interest (ROI) included the entire pancreas (including pancreatic necrosis while excluding the vessels, biliary ducts and feeding tube) and peripancreatic fluid accumulations (Figure 2). The target areas were outlined by two radiologists (A and B), each with more than ten years of experience in abdominal CT diagnostics. Anonymization was implemented during the segmentation process, and the clinical data were withheld from the readers. The three-dimensional ROIs were segmented layer by layer using open-source ITK-SNAP software (version 3.8.0; http://www.itksnap.org/pmwiki/pmwiki.php).19 Agreements are reached through consultation to ensure the accuracy of each ROI annotation. Flowchart of the study design and radiomic analysis was illustrated in Figure 3.
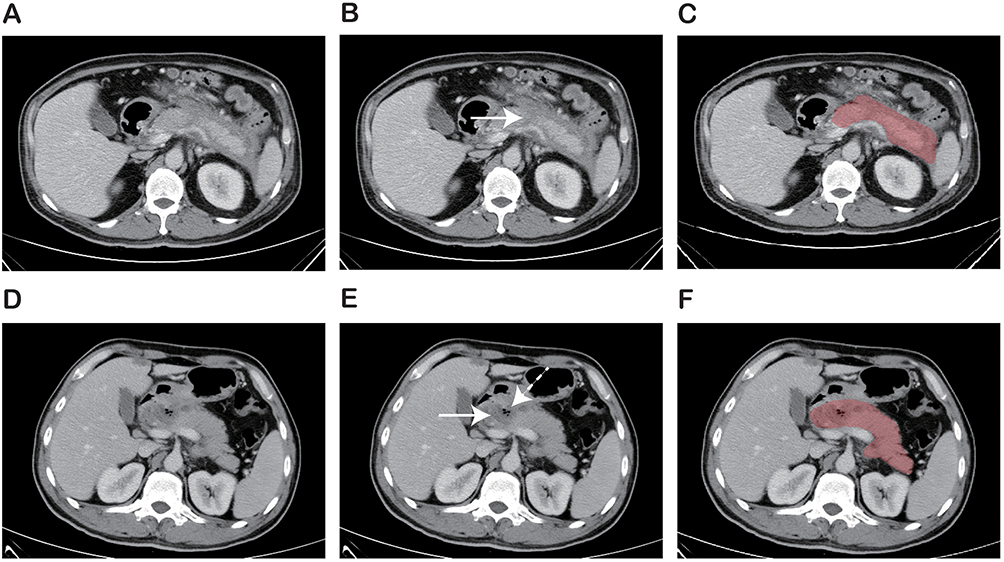 |
Figure 2 Examples of two patients showing the delineation of areas of interest on contrast-enhanced CT images. (A–C) Male, 46-year-old, acute necrotizing pancreatitis: (A) original image; (B) necrosis (reduced enhancement, white arrow) appeared at the pancreatic neck; (C) red area represented delineated region of interest. (D-F) Female, 54-year-old, infected pancreatic necrosis: (D) original image; (E) necrosis (reduced enhancement, white arrow) and infection (presence of gas bubbles, white dashed arrow) appeared at the pancreatic head and neck; (F) red area represented delineated region of interest. |
 |
Figure 3 Flowchart of the study design and radiomic analysis. |
Image Preprocessing and Feature Extraction
PyRadiomics (version 3.1.0; https://github.com/Radiomic/pyradiomics) was accustomed for image preprocessing and feature extraction. The analysis incorporated two types of images: original and filtered images. Seven filtering techniques were employed: exponential, gradient, Laplacian of Gaussian, lbp-3D, logarithm, square and square root. The extracted features were classified into three categories: (i) 14 morphological features, (ii) 18 first-order features, and (iii) 73 textural features. All 924 features were extracted. Supplementary Material provides detailed information on CT acquisition parameters, radiomic feature extraction methodology, and reproducibility analysis. Details of the radiomic features can be found in Supplementary Table S1.
Model Construction and Evaluation
For feature reduction and selection, Student’s t-test or Mann–Whitney U-test was conducted to identify radiomic features showing significant differences between the Non-IPN and IPN groups. The feature distribution was normalized using z-score normalization. To reduce potential collinearity, Pearson’s correlation with a 0.9 threshold was applied, retaining the feature with the lower P value when the absolute correlation coefficient between two features exceeded 0.9. The LASSO regression model, based on minimum criteria via 5-fold cross-validation, was used to further refine the remaining radiomic features.
To boost the performance and resilience, three machine learning classifiers, support vector machine (SVM), K-nearest neighbors (KNN), and LightGBM, were employed to construct the radiomic signature. The final radiomic signature (Rad score) was calculated using the best-performing classifier with the key radiomic features. A clinical signature was developed by identifying significant clinical factors through univariate regression analysis and incorporating them into the multivariate logistic regression analysis. AIC was used to prevent overfitting and select the most suitable model. A combined model was built by incorporating the Rad score and clinical signatures using multivariate logistic regression analysis.
The discrimination of the model was valued and compared using the ROC curve and Delong test. Various property metrics, including the AUC, sensitivity, specificity, positive predictive value (PPV), negative predictive value (NPV), and F1 score, were computed. Calibration efficiency was assessed using the calibration curve and Hosmer-Lemeshow test. DCA was implemented to assess the clinical utility.
Statistical Analysis
Quantitative variables are described as mean ± standard deviation (SD) or median (interquartile range), while categorical variables are shown as number (%). The Shapiro–Wilk and Levene’s tests were habitual to value the normality and variance homogeneity of continuous variables, respectively. Comparisons of continuous variables were performed using the Student’s t-test or Mann–Whitney U-test, and categorical variable rates were compared using the chi-square test or Fisher’s exact test, as appropriate. The R statistical software (version 3.4.2, http://www.r-project.org) was employed for statistical analyses. The DeLong test was accustomed to compare the ROC curves.20 To assess calibration ability, the Hosmer-Lemeshow goodness-of-fit test was applied (P > 0.05, indicating a well-calibrated model). Statistical consequence was determined at two-tailed P < 0.05.
Results
Baseline Characteristics
The study included a total of 203 patients with ANP, consisting of 128 males and 75 females, aged 47.0±14.2 (range 18–77 years). Among these, 79 patients had IPN, while 124 patients had Non-IPN. In the training set (n = 142), there were 97 males and 45 females, aged 46.0±13.6 (range 18–72 years), including 56 patients with IPN and 86 patients with Non-IPN. The test group (n = 61), comprised 31 males and 30 females, aged 49.2±15.4 (range 18–77 years), of which 23 patients had IPN and 38 patients had Non-IPN. The baseline clinical features of the patients in both sets are presented in Table 1.
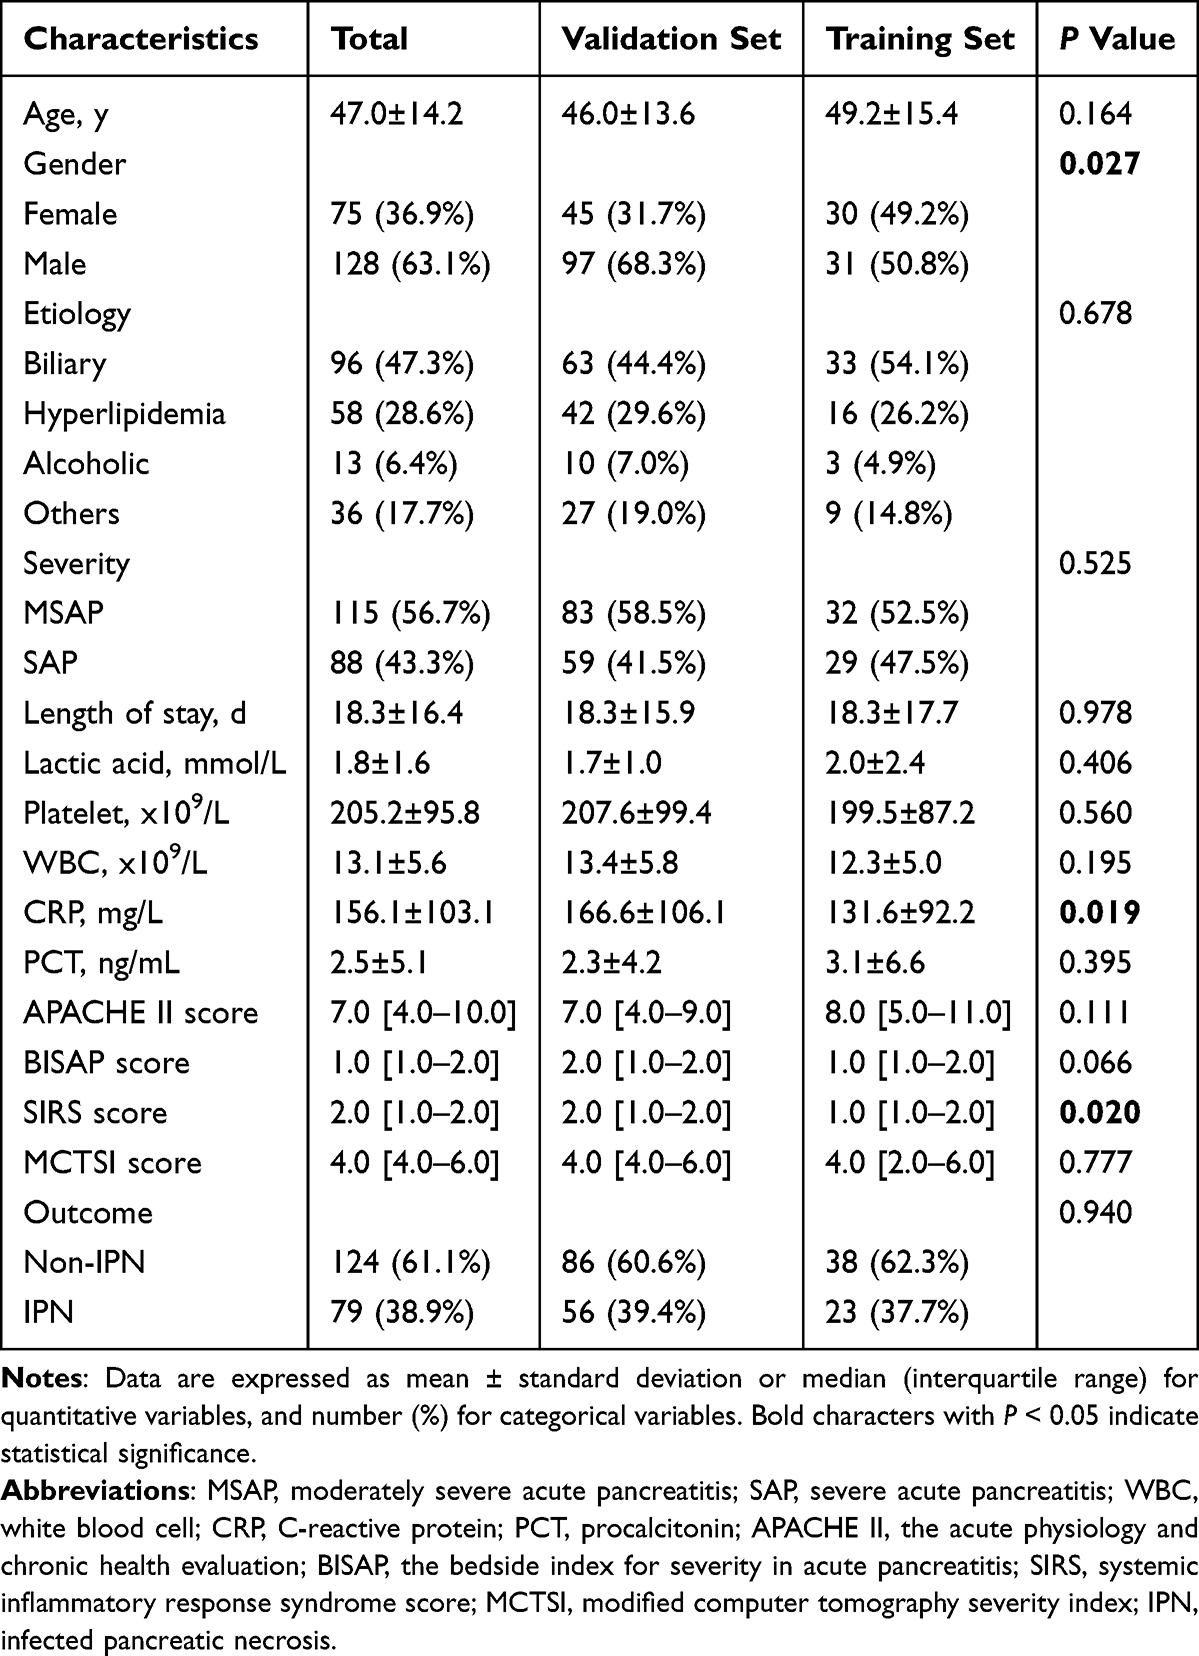 |
Table 1 Baseline Characteristics of Patients in Training and Test Set |
Radiomic Signature Construction
Of the total 924 radiomic features, 196 were discarded due to poor reliability, leaving 728 for further analysis (Supplementary Figure S1). Statistical testing identified 416 features that were significantly associated with the outcome. Through Pearson’s correlation analysis, 120 features were retained, each with an absolute correlation coefficient of 0.9 or less. The LASSO algorithm was then used for further dimensionality reduction of the remaining features (Figure 4). The final set of seven radiomic features was accustomed to develop a radiomic score (Rad score) for each patient using the SVM, KNN, and LightGBM algorithms. The LightGBM classifier-based Rad score showed the best performance in distinguishing IPN from Non-IPN (Figure 5). In the training set, it achieved an AUC of 0.862 (95% CI: 0.788–0.937), an accuracy of 0.893, a sensitivity of 0.875, and a specificity of 0.925. For the test set, the AUC was 0.828 (95% CI: 0.692–0.964), with an accuracy, sensitivity, and specificity of 0.789, 0.800, and 0.769, respectively (Table 2).
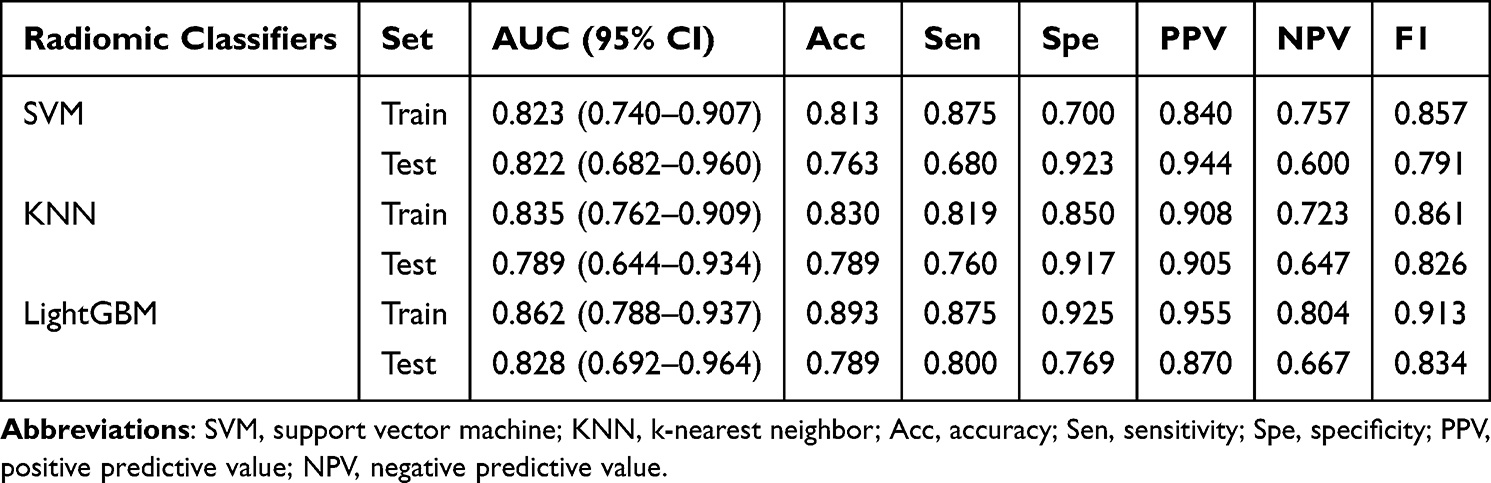 |
Table 2 Performances of the Three Radiomic Machine Learning Classifiers for Predicting Infected Pancreatic Necrosis |
 |
Figure 4 Radiomic feature selection by LASSO associated with infected pancreatic necrosis. (a) 5-fold cross-validation curve for selection of the optimal parameter (λ) based on minimum criteria. The y-axis represents the binomial deviance and the lower x-axis represents log(λ). (b) LASSO coefficient profiles for 120 radiomic features. The y-axis represents the radiomic features coefficients and the lower x-axis represents log(λ). The dotted line on the left represents the minimum mean square error (lambda.min), while the dotted line on the right indicates the maximum lambda that is one standard error away from lambda.min (lambda.1se). The optimal lambda.min value of 0.060 with log(λ) = −2.820 was selected. 7 features with nonzero coefficients are indicated in the plot. |
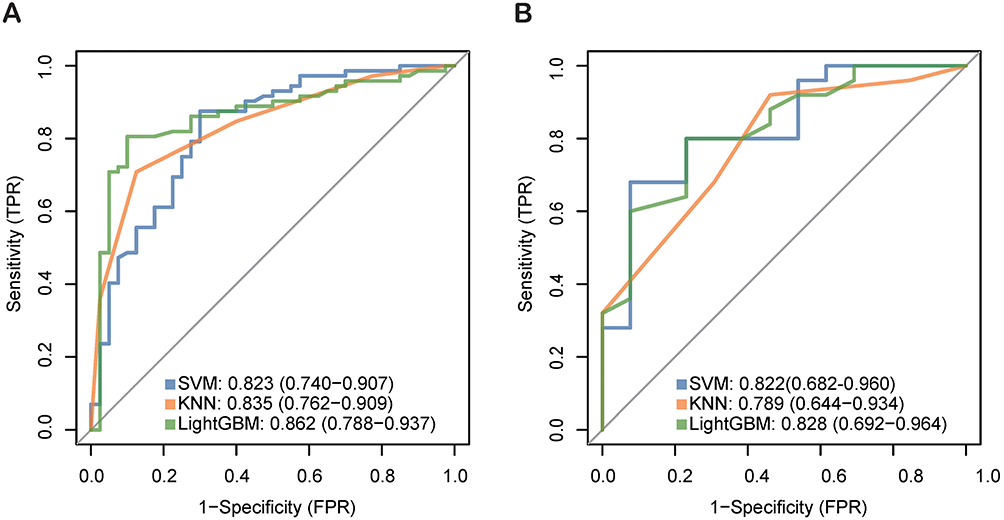 |
Figure 5 ROC curves of the three radiomic classifiers. (A) Training set. (B) Test set. The optimal radiomic performance was obtained by the LightGBM classifier. |
Nomogram Establishment and Evaluation
Multivariate logistic regression revealed that APACHE II score (OR = 1.43, 95% CI: 1.02–2.02, P = 0.039), MCTSI score (OR = 1.87, 95% CI: 1.05–3.31, P = 0.032) and Rad score (OR = 3.40, 95% CI: 5.62–10.45, P < 0.001) were independent predictors for IPN prediction (Table 3). A nomogram was then developed by combining APACHE II, MCTSI, and Rad score using logistic regression (Figure 6). The nomogram showed good discriminatory ability with an AUC of 0.877 (95% CI: 0.794–0.960) in the training set and 0.829 (95% CI: 0.687–0.972) in the test set (Figure 7A and B). In the training set, it achieved an accuracy of 0.840, a sensitivity of 0.781, and a specificity of 0.986. For the test set, it achieved an accuracy, sensitivity, and specificity of 0.820, 0.800, and 0.857, respectively (Table 4). The calibration curves proved good accordance in the training and test sets (P > 0.05; Figure 7C and D). The decision curves indicated that if threshold probability is 20–90%, the application of the nomogram for predicting IPN provides higher clinical net benefit compared to both the treat-all and treat-none strategies. Within this range, the nomogram had improved predictive effect compared with the clinical and radiomic models (Figure 7E and F).
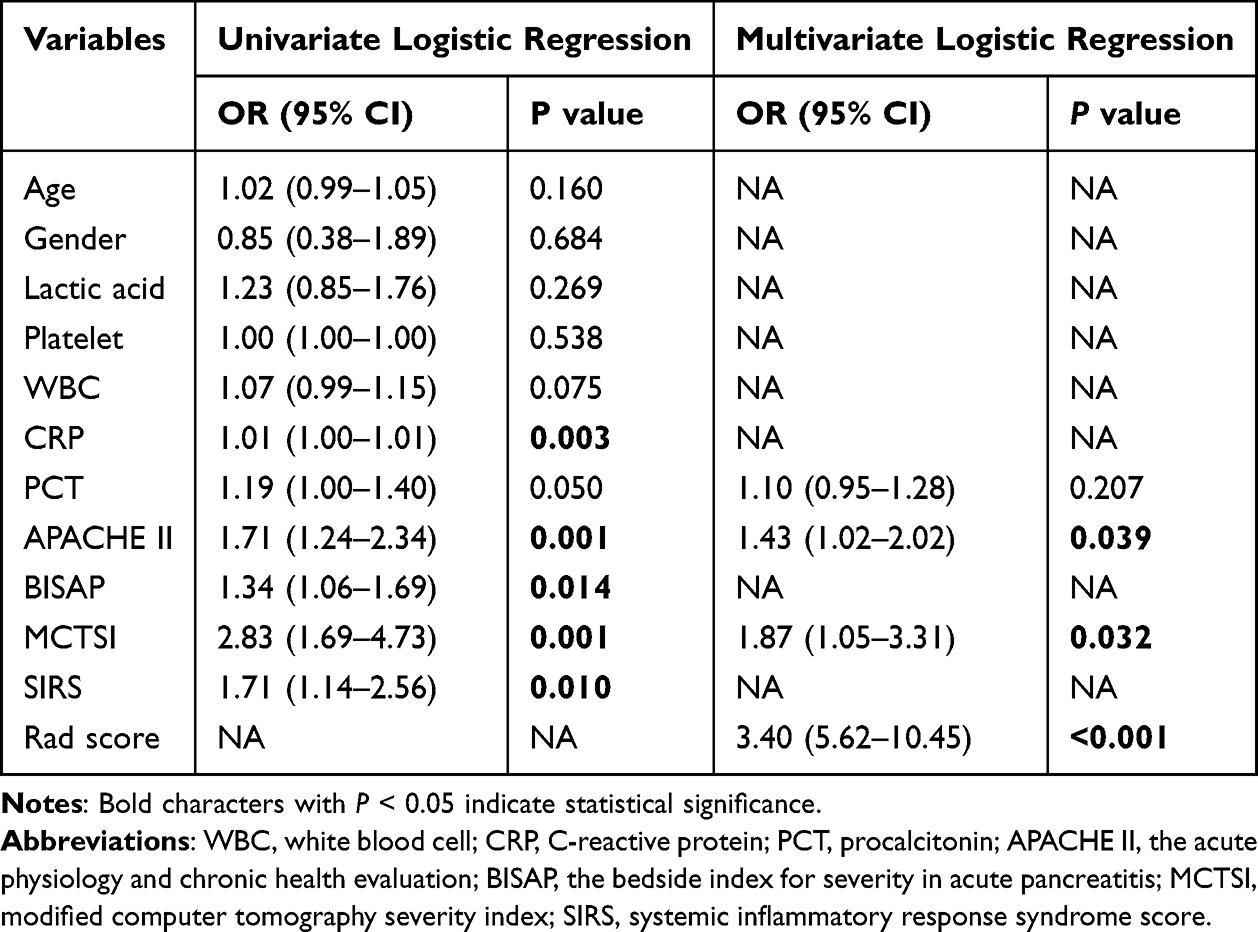 |
Table 3 Univariate and Multivariate Logistic Regression Analysis of Clinical Features |
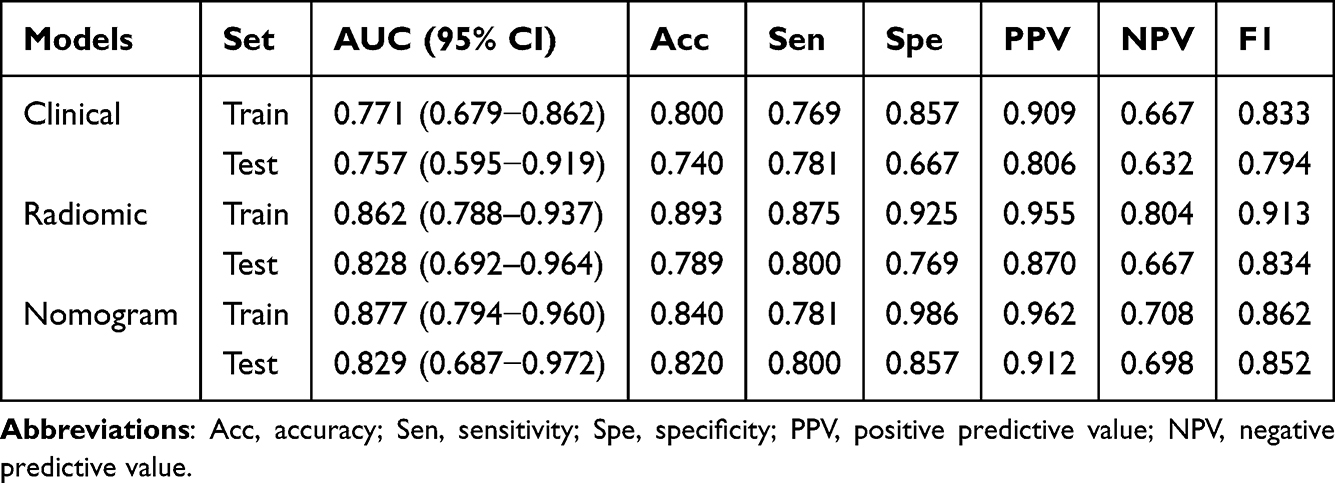 |
Table 4 Results of Models Predictive Ability for IPN Prediction |
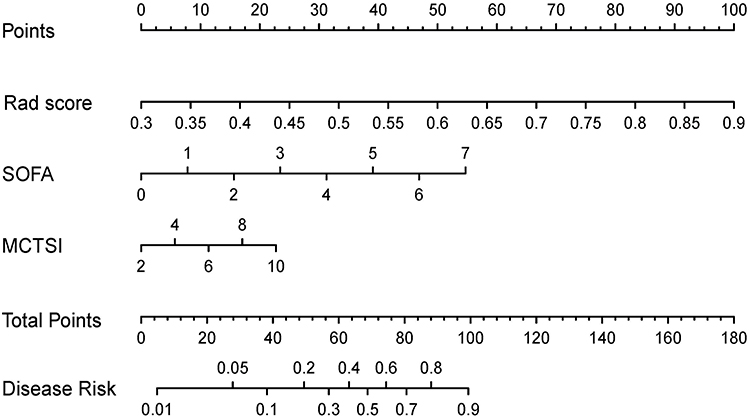 |
Figure 6 Combined clinical-radiomic nomogram for predicting infected pancreatic necrosis. |
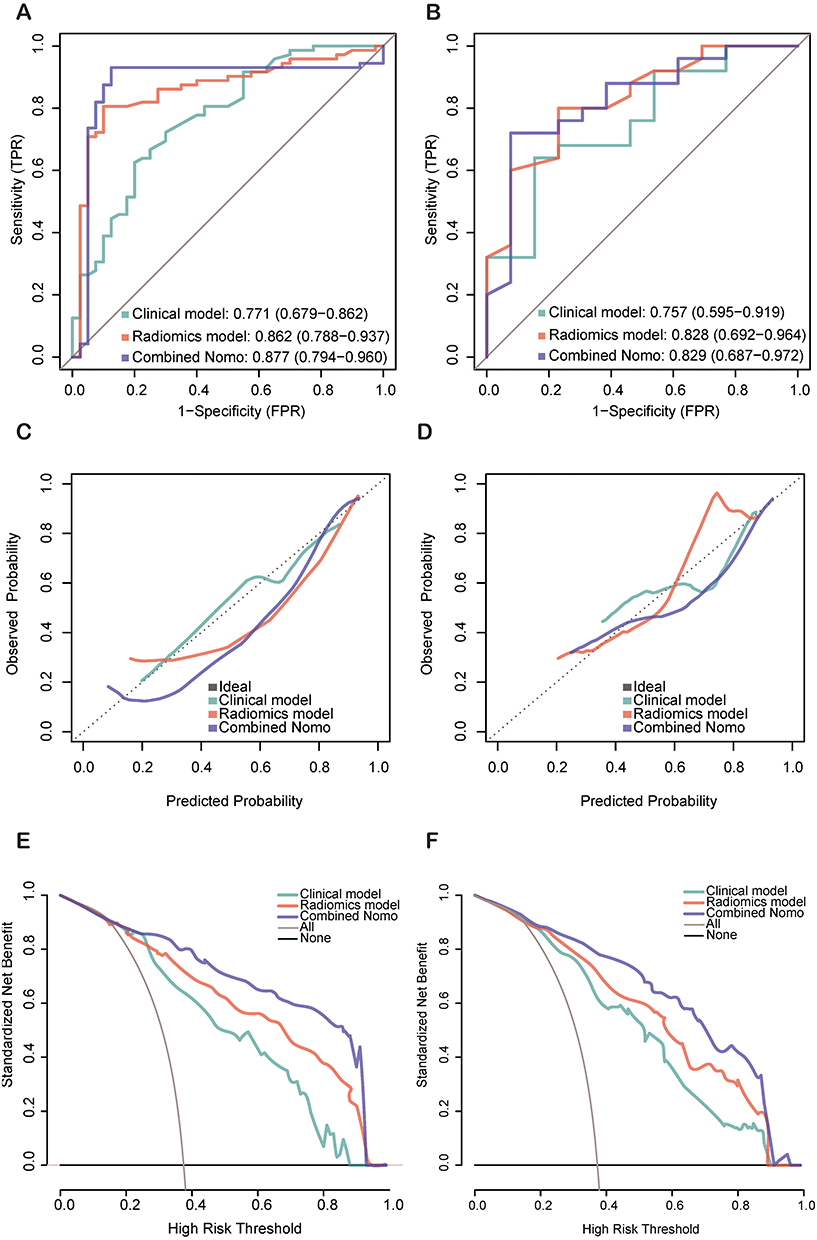 |
Figure 7 Performances for the clinical model, radiomic model and combined nomogram for predicting infected pancreatic necrosis. ROC curves in the training set (A) and test set (B). Calibration curve in the training set (C) and test set (D). Decision curve analysis in the training set (E), and test set (F). |
Performance Comparison Between Models
The discrimination performance of the combined model was generally more effective than that of the single clinical model and the single radiomic model. As presented in Tables 4 and 5, the radiomic model demonstrated a slight advantage over the clinical model in the training set (clinical vs radiomic, 0.771 vs 0.862, P = 0.089) and in the test set (clinical vs radiomic, 0.757 vs 0.828, P = 0.439). Furthermore, the nomogram and the radiomic model exhibited comparable performance in both the training set (radiomic vs nomogram, 0.862 vs 0.877, P = 0.610) and the test set (radiomic vs nomogram, 0.828 vs 0.829, P = 0.965). Notably, the nomogram significantly outperformed the clinical model in the training set (clinical vs nomogram, 0.771 vs 0.877, P = 0.049), while the performance was comparable in the test set (clinical vs nomogram, 0.757 vs 0.829, P = 0.284).
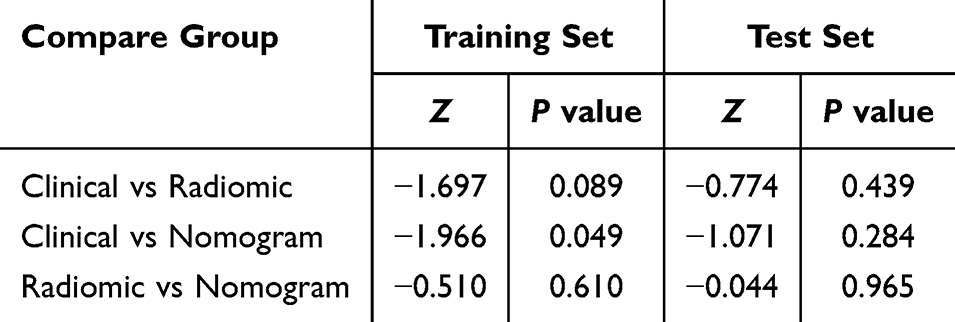 |
Table 5 DeLong’s Test for ROC Curves Comparison of Clinical Model, Radiomic Model and Combined Nomogram |
Discussion
This study established and validated a clinical model, a radiomic model and a clinical-radiomic combined nomogram to early predict IPN in patients with ANP. The radiomic model demonstrated a slight advantage over the clinical model. The combined nomogram exhibited the best predictive performance, achieving AUCs of 0.877 (95% CI: 0.794–0.960) and 0.829 (95% CI: 0.687–0.972) in the training and test set, respectively. The decision curve analysis confirmed the model’s clinical utility and net benefits for decision-making. These findings suggest that the clinical-radiomic combined nomogram provides a more accurate and objective approach for early prediction of IPN.
Conventional CT scoring systems, such as the CTSI and MCTSI, along with the presence of gas configurations within necrotic collections, have limited predictive value for infection. Radiomic analysis extracts comprehensive data from radiological images, providing clinicians with more precise and quantifiable information to support diagnosis and treatment decisions.21,22 Zhao et al10 analyzed 215 first-episode AP patients retrospectively and extracted radiomics features from the pancreatic and peripancreatic regions in portal venous phase CECT images to develop a radiomics nomogram for early prediction of AP severity. Huang et al17 assessed radiomic information related to body composition from non-contrast CT scans as risk factors for prediction of IPN in patients with ANP. They delineated the sacrospinalis muscle, and subcutaneous and visceral adipose tissue; however, they did not segment pancreatic lesions, which resulted in a lack of in-depth exploration of pathological and imaging changes in pancreatic and peripancreatic tissues. In this study, pancreatic and peripancreatic necrosis and fluid accumulations were segmented to better characterize the local features of the lesion. Additionally, ROIs were manually segmented to more clearly outline the ambiguous boundaries of pancreatitis. Furthermore, three machine learning classifiers, SVM, KNN and LightGBM, were employed to enhance the performance and robustness of the radiomic signature. As anticipated, the radiomic model achieved optimal accuracy, sensitivity, and specificity in the training set (0.893, 0.875, and 0.925, respectively) and the test set (0.789, 0.800, and 0.769, respectively) for predicting IPN.
This study identified key clinical factors contributing to the early prediction of IPN. The APACHE II score (OR = 1.43, 95% CI: 1.02–2.02, P = 0.039) and the MCTSI score (OR = 1.87, 95% CI: 1.05–3.31, P = 0.032) were found to be independent risk factors for predicting IPN in patients with ANP, consistent with the findings of Zhu et al23 and Song et al.5 The APACHE II scoring system has been shown to possess high sensitivity in predicting pancreatic necrosis, with a rate of 93.33%, and a significant negative predictive value for pancreatic necrosis, recorded at 96.15%.24 Our research further confirms the predictive capacity of the APACHE II scoring system in cases of IPN. A higher MCTSI score is positively correlated with an increased extent of pancreatic necrosis. It also indicates more severe pancreatic and peripancreatic inflammation, as well as more pronounced local fluid accumulation and reduced fluid mobility. Collectively, these factors create a conducive environment for pathogens colonization. On the other hand, highly inflammatory and enzyme-rich necrotic fluids exacerbate the necrotic process and damage the surrounding intestinal mucosa and blood vessel walls, thereby increasing the risk of intestinal bacterial translocation, secondary infection, and bleeding.25 Banday et al also reported that the MCTSI exhibited a stronger statistical association with clinical outcomes, including the duration of hospitalization, incidence of infection, emergence of organ failure, and overall mortality rates.26
Our study investigated the integration of radiomic information derived from pancreatic and peripancreatic lesions with clinical inflammatory indicators to develop a combined nomogram for predicting IPN. The established nomogram serves as a reliable non-invasive tool for predicting IPN and can effectively guide intervention decisions in patients with ANP. Based on our knowledge, there are few similar studies reported in the literature.
This research exists respective boundaries. First, it was retrospective research managed at a unitary tertiary referral center, which may have introduced selection bias and limited predictive generalization. Additional studies involving multiple centers and bigger sample sizes are necessary to identify our consequences, which would be a primary focus of our future work. Second, this study included IPN patients confirmed by extraluminal gas on CECT and/or tissue microorganism culture from FNA or invasive therapeutic interventions, yet extraluminal gas is only present in about half of the IPN patients, and FNA has a false negative rate of 12–25%,27 which introduced selection bias. Third, because AP is an inflammatory condition that often lacks clear boundaries,28 the ROIs were delineated by hand in 3D. Manual delineation is prone to be affected by individual experience, window width and window level settings, as well as subjective judgment differences, resulting in variations in ROIs, and reducing feature repeatability. In future research, our next step will be to implement artificial-intelligence-based automated or semi-automated segmentation techniques and to integrate the model into clinical workflows—both of which are essential for enhancing efficiency and clinical applicability.29 Nevertheless, the assessment by the two senior radiologists and the inclusion threshold of an ICC value of 0.75 somewhat mitigated the bias resulting from segmentation variability in our study.30 In future work, we will further quantify segmentation concordance using the Dice coefficient, adopting a ≥0.85 threshold, to systematically enhance inter-observer reproducibility.
Conclusion
In summary, by integrating radiomic information from CECT images with clinical data, we developed a radiomic nomogram for the early prediction of IPN in patients with ANP. The combined model may have important clinical value to predict IPN in patients with ANP.
Abbreviation
AP, acute pancreatitis; APACHE II, Acute Physiology and Chronic Health Evaluation; AUC, area under the curve; BUN, blood urea nitrogen; CRP, c-reactive protein; CECT, contrast-enhanced computed tomography; DCA, decision curve analysis; FNA, fine needle aspiration; ICC, intraclass correlation coefficient; IPN, infected pancreatic necrosis; IQR, interquartile range; IBSI, image biomarker standardization initiative; KNN, K-nearest neighbors; LASSO, least absolute shrinkage and selection operator; LR, logistic regression; MCTSI, modified computer tomography severity index; MODS, multiple organ dysfunction syndrome; MSAP, moderately severe acute pancreatitis; NPV, negative predictive value; PPV, positive predictive value; PCT, procalcitonin; RAC, revised Atlanta classification; ROC, receiver operating characteristic; ROI, region of interest; SAP, severe acute pancreatitis; SHAP, the Shapley Additive explanation; SVM, Support vector machine.
Data Sharing Statement
The data that support the findings of this study will be made available by the corresponding authors upon reasonable request.
Acknowledgments
We appreciate the physicians and radiologists who assisted with the study. We thank the First Affiliated Hospital of Xi’an Jiaotong University for providing clinical and image data.
Author Contributions
All authors significantly contributed to the reported work related to the conception, study design, execution, acquisition of data, analysis and interpretation; took part in drafting, revising, or critically reviewing the article; gave final approval of the manuscript; have agreed on the journal to which the article has been submitted; and agree to be accountable for all aspects of the work.
Funding
This work was supported by the National Natural Science Foundation of China under Grant Nos. 82002102 and 82472191, the Shaanxi Provincial Medical-Industrial Integration High-end Medical Equipment Common Technology R&D Platform - Intelligent Medical Equipment Common Technology R&D Sub-platform No. 2023GXJS-01(2-2), Shaanxi Province Key R&D Program No. 2021GXLH-Z-099 and the Natural Science Foundation of Shaanxi Province (2024JC-ZDXM-49).
Disclosure
The authors report no conflicts of interest in this work.
References
1. Yin M, Lin J, Wang Y, et al. Development and validation of a multimodal model in predicting severe acute pancreatitis based on radiomics and deep learning. Int J Med Inform. 2024;184:105341. doi:10.1016/j.ijmedinf.2024.105341
2. Shah J, Fernandez YVM, Jagodzinski R, Arvanitakis M. Infected pancreatic necrosis-Current trends in management. Indian J Gastroenterol. 2024;43(3):578–591. doi:10.1007/s12664-023-01506-w
3. Liu N, He J, Hu X, et al. Acute necrotising pancreatitis: measurements of necrosis volume and mean CT attenuation help early prediction of organ failure and need for intervention. Eur Radiol. 2021;31(10):7705–7714. doi:10.1007/s00330-021-07840-x
4. Boxhoorn L, van Dijk SM, van Grinsven J, et al. Immediate versus postponed intervention for infected necrotizing pancreatitis. N Engl J Med. 2021;385(15):1372–1381. doi:10.1056/NEJMoa2100826
5. Song YX, Chen ST, Zhao YT, et al. Nomogram for the prediction of infected pancreatic necrosis in moderately severe and severe acute pancreatitis. J Digestive Dis. 2024;25(4):238–247. doi:10.1111/1751-2980.13271
6. Samanta J, Dhar J, Birda CL, et al. Dynamics of serum procalcitonin can predict outcome in patients of infected pancreatic necrosis: a prospective analysis. Dig Dis Sci. 2023;68(5):2080–2089. doi:10.1007/s10620-022-07758-4
7. Tarján D, Szalai E, Lipp M, et al. Persistently high procalcitonin and C-reactive protein are good predictors of infection in acute necrotizing pancreatitis: a systematic review and meta-analysis. Int J Mol Sci. 2024;25(2):1273. doi:10.3390/ijms25021273
8. Shu W, Wan J, Chen J, et al. Initially elevated arterial lactate as an independent predictor of poor outcomes in severe acute pancreatitis. BMC Gastroenterol. 2020;20(1):116. doi:10.1186/s12876-020-01268-1
9. Bette S, Canalini L, Feitelson LM, et al. Radiomics-based machine learning model for diagnosis of acute pancreatitis using computed tomography. Diagnostics. 2024;14(7):718. doi:10.3390/diagnostics14070718
10. Zhao Y, Wei J, Xiao B, et al. Early prediction of acute pancreatitis severity based on changes in pancreatic and peripancreatic computed tomography radiomics nomogram. Quant Imaging Med Surg. 2023;13(3):1927–1936. doi:10.21037/qims-22-821
11. Hu Y, Liu N, Tang L, et al. Three-dimensional radiomics features of magnetic resonance T2-weighted imaging combined with clinical characteristics to predict the recurrence of acute pancreatitis. Front Med. 2022;9:777368. doi:10.3389/fmed.2022.777368
12. Lin Q, Ji YF, Chen Y, et al. Radiomics model of contrast-enhanced MRI for early prediction of acute pancreatitis severity. J Magn Reson Imaging. 2020;51(2):397–406. doi:10.1002/jmri.26798
13. Chen Y, Chen TW, Wu CQ, et al. Radiomics model of contrast-enhanced computed tomography for predicting the recurrence of acute pancreatitis. Eur Radiol. 2019;29(8):4408–4417. doi:10.1007/s00330-018-5824-1
14. Zhou T, Xie CL, Chen Y, et al. Magnetic resonance imaging-based radiomics models to predict early extrapancreatic necrosis in acute pancreatitis. Pancreas. 2021;50(10):1368–1375. doi:10.1097/mpa.0000000000001935
15. Zerem E, Kurtcehajic A, Kunosić S, Malkočević D Z, Zerem O. Current trends in acute pancreatitis: diagnostic and therapeutic challenges. World J Gastroenterol. 2023;29(18):2747–2763. doi:10.3748/wjg.v29.i18.2747
16. Dhaka N, Sinha SK, Samanta J. Impact of the site of necrosis on outcome of acute pancreatitis. JGH Open. 2018;2:295–299. doi:10.1002/jgh3.12087
17. Huang B, Gao Y, Wu L. Assessment of body composition and prediction of infectious pancreatic necrosis via non-contrast CT radiomics and deep learning. Front Microbiol. 2024;15:1509915. doi:10.3389/fmicb.2024.1509915
18. Trikudanathan G, Wolbrink DRJ, van Santvoort HC, Mallery S, Freeman M, Besselink MG. Current concepts in severe acute and necrotizing pancreatitis: an evidence-based approach. Gastroenterology. 2019;156(7):1994–2007e3. doi:10.1053/j.gastro.2019.01.269
19. Yushkevich PA, Piven J, Hazlett HC, et al. User-guided 3D active contour segmentation of anatomical structures: significantly improved efficiency and reliability. Neuroimage. 2006;31(3):1116–1128. doi:10.1016/j.neuroimage.2006.01.015
20. DeLong ER, DeLong DM, Clarke-Pearson DL. Comparing the areas under two or more correlated receiver operating characteristic curves: a nonparametric approach. Biometrics. 1988;44(3):837–845. doi:10.2307/2531595
21. Lambin P, Rios-Velazquez E, Leijenaar R, et al. Radiomics: extracting more information from medical images using advanced feature analysis. Eur J Cancer. 2012;48:441–446. doi:10.1016/j.ejca.2011.11.036
22. Tomaszewski MR, Gillies RJ. The biological meaning of radiomic features. Radiology. 2021;298:505–516. doi:10.1148/radiol.2021202553
23. Zhu QY, Li RM, Zhu YP, et al. Early predictors of infected pancreatic necrosis in severe acute pancreatitis: implications of neutrophil to lymphocyte ratio, blood procalcitonin concentration, and modified ct severity index. Dig Dis. 2023;41(4):677–684. doi:10.1159/000529366
24. Harshit Kumar A, Singh griwan M. A comparison of APACHE II, BISAP, Ranson’s score and modified CTSI in predicting the severity of acute pancreatitis based on the 2012 revised Atlanta Classification. Gastroenterol Rep. 2018;6(2):127–131. doi:10.1093/gastro/gox029
25. Chen Y, Zhou J, Li G, et al. Early spontaneous abdominal bleeding is associated with poor outcome in moderate to severe acute pancreatitis patients: a propensity matched study. Sci Rep. 2017;7:42607. doi:10.1038/srep42607
26. Banday IA, Gattoo I, Khan AM, Javeed J, Gupta G, Latief M. Modified computed tomography severity index for evaluation of acute pancreatitis and its correlation with clinical outcome: a tertiary care hospital based observational study. J Clin Diagn Res. 2015;9(8):Tc01–5. doi:10.7860/jcdr/2015/14824.6368
27. Wolbrink DRJ, Kolwijck E, Ten Oever J, Horvath KD, Bouwense SAW, Schouten JA. Management of infected pancreatic necrosis in the intensive care unit: a narrative review. Clin Microbiol Infect. 2020;26(1):18–25. doi:10.1016/j.cmi.2019.06.017
28. Yamashita R, Perrin T, Chakraborty J, et al. Radiomic feature reproducibility in contrast-enhanced CT of the pancreas is affected by variabilities in scan parameters and manual segmentation. Eur Radio. 2020;30(1):195–205. doi:10.1007/s00330-019-06381-8
29. Larue RT, Defraene G, De Ruysscher D, Lambin P, van Elmpt W. Quantitative radiomics studies for tissue characterization: a review of technology and methodological procedures. Br J Radiol. 2017;90(1070):20160665. doi:10.1259/bjr.20160665
30. Lambin P, Leijenaar RTH, Deist TM, et al. Radiomics: the bridge between medical imaging and personalized medicine. Nat Rev Clin Oncol. 2017;14(12):749–762. doi:10.1038/nrclinonc.2017.141
 © 2025 The Author(s). This work is published and licensed by Dove Medical Press Limited. The
full terms of this license are available at https://www.dovepress.com/terms
and incorporate the Creative Commons Attribution
- Non Commercial (unported, 4.0) License.
By accessing the work you hereby accept the Terms. Non-commercial uses of the work are permitted
without any further permission from Dove Medical Press Limited, provided the work is properly
attributed. For permission for commercial use of this work, please see paragraphs 4.2 and 5 of our Terms.
© 2025 The Author(s). This work is published and licensed by Dove Medical Press Limited. The
full terms of this license are available at https://www.dovepress.com/terms
and incorporate the Creative Commons Attribution
- Non Commercial (unported, 4.0) License.
By accessing the work you hereby accept the Terms. Non-commercial uses of the work are permitted
without any further permission from Dove Medical Press Limited, provided the work is properly
attributed. For permission for commercial use of this work, please see paragraphs 4.2 and 5 of our Terms.