Back to Journals » Infection and Drug Resistance » Volume 13
A Nomogram-Based Prediction for Severe Pneumonia in Patients with Coronavirus Disease 2019 (COVID-19)
Authors Zhang Y, Wu L, Yang J, Zhou C, Liu Y ![]()
Received 14 June 2020
Accepted for publication 19 September 2020
Published 12 October 2020 Volume 2020:13 Pages 3575—3582
DOI https://doi.org/10.2147/IDR.S261725
Checked for plagiarism Yes
Review by Single anonymous peer review
Peer reviewer comments 3
Editor who approved publication: Professor Suresh Antony
Yue Zhang,1 Lin Wu,2 Jibin Yang,3 Congyang Zhou,3 Ying Liu3
1Health Management Center, The First Affiliated Hospital of Nanchang University, Nanchang, Jiangxi Province, Peoples’ Republic of China; 2Department of Radiology, The First Affiliated Hospital of Nanchang University, Nanchang, Jiangxi Province, Peoples’ Republic of China; 3Department of Emergency Medicine, The First Affiliated Hospital of Nanchang University, Nanchang, Jiangxi Province, Peoples’ Republic of China
Correspondence: Ying Liu
Department of Emergency Medicine, The First Affiliated Hospital of Nanchang University, Yongwaizhen Street 17, Nanchang, Jiangxi 330006, Peoples’ Republic of China
Email [email protected]
Background: The outbreak of a novel coronavirus disease 2019 (COVID-19) is currently ongoing worldwide. A proportion of COVID-19 patients progress rapidly to acute respiratory failure.
Objective: We aimed to build a model to predict the risk of developing severe pneumonia in patients with COVID-19 in the early stage.
Methods: Data from patients who were confirmed to have COVID-19 and were admitted within 7 days from the onset of respiratory symptoms were retrospectively collected. The patients were classified into severe and non-severe groups according to the presence or absence of severe pneumonia during 1– 2 weeks of follow-up. The clinical characteristics and laboratory indicators were screened by cross-validation based on LASSO regression to build a prediction model presented by a nomogram. The discrimination and stability, as well as the prediction performance of the model, were analysed.
Results: The neutrophil–lymphocyte ratio, monocyte counts, eosinophil percentage, serum lactate dehydrogenase level and history of diabetes mellitus were collected for the model. Bootstrap resampling showed the apparent C-statistics, and the brier scores were 0.929 and 0.098. The optimism of the C-statistics and brier score was 0.0172 and − 0.019, respectively. The adjusted C-statistics and brier score were 0.9108 and 0.1169, respectively. The optimal cut-off value of the total nomogram score was determined to be 119 according to the maximal Youden index. The sensitivity, specificity, positive predictive value, and negative predictive value for differentiating the presence and absence of severe pneumonia were 83%, 89%, 74%, and 94%, respectively.
Conclusion: In our study, the neutrophil–lymphocyte ratio, monocyte counts, eosinophil percentage, serum lactate dehydrogenase level and history of diabetes mellitus showed great discrimination and stability for the prediction of the presence of severe pneumonia and were selected for the model.
Keywords: COVID-19, prediction, nomogram
Introduction
An epidemic caused by coronavirus disease 2019 (COVID-19) has occurred unexpectedly around the world.1–4 The clinical spectrum of COVID-19 varies from asymptomatic or pauci-symptomatic forms to clinical conditions characterized by acute respiratory failure that necessitates mechanical ventilation and support in an intensive care unit (ICU) to multi-organ and systemic manifestations in terms of sepsis, septic shock, and multiple organ dysfunction syndromes.5,6 Previous studies showed that nearly 20% of patients with COVID-19 developed a severe or critical clinical course with higher morbidity and mortality rates, more than 25% of patients required ICU admission, nearly 20% of patients developed acute respiratory distress syndrome, and 10% of patients required invasive mechanical ventilation or extracorporeal membrane oxygenation for refractory hypoxemia.6–8 Different treatments and managements between non-severe and severe COVID-19 patients are thus required. The proper management and distribution of medical resources critical factors that rely on the accurate estimation at an early stage for COVID-19 patients at high risk of developing severe pneumonia. Early recognition can not only facilitate patients’ classified management but benefit those at high risk of receiving close supervision and timely special intervention. Previous studies9,10 have attempted to screen haematological biomarkers as predictors for the severity of COVID-19, but further clinical validation is lacking. Nomograms, currently available prediction tools, show good discrimination characteristics in predicting outcomes and are simple and convenient for clinical use.11,12 Therefore, the purpose of this study was to build a model to predict the risk of developing severe pneumonia at an early stage in patients with COVID-19 and to present the model by nomogram.
Methods
Participants
The data of patients who were admitted between January 28, 2020, and March 20, 2020 at the First Affiliated Hospital of Nanchang University and were confirmed to have COVID-19 were retrospectively collected. The study was approved by the Institutional Ethics Committee of the First Affiliated Hospital of Nanchang University. Participant consent for approval was waived due to the retrospective study design. We confirmed that all patient data accessed complied with relevant data protection and privacy regulations. The inclusion criteria were as follows: (1) patients were admitted within 7 days from the onset of respiratory symptoms or in the absence of any symptoms following contact with confirmed COVID-19 patients; (2) more than two positive polymerase chain reaction (PCR) tests of severe acute respiratory syndrome coronavirus 2 (SARS-CoV-2); and (3) more than 18 years old. None of the patients had developed severe pneumonia at the time of admission.
Routine Examination and Severe Pneumonia Diagnostic Criteria
The clinical information of the patients was collected. Routine tests such as complete blood count, blood chemistries and lactate dehydrogenase were performed when upon admission and were included as predictive factors in the study. The test time from the onset of symptoms was collected. All variables including basic information and laboratory indictors in this study are reported in Table 1. The outcome of the prediction model was the presence of severe pneumonia after admission. The patients were classified into severe and non-severe groups according to the presence or absence of severe pneumonia during 1–2 weeks of follow-up. Severe pneumonia in this study included severe and critical pneumonia. The diagnostic criteria of the severe type or critical pneumonia were (1) respiratory distress (respiratory rate, ≥30 cycles per minute), (2) oxygen saturation 93% or below or arterial partial pressure of oxygen (PaO2)/oxygen concentration FiO2 less than or equal to 300 mm Hg in the resting state, (3) respiratory failure requiring mechanical ventilation, (4) shock, and (5) other forms of organ failure requiring monitoring and treatment at the intensive care unit.13 Severe pneumonia was determined if one of the diagnostic criteria was met.
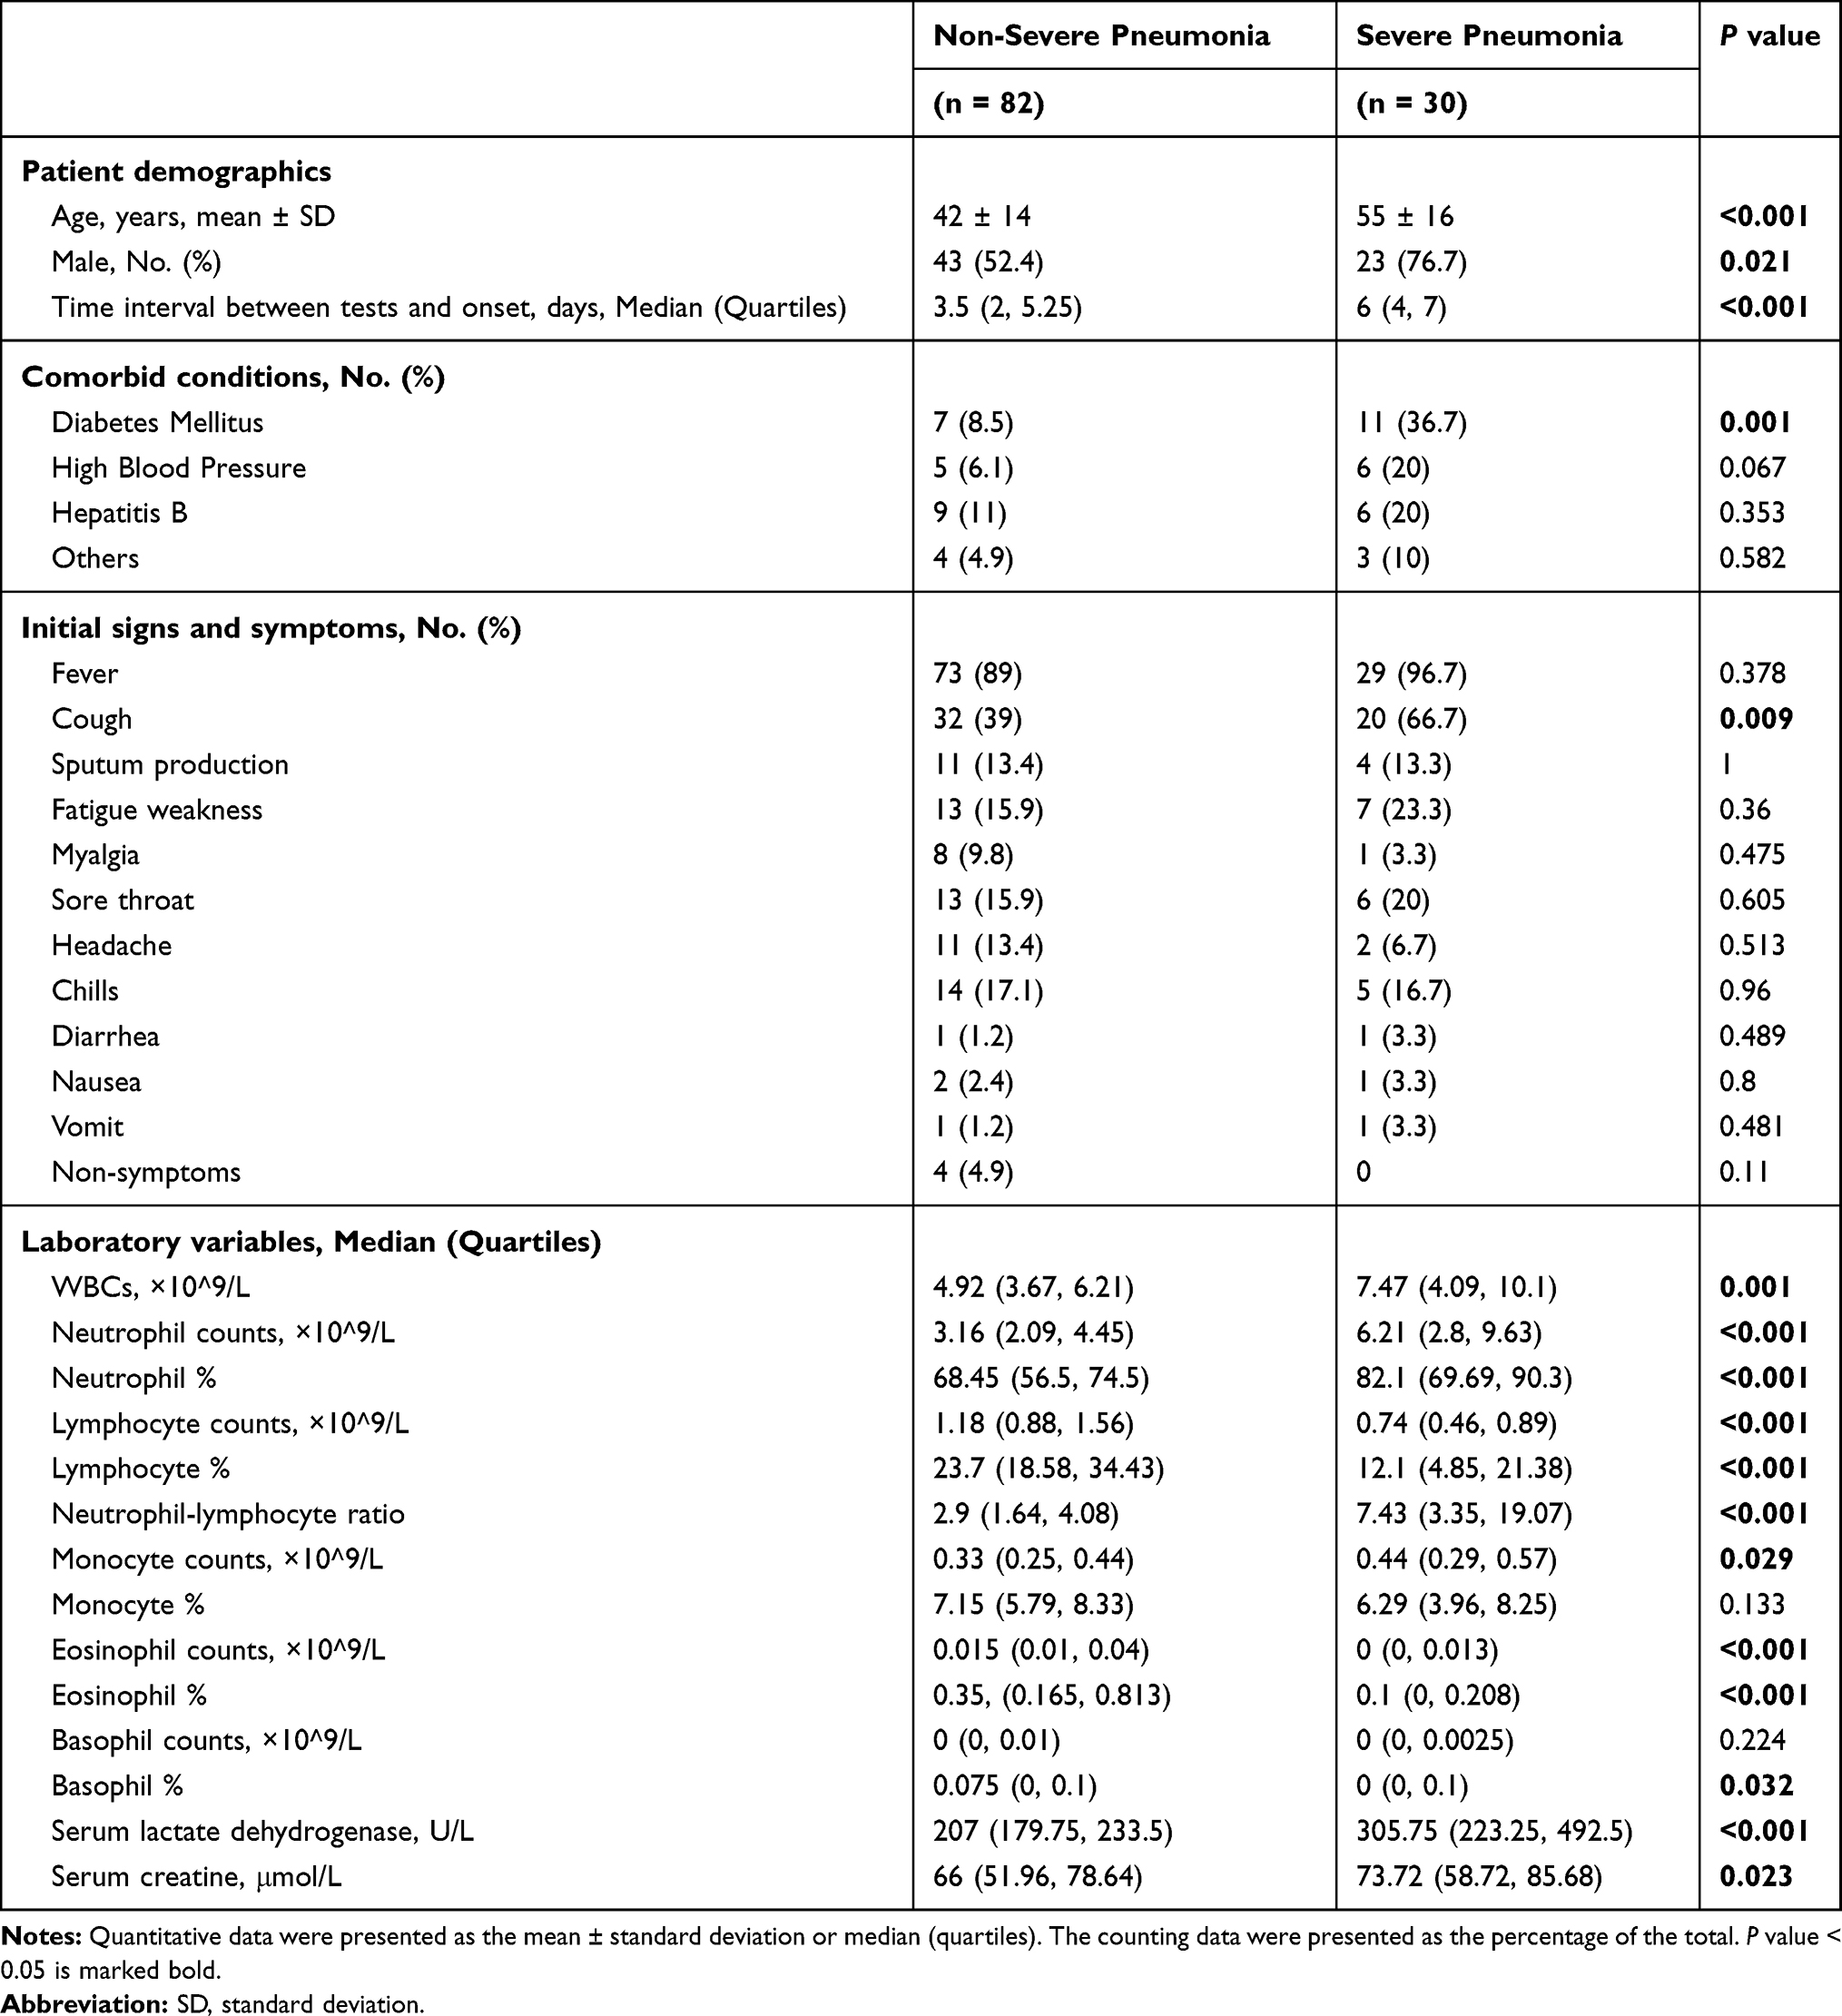 |
Table 1 Description and Comparisons of Characteristics Between COVID-19 Patients in the Severe and Non-Severe Groups |
Feature Selection and Assessment
Cross-validation based on the Least Absolute Shrinkage and Selection Operator (LASSO) method was conducted to select significant features from all variables mentioned in Table 1. The process was mainly performed in the glmnet package of R, version 3.6.0 (http://www.r-project.org/).
Development and Assessment of a Multi-Predictor Nomogram
A nomogram was constructed using selected features. A nomogram is based on proportionally converting each regression coefficient in a multivariate logistic regression point scale. The points are added across independent variables to derive total points, which are converted to predicted probabilities.14 In this study, the predictive power was measured by the concordance index (C-index), namely, C-statistics. To prove the stability of the model, bootstrapping validation with 100 resamples was conducted to overcome the overfitting problem.15 The calibration curve provided a comparison between the expected and observed conversion probabilities. The entire process was performed in the rms package of R, version 3.6.0 (http://www.r-project.org/).
Estimation for the C-Statistics and Brier of the Model by Internal Validation
Internal validation was used to evaluate the stability of the prediction model by the principle of random changes in sample composition as implemented by the bootstrap resampling technique, in which the regression models were fitted in 100 bootstrap replicates drawn with replacement from the total sample. Then, the model was refitted in each bootstrap replicate and tested on the original sample to estimate optimism in model performance. The process was performed in the stats and pROC package of R, version 3.6.0 (http://www.r-project.org/).
Applying Nomogram Assessment
For clinical use of the model, the total scores of each patient were calculated based on the nomogram. Receiver operating characteristic curve analysis was used to calculate the optimal cut-off values that were determined by maximizing the Youden index (sensitivity + specificity − 1). The accuracy of the optimal cut-off value was then assessed by the sensitivity, specificity, predictive values, and likelihood ratios. The process was performed in the pROC and epiR package of R, version 3.6.0 (http://www.r-project.org/).
Statistical Analysis
Continuous variables with normal distributions are expressed as the mean (SD) and compared using an unpaired, 2-tailed t-test. Continuous variables without normal distributions are expressed as medians (quartiles) and compared using the Mann–Whitney test. Categorical variables were compared using the χ2 test or Fisher’s exact test.
In all analyses, P < 0.05 was considered to indicate statistical significance. All analyses were performed using SPSS, version 21 and R, version 3.6.0.
Results
Demographic and Clinical Characteristics
One hundred and twelve patients who were identified as a confirmed COVID-19 were included in this study from January 28 to March 20, 2020. The 112 patients were divided into two groups according to the presence or absence of severe pneumonia after admission. The patients with (n = 82) or without (n = 30) severe pneumonia were described in Table 1. All laboratory results were obtained according to the tests, which were performed on the same day as admission. Age, male percentage, time of admission from onset, percentage of diabetes mellitus history, cough percentage, haemocyte tests including white blood cell counts, neutrophil counts, percentage of neutrophils, neutrophil-lymphocyte ratio, monocyte counts and basophil percentage, as well as serum lactate dehydrogenase and serum creatine levels, were significantly higher in the severe pneumonia group compared to the non-severe group (p < 0.05) (Table 1). The lymphocyte counts, lymphocyte percentage, eosinophil counts and eosinophil percentage in the severe group were significantly lower than the non-severe group (p < 0.05) (Table 1).
Extraction of Feature
Feature selection was conducted by cross-validation-based LASSO regression in all patients. When the lambda value was collected as 1 standard error, eight variables (age, sex, lymphocyte counts, neutrophil-lymphocyte ratio, monocyte counts, eosinophil percentage, serum lactate dehydrogenase level and history of diabetes mellitus) were selected (Figure 1). After estimating the regression coefficient in the refitting model, five variables, including the neutrophil-lymphocyte ratio, monocyte counts, eosinophil percentage, serum lactate dehydrogenase level and history of diabetes mellitus, were finally collected.
 |
Figure 1 A graph showing the cross validation in LASSO regression to screen variables. |
Establishment and Calibration of a Nomogram for the Prediction Model
A nomogram that combined the five significant predictors was constructed. Figure 2A shows the predictive nomogram, which obtained a C-statistic of 0.929 (95% CI, 0.875–0.984). The calibration plots of the nomogram are shown in Figure 2B using bootstrapping with 100 resamples. The closer the calibration curve is to the diagonal, the better the predictive power of the nomogram. Figure 2C shows a large area under the receiver operating characteristic (AUROC) curve, which was equal to the C-statistics.
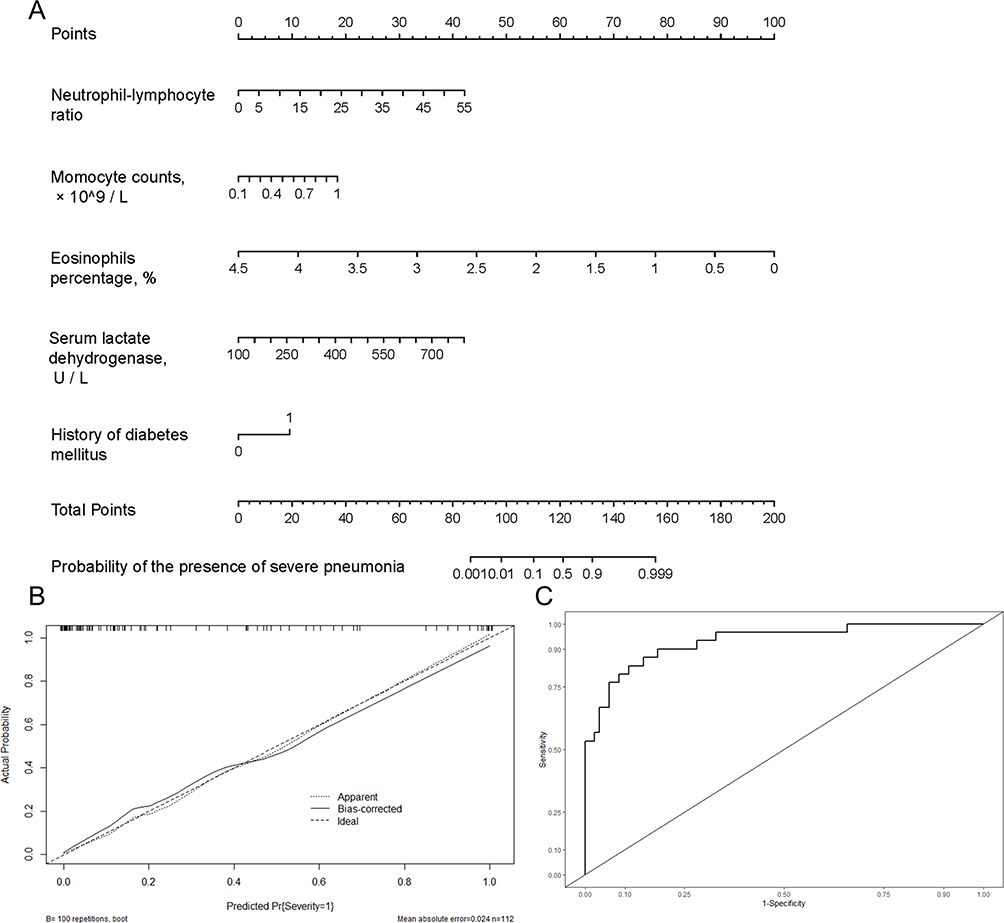 |
Figure 2 (A) Nomogram for estimating the risk of severe pneumonia after admission in COVID-19 patients. (B) Validity of the predictive performance of the nomogram in estimating the risk of the presence of severe pneumonia by 100 bootstrap tests. (C) Receiver operating characteristic (ROC) curves of the nomogram model. The ROC curve is based on a series of different dichotomous methods (cut-off value or determination threshold), with a true positive rate (sensitivity) as the ordinate and false positive rate (1-specificity) as the abscissa. |
Estimation for the C-Statistics and Brier of the Model by Internal Validation
As shown in Table 2, bootstrap resampling showed negligible model optimism. The apparent C-statistics and apparent brier score was 0.929 and 0.098, respectively. The optimism of the C-statistics and brier score was 0.0172 and −0.019, respectively. The adjusted C-statistics and brier score was 0.9108 and 0.1169, respectively.
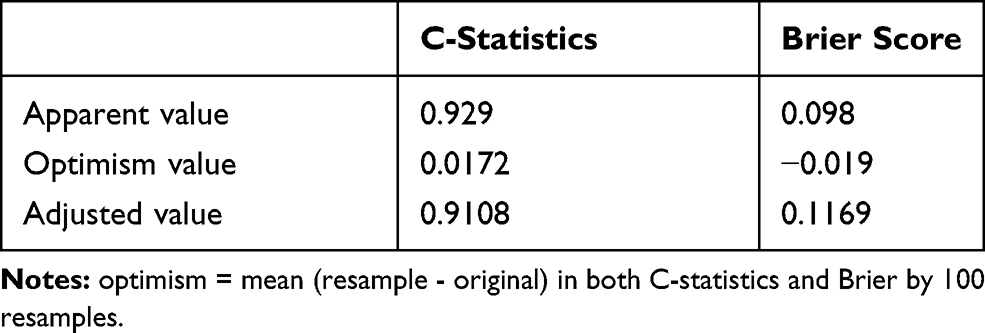 |
Table 2 The Discrimination and Calibration of the Predictive Model |
The Predictive Performance of the Nomogram
The performance of the model was good in predicting the presence of severe pneumonia. The predictive accuracy was an AUC of 0.929. The optimal cut-off value of the total nomogram score was determined to be 119. The sensitivity, specificity, positive predictive value, and negative predictive value when used in differentiating the presence from absence of severe pneumonia was 83%, 89%, 74%, and 94%, respectively (Table 3).
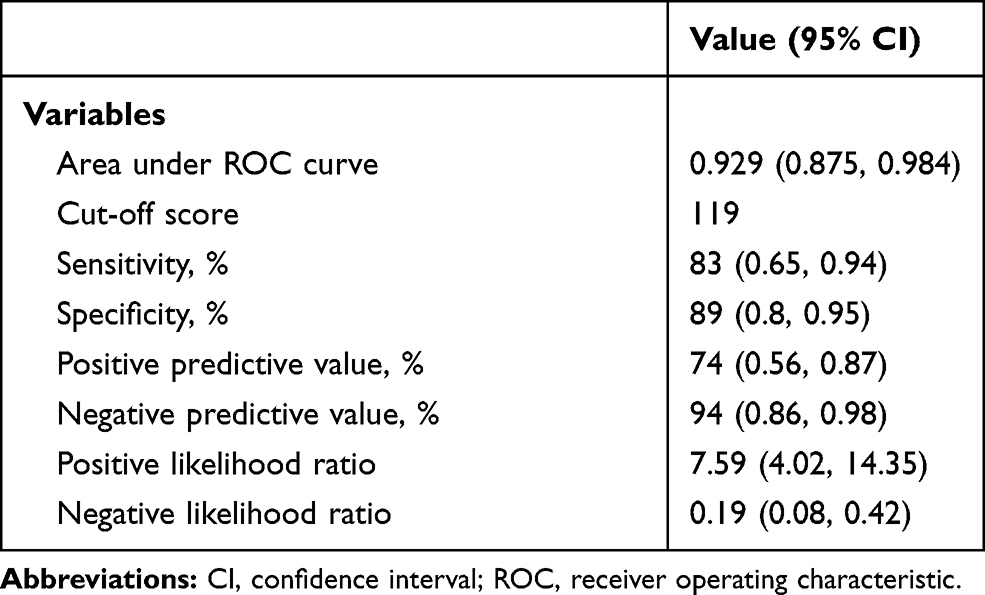 |
Table 3 Accuracy of the Prediction Score of the Nomogram for Estimating the Risk of Severe Pneumonia |
Discussion
In our study, we found that many characteristics and laboratory indicators at the early stage showed a significant difference between COVID-19 patients in severe versus non-severe groups (Table 1). After statistical layers of screening, five significant features, including the neutrophil-lymphocyte ratio, monocyte counts, eosinophil percentage, serum lactate dehydrogenase level and history of diabetes mellitus, were finally selected for the model and showed great discrimination and stability for the prediction of the presence of severe pneumonia (Figure 2 and Table 2). For clinical use of the model, we summarized the prediction performance and found that the sensitivity, specificity, positive predictive value and negative predictive value was 83%, 89%, 74%, and 94%, respectively, in estimating the risk of severe pneumonia by using the total score and 119 as the cut-off value (Table 3). The included indicators are all routine examinations performed upon patient admission. Thus, the model has a high value of practical application in the clinic. Based on the prediction, the nomogram might serve as a tool to predict patients at high risk of severe pneumonia. The model will not only help physicians perform reasonable classified management for COVID-19 patients but also facilitate randomized clinical trials to evaluate the efficacy of early inhaled oxygen or intensive care unit management on improving the prognosis of patients at high risk.
Recent research showed that COVID-19 patients deteriorated over the course of 7–14 days after the onset of initial symptoms.16 This finding is consistent with our observation, which indicates that the prediction should be carried out within 7 days after the onset of symptoms. Of the five features, the neutrophil-lymphocyte ratio and serum lactate dehydrogenase levels have been reported to be significantly correlated with severe COVID-19 pneumonia.16,17 Additionally, comorbid conditions are also important in the development of COVID-19 pneumonia. Most COVID-19 patients with severe pneumonia or those that died have underlying diseases, including diabetes, hypertension, and cardiovascular disease, and the overall case-fatality rate of these patients is higher than the non-severe patients.6 Diabetes, including undiagnosed diabetes, is more prevalent compared to other comorbidities, and makes patients more vulnerable to any infection. Previous studies reported that diabetes mellitus was one of the major factors associated with severe pneumonia following influenza infection.18 These studies support our clinical findings that diabetes is an important risk factor for predicting severe pneumonia at an early stage.
At present, few studies have been conducted to predict the development of severe pneumonia in COVID-19 patients. Of the currently available systems for assessing pneumonia severity, the pneumonia severity index (PSI) and CURB-65 score are widely validated and used; however, these scales do not play an early predictive role in the development of severe pneumonia and have low specificity for the severity of COVID-19, as well as poor performance in predicting the presence of severe COVID-19 pneumonia.16 A study combining the neutrophil-lymphocyte ratio and age to predict severe pneumonia in COVID-19 patients also showed good predictive performance.16 The current study demonstrated superior predictive performance by adding other significant indicators to the neutrophil-lymphocyte ratio.
This study has several limitations. The data were obtained from a single institution, and the model only underwent internal validation. A prospective research study is required to validate the feasibility and effectiveness of the nomogram.
Conclusions
In this study, the neutrophil-lymphocyte ratio, monocyte counts, eosinophil percentage, serum lactate dehydrogenase level and history of diabetes mellitus were selected for inclusion in the model that showed great discrimination and stability for the prediction of the presence of severe pneumonia. The model may help physicians identify COVID-19 patients at risk of developing severe pneumonia in the early stage and provide timely treatment and optimal management for medical resources.
Acknowledgments
We thank all the staff who participated in the data collection.
Funding
This study was supported by the Science and Technology Project of Jiangxi Health Committee (Grant no. 20185077, 20181020), the Natural Science Foundation of Jiangxi, China (Grant no. 2017BAB215048), and the Science and Technology Research Project of Jiangxi Provincial Department of Education (Grant no. 700993003).
Disclosure
The authors report no conflicts of interest in this work.
References
1. Patrucco F, Gavelli F, Shi R, et al. Coronavirus disease 2019 outbreak. Panminerva Med. 2020;62(2). doi:10.23736/S0031-0808.20.03897-5
2. Korean Society of Infectious D, Korean Society of Pediatric Infectious D, Korean Society of E, et al. Report on the epidemiological features of Coronavirus Disease 2019 (COVID-19) outbreak in the Republic of Korea from January 19 to March 2, 2020. J Korean Med Sci. 2020;35(10):e112. doi:10.3346/jkms.2020.35.e112
3. Arshad Ali S, Baloch M, Ahmed N, et al. The outbreak of Coronavirus Disease 2019 (COVID-19)-An emerging global health threat. J Infect Public Health. 2020;13(4):
4. Al-Mandhari A, Samhouri D, Abubakar A, et al. Coronavirus disease 2019 outbreak: preparedness and readiness of countries in the Eastern Mediterranean Region. East Mediterr Health J. 2020;26(2):136–137. doi:10.26719/2020.26.2.136
5. Sohrabi C, Alsafi Z, O’Neill N, et al. World Health Organization declares global emergency: a review of the 2019 novel coronavirus (COVID-19). Int J Surg. 2020;76:71–76. doi:10.1016/j.ijsu.2020.02.034
6. Huang C, Wang Y, Li X, et al. Clinical features of patients infected with 2019 novel coronavirus in Wuhan, China. Lancet. 2020;395(10223):497–506. doi:10.1016/S0140-6736(20)30183-5
7. Wu Z, McGoogan JM. Characteristics of and important lessons from the Coronavirus Disease 2019 (COVID-19) outbreak in China: summary of a report of 72,314 cases from the Chinese Center for Disease Control and Prevention. JAMA. 2020;323(13):1239. doi:10.1001/jama.2020.2648
8. Lai CC, Shih TP, Ko WC, et al. Severe acute respiratory syndrome coronavirus 2 (SARS-CoV-2) and coronavirus disease-2019 (COVID-19): the epidemic and the challenges. Int J Antimicrob Agents. 2020;55:105924. doi:10.1016/j.ijantimicag.2020.105924
9. Gao Y, Li T, Han M, et al. Diagnostic utility of clinical laboratory data determinations for patients with the severe COVID-19. J Med Virol. 2020;92(7):791–796. doi:10.1002/jmv.25770
10. Liu Y, Yang Y, Zhang C, et al. Clinical and biochemical indexes from 2019-nCoV infected patients linked to viral loads and lung injury. Sci China Life Sci. 2020;63(3):
11. Shariat SF, Capitanio U, Jeldres C, et al. Can nomograms be superior to other prediction tools. BJU Int. 2009;103(4):
12. Lei Z, Li J, Wu D, et al. Nomogram for preoperative estimation of microvascular invasion risk in hepatitis B virus-related hepatocellular carcinoma within the Milan criteria. JAMA Surg. 2016;151(4):
13. New coronavirus pneumonial diagnosis and treatment program (7th ed.) (in Chinese); 2020. Availablee from: http://bgs.satcm.gov.cn/zhengcewenjian/2020-03-04/13594.html.
14. Steyerberg EW, Vergouwe Y. Towards better clinical prediction models: seven steps for development and an ABCD for validation. Eur Heart J. 2014;35(29):
15. Harrell FE, Lee KL, Mark DB, et al. Multivariable prognostic models: issues in developing models, evaluating assumptions and adequacy, and measuring and reducing errors. Stat Med. 1996;15(4):
16. Liu J, Liu Y, Xiang P, et al. Neutrophil-to-lymphocyte ratio predicts severe illness patients with 2019 Novel Coronavirus in the early stage. J Transl Med. 2020;18(1):206. doi:10.1186/s12967-020-02374-0
17. Chen N, Zhou M, Dong X, et al. Epidemiological and clinical characteristics of 99 cases of 2019 novel coronavirus pneumonia in Wuhan, China: a descriptive study. Lancet. 2020;395(10223):
18. Zou Q, Zheng S, Wang X, et al. Influenza A-associated severe pneumonia in hospitalized patients: risk factors and NAI treatments. Int J Infect Dis. 2020;92:
 © 2020 The Author(s). This work is published and licensed by Dove Medical Press Limited. The
full terms of this license are available at https://www.dovepress.com/terms
and incorporate the Creative Commons Attribution
- Non Commercial (unported, 3.0) License.
By accessing the work you hereby accept the Terms. Non-commercial uses of the work are permitted
without any further permission from Dove Medical Press Limited, provided the work is properly
attributed. For permission for commercial use of this work, please see paragraphs 4.2 and 5 of our Terms.
© 2020 The Author(s). This work is published and licensed by Dove Medical Press Limited. The
full terms of this license are available at https://www.dovepress.com/terms
and incorporate the Creative Commons Attribution
- Non Commercial (unported, 3.0) License.
By accessing the work you hereby accept the Terms. Non-commercial uses of the work are permitted
without any further permission from Dove Medical Press Limited, provided the work is properly
attributed. For permission for commercial use of this work, please see paragraphs 4.2 and 5 of our Terms.