")
Back to Journals » International Journal of Nanomedicine » Volume 13
A new SERS strategy for quantitative analysis of trace microalbuminuria based on immunorecognition and graphene oxide nanoribbon catalysis
Authors Wen G, Jing Q , Liang A, Jiang Z
Received 20 May 2018
Accepted for publication 2 August 2018
Published 5 October 2018 Volume 2018:13 Pages 6099—6107
DOI https://doi.org/10.2147/IJN.S174765
Checked for plagiarism Yes
Review by Single anonymous peer review
Peer reviewer comments 2
Editor who approved publication: Dr Linlin Sun
Guiqing Wen,1,2,* Qi Jing,1,2,* Aihui Liang,1,2 Zhiliang Jiang1,2
1Key Laboratory of Ecology of Rare and Endangered Species and Environmental Protection (Guangxi Normal University), Ministry of Education, Guangxi Key Laboratory of Environmental Pollution Control Theory and Technology, Guilin, China; 2Department of Environment Science, College of Environment and Resources, Guangxi Normal University, Guilin, China
*These authors contributed equally to this work
Background: Microalbuminuria (mAlb) detection is essential for the diagnosis and prognosis of nephrotic patients and hypoproteinemia. In this article, we develop a new surface-enhanced Raman scattering (SERS) quantitative analysis method to detect mAlb in urine.
Methods: Combined the mAlb immunoreaction with gold nanoreaction of graphene oxide nanoribbons (GONR)-HAuCl4-H2O2, and used Victoria blue B (VBB) as molecular probe with a SERS peak at 1,615 cm-1, a new SERS strategy for quantitative analysis of trace mAlb in urine was established.
Results: The linear range of SERS quantitative analysis method is from 0.065 to 2.62 ng/mL, with a detection limit of 0.02 ng/mL. The SERS method was applied to analysis of mAlb in urine with good accuracy and reliability, the relative standard deviation is 0.49%–2.28% and the recovery is 96.9%–109.8%.
Conclusion: This study demonstrated that the new SERS quantitative analysis method is of high sensitivity, good selectivity and simplicity. It has been applied to analysis of mAlb in urine, with satisfactory results.
Keywords: graphene oxide nanoribbon, nanocatalysis, microalbumin immunoreaction, gold nanoreaction, SERS
Introduction
Nanoparticles in solutions not only have novel surface nanoplasmon effect but also exhibit high catalytic activity as natural enzymes and mimic enzymes with stabilization and economic characteristics, and it has been used in different fields such as materials science, physics, chemistry, biology, and environmental science.1–4 In analytical chemistry, catalysis such as molecular reaction and nanoparticle reaction can be used to amplify signals to enhance sensitivity and have been utilized in absorption, fluorescence, resonance Rayleigh scattering (RRS), and surface-enhanced Raman scattering (SERS).5–8 A label-free DNAzyme-cleaving fluorescence method was developed for the determination of trace Pb2+ based on the catalysis of AuPd nanoalloy on the reduction of rhodamine 6G.5 Qu et al reported a colorimetric platform for visual detection of 0.1–10 ng/mL cancer biomarker based on intrinsic peroxidase activity of graphene oxide (GO).6 He et al prepared Au@Pt nanorods, which showed multiple enzyme properties and were used for spectrophotometric determination of 4.5×10⁻⁵−1×10⁻³ mol/L glucose (Glu).7 The nanocatalytic particle reaction is very interesting due to the novel surface plasmon resonance of Au and Ag nanoparticle that can be utilized to develop surface plasmon resonance absorption, RRS, and SERS methods with good features. A facile and sensitive peptide-modulating GONR catalytic nanoplasmon analytical platform was reported for human chorionic gonadotropin.8 Recently, non-metal nanoparticles are interesting to analysts. Carbon nanotube (CNT) is a one-dimensional nanomaterial with a complete molecular structure at the nanoscale and is a good precursor to prepare water-soluble and stable GONR. CNTs have been used in the field of chemical sensing for its excellent physical and chemical properties. Ye et al9 produced MnO2/CNT composites with KMnO4 oxidizing multi-walled carbon nanotubes (MWCNTs) to have strong electrocatalytic oxidation properties to detect H2O2 as low as 0.1 μM. Qu et al10 investigated the catalytic activity of the peroxidase mimetics of single-walled carbon nanotubes (SWCNTs) and achieved the Cu2+ visual detection. Cui et al11 prepared helical CNTs by hydrothermal-hydrogen reduction and investigated its catalytic activity as peroxidase mimetics. An electrochemical biosensor for H2O2 was developed with a linear range (LR) of 0.5–115 μmol/L. Zhang et al12 formed composite nanomaterials by combining positively charged gold nanoparticles (AuNPs) with SWCNTs and found that the material had a strong peroxide mimetic enzyme activity, thereby established a labeled DNA hybridization colorimetric detection method. However, CNTs are not water soluble that limits its application, and GONRs overcome this problem and provide the conditions for its analytical application without organic solvents. Zhang13 developed a bioelectrochemical sensor based on GONR modified for rapid detection of L/D-amino acids (AA) with an LR of 0.25–1.25 mmol/L and a detection limit (DL) of 100 and 60 μmol/L, respectively. Dong et al14 used GONR to build biosensors to detect 5–100 μmol/L adenosine triphosphate. Zhu et al15 developed a novel MWCNTs@GONR core-shell heterostructure and a sensitive electrochemical sensor for the detection of 8–500 nmol/L polycyclic aromatic amines. So far, no SERS was used to track GONR-catalytic AuNP reaction that can be regulated by mAlb immunoreaction for assay of trace mAlb.
SERS is a kind of selective and sensitive molecular spectral technique, which has attracted much attention in analysis, biology, and medical treatment.16 Generally, SERS signal depends upon a number of factors. However, the substrate-adsorbed molecular probe can greatly amplify the signals and it is linear to the SERS signal at some certain conditions,17,18 and an SERS method can be developed for the detection of the molecular probe. Javier and Ronei17 studied a paper-based portable SERS method for the detection of uric acid, with an LR of 0–3.5 mmol/L and a DL of 0.11 mmol/L. Wang et al18 used the catalytic activity of GO to catalyze the H2O2-HAuCl4 system, and then ligands regulated the use of SERS to detect human chorionic gonadotropin, and Hg2+ in concentrations ranging from 0.25 to 10 ng/mL, 0.25–10 nmol/L, was tested on samples which showed good recovery. Frost et al19 developed a SERS sensor based on citrate-functionalized AuNP for 50–1,000 ng/L Pb2+. Gao et al20 immobilized the peptide nucleic acid with the target DNA on a slide, and 1.0×10⁻¹⁰–1.0×10⁻⁶ mol/L DNA can be detected by SERS. Another type of SERS method was reported according to the change in the concentration of nanosol substrate in the analytical system. For example, a facile aptamer-regulating gold nanoplasmonic SERS detection strategy was proposed for trace lead ions based on the nanocatalytic particle reaction and nanoplasmon. Immunoassay is a kind of analytical method based on the specific reaction of antigen and antibody (Ab). It has the characteristics of high sensitivity and specificity and has been used in the fields of disease diagnosis, food safety, and environmental protection.21 In recent years, highly sensitive SERS technology combining with specific immunoreaction has been favored to analysts.22–26 Ma et al26 reported an SERS quantitative analysis method for trace human chorionic gonadotropin using a label-free Victoria blue B (VBB; C33H32ClN3) as probe in the aggregated immunonanogold sol substrate. She et al27 combined Hg2+ with the double-labeled Raman active 4-mercaptobenzoic acid and gold nanoparticles monoclonal antibodies on immunochromatographic test strips to obtain SERS immunoprobe to detect as low as 0.45 pg/mL of Hg2+. To our best knowledge, there are no SERS quantitative analysis methods for trace mAlb without preparation of immunonanoprobe and label-free SERS molecular probes, based on the coupling of GONR-catalytic nanoreaction with immunoreaction.
Albumin is a normal protein in the blood, but there is only a small amount of albumin in the urine under physiological conditions (<20 mg/L), because it is usually reabsorbed by glomerular filtration and renal proximal tubule.28 Urinary albumin that is normally in the range of 20–200 mg/L is called as microalbuminuria (mAlb).29 So it should be noted when the mAlb concentration is sustained excess, because it shows that nephrotic patients have a large number of albumin leakage and may be hypoproteinemia. And the development of kidney disease is possibly irreversible. Therefore, proteinuria is an important clinical symptom of nephropathy, and the control of mAlb concentration has a great clinical reference value to determine the degree of disease and prognosis. The rise of mAlb concentration is a reflection of early glomerular lesions sensitive indicators, especially in chronic renal injury such as diabetic nephropathy, hypertension, and systemic lupus erythematosus, and its detection is clinically significant.30 At present, mAlb detection methods are mainly electrochemical immunosensor,31 radioimmunoassay,32 ELISA,33 turbidity analysis,34 high-performance liquid chromatography, and so on.35 In this paper, a new gold nanoplasmon molecular spectral platform was established for rapid and selective quantitative detection of trace mAlb based on the immunoreaction-regulation of the GONR catalytic AuNP reaction.
Experimental
Instruments and reagents
A DXR smart Raman spectrometer (Thermo Fisher Scientific, Waltham, MA, USA) with laser wavelength of 633 nm, power of 2.5 mW, slit of 50 μm, and acquisition time of 5 seconds; Hitachi F-7000 fluorescence spectrophotometer (Hitachi Ltd, Tokyo, Japan); TU-1901 dual-beam UV-visible spectrophotometer (Beijing Puxi General Equipment Limited Company, Beijing, China); and constant temperature water bath were used.
A 97 mmol/L HAuCl4 solution, 10 μmol/L VBB, 10 mol/L H2O2 solution, 3.4 mmoL/L trisodium citrate, 10 mmol/L AgNO3, 0.1 moL/L Glu, 10 mg/mL mAlb, and 5 mg/mL mAlb Ab were prepared. 98% H2SO4, KMnO4, GO (Nanjing Xianfeng Nanomaterial Technology Co. Ltd, Nanjing, China) and MWCNTs (No XFM12; Nanjing Xianfeng Nanomaterial Technology Co. Ltd) were used. The used reagents were of analytical pure grade, and the experimental water was the secondary distilled water.
Preparation of GONR
GONR was prepared by chemical melting MWCNTs. 50 mg of MWCNT powder was added into a 50 mL round bottom flask which containing 10 mL of concentrated H2SO4 and the reaction took place for 1 hour. Then, a certain content (100, 200, 250, 300, 400, 500, 750, or 1,000 mg) of KMnO4 was added and mixed well before the solution being heated for 2 hours in a 60°C water bath. The product was added into 200 mL ice water containing 5 mL of 30% H2O2 before being dispersed for 10 minutes by unltrasonic and centrifuged at 7,000 rpm for 10 minutes. The supernatant was obtained which contained 230 μg/mL GONR. Thus, GONR of different oxidation degrees (GONR1, GONR2, GONR3, GONR4, GONR5, GONR6, GONR7, and GONR8) were prepared by changing the amount of KMnO4. The supernatant was neutralized to pH 7 with 50 mmol/L NaOH and diluted to the desired concentration before use.
Procedure
A suitable concentration of mAlb, 50 μL of 60 ng/mL mAlb and 60 μL of 47.6 ng/mL GONR were added into a 5 mL test tube successively. After mixing well for 10 minutes, 100 μL of 2.9 mmol/L HAuCl4 and 30 μL of 0.1 mol/L H2O2 solution were added and diluted to the volume of 1.5 mL with water. The mixture was heated in a 60°C water bath for 10 minutes, then cooled with ice water to terminate the reaction, and 50 μL 10 μmol/L VBB was added. The SERS intensity  and the blank without mAlb
  was measured to calculate the value of
  . DL was three times of SD which obtained from parallel determination of blank samples (n=10).
Results and discussion
Principles of analysis
The catalytic reaction of H2O2–HAuCl4 increased with the increase of GONR concentration. The more the nanoparticle catalyst is added, the higher SERS intensity is obtained. In the system with Ab, the protein macromolecules bound to GONR and inhibited its catalytic activity. When the mAlb antigen was added, it specifically bound to the Ab, and the nanoenzyme GONR was released. With the increase of the amount of mAlb, the SERS peak increased due to the restoration of GONR catalysis. The mAlb concentration and SERS peak were of a linear relationship, which could be established to detect mAlb by SERS technique (Figure 1).
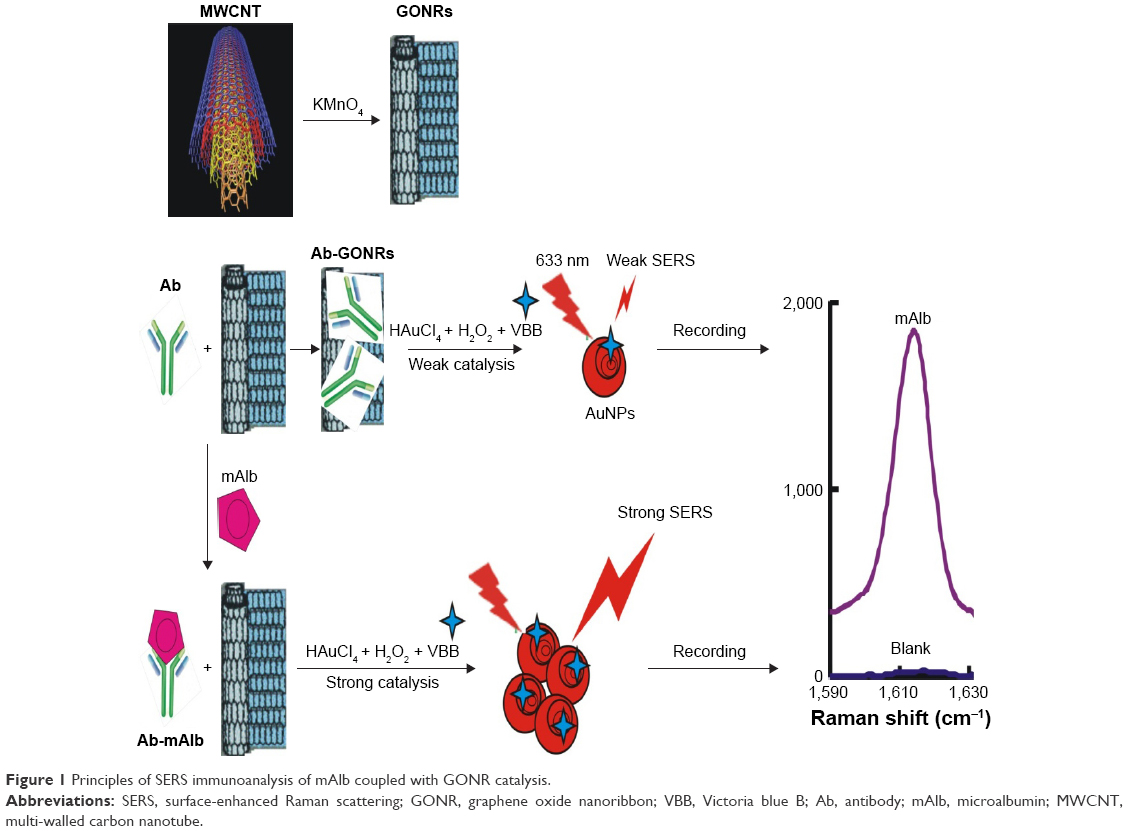 | Figure 1 Principles of SERS immunoanalysis of mAlb coupled with GONR catalysis. |
SERS spectra
Under the normal pressure and temperature, the reaction of H2O2 and HAuCl4 was slow. GONR had strong catalytic effect on the reaction to form AuNPs that exhibited five strong SERS peaks in the presence of VBB molecular probes. The characteristic peaks of the above system include 1,164 (C−C stretching), 1,199 (C−H bending), 1,362 (ring stretching), 1,393 (C−N stretching), and 1,615 (C=N and N−H stretching). After adding Ab, it could inhibit the catalytic activity of GONR by binding to the surface of GONR catalyst, and the SERS signal linearly decreased (Figure S1). After the addition of mAlb, the stable immunocomplexes formed to release free GONR, and the SERS signal enhanced due to the catalysis recovering. With the increase of the amount of mAlb, the catalysis increased to cause the SERS intensity to gradually increase for the GONR6 (Figure 2), GONR3 (Figure S2A), and GO (Figure S2B) analytical systems. Results showed that the GONR6 catalysis, using the slope of  vs concentration of GONR, was the strongest, and the GONR6 system for detection of mAlb was the most sensitive. The blank spectra of pure GONRs, antibodies, and micro-albumin of the test concentrations were recorded respectively, and the results showed that all the blank spectra were very weak and that meant that the SERS peaks mainly attributed to the product of the nanocatalytic reaction. The SERS peak at 1,615 cm−1 was chosen for mAlb assay because it was the most sensitive and the intensity
  was linear to the mAlb concentration.
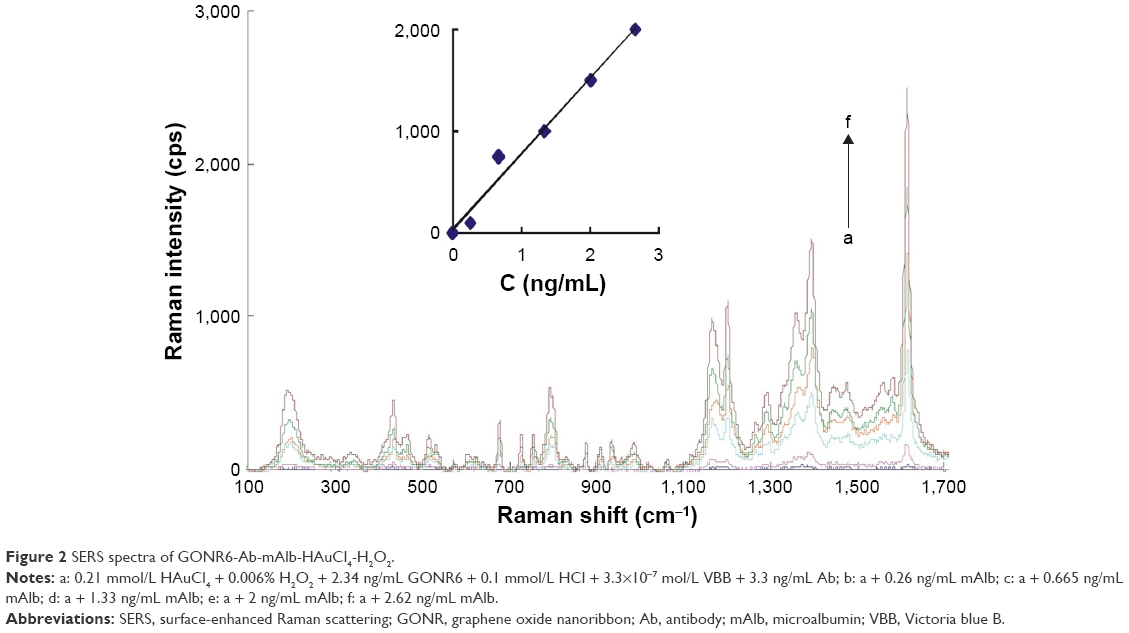 | Figure 2 SERS spectra of GONR6-Ab-mAlb-HAuCl4-H2O2. |
RRS and UV-Vis spectra
According to the procedure, the RRS spectra were obtained by synchronous scanning with the fluorescence spectrophotometer under the conditions of voltage =450 V, excited slit = emission slit =5 nm, emission filter =1% T attenuator, and λex − λem = Δλ =0. The results showed that GONR had a strong resonance scattering peak at about 310 nm. With the increase of mAlb concentration, more GONR was released and more AuNPs were produced which lead to the linear increase in the RRS peak (Figure S3). In the GONR systems, GONR6 was the most sensitive, and a simple and sensitive RRS method could also be developed to detect the concentrations of mAlb with an LR of 0.08–3.18 ng/mL (Figure 3A). Compared to the SERS method, the RRS method was less sensitive, but the procedure of RRS method is simpler than the SERS method without VBB. The TU-1901 dual-beam UV-Vis spectrophotometer was used to measure the absorbance of the system, and the results (Figure 3B, Figure S4) showed that GONR6 system had an obvious absorption peak at about 580 nm. With the increase of mAlb concentration, the Abs peak gradually increased.
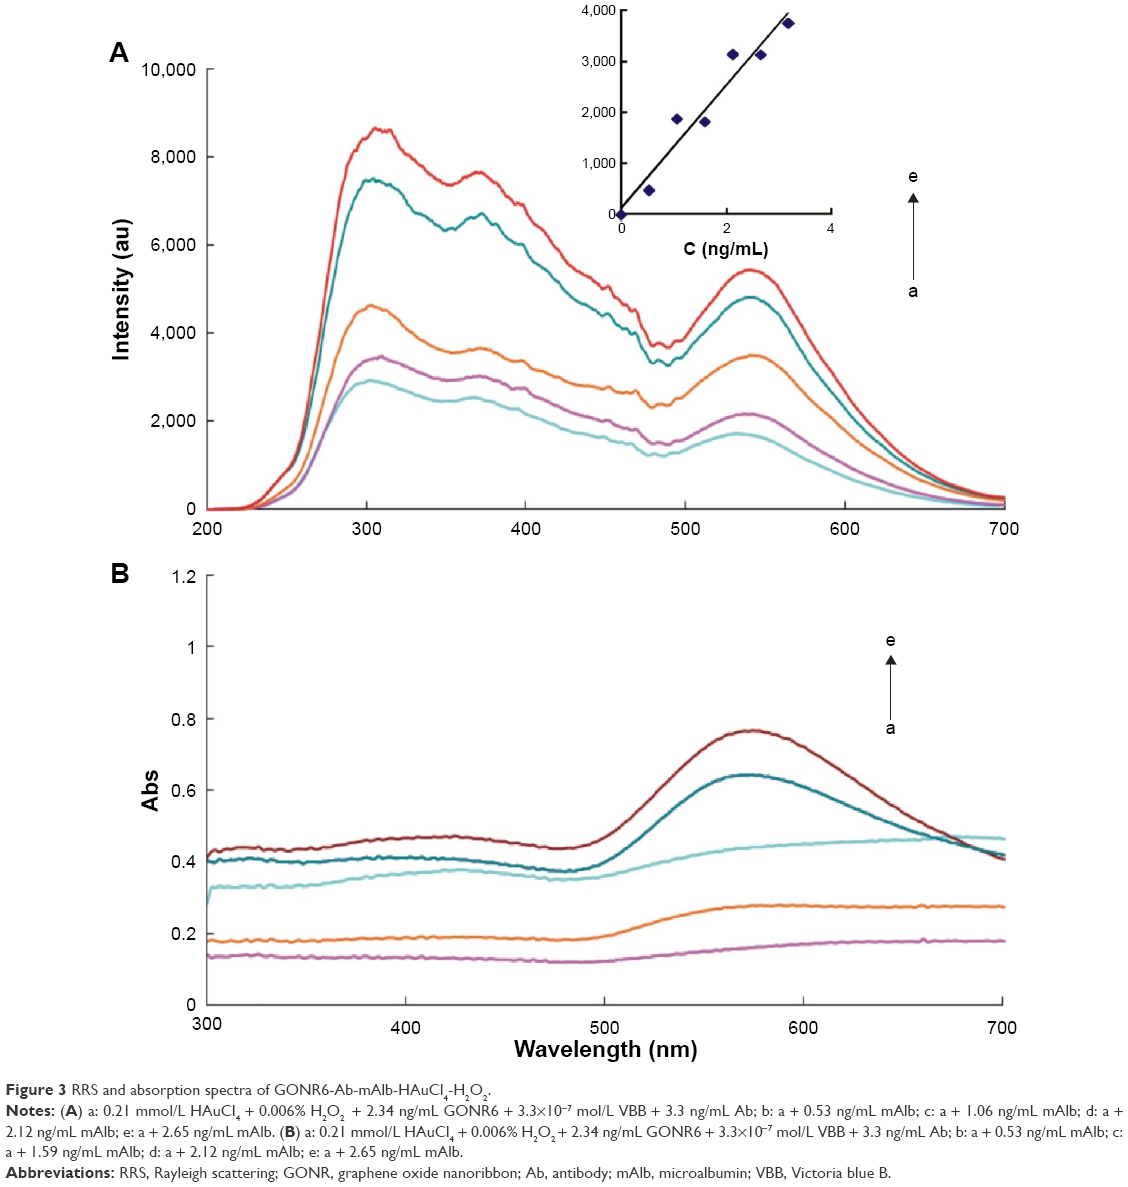 | Figure 3 RRS and absorption spectra of GONR6-Ab-mAlb-HAuCl4-H2O2. |
Catalysis and inhibition
Under the experimental conditions, MWCNT has no catalysis because it is insoluble in water. GONR and GO catalyzed H2O2–HAuCl4 reaction to generate nanoparticles (Figure 4). As the oxidation–reduction pair of Au3+/Au has a low potential (1.401 V),36 it is difficult to form AuNPs from the Au3+ ions in one step. The reaction is easier to proceed with the addition of GONR as a catalyst. Since GONR has rich surface electrons, the electrons are transferred from the GONR to the Au3+ ions and converted into Au+ ions. The oxidation–reduction pair of Au+/Au has higher potential (1.692 V) and AuNPs are easier to be obtained. The catalytic activities of eight kinds of different GONR were compared mainly by three parameters (LR, linear equation, and coefficient), and the inhibition of Ab was studied (Table 1). The results showed that the linear equation of GONR6 system had the highest slope. This shows that GONR6 had the strongest catalysis because MWCNT had the most suitable oxidation degree and the carboxyl numbers were the most suitable. When the Ab was added into the system, the Ab would attach to the GONR surface, blocking the contact between the catalyst and H2O2/HAuCl4 to inhibit its catalytic activity. With the increase of Ab, the system catalytic effect reduced and the SERS intensity weakened. The system reduction  has a linear relationship with Ab concentration, and the inhibition of Ab-GONR6 system was the strongest because the slope is biggest.
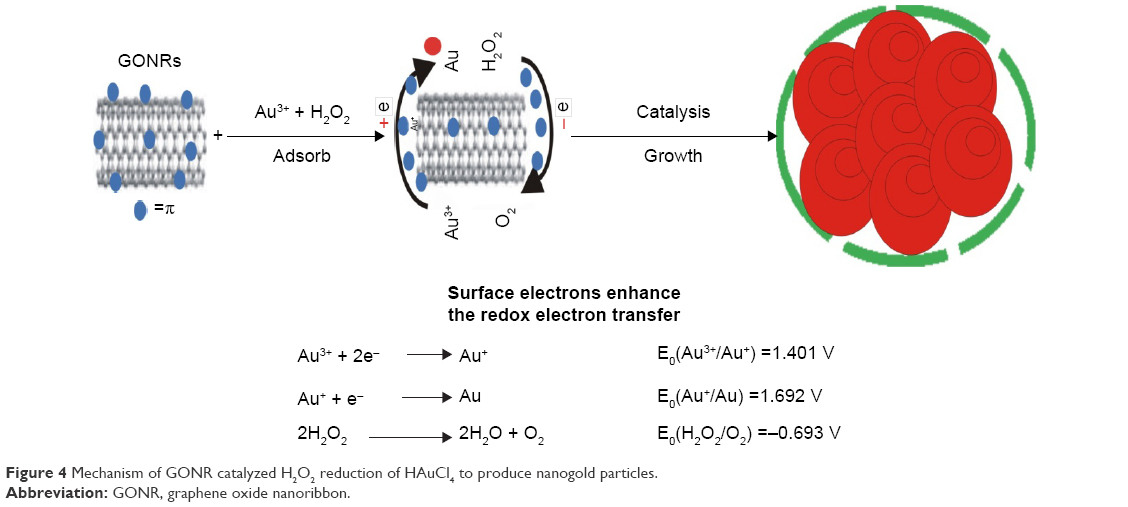 | Figure 4 Mechanism of GONR catalyzed H2O2 reduction of HAuCl4 to produce nanogold particles. |
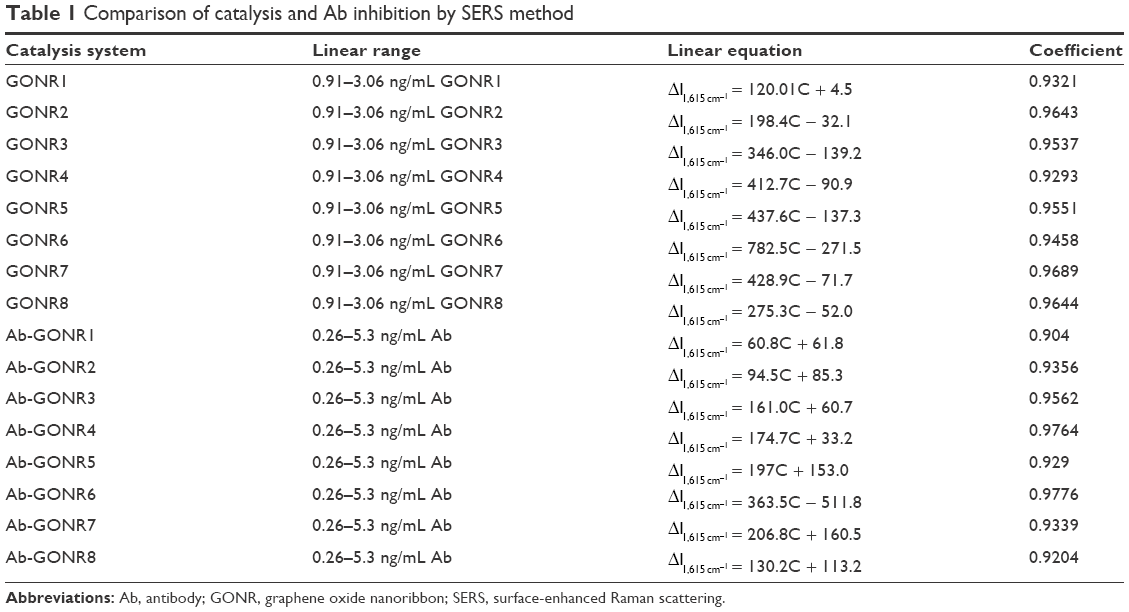 | Table 1 Comparison of catalysis and Ab inhibition by SERS method |
Laser scattering
The size distribution of nanoparticles of mAlb-Ab-GONR6-H2O2-HAuCl4 system was detected (Figure 5). The results showed that the average particle size of the non-mAlb system was 240±12 nm (Figure 5A). With the increase of mAlb concentration, the average particle sizes of the nanoparticles were 190.1±9.5 and 170.5±8.5 nm, respectively (Figure 5B and C), and the particle size was generally uniform.
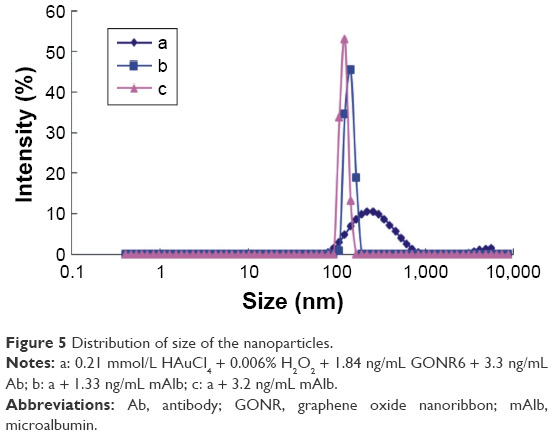 | Figure 5 Distribution of size of the nanoparticles. |
Transmission electron microscopy (TEM)
In addition to laser scattering, TEM was also used to record the shape and size of the particles. According to the procedure, TEM of the different systems were recorded (Figure 6). The catalytic activity of the blank system without mAlb was weak, so the reaction of H2O2–HAuCl4 was slow and there were rare big particles in the system (Figure 6A). When mAlb was added, it reacted specifically with the Ab to form free GONR6 and more nanoparticles were produced due to the restoration of GONR6 catalysis (Figure 6B). For the lower oxidation degree of GONR2, the catalytic effect was weaker and the AuNPs produced by the reaction were less. GONR2 with low oxidation degree contained a small amount of nanobelts. GONR6 solution with higher oxidation degree showed good catalytic activity, and the reaction resulted in more nanoparticles with comparatively more uniform particle size.
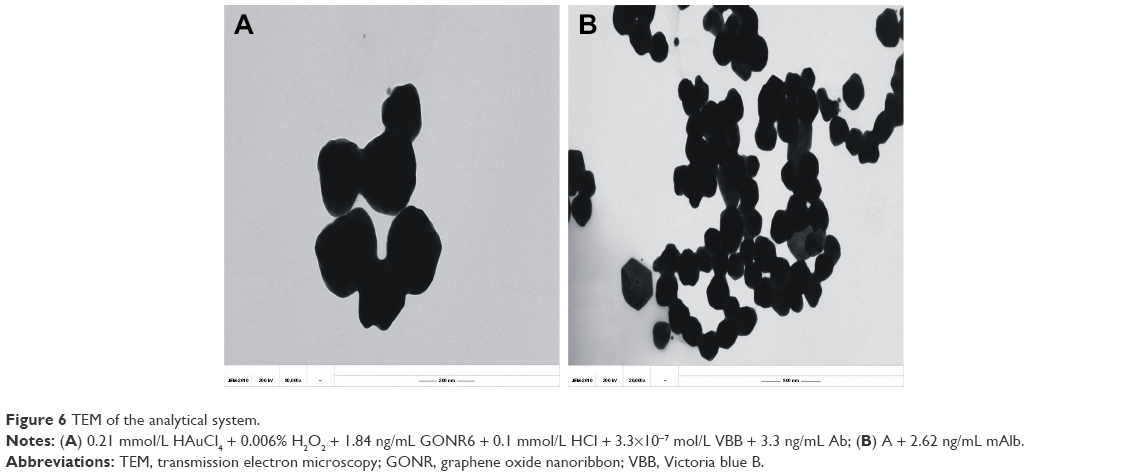 | Figure 6 TEM of the analytical system. |
Optimization of analytical conditions
The analytical conditions of HAuCl4-H2O2-GONR6-Ab-mAlb system were optimized (Figure S5). The results showed that  reached the maximum at 1.84 ng/mL of GONR6. When the concentration of Ab was 3.3 ng/mL,
  reached the maximum. When the concentration of H2O2 was 2 mmol/L,
  was maximum. When the HAuCl4 concentration was 0.152 mmol/L,
  reached the maximum, and so 0.152 mmoL/L HAuCl4 was selected. The HCl concentration was optimized too, and 0.11 mmol/L HCl was selected. Under the chosen conditions at 60°C water bath, the reaction time of 10 minutes was good. The probe concentration was optimized, and 0.33 μmol/L VBB was selected.
Working curve
According to the procedure, the working curves of different SERS systems were drawn. For the GONR6 system, which was the most sensitive, the concentration of mAlb in the LR of 0.065–2.6 ng/mL has a good linear relationship with the  , with the DL of 0.02 ng/mL. By comparing three analytical techniques of SERS/RRS/Abs (Tables 2, S1, and S2), the SERS method of GONR6 system had the highest slope (914.19), which shows that it has the highest sensitivity because of being strongest catalytic amplification, so it was selected to measure mAlb. Compared with the reported mAlb analysis method (Table S3),31–35,37–39 this method is highly sensitive and easy to operate, and it is one of the best methods for detecting mAlb.
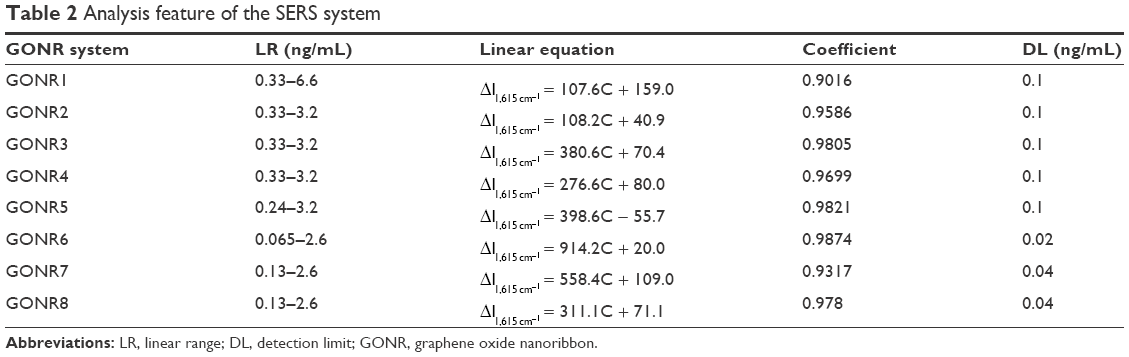 | Table 2 Analysis feature of the SERS system |
Interference effects
The effects of coexisting substances in HAuCl4-H2O2-GONR6-Ab-mAlb system on the determination of 10 ng/mL mAlb were investigated. The results showed that 100 times of K+, Zn2+, Ca2+, S2O32−, SO32−, NO2−, CO32−, tyrosine, lysine, and phenylalanine; 50 times of Cu2+, Mg2+, tryptophan, and glutamic acid; and 10 times of Fe3+ and cysteine did not interfere with the determination in the relative error range of no more than ±10.0%, and the method has good selectivity.
Sample analysis
Five fresh urine samples including two from diabetic patients were obtained from the Yanshan District People’s Hospital of Guilin City, and the samples were detected according to the experimental procedures. Then, different standard mAlb solution was added and detected. The results (Table S4) showed that the relative SD was between 0.49% and 2.28%, and the recoveries were between 96.9% and 109.8%.
Conclusion
The as-prepared GONR has strong catalytic effect on HAuCl4–H2O2 nanoreaction to form AuNPs with nanoplasmon effect such as SERS, RRS, and Abs, and Ab could adsorbed on the surface of GONR, which blocks the redox electron transfer of HAuCl4 and H2O2 to inhibit its catalytic action. Experiments show that mAlb enhances the signals of Ab-GONR-HAuCl4-H2O2 nanoanalytical system. Based on this principle, an immunoregulation gold nanoplasmon method for the rapid detection of mAlb has been established, with simplicity, high selectivity, and sensitivity.
Acknowledgment
This work was supported by the National Natural Science Foundation of China (No 21767004, 21667006, 21465006, 21477025), the Key Laboratory of Ecology of Rare and Endangered Species and Environmental Protection (ERESEP2017Z09), and the University Key Laboratory of Karst Ecology and Environmental Change of Guangxi Province (YRHJ16Z009).
Disclosure
The authors report no conflicts of interest in this work.
References
Manea F, Houillon FB, Pasquato L, Scrimin P. Nanozymes: Gold-Nanoparticle-Based Transphosphorylation Catalysts. Angew Chem Int Ed. 2004;43(45):6165–6169. | ||
Gao L, Zhuang J, Nie L, et al. Intrinsic peroxidase-like activity of ferromagnetic nanoparticles. Nat Nanotechnol. 2007;2(9):577–583. | ||
Karakoti A, Singh S, Dowding JM, Seal S, Self WT. Redox-active radical scavenging nanomaterials. Chem Soc Rev. 2010;39(11):4422–4432. | ||
Asuri P, Karajanagi SS, Dordick JS, Kane RS. Directed assembly of carbon nanotubes at liquid-liquid interfaces: nanoscale conveyors for interfacial biocatalysis. J Am Chem Soc. 2006;128(4):1046–1047. | ||
Luo YH, Tang ML, Wen GQ, Yin WQ, Jiang ZL, Liang AH. A sensitive hydride generation-nanogold spectrophotometric method for trace As(III). Adv Mat Res. 2013;749:495–498. | ||
Qu F, Li T, Yang M. Colorimetric platform for visual detection of cancer biomarker based on intrinsic peroxidase activity of graphene oxide. Biosens Bioelectron. 2011;26(9):3927–3931. | ||
He W, Liu Y, Yuan J, et al. Au@Pt nanostructures as oxidase and peroxidase mimetics for use in immunoassays. Biomaterials. 2011;32(4):1139–1147. | ||
Liang A, Li C, Li D, Luo Y, Wen G, Jiang Z. A facile and sensitive peptide-modulating graphene oxide nanoribbon catalytic nanoplasmon analytical platform for human chorionic gonadotropin. Int J Nanomedicine. 2017;12:8725–8734. | ||
Ye D, Li H, Liang G, Luo J, et al. A three-dimensional hybrid of MnO2/graphene/carbon nanotubes based sensor for determination of hydrogen-peroxide in milk. Electrochim Acta. 2013;109(11):195–200. | ||
Liu X, Peng Y, Qu X, Ai S, Han R, Zhu X. Multi-walled carbon nanotube-chitosan/poly(amidoamine)/DNA nanocomposite modified gold electrode for determination of dopamine and uric acid under coexistence of ascorbic acid. J Electroanal Chem. 2011;654(1–2):72–78. | ||
Cui R, Han Z, Zhu JJ. Helical carbon nanotubes: intrinsic peroxidase catalytic activity and its application for biocatalysis and biosensing. Chemistry. 2011;17(34):9377–9384. | ||
Zhang Y, Xia Z, Liu H, Yang M, Lin L, Li Q. Hemin-graphene oxide-pristine carbon nanotubes complexes with intrinsic peroxidase-like activity for the detection of H2O2 and simultaneous determination for Trp, AA, DA, and UA. Sens Actuators B Chem. 2013;188:496–501. | ||
Zhang TT. Preparation of graphene oxide nanoribbon bioelectrochemical sensor and detection of amino acids. Chin J Biochem Pharm. 2017;37:58–61. | ||
Dong X, Long Q, Wang J, et al. A graphene nanoribbon network and its biosensing application. Nanoscale. 2011;3(12):5156–5160. | ||
Zhu G, Yi Y, Han Z, Wang K, Wu X. Sensitive electrochemical sensing for polycyclic aromatic amines based on a novel core-shell multiwalled carbon nanotubes@ graphene oxide nanoribbons heterostructure. Anal Chim Acta. 2014;845:30–37. | ||
Mcnay G, Eustace D, Smith WE, Faulds K, Graham D. Surface-enhanced Raman scattering (SERS) and surface-enhanced resonance Raman scattering (SERRS): a review of applications. Appl Spectrosc. 2011;65(8):825–837. | ||
Javier EL, Ronei JP. A portable SERS method for the determination of uric acid using a paper-based substrate and multivariate curve resolution. Analyst. 1966;2016:141. | ||
Wang X, Jiang C, Qin Y, et al. SERS spectral study of HAuCl4-cysteine nanocatalytic reaction and its application for detection of heparin sodium with label-free VB4r molecular probe. Sci Rep. 2017;7:45979. | ||
Frost MS, Dempsey MJ, Whitehead DE. Highly sensitive SERS detection of Pb2+ ions in aqueous media using citrate functionalised gold nanoparticles. Sens Actuators B Chem. 2015;221:1003–1008. | ||
Gao F, Lei J, Ju H. Label-free surface-enhanced Raman spectroscopy for sensitive DNA detection by DNA-mediated silver nanoparticle growth. Anal Chem. 2013;85(24):11788–11793. | ||
Wang Z, Zong S, Wu L, Zhu D, Cui Y. SERS-activated platforms for immunoassay: Probes, encoding methods, and applications. Chem Rev. 2017;117(12):7910–7963. | ||
Haisch C. Raman-based microarray readout: a review. Anal Bioanal Chem. 2016;408(17):4535–4545. | ||
Granger JH, Schlotter NE, Crawford AC, Porter MD. Prospects for point-of-care pathogen diagnostics using surface-enhanced Raman scattering (SERS). Chem Soc Rev. 2016;45(14):3865–3882. | ||
Wang Z, Feng L, Xiao D, et al. A silver nanoislands on silica spheres platform: enriching trace amounts of analytes for ultrasensitive and reproducible SERS detection. Nanoscale. 2017;9(43):16749–16754. | ||
Laing S, Gracie K, Faulds K. Multiplex in vitro detection using SERS. Chem Soc Rev. 2016;45(7):1901. | ||
Ma L, Wen G, Ye L, et al. SERS quantitative detection of trace human chorionic gonadotropin using a label-free Victoria blue B as probe in the aggregated immunonanogold sol substrate. Luminescence. 2015;30(6):790–797. | ||
She P, Chu Y, Liu C, et al. A competitive immunoassay for ultrasensitive detection of Hg2+ in water, human serum and urine samples using immunochromatographic test based on surface-enhanced Raman scattering. Anal Chim Acta. 2016;906:139–147. | ||
Toto RD. Microalbuminuria: definition, detection, and clinical significance. J Clin Hypertension. 2010;6(s11):2–7. | ||
Shi BQ. Detection of microalbuminuria in the prevention and treatment of diabetic nephropathy. Pest Control. 2007;23:479–480. | ||
Habudutra S. Clinical significance of urine microalbumin detection. World Latest Med Inform. 2016;15:66–68. | ||
Tsai JZ, Chen CJ, Settu K, Lin YF, Chen CL, Liu JT. Screen-printed carbon electrode-based electrochemical immunosensor for rapid detection of microalbuminuria. Biosens Bioelectron. 2016;77:1175–1182. | ||
Pan AP. Comparison of urinary microalbumin in patients with diabetes mellitus by immunoturbidimetry and radioimmunoassay and clinical application. Exper Lab Med. 2003;21:26. | ||
Neuman RG, Cohen MP. Improved competitive enzyme-linked immunoassay (ELISA) for albuminuria. Clin Chim Acta. 1989;179(3):229–237. | ||
Wang YC, Chen RS. Comparison of urinary microalbumin assays. Chin J Lab Med. 1995;15:266. | ||
Horikoshi S, Okuda M, Nishimura E, et al. Usefulness of HPLC assay for early detection of microalbuminuria in chronic kidney disease. J Clin Lab Anal. 2013;27(4):333–338. | ||
Liang A, Li C, Wang X, Luo Y, Wen G, Jiang Z. Immunocontrolling graphene oxide catalytic nanogold reaction and its application to SERS quantitative analysis. ACS Omega. 2017;2(10):7349–7358. | ||
Ruhn PF, Taylor JD, Hage DS. Determination of urinary albumin using high-performance immunoaffinity chromatography and flow injection analysis. Anal Chem. 1994;66(23):4265–4271. | ||
Beasley-Green A, Burris NM, Bunk DM, Phinney KW. Multiplexed LC-MS/MS assay for urine albumin. J Proteome Res. 2014;13(9):3930–3939. | ||
Laiwattanapaisal W, Kunanuvat U, Intharachuti W, Chinvongamorn C, Hannongbua S, Chailapakul O. Simple sequential injection analysis system for rapid determination of microalbuminuria. Talanta. 2009;79(4):1104–1110. |
 © 2018 The Author(s). This work is published and licensed by Dove Medical Press Limited. The full terms of this license are available at https://www.dovepress.com/terms.php and incorporate the Creative Commons Attribution - Non Commercial (unported, v3.0) License.
By accessing the work you hereby accept the Terms. Non-commercial uses of the work are permitted without any further permission from Dove Medical Press Limited, provided the work is properly attributed. For permission for commercial use of this work, please see paragraphs 4.2 and 5 of our Terms.
© 2018 The Author(s). This work is published and licensed by Dove Medical Press Limited. The full terms of this license are available at https://www.dovepress.com/terms.php and incorporate the Creative Commons Attribution - Non Commercial (unported, v3.0) License.
By accessing the work you hereby accept the Terms. Non-commercial uses of the work are permitted without any further permission from Dove Medical Press Limited, provided the work is properly attributed. For permission for commercial use of this work, please see paragraphs 4.2 and 5 of our Terms.