Back to Journals » Journal of Inflammation Research » Volume 19
A New Perspective on Predicting PLA2R-Associated Membranous Nephropathy Relapse: The Value of a Genetic Risk Score
Authors Wang X, Yao K, Niu Y, Dong Z ![]() , Liang S
, Liang S ![]()
Received 6 December 2025
Accepted for publication 16 February 2026
Published 24 February 2026 Volume 2026:19 583141
DOI https://doi.org/10.2147/JIR.S583141
Checked for plagiarism Yes
Review by Single anonymous peer review
Peer reviewer comments 4
Editor who approved publication: Dr Adrian Lee
Xiaolong Wang, Kexin Yao, Yue Niu, Zheyi Dong, Shuang Liang
Department of Nephrology, First Medical Center of Chinese PLA General Hospital, Chinese PLA Institute of Nephrology, State Key Laboratory of Kidney Diseases, National Clinical Research Center for Kidney Diseases, Beijing Key Laboratory of Kidney Diseases, Beijing, People’s Republic of China
Correspondence: Shuang Liang, Department of Nephrology, Chinese PLA General Hospital, Chinese PLA Institute of Nephrology, State Key Laboratory of Kidney Diseases, National Clinical Research Center for Kidney Diseases, 28 Fuxing Road, Beijing, 100853, People’s Republic of China, Tel +86 151 1024 6423, Email [email protected]
Purpose: Membranous nephropathy (MN) is a common glomerular disease characterized by high relapse rates and heterogeneous outcomes. This study aimed to develop a genetic risk score (GRS) based on five MN-associated single nucleotide polymorphisms (SNPs) and assess its predictive value for disease relapse.
Methods: In this prospective study, we analyzed data from 234 patients with phospholipase A2 receptor (PLA2R)-associated MN between January 2020 and December 2023. Genotyping for five SNPs associated with MN risk (rs28383345, rs2187668, rs35771982, rs3749117, and rs4664308) was performed. A GRS was constructed and Cox regression models were used to assess risk factors for remission and relapse. Predictive performance was evaluated using Cox regression, time-dependent receiver operating characteristic (tROC) curves, net reclassification improvement (NRI), integrated discrimination improvement (IDI), Akaike information criterion (AIC), Bayesian information criterion (BIC), likelihood ratio test (LRT), and cross-validation.
Results: Over a median follow-up duration of 28.0 (IQR 20.0, 39.0) months, the cumulative remission rate was 85.5%, with 47% relapsing. A high GRS was significantly associated with the risk of relapse (HR = 1.885, 95% CI: 1.331– 2.585; P < 0.001). Adding GRS to the base model consistently increased the time-dependent AUC at years 2, 4, and 5 (all P < 0.05). Notably, assessments using risk reclassification metrics (IDI/NRI) and model fit metrics (LRT/AIC/BIC) also verified significant improvements in model performance across multiple years. Critically, rigorous repeated cross-validation demonstrated that the overall C-index gain provided by the GRS was both stable and significant (P < 0.05), and further year-by-year cross-validation confirmed that this advantage persisted across all evaluated years (all P < 0.05). Furthermore, sensitivity analysis further confirmed the robustness of the GRS.
Conclusion: This study is the first to apply a GRS in predicting relapse in PLA2R-associated MN. GRS significantly enhances predictive accuracy, offering a valuable tool for personalized risk assessment.
Keywords: membranous nephropathy, relapse, genetic risk score, SNP
Introduction
Primary membranous nephropathy (pMN) has become a leading cause of nephrotic syndrome (NS) in adults, and its incidence is increasing annually in China. It is shown that over the past 11 years, the proportion of pMN among renal biopsies has increased from 12.2% to 24.9%, whereas the proportions of other major glomerular diseases have remained relatively stable.1 Mechanistically, pMN is now recognized as an organ-specific autoimmune disease mediated by in situ formation of immune complexes within the glomerulus. This occurs when circulating autoantibodies target podocyte antigens. The seminal discovery by Beck et al2 in 2009 identified the M-type phospholipase A2 receptor (PLA2R) as the major target antigen in ~70% of pMN cases. Since then, additional podocyte antigens have been characterized, including thrombospondin type 1 domain-containing 7A (THSD7A), NELL1, and others.3,4 These findings have refined the molecular classification of MN, distinguishing PLA2R-associated MN from other antigen-driven subtypes.
Genetic studies have revealed the complexity of MN pathogenesis. Genome-wide association studies (GWASs) have confirmed that single nucleotide polymorphism (SNPs) in the HLA-DQA1 and PLA2R1 loci are associated with MN across different ethnic groups.5,6 Importantly, these genetic variations exhibit significant synergistic effects; the accumulation of multiple risk alleles can markedly increase the risk of developing MN.7 Xie et al8 estimated the cumulative effect of GWAS loci via stepwise conditional analysis to identify SNPs at each locus that independently contribute to MN risk. The genetic risk score (GRS), which is based on these loci and their interactions, explained 32% of the disease risk in East Asians and 25% in Europeans. This led to the proposal of a combined risk score based on PLA2R antibodies and the GRS to improve the non-invasive diagnosis of primary MN.
In terms of clinical translation, the GRS has demonstrated multidimensional utility. Gupta S et al9 applied the GRS to evaluate the characteristics of MN patients and reported that a higher GRS was associated with a younger age of MN onset. Recent research10 confirmed that a risk assessment model combining the GRS with anti-PLA2R antibody levels significantly outperformed traditional clinical indicators in predicting renal function decline or end-stage renal disease (ESRD) in MN patients. Notably, Berchtold et al11 first reported a strong association between the GRS and the risk of MN relapse in kidney transplant recipients. This finding overcomes some predictive limitations of traditional anti-PLA2R antibody testing and offers new insights for prognostic assessment in organ transplantation.
Despite significant advances in MN diagnosis and treatment research, disease relapse remains a major bottleneck in clinical management. Current data indicate that even with standard treatment, 36.4–47% of patients experience relapse.12,13 Owing to the significant inter-individual heterogeneity and predictive limitations of traditional clinical indicators, establishing an accurate relapse prediction system is urgently needed in clinical practice. Therefore, this study aimed to develop an integrated prognostic model combining GRS with clinical parameters to predict MN relapse, thereby enabling risk-stratified management.
Materials and Methods
Study Design
We recruited patients with biopsy-proven PLA2R-associated MN at the Chinese PLA General Hospital between January 1, 2020, and December 30, 2023. The inclusion criteria were: (1) age ≥ 18 years; (2) serum PLA2R antibody positivity confirmed by enzyme-linked immunosorbent assay (ELISA); (3) diagnosis of nephrotic syndrome and treatment with corticosteroids and/or immunosuppressants; and (4) follow-up duration ≥ 1 year. The exclusion criteria were: (1) secondary MN (caused by hepatitis B, autoimmune diseases, malignancy, etc).; (2) end-stage renal disease (ESRD) at baseline, defined as an estimated glomerular filtration rate (eGFR) < 15 mL/min/1.73 m2 or current dialysis/renal replacement therapy; (3) severe comorbidities at the time of renal biopsy, such as severe infection, malignancy, active hepatitis B, human immunodeficiency virus (HIV) infection, or severe liver injury; and (4) pregnancy or lactation, (5) lost to follow up. See Figure 1 for details.
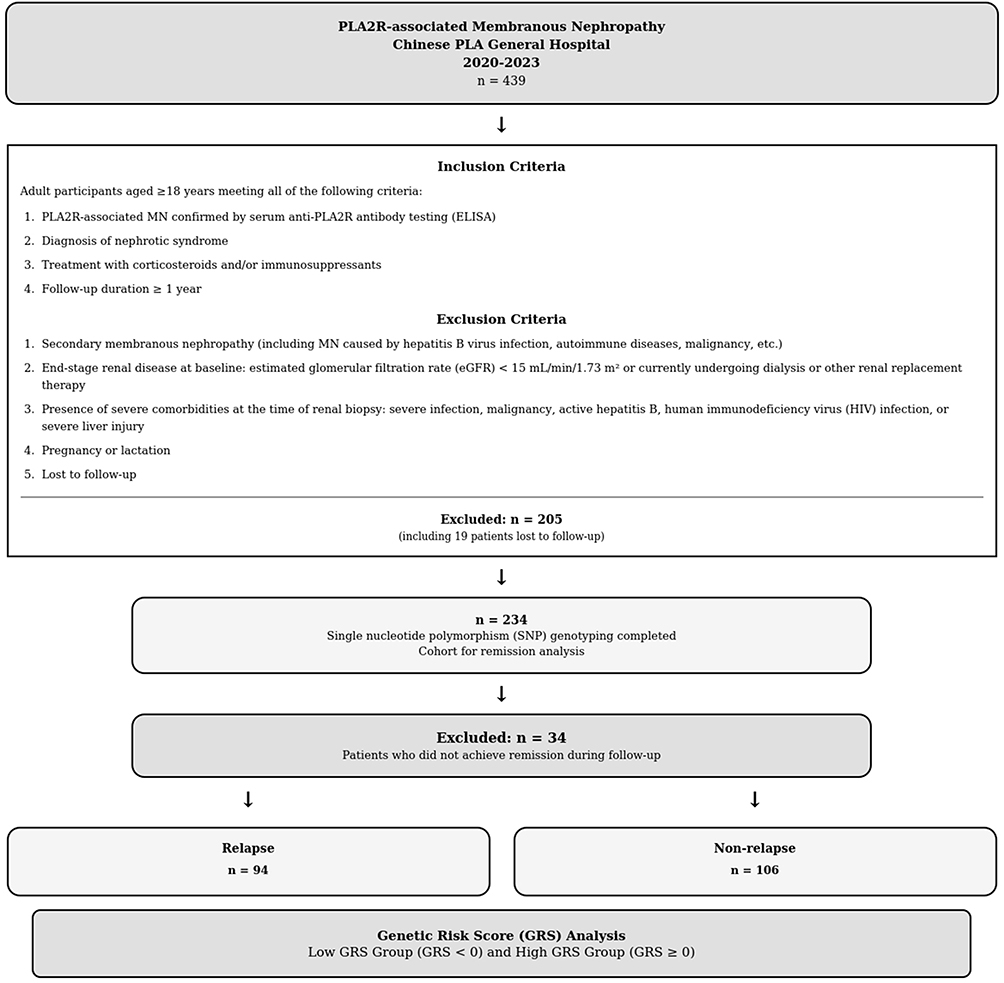 |
Figure 1 Study flowchart. |
This study was approved by the Ethics Committee of the Chinese PLA General Hospital (No. 2022–588-01). Regarding the sample collection procedure, patients diagnosed between 2020 and 2022 remained under regular clinical follow-up at our center. Following the ethical approval obtained in 2022, we utilized their scheduled follow-up visits to obtain written informed consent and collect fresh blood samples specifically for SNP genotyping. Given the lifelong stability of the germline genome, this retrospective sampling timing does not affect the reliability of the genetic data. Consequently, in our final analysis, the baseline was strictly defined as the time of the initial biopsy-proven diagnosis. Since all included patients were naïve to immunosuppressive therapy prior to biopsy and initiated standardized immunosuppressive regimens shortly after diagnosis at our center, the date of biopsy effectively represents the onset of the clinical treatment course and observation period. This study is reported in accordance with the RECORD (Reporting of studies Conducted using Observational Routinely-collected Data) Statement, an extension of the STROBE guidelines.14
Research Methods
Data Collection
We collected demographic data, laboratory results, treatment regimens, comorbidities, and renal pathology findings at baseline. Venous blood samples were collected for SNP genotyping.
Endpoint Events
Patients were followed up and monitored for 24-hour urine protein, serum albumin (ALB), estimated glomerular filtration rate (eGFR), and anti-PLA2R antibody levels. The eGFR was calculated via the CKD-EPI equation.15 Events occurring during follow-up, including remission (categorized as partial remission [PR] or complete remission [CR]), relapse, renal progression, and adverse events, were recorded. The follow-up duration was the time interval (in months) from baseline to the last recorded visit. The minimum follow-up was 12 months, which was terminated by February 2025. A minimum 12-month follow-up period was implemented to capture peak relapse events, consistent with established MN relapse kinetics. The primary endpoints were achieving remission and occurrence of relapse. Secondary endpoints included the achievement of PR, CR, and renal progression.
Definitions
Nephrotic syndrome was defined as urine protein excretion ≥ 3.5 g/24 h and ALB ≤ 30 g/L. PR was defined as urine protein excretion between 0.3–3.5 g/24 h, with a ≥50% reduction in 24-hour proteinuria from baseline, accompanied by stable renal function (defined as a <25% decrease in eGFR from baseline). CR was defined as urine protein excretion < 0.3 g/24 h and a serum ALB concentration > 35 g/L. Non-remission (NR) was defined as any case that failed to meet the criteria for CR or PR. Relapse was defined as the recurrence of proteinuria consistent with nephrotic syndrome (urine protein > 3.5 g/24 h on three consecutive measurements) after achieving CR or PR. Renal progression was defined as a ≥50% decrease in eGFR from baseline or the initiation of renal replacement therapy (including maintenance hemodialysis, peritoneal dialysis, or kidney transplantation). Anti-PLA2R antibody was measured by ELISA. Definitions of positivity (≥ 2 RU/mL), complete immunological remission (< 2 RU/mL), and clinical risk stratification were all based on the 2021 KDIGO guideline.16
Immunosuppressive regimens included tacrolimus, cyclosporine A (CsA), cyclophosphamide, and rituximab, administered as monotherapy or in combination with corticosteroids. All immunosuppressive regimens were initiated within 3 months of diagnosis. Specifically, CsA was initiated at 3–5 mg/kg/day with target trough levels of 100–175 ng/mL; tacrolimus was initiated at 0.05–0.1 mg/kg/day with target trough levels of 5–10 ng/mL; cyclophosphamide was administered intravenously at 0.5–1.0 g/m2 monthly or orally at 2 mg/kg/day; and rituximab was given at 375 mg/m2 or 1 g per dose. In the analysis, CsA and tacrolimus were analyzed as separate variables rather than grouped as calcineurin inhibitors, given their differential acquisition costs, insurance reimbursement, and adverse effect profiles in the Chinese healthcare setting, which may independently influence treatment allocation and long-term adherence.
SNP Genotyping
Polymerase chain reaction (PCR) amplification combined with Sanger sequencing technology was used to genotype five SNP loci associated with pMN, based on evidence from the literature. These loci included rs28383345 (PLA2R1 locus), rs2187668 (HLA-DQA1 locus), rs35771982 (PLA2R1 locus), rs3749117 (PLA2R1 locus), and rs4664308 (PLA2R1 locus).
PCR primers were designed to target regions within the HLA-DQA1 and PLA2R1 genes to amplify DNA fragments containing the target SNP loci. The amplicon sizes ranged from 654 to 944 base pairs (bp). PCRs were performed using 2× Hieff Canace® Gold Master Mix (Yeasen Biotechnology, Shanghai, China). The thermal cycling program consisted of initial denaturation (98°C for 3 min), followed by 35 cycles of denaturation (98°C for 10s), annealing (55°C for 20s), extension (72°C for 30s), and a final extension (72°C for 5 min). After verification of amplicon size via 1.5% agarose gel electrophoresis, PCR products of the expected size were purified and subjected to Sanger sequencing via an ABI 3730xl sequencer (Applied Biosystems, Foster City, CA, USA). Sequencing products were separated and detected via capillary electrophoresis, and genotypes for each SNP locus were determined via analysis of the resulting sequence chromatograms.
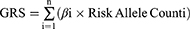
GRS Calculation
We calculated the GRS based on five SNPs using the method described by Xie et al8 based on five SNPs located in the HLA-DQA1 and PLA2R1 loci. The GRS was constructed as follows: individuals carrying the homozygous risk genotype (ie, the reference high-risk genotype) for all five SNPs were assigned a baseline GRS of 0. For individuals with alternative alleles, the GRS was adjusted using effect sizes (β coefficients) derived from prior genome-wide association studies (GWAS) and the GWAS catalog, corrected for multivariable analyses. To compute each individual’s GRS, the number of risk alleles for each SNP (coded as 0, 1, or 2) was multiplied by its corresponding β coefficient, and the weighted scores were summed across all five SNPs to obtain the final GRS value.
Patients were categorized into high-risk and low-risk GRS groups based on the median GRS value of the cohort, which was used as the cutoff threshold.
Statistical Analysis
Quantitative data are presented as mean ± standard deviation (SD) for normally distributed variables or median (interquartile range, IQR) for skewed variables. Categorical variables are expressed as frequency and percentage [n (%)]. Group comparisons were performed using independent samples t-tests for normally distributed quantitative data, Mann–Whitney U-tests for non-normally distributed data, and Pearson’s chi-square (χ2) tests for categorical variables.
The association between the GRS and relapse risk was analyzed via survival models built with the “survival” package in R. Patients were dichotomized into high-risk and low-risk groups based on the median GRS. Kaplan‒Meier curves were compared via the Log rank test. Univariable and multivariable Cox proportional hazards regression models were constructed, controlling for potential confounders via stratified multivariable adjustment strategies. Variables with P < 0.1 in the univariable analysis subsequently included in the multivariable Cox regression model. The proportional hazards assumption was assessed for all Cox models using Schoenfeld residuals. No significant violations were detected for any covariates, including GRS and clinical variables (all Schoenfeld residual p-values > 0.05). To assess potential non-linearity in the GRS-relapse association, restricted cubic spline (RCS) analysis was performed via the “ggrcs” package with 4 knots, and non-linearity was tested via the likelihood ratio test.
Patients were stratified into subgroups on the basis of gender, median values of age, 24-hour urine protein levels, eGFR, serum albumin (ALB) level, and anti-PLA2R antibody level. Interaction tests were performed to evaluate effect modification of the GRS-relapse association by these subgroups. Forest plots generated via the “forestploter” package were used to visualize the hazard ratios (HRs) and 95% confidence intervals (CIs) for each subgroup.
On the basis of the Cox proportional hazards regression model, a nomogram was developed via the “rms” package to visualize the multivariable prediction model and the contribution of each variable to relapse risk.
Variables with P < 0.1 in the univariable Cox regression analysis (including ALB, uric acid (UA), glomerulosclerosis, cyclosporine A (CsA) use, and time to remission) were used to construct a base prediction model for relapse. An enhanced model was created by adding the GRS to the base model.
Time-dependent receiver operating characteristic (tROC) curves and area under the curve (AUC) values for both models were calculated at 1, 2, 3, and 5 years using the “timeROC” package, with the significance of AUC differences tested via the bootstrap test. Additionally, the Net Reclassification Improvement (NRI) and integrated discrimination improvement (IDI) were calculated using the “survIDINRI” package to assess improvements in risk stratification and predictive accuracy after incorporating the GRS. Furthermore, the Akaike Information Criterion (AIC), Bayesian Information Criterion (BIC), and likelihood ratio test (LRT) were used to compare the goodness of fit between the two nested models. To evaluate model stability and the risk of overfitting, rigorous cross-validation procedures was performed, including: (1) standard 10-fold cross-validation to preliminarily assess overall model performance; (2) 5-repeated 10-fold cross-validation to obtain a more robust evaluation of overall performance; and (3) 10-repeated 10-fold cross-validation for the 1, 2, 3, and 5-year time points to evaluate model performance at different time points. In cross-validation, paired t-tests were used to assess the significance of C-index improvements. Finally, sensitivity analyses were performed by further adjusting for remission quality (CR vs PR) and immunological status to verify the GRS’s independent robustness and incremental predictive value (assessed via AUC, NRI, and IDI) beyond clinical treatment response. Statistical analyses were conducted using SPSS software (version 25.0; IBM Corp., Armonk, NY, USA) and R software version 4.4.3 (R Project for Statistical Computing). All tests were two-sided, and P < 0.05 was considered statistically significant.
Results
Cohort Characteristics and Outcomes
A total of 234 primary PLA2R-associated MN patients meeting the eligibility criteria were included. The median age of the participants in the study cohort was 52.0 (IQR 38.0, 60.0) years, 63.7% were male, the median BMI was 26.5 (IQR 24.2, 29.1), and the median GRS was 0 (IQR −1.28, 0). Over a median follow-up of 28.0 months (IQR 20.0–39.0), the cumulative remission rate was 85.5% (200/234), renal progression occurred in 12.4% (29/234) of the total cohort, see Table 1 for details. Among the 200 patients who achieved remission, 47.0% (94/200) subsequently relapsed, see Table S1 for details. Adverse events during follow-up were reported in 19.2% of patients, primarily pulmonary infections (31 patients, 13.2%), followed by upper respiratory tract infections (9 patients, 3.8%), hyperglycemia (3 patients, 1.3%), and other events (2 patients, 0.9%) (Table S2).
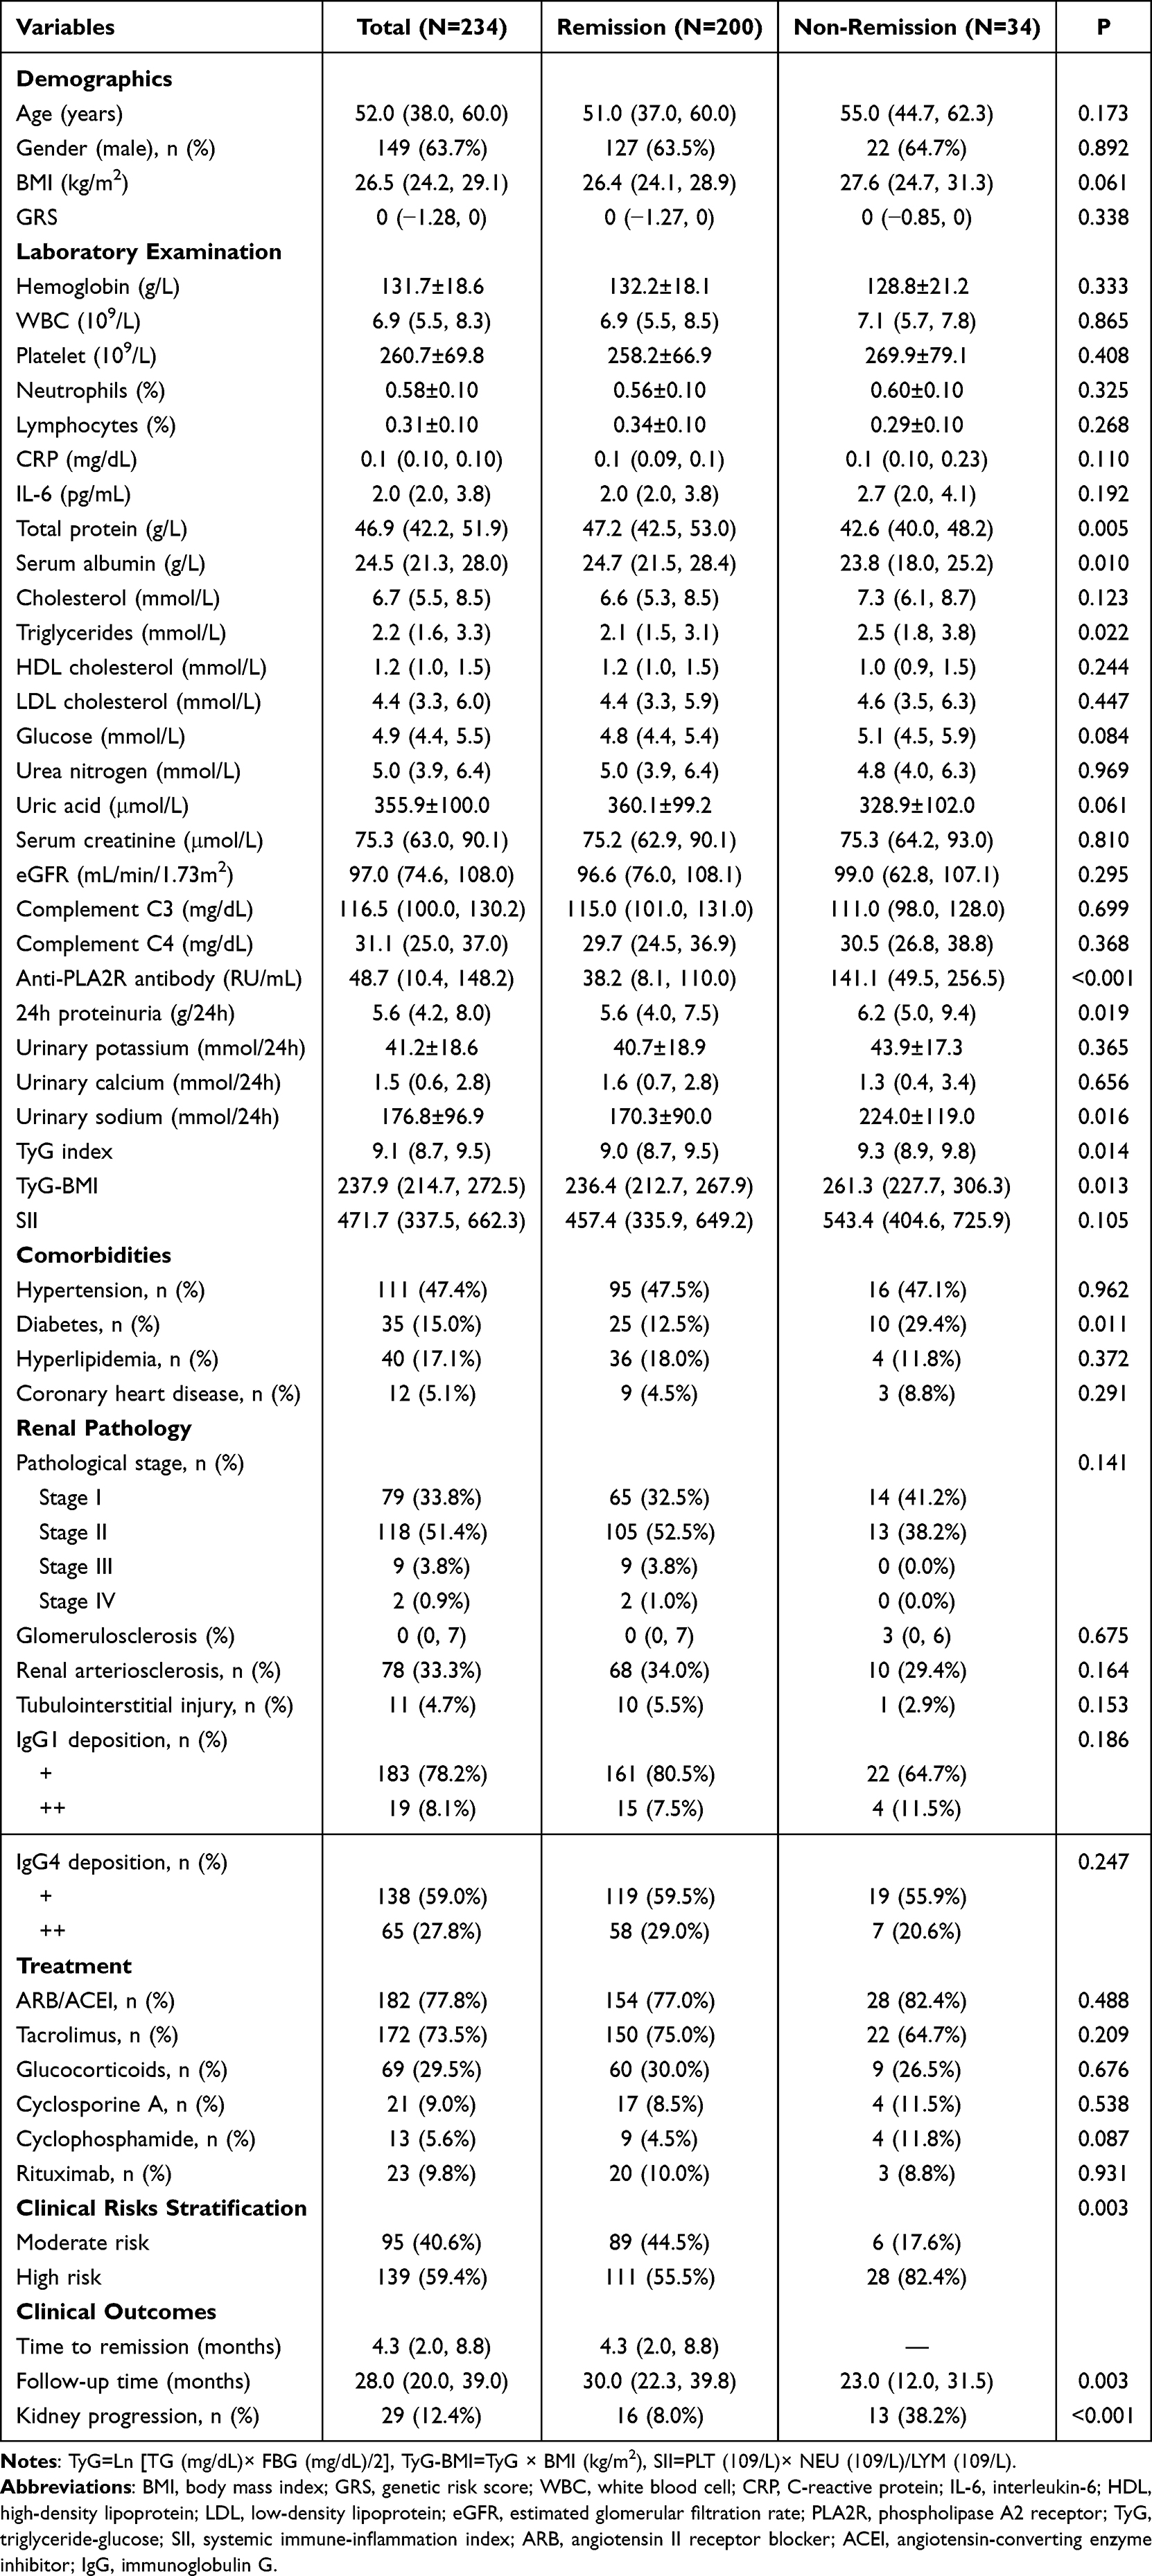 |
Table 1 Baseline Characteristics and Remission Status of Study Participants |
Factors Associated with Remission
Compared with the NR group, patients who achieved remission had significantly higher baseline levels of total protein (TP), and ALB, but lower levels of total cholesterol (TC), anti-PLA2R antibody, urinary total Protein (UTP), urinary sodium (UNa), and clinical risk stratification. The baseline GRS did not differ significantly between the remission and NR groups (Table 1).
After collinearity diagnostics led to the exclusion of TP and TC, the remaining significant variables were included in the multivariable Cox regression analysis. This identified older age (hazard ratio [HR] = 0.984, 95% CI 0.971–0.998), higher baseline UTP (HR=0.908, 95% CI 0.843–0.978,), and higher baseline anti-PLA2R antibody levels (HR=0.998, 95% CI 0.997–1.000) as showing independent significant associations with a lower probability of achieving remission (Table S3).
Factors Associated with Relapse
Compared with patients who did not relapse, those in the relapse group had a significantly greater baseline GRS and lower baseline low-density lipoprotein (LDL) level. Additionally, the relapse group included a higher proportion of patients with PR, a lower proportion with CR, and a lower proportion achieving immunological remission. The proportion of patients who received rituximab (RTX) treatment was also lower in the relapse group. Furthermore, more cases of subsequent renal progression were observed in the relapse group. Other baseline characteristics showed no significant differences between the relapse and non-relapse groups (Table S1).
To investigate whether infections or adverse events precipitated premature treatment discontinuation, we compared maintenance therapy duration between patients who experienced such events and those who did not; no significant difference was observed (P = 0.36) (Figure S1).
Multivariable Cox analysis revealed that a high GRS (HR = 1.885, 95% CI 1.331–2.585), high UA level (HR = 1.002, 95% CI 1.000–1.004), use of CsA (HR = 2.930, 95% CI 1.519–5.652), and a shorter time to remission (HR = 0.936, 95% CI 0.934–0.993) were independent factors associated with an increased risk of relapse in primary PLA2R-associated MN patients (Table 2).
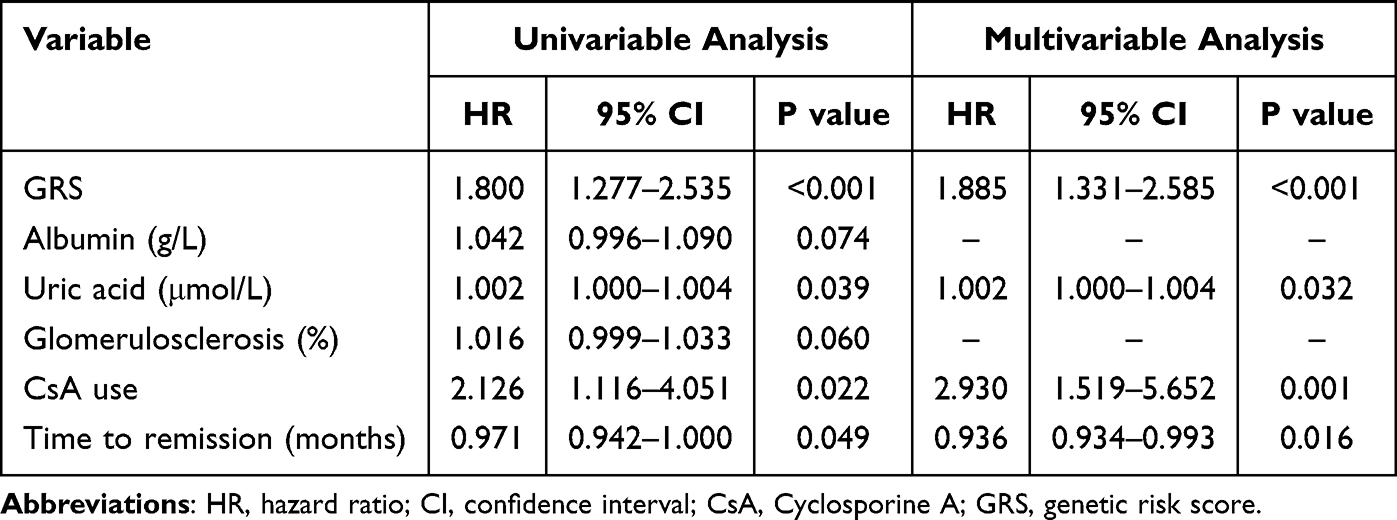 |
Table 2 Cox Regression Analysis of Risk Factors for Relapse |
Genetic Risk Score Groups and Renal Outcomes
Patients were stratified into a low-GRS group (GRS < 0; n = 96) and a high-GRS group (GRS ≥ 0; n = 138) using the median GRS value as the cutoff. The remission rate was 88.5% in the low-GRS group versus 83.3% in the high-GRS group, with no statistically significant difference (P = 0.266) (Figure S2 and Table 3). However, the relapse rate was significantly lower in the low-GRS group (28.1%) compared to the high-GRS group (48.6%) (P < 0.001). There were no significant differences between the two groups in baseline characteristics including ALB, SCR, eGFR, 24-hour proteinuria, PLA2R, time to remission, or kidney disease progression (Table 3).
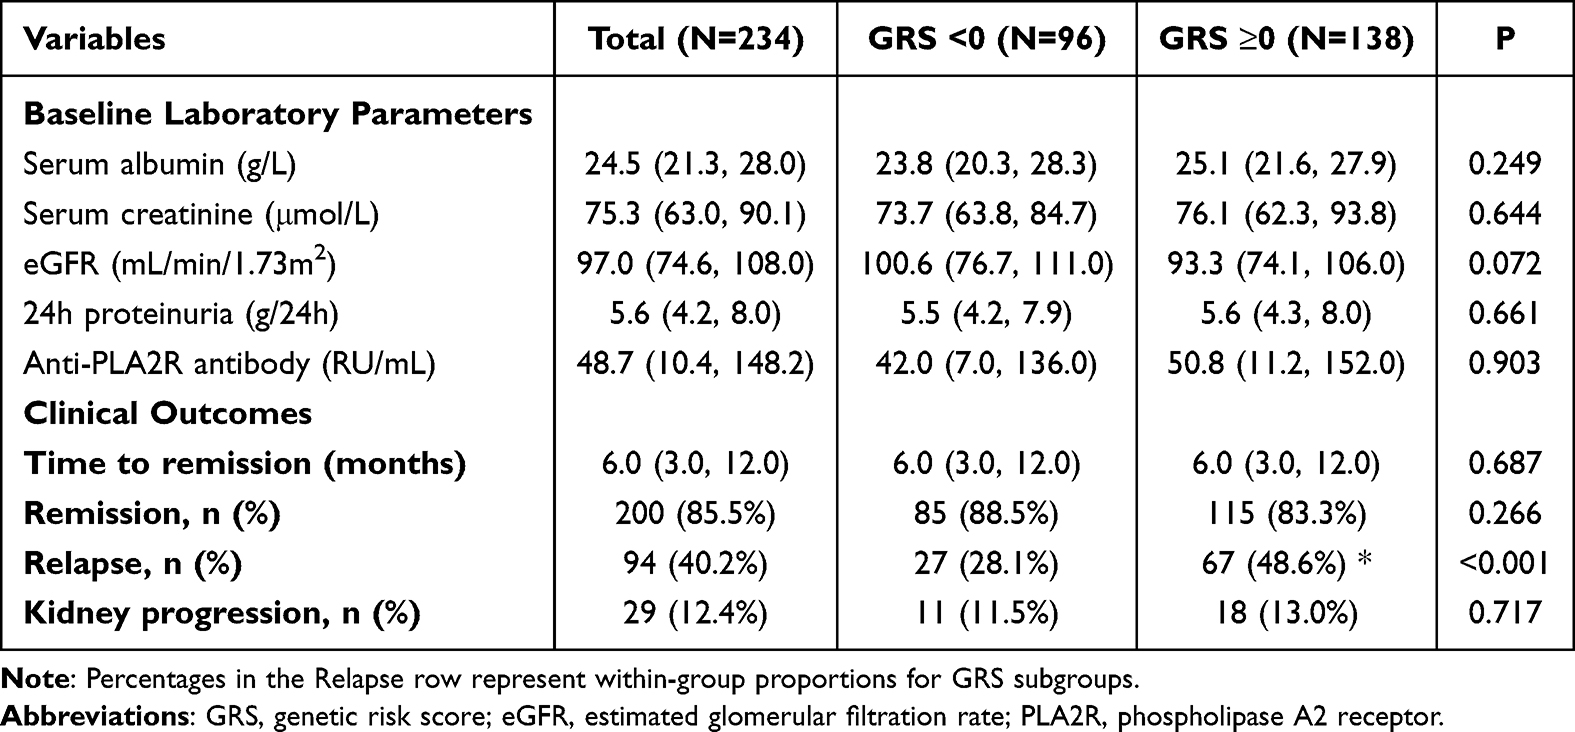 |
Table 3 Clinical Characteristics and Outcomes Stratified by Genetic Risk Score |
Kaplan-Meier curve analysis revealed a significantly greater cumulative relapse rate in the high-GRS group than in the low-GRS group (log-rank P < 0.001) (Figure 2).
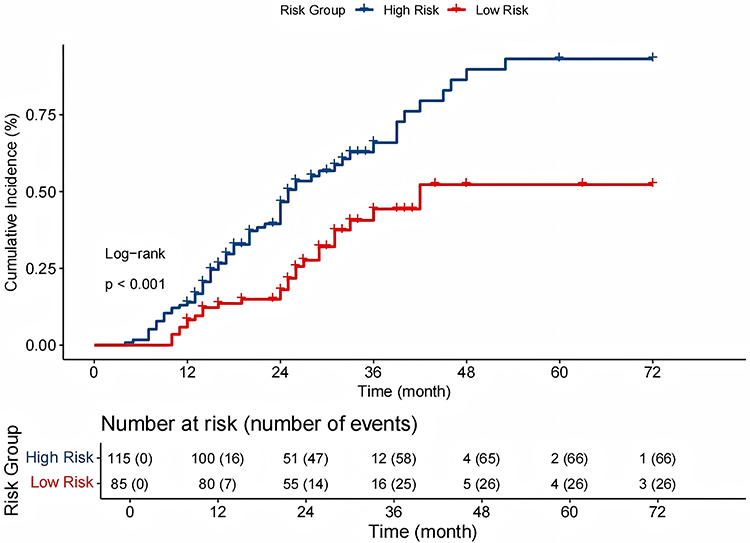 |
Figure 2 Kaplan-Meier curve of relapse incidence between the low and high-risk GRS groups. |
In summary, the GRS significantly stratified relapse risk but showed no significant association with remission or renal progression between the two groups.
Linear Association of GRS with Relapse Risk
Figure 3 displays the continuous association between GRS and risk of relapse via RCS analysis in both unadjusted (Figure 3A) and covariate-adjusted models (Figure 3B). The results demonstrate that the relationship between the GRS and relapse risk adheres to a linearity pattern, irrespective of covariate adjustment (unadjusted model: P for non-linearity = 0.232, P for overall association < 0.001; adjusted model: P for non-linearity= 0.574, P for overall association < 0.001).
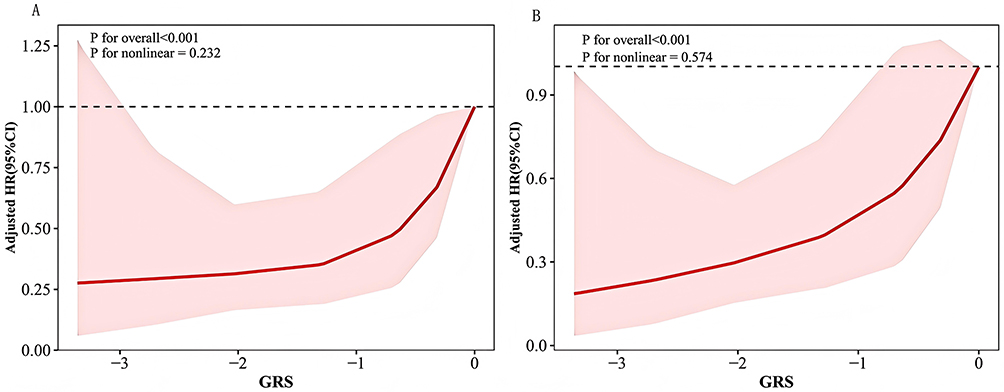 |
Figure 3 Association between GRS and MN relapse was analyzed using Cox proportional hazards regression with RCS based on 4 knots. The red shaded area represents the 95% confidence interval (CI). (A) Unadjusted model (B) Model adjusted for serum albumin (ALB), uric acid (UA), glomerulosclerosis, cyclosporine A (CsA) use, and time to remission. Abbreviations: GRS, genetic risk score; MN, membranous nephropathy; RCS, restricted cubic splines; CI, confidence interval; ALB, albumin; UA, uric acid; CsA, cyclosporine A. |
Subgroup Analysis and Interaction Effect Assessment of GRS on Relapse
In the overall cohort, GRS significantly elevated relapse risk (HR = 1.83, 95% CI 1.30–2.56, P = 0.001). Age-stratified analysis demonstrated significant heterogeneity (P = 0.046), with stronger GRS-relapse association in patients aged >51 years. However, no significant effect modifications were observed by gender, eGFR, proteinuria, serum albumin, or anti-PLA2R antibody levels (all P > 0.05) (Figure 4). These findings suggest that these variables did not significantly modify the predictive effect of the GRS.
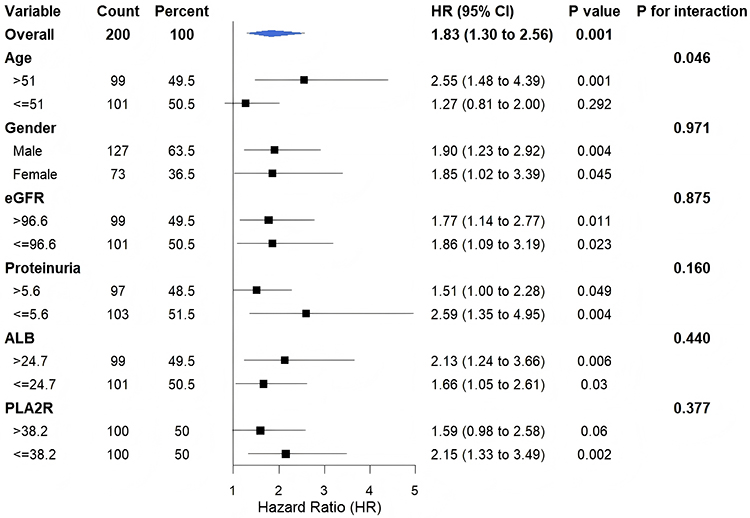 |
Figure 4 Association of the GRS with the risk of disease relapse across different clinical subgroups. Abbreviations: GRS, genetic risk score; ALB, albumin; eGFR, estimated glomerular filtration rate; PLA2R, phospholipase A2 receptor. |
Predictive Value of GRS in Incident Relapse
To evaluate and visualize the predictive value of the GRS and other clinical variables for primary PLA2R-associated MN relapse, we constructed a nomogram (Figure 5). Each variable’s contribution to relapse risk is represented on a point scale. The sum of points across all variables yields a total score (Total Points), which translates to the predicted relapse probabilities at 1, 2, 3, and 5 years. The nomogram revealed that the GRS accounts for a substantial portion of the total points, suggesting that it is a key determinant of relapse risk.
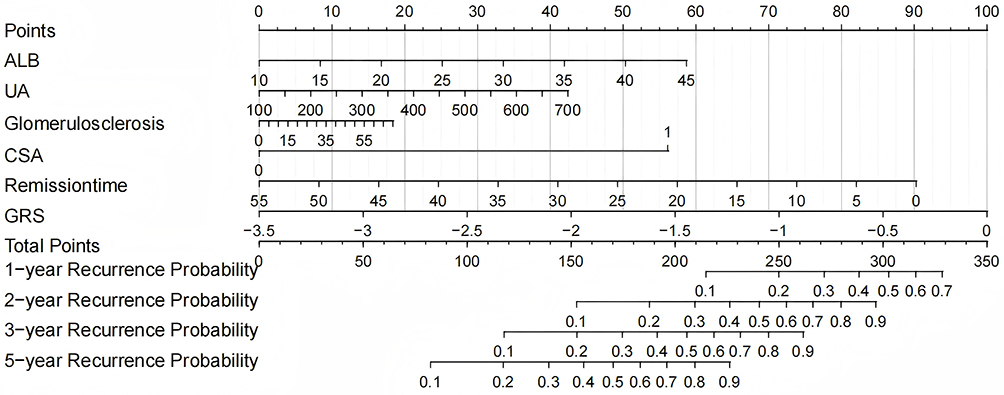 |
Figure 5 Nomogram based on variables selected from Cox proportional hazards regression analysis. Abbreviations: GRS, genetic risk score; ALB, Albumin; UA, uric acid; CsA, cyclosporine A. |
To compare the predictive performance of the base model (based on ALB, UA, glomerulosclerosis, CsA use, and time to remission) with that of the enhanced model (base model + GRS), we plotted tROC curves and calculated AUC. At year 1, the AUC increased from 0.747 to 0.777 (P = 0.374) (Figure 6A); at year 2, from 0.677 to 0.734 (P = 0.007) (Figure 6B); at year 4, from 0.604 to 0.681 (P = 0.018) (Figure 6C); and at year 5, from 0.743 to 0.801 (P = 0.012) (Figure 6D). The improvements in AUC reached statistical significance at years 2, 4, and 5 (Table 4).
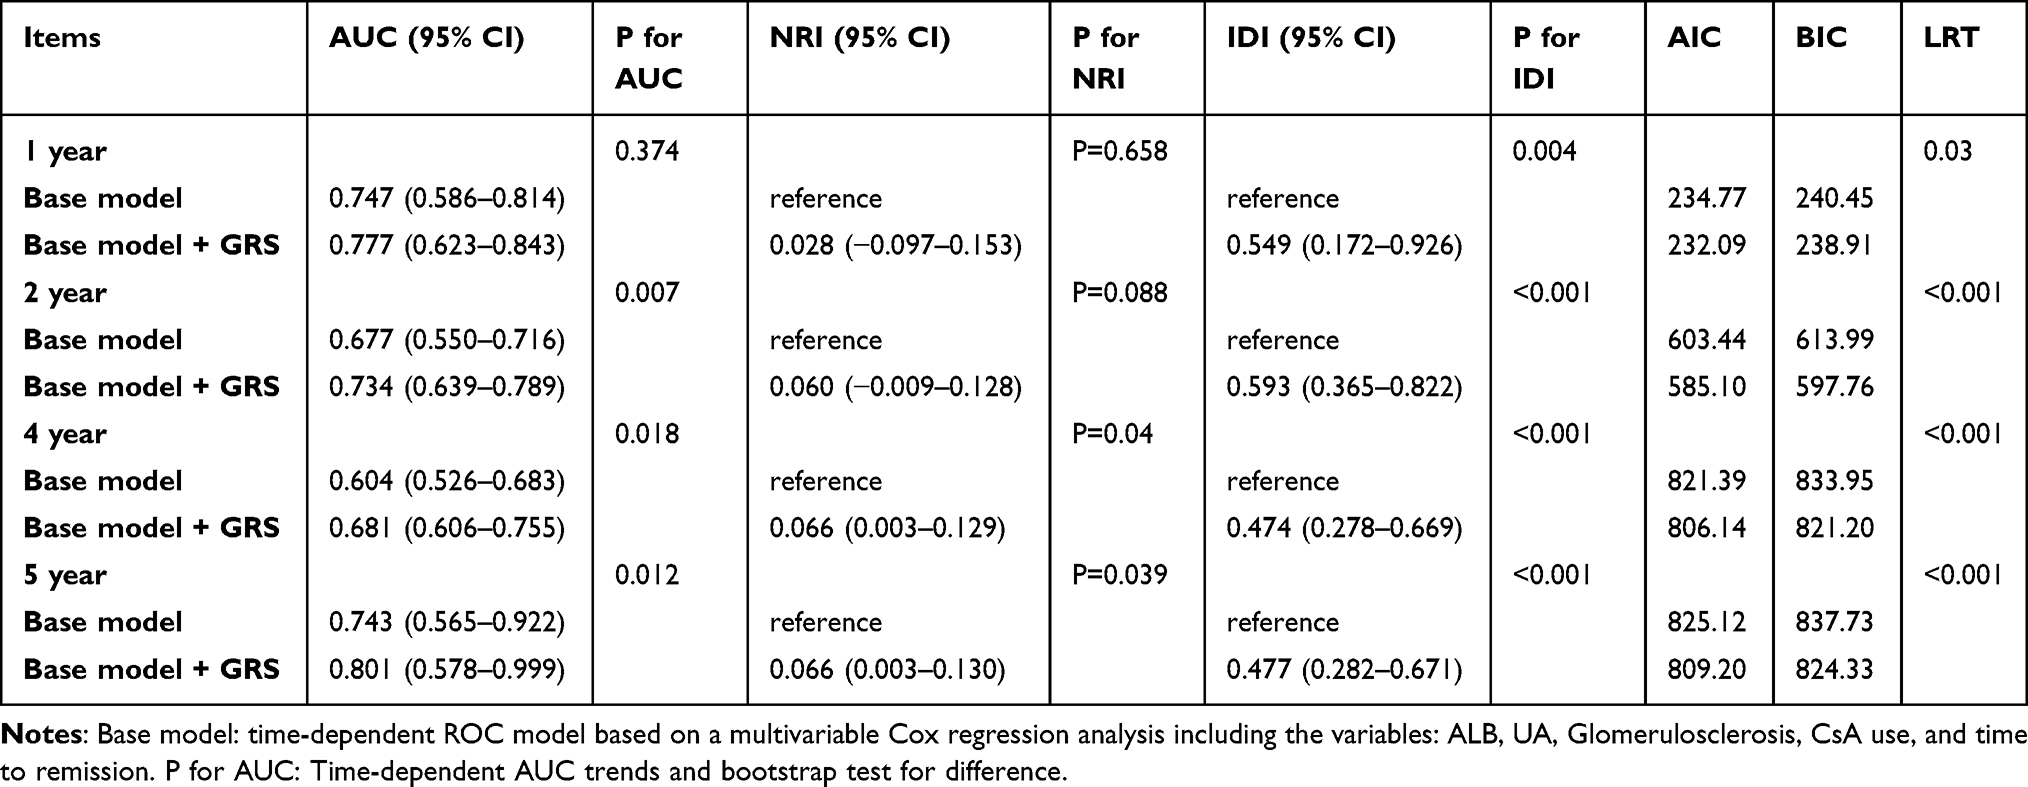 |
Table 4 Improvement in Relapse Risk Prediction by Adding GRS to the Base Model |
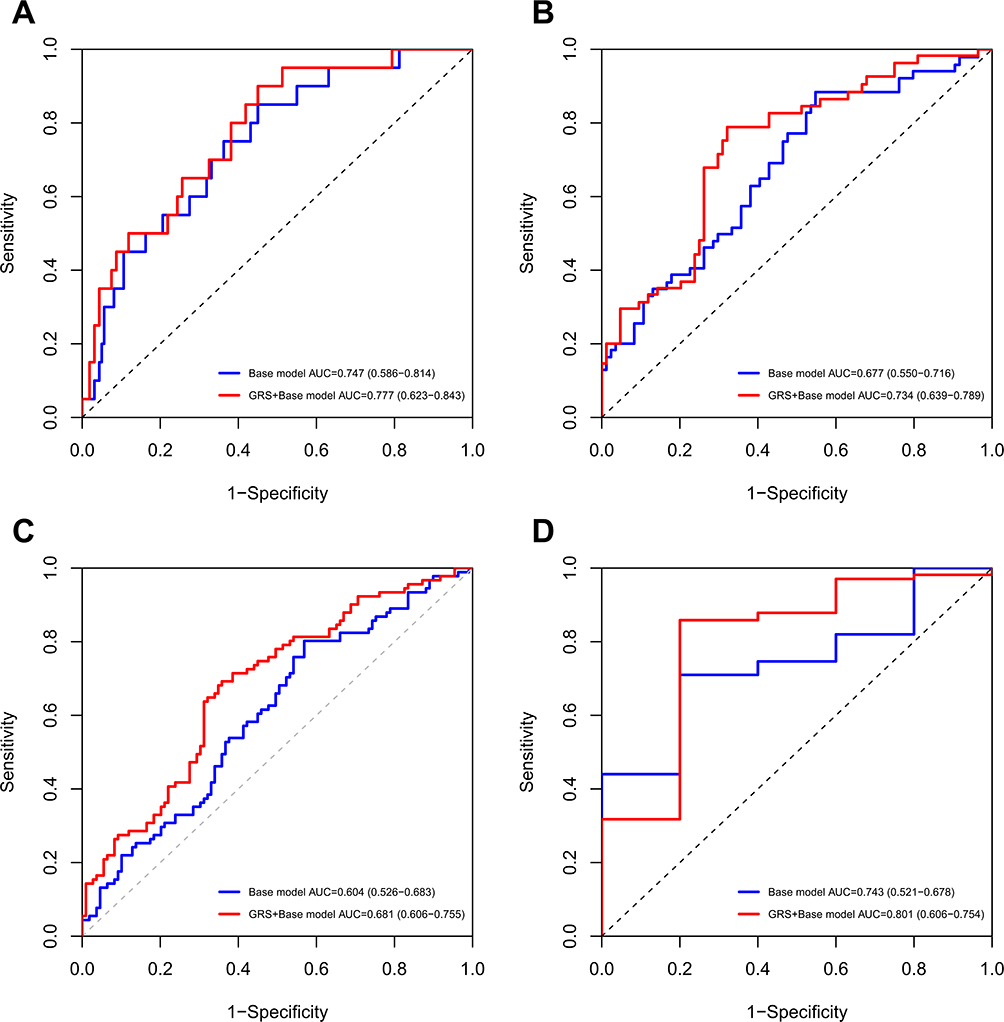 |
Figure 6 Time-dependent ROC curve based on the Cox proportional hazards regression model at (A) the first year; (B) the second year; (C) the fourth year; (D) the fifth year. Notes: Base model: Time-dependent ROC model based on a multivariable Cox regression analysis including the variables ALB, UA, glomerulosclerosis, CsA use, and time to remission. |
Furthermore, the inclusion of the GRS also demonstrated consistent and robust improvements in terms of risk reclassification and model fit.
Regarding risk reclassification, the IDI showed high statistical significance at all evaluated time points (all P < 0.05), while the NRI demonstrated significant improvement in the mid-to-long term (at years 4 and 5) (both P < 0.05) (Table 4).
In terms of model fit, the combined model also demonstrated comprehensive superiority. Not only did the LRT confirm at all time points that the combined model was a statistically significant improvement (all P < 0.05), but the model’s AIC and BIC values were also consistently lower at each time point, further corroborating its superior fit (Table 4).
To further validate the robustness of these findings and assess potential overfitting risks, we employed rigorous cross-validation strategies, including standard 10-fold cross-validation and repeated 10-fold cross-validation (repeated 5 times). The results showed that, in terms of the overall C-index, the standard 10-fold cross-validation indicated a model improvement of 0.068 (95% CI: 0.011–0.124, P = 0.024) (Figure S3), while the repeated cross-validation showed an improvement of 0.046 (95% CI: 0.018–0.075, P = 0.002) (Figure S4), confirming the stable contribution of GRS to enhancing model discrimination.
Furthermore, we conducted 10-repeated 10-fold cross-validation analyses at key time points of 1, 2, 3, and 5 years to evaluate the model’s predictive performance at different follow-up time points. The results demonstrated that the enhanced model with GRS exhibited significant predictive advantages at all time points (all P < 0.05) (Figure S5).
Sensitivity Analysis
To further validate the robustness of the GRS, we performed a sensitivity analysis by adjusting for remission quality, specifically immunological remission and clinical remission status (PR vs CR). Even after controlling for these potent post-treatment predictors—where achieving only PR conferred a 3.3-fold increased risk of relapse (HR = 3.322, P < 0.001)—the GRS remained a significant independent predictor (adjusted HR = 1.639, P = 0.004) (Table S4).
We subsequently integrated the GRS into a comprehensive clinical base model that had been adjusted for potent predictors including remission depth and immunological remission. The addition of the GRS yielded a significant and comprehensive improvement in predictive performance. Time-dependent ROC analysis demonstrated consistent improvements in the AUC across all time points (all P < 0.001) (Figure S6). Significant improvements in NRI and IDI confirmed that the GRS substantially enhanced the accuracy of risk stratification. The AIC/BIC values and Likelihood Ratio Test (P < 0.001) further validated the robustness of the model. (Table S5).
These findings demonstrate that the GRS provides independent predictive value beyond clinical treatment response. Even after accounting for remission quality, genetic susceptibility remains a distinct driver of relapse in membranous nephropathy.
Discussion
This study demonstrated that a high GRS is independently and significantly associated with an increased risk of relapse in primary PLA2R-associated MN. Furthermore, incorporating the GRS into the clinical model led to a significant and comprehensive improvement in its predictive performance.
We developed a GRS based on five SNP loci that had been significantly associated with pMNs in previous studies. Stanescu et al5 first reported strong associations for rs2187668 and rs4664308, which were later validated in a Spanish cohort.17 A Chinese case‒control study18 revealed that the G allele of rs35771982 and the T allele of rs3749117 were significant risk factors in the Han population. Furthermore, a GWAS in a Han Chinese population by Qin et al19 confirmed an independent association for rs28383345. Synthesizing this cross-ethnic, multicenter evidence, we included these five SNPs in our GRS model. Each patient’s score was calculated via an allele dosage approach, weighted by standardized effect sizes (OR or β coefficients) from the original studies, to quantify the cumulative genetic risk contribution.
Few studies reported factors that associated with MN relapse. Liang et al12 linked relapse to shorter full-dose tacrolimus duration and higher serum creatinine and proteinuria at withdrawal; Wang et al20 identified older age and a high baseline white blood cell count as risk factors; and Ruggenenti et al21 reported initial complete remission. Our study identified high GRS, high UA levels, CsA use, and shorter time to remission as independent risk factors for primary PLA2R-associated MN relapse. Hyperuricemia is associated with glomerular ischemic lesions and tubular atrophy/interstitial fibrosis in MN, which may potentially worsen renal injury and increase the risk of relapse through inflammation, oxidative stress, and crystal deposition.22,23 However, a direct link between UA and MN relapse has not been established in literature, and further research is needed. One of the shortcomings of calcineurin inhibitors (CNI) in the treatment of MN was the high rate of relapse.24–26 Studies report a higher relapse rate following CNI therapy (including CsA) compared to alkylating agent-based regimens like cyclophosphamide.27,28 This study also showed that shorter time to remission was associated with higher relapse risk, which is consistent with previous research,12 possibly indicating premature treatment cessation. This suggests that relying solely on proteinuria normalization as a stopping point is insufficient; future decisions should consider integrating anti-PLA2R antibody clearance and GRS stratification. A unique advantage of the GRS is its stability and early availability. As an innate genetic marker that is assessable early in life, it is unaffected by disease activity, treatment, or progression. This makes it a valuable anchor for dynamic monitoring. For high-GRS patients, even if they are in remission or anti-PLA2R antibody negative, clinicians can use this risk information for proactive management, such as extending CNI maintenance therapy29,30 or increasing the monitoring frequency (eg, proteinuria every 3 vs 6 months). Such an approach, which integrates genetic risk stratification with dynamic monitoring, could help address the current limitations of risk-stratified surveillance during clinical remission in MN care.
Our subgroup analysis indicated significant heterogeneity by age, with the effect of the GRS on relapse risk being more pronounced in patients >51 years old. This finding merits attention, as aging involves immunological changes (reduced T-cell repertoire diversity, impaired Regulatory T cells, chronic inflammation)31 that could magnify genetic risk effects; however, further research is needed. This highlights the dynamic interplay of genetics in MN progression and supports biomarker-stratified precision management.
The specific predictive power of the GRS for relapse likely arises from the combined effects of the HLA-DQA1 and PLA2R1 loci, which influence immune memory cell reactivation thresholds via antigen presentation and B-cell epitope exposure.32 Interestingly, while the GRS did not predict remission rates or renal progression in our cohort, its independent association with relapse suggests that genetic risk might exert its main influence during disease reactivation. One possible hypothesis is that this process involves epigenetic modifications (eg, DNA methylation)33 or immunosenescence.31 Although direct studies on the epigenetic regulation of these specific genes in MN are scarce and needed, our findings complement those of Berchtold et al11 on donor GRS and transplant relapse, supporting a “genetic load‒immune homeostasis imbalance” hypothesis.
This study has several limitations. First, its retrospective, single-center design, limited sample size and predominantly Han Chinese cohort introduce selection bias and limit generalizability of our findings. Given that allele frequencies and linkage disequilibrium patterns vary across populations, the performance of this GRS requires verification in non-Han cohorts. Additionally, as we focused exclusively on primary PLA2R-associated MN, our findings may not extend to other MN subtypes. Moreover, unmeasured confounders, such as medication adherence, socioeconomic status, and environmental exposures, may affect the validity of the findings. Although treatment variables were adjusted in multivariable models, the potential for indication bias remains due to the non-randomized nature of treatment allocation. Second, the GRS relies on five well-validated SNPs, but genetic architecture of MN is complex and likely involves additional variants. Third, the 28-month median follow-up may not fully capture long-term relapse patterns or the sustained predictive value of the GRS, given the potential for late relapses in MN, and the smaller number of patients at risk at the 5-year time point warrants cautious interpretation of estimates at that interval. Most importantly, the current GRS lacks validation in an independent external cohort. Although we employed rigorous internal validation (repeated cross-validation and time-dependent AUC) which yielded stable results, the risk of overestimating the model’s utility persists. Future multicenter studies with broader multi-omics analyses and external validation are essential to confirm the clinical utility of the GRS.
Conclusion
This study identifies a five-SNP GRS independently associated with relapse in Han Chinese patients with primary PLA2R-associated MN. While the GRS significantly enhances the statistical performance of risk stratification models, its current clinical utility is limited by the single-center, retrospective design and lack of external validation. These findings provide a promising foundation for personalized management, though prospective multicenter studies are essential to confirm the clinical utility and underlying mechanisms across diverse populations.
Abbreviations
BMI, body mass index; GRS, genetic risk score; HB, hemoglobin; WBC, white blood cell; PLT, platelet; CRP, c-reactive protein; IL-6, interleukin-6; TP, total protein; ALB, albumin; CH, cholesterol; TC, total cholesterol; HDL, high-density lipoprotein; LDL, low-density lipoprotein; GLU, glucose; UN, urea nitrogen; UA, uric acid; SCR, serum creatinine; eGFR, estimated glomerular filtration rate; C3, complement component 3; C4, complement component 4; PLA2R, phospholipase A2 receptor; UTP, urinary total Protein; UK, urinary potassium; UCa, urinary calcium; UNa, urinary sodium; TyG, triglyceride-glucose index; TyG-BMI, triglyceride-glucose-body mass index; SII, systemic immune-inflammation index; ARB, angiotensin II receptor blocker; ACEI, angiotensin-converting enzyme inhibitor; CsA, cyclosporine A; CTX, cyclophosphamide; RTX, rituximab; HR, hazard ratio; OR, odds ratio; CI, confidence interval.
Data Sharing Statement
The data that support the findings of this study are available from the corresponding author, SL, upon reasonable request.
Ethics Approval and Informed Consent
This study was approved by the Medical Ethics Committee of the General Hospital of the People’s Liberation Army of China (No. 2022--588-01). The decision letter of the Ethics Committee covered patient data confidentiality and compliance with the Declaration of Helsinki.
Consent for Publication
Not applicable. This manuscript does not contain any individual person’s data in any form (including any individual details, images, or videos) that could lead to the identification of study participants. All data are presented in aggregate form.
Acknowledgments
We thank all members of the State Key Laboratory of Kidney Diseases.
Author Contributions
Shuang Liang: Conceptualization, Methodology, Formal analysis. Xiaolong Wang: Investigation, Data curation, Writing – original draft. Yue Niu: Formal analysis. Kexin Yao: Formal analysis. Zheyi Dong: Writing – review & editing.
All authors made a significant contribution to the work reported, whether that is in the conception, study design, execution, acquisition of data, analysis and interpretation, or in all these areas; took part in drafting, revising or critically reviewing the article; gave final approval of the version to be published; have agreed on the journal to which the article has been submitted; and agree to be accountable for all aspects of the work.
Funding
This work was supported by the Natural Science Foundation of China (NSFC) (82000675).
Disclosure
The authors declare that they have no competing interests.
References
1. Xu X, Wang G, Chen N, et al. Long-term exposure to air pollution and increased risk of membranous nephropathy in China. J Am Soc Nephrol. 2016;27(12):3739–16. doi:10.1681/ASN.2016010093
2. Beck Jr LH, Bonegio RG, Lambeau G, et al. M-type phospholipase A2 receptor as target antigen in idiopathic membranous nephropathy. N Engl J Med. 2009;361(1):11–21. doi:10.1056/NEJMoa0810457
3. Tomas NM, Beck LH Jr, Meyer-Schwesinger C, et al. Thrombospondin type-1 domain-containing 7A in idiopathic membranous nephropathy. N Engl J Med. 2014;371:2277–2287. doi:10.1056/NEJMoa1409354
4. Ronco P, Debiec H. Membranous nephropathy: current understanding of various causes in light of new target antigens. Curr Opin Nephrol Hypertens. 2021;30:287–293. doi:10.1097/MNH.0000000000000697
5. Stanescu HC, Arcos-Burgos M, Medlar A, et al. Risk HLA-DQA1 and PLA2R1 alleles in idiopathic membranous nephropathy. N Engl J Med. 2011;364(7):616–626. doi:10.1056/NEJMoa1009742
6. Gupta S, Köttgen A, Hoxha E, et al. Genetics of membranous nephropathy. Nephrol Dial Transplant. 2018;33(9):1493–1502. doi:10.1093/ndt/gfx296
7. Wang W, Fan S, Li G, et al. Interaction between PLA2R1 and HLA-DQA1 variants contributes to the increased genetic susceptibility to membranous nephropathy in Western China. Nephrology. 2019;24(9):919–925. doi:10.1111/nep.13536
8. Xie J, Liu L, Mladkova N, et al. The genetic architecture of membranous nephropathy and its potential to improve non-invasive diagnosis. Nat Commun. 2020;11(1):1600. doi:10.1038/s41467-020-15383-w
9. Gupta S, Downie ML, Cheshire C, et al. A genetic risk score distinguishes different types of autoantibody-mediated membranous nephropathy. Glomerular Dis. 2023;3(1):116–125. doi:10.1159/000529959
10. Hu X, Xu J, Wang W, et al. Combined serologic and genetic risk score and prognostication of Phospholipase A2 receptor-associated membranous nephropathy. Clin J Am Soc Nephrol. 2024;19(5):573–582. doi:10.2215/CJN.0000000000000422
11. Berchtold L, Letouzé E, Alexander MP, et al. HLA-D and PLA2R1 risk alleles associate with recurrent primary membranous nephropathy in kidney transplant recipients. Kidney Int. 2021;99(3):671–685. doi:10.1016/j.kint.2020.08.007
12. Liang S, Liang YJ, Li Z, et al. Evaluating efficacy and safety of tacrolimus treatment in membranous nephropathy: results of a retrospective study of 182 patients. Ther Clin Risk Manag. 2023;19:351–360. doi:10.2147/TCRM.S399218
13. Scolari F, Delbarba E, Santoro D, et al. Rituximab or cyclophosphamide in the treatment of membranous nephropathy: the RI-CYCLO randomized trial. J Am Soc Nephrol. 2021;32(4):972–982. doi:10.1681/ASN.2020071091
14. Benchimol EI, Smeeth L, Guttmann A, et al. The reporting of studies conducted using observational routinely-collected health data (RECORD) statement. PLoS Med. 2015;12(10):e1001885. doi:10.1371/journal.pmed.1001885
15. Levey AS, Stevens LA, Schmid CH, et al. A new equation to estimate glomerular filtration rate. Ann Intern Med. 2009;150(9):604–612. doi:10.7326/0003-4819-150-9-200905050-00006
16. Disease K. Improving Global Outcomes (KDIGO) Glomerular Diseases Work Group. KDIGO 2021 clinical practice guideline for the management of glomerular diseases. Kidney Int. 2021;100(4S):S1–S276.
17. Bullich G, Ballarín J, Oliver A, et al. HLA-DQA1 and PLA2R1 polymorphisms and risk of idiopathic membranous nephropathy. Clin J Am Soc Nephrol. 2014;9(2):335–343. doi:10.2215/CJN.05310513
18. Liu X, Xu W, Yu C, Wang M, Liu R, Xie R. Associations between M-type phospholipase A2 receptor, human leukocyte antigen gene polymorphisms and idiopathic membranous nephropathy. Bioengineered. 2021;12(1):8833–8844. doi:10.1080/21655979.2021.1987080
19. Qin XS, Liu JH, Lyu GT, et al. Variants in the promoter region of HLA-DQA1 were associated with idiopathic membranous nephropathy in a Chinese Han population. Chin Med J. 2017;130(14):1677–1682. doi:10.4103/0366-6999.209884
20. Wang X, Cao X, Wu J, Liang S, Yang J, Wang H. Exploration of rituximab treatment strategies for membranous nephropathy adapted to the Chinese healthcare environment. BMC Nephrol. 2025;26(1):49. doi:10.1186/s12882-025-03980-0
21. Ruggenenti P, Debiec H, Ruggiero B, et al. Anti-phospholipase A2 receptor antibody titer predicts post-rituximab outcome of membranous nephropathy. J Am Soc Nephrol. 2015;26(10):2545–2558. doi:10.1681/ASN.2014070640
22. Yu Y, Zheng J, Li J, et al. Serum uric acid level is associated with glomerular ischemic lesions in patients with primary membranous nephropathy: an analytical, cross-sectional study. Sci Rep. 2024;14(1):7457. doi:10.1038/s41598-024-57813-5
23. Liu B, Zhao L, Yang Q, Zha D, Si X. Hyperuricemia and hypertriglyceridemia indicate tubular atrophy/interstitial fibrosis in patients with IgA nephropathy and membranous nephropathy. Int. urol. nephrol. 2021;53(11):2321–2332. doi:10.1007/s11255-021-02844-4
24. Ramachandran R, Yadav AK, Kumar V, et al. Two-year follow-up study of membranous nephropathy treated with tacrolimus and corticosteroids versus cyclical corticosteroids and cyclophosphamide. kidney. Int Rep. 2017;2(4):610–616.
25. Praga M, Barrio V, Juarez GF, et al. Tacrolimus monotherapy in membranous nephropathy: a randomized controlled trial. Kidney Int. 2007;71:924–930. doi:10.1038/sj.ki.5002215
26. Ballarin J, Poveda R, Ara J, et al. Treatment of idiopathic membranous nephropathy with the combination of steroids, tacrolimus and mycophenolate mofetil: results of a pilot study. Nephrol Dial Transplant. 2007;22:3196–3201. doi:10.1093/ndt/gfm366
27. Cattran D, Brenchley P. Membranous nephropathy: thinking through the therapeutic options. Nephrol Dial Transplant. 2017;32(suppl_1):i22–i29. doi:10.1093/ndt/gfw404
28. Lin S, Li HY, Zhou T, Lin W. Efficacy and safety of cyclosporine A in the treatment of idiopathic membranous nephropathy in an Asian population. Drug Des Devel Ther. 2019;13:2305–2330. doi:10.2147/DDDT.S204974
29. Caro J, Gutiérrez-Solís E, Rojas-Rivera J, et al. Predictors of response and relapse in patients with idiopathic membranous nephropathy treated with tacrolimus. Nephrol Dial Transplant. 2015;30(3):467–474. doi:10.1093/ndt/gfu306
30. Huh H, Lee H, Lee JP, et al. Factors affecting the long-term outcomes of idiopathic membranous nephropathy. BMC Nephrol. 2017;18(1):104. doi:10.1186/s12882-017-0525-6
31. Barbé-Tuana F, Funchal G, Schmitz CRR, Maurmann RM, Bauer ME. The interplay between immunosenescence and age-related diseases. Semin Immunopathol. 2020;42(5):545–557. doi:10.1007/s00281-020-00806-z
32. de Logt AE V, Fresquet M, Wetzels JF, Brenchley P. The anti-anti-PLA2R antibody in membranous nephropathy: what we know and what remains a decade after its discovery. Kidney Int. 2019;96(6):1292–1302. doi:10.1016/j.kint.2019.07.014
33. Surace AEA, Hedrich CM. The role of epigenetics in autoimmune/inflammatory disease. Front Immunol. 2019;10:1525. doi:10.3389/fimmu.2019.01525
 © 2026 The Author(s). This work is published and licensed by Dove Medical Press Limited. The
full terms of this license are available at https://www.dovepress.com/terms
and incorporate the Creative Commons Attribution
- Non Commercial (unported, 4.0) License.
By accessing the work you hereby accept the Terms. Non-commercial uses of the work are permitted
without any further permission from Dove Medical Press Limited, provided the work is properly
attributed. For permission for commercial use of this work, please see paragraphs 4.2 and 5 of our Terms.
© 2026 The Author(s). This work is published and licensed by Dove Medical Press Limited. The
full terms of this license are available at https://www.dovepress.com/terms
and incorporate the Creative Commons Attribution
- Non Commercial (unported, 4.0) License.
By accessing the work you hereby accept the Terms. Non-commercial uses of the work are permitted
without any further permission from Dove Medical Press Limited, provided the work is properly
attributed. For permission for commercial use of this work, please see paragraphs 4.2 and 5 of our Terms.