Back to Journals » Journal of Hepatocellular Carcinoma » Volume 13
A Mouse in vivo Model Mimicking MASH-Related HCC Pathogenesis
Authors Zheng T, Pei Z, Cui E, Zhu L, Du J, Ling C
Received 21 January 2026
Accepted for publication 8 May 2026
Published 15 May 2026 Volume 2026:13 593754
DOI https://doi.org/10.2147/JHC.S593754
Checked for plagiarism Yes
Review by Single anonymous peer review
Peer reviewer comments 2
Editor who approved publication: Dr Mohamed Shaker
Tianxiao Zheng,1,2,* Zhi Pei,1,2,* Enze Cui,1,2 Luyuan Zhu,1,2 Juan Du,1,2 Changquan Ling1,2
1Department of Traditional Chinese Medicine, The First Affiliated Hospital of Naval Medical University, Shanghai, 200433, People’s Republic of China; 2Department of Chinese Medicine, Naval Medical University, Shanghai, 200433, People’s Republic of China
*These authors contributed equally to this work
Correspondence: Changquan Ling, Department of Traditional Chinese Medicine, The First Affiliated Hospital of Naval Medical University, Shanghai, 200433, People’s Republic of China, Email [email protected] Juan Du, Department of Traditional Chinese Medicine, The First Affiliated Hospital of Naval Medical University, Shanghai, 200433, People’s Republic of China, Email [email protected]
Background/Objectives: Hepatocellular carcinoma (HCC) derived from metabolic dysfunction-associated steatotic liver disease (MASH) has garnered increasing attention. To develop improved treatment strategies, it is crucial to comprehend its pathological processes. However, existing models frequently neglect to integrate key molecular features of human MASH-related HCC or require excessively prolonged experimental timelines. Our objective was to establish a novel murine model that facilitates accelerated and accurate progression by combining chronic metabolic stress with specific oncogenic drivers.
Methods: A murine model was developed by subjecting mice to a choline-deficient, high-fat diet (CDAA-HFD) in conjunction with hydrodynamic transfection of NRASG12V/AKT oncogenes. Disease progression was evaluated through histopathological analysis, while molecular fidelity was assessed by comparing the liver transcriptomic profile of the model to that of human MASH-related HCC.
Results: Results: Histological examination demonstrated that the combination of CDAA-HFD and NRASG12V/AKT expedited the transition from steatohepatitis to hepatocellular carcinoma (HCC), with malignant lesions apparent at the conclusion of the study. Notably, comparative transcriptomic analysis indicated a significant molecular concordance between the animal model and human MASH-related HCC. Dysregulation was prominently observed in pathways regulating lipid metabolism (PPAR signaling, fatty acid metabolism), extracellular matrix remodeling (focal adhesion), and oncogenic signaling (PI3K-Akt pathway).
Conclusion: Conclusions: Our integrated dietary and genetic model accurately replicates the essential pathological and molecular characteristics of human MASH-related HCC. This high level of fidelity confirms its value as a reliable preclinical platform for exploring disease mechanisms and assessing therapeutic strategies for this increasingly prevalent malignancy.
Keywords: MASH-related HCC, mouse model, CDAA-HFD, hydrodynamic transfection, NRAS/AKT oncogenes
Introduction
Primary liver cancer ranks as the third leading cause of cancer-related mortality globally.1 Hepatocellular carcinoma (HCC) constitutes approximately 90% of all primary liver cancer cases and stands as one of the most prevalent malignancies worldwide.2 Historically, HCC has predominantly arisen from chronic liver diseases induced by hepatitis B virus (HBV) or hepatitis C virus (HCV) infections. Nevertheless, in developed nations, only 50% of HCC cases exhibit viral etiology, with the majority of virus-negative patients presenting with metabolic associated fatty liver disease (MAFLD), and, more commonly, metabolic dysfunction-associated steatohepatitis (MASH).2,3 MASH represents a more aggressive pathological state evolving from MAFLD, distinguished by hepatic steatosis exceeding 5% in conjunction with histological evidence of hepatocellular injury, including ballooning degeneration and inflammatory infiltration.4 Over the past decade, MASH-related HCC has emerged as the fifth predominant etiology of liver cancer.5 While the incidence of HBV- and HCV-associated HCC is declining, the overall prevalence of HCC continues to escalate, primarily driven by the rising incidence of MASH.6 The limited understanding of MASH-related HCC pathogenesis significantly impedes our capacity to effectively respond to this burgeoning health crisis. Consequently, there is an urgent need to develop sophisticated in vivo disease models that can elucidate the molecular mechanisms underlying MASH-related HCC pathogenesis and facilitate a more comprehensive understanding of disease progression.
Currently, commonly utilized murine models for MASH-related HCC include the STAM, high-fat diet (HFD) combined with diethylnitrosamine (DEN), Western diet (WD) combined with carbon tetrachloride (CCl4), and Major Urinary Protein-plasminogen activator (MUP-uPA) combined with HFD models. However, each of these models exhibits significant limitations. In the STAM model, mice develop a lean phenotype and type 1 diabetes, which markedly differs from the clinical presentation of human MASH-related HCC, where patients predominantly present with obesity and type 2 diabetes.7 In the HFD + DEN model, the use of HFD mitigates DEN-induced hepatocellular carcinoma, leading to reduced tumor incidence and smaller tumor sizes in rats.8 In the WD + CCl4 model, administration of CCl4 counteracts WD-induced obesity and insulin resistance.9 The MUP-uPA + HFD model is critically limited by its high cost and extended induction period; even at 32 weeks, only small hepatic tumors are observed in mice.10 Consequently, the development of innovative and clinically relevant MASH-related HCC models remains an unmet and pressing scientific need. Inflammation and genetic alterations are primary drivers of MASH-related HCC, whereas cirrhosis is not a universal feature.11,12 Therefore, reliable animal models for MASH-related HCC should incorporate inflammatory and genetic components without necessarily involving cirrhosis. The choline-deficient L-amino acid–defined high-fat diet (CDAA-HFD) model is widely used in preclinical studies of MASH. This model rapidly induces MASH with pathological features that closely resemble the human condition and, upon prolonged dietary induction, can progress to HCC.13 However, the development of HCC in the CDAA-HFD model requires an extended induction period, which limits its utility for efficient drug discovery and screening.14 Using the Sleeping Beauty (SB) transposon for insertional mutagenesis serves as a versatile tool for constructing hepatocellular carcinoma (HCC) models and can facilitate the progression of metabolic-associated steatohepatitis (MASH) to HCC by disrupting genes involved in lipid metabolism15 NRAS, a member of the RAS family, is one of the most frequently mutated oncogenes in human cancers.16 It plays a critical roles in regulating cell growth, differentiation, and proliferation,17 and its dysregulation has been associated with the metabolic reprogramming of tumor cells, remodeling of the tumor microenvironment, and evasion of immune surveillance.18 Given its pivotal role in hepatocarcinogenesis, the constitutively active mutant NRASG12V, frequently observed in human cancers,19 has been extensively utilized in the development of experimental HCC models.20–22 The PI3K–AKT pathway, a key mediator of cellular responses to extracellular signals, is indispensable for regulating lipid metabolism and tumor development.23,24 The palmitoylation and activation of AKT are recognized as pivotal factors in the progression from MASH to HCC.25 In this study, we developed a mouse model related to HCC by combining a choline-deficient amino acid-defined high-fat diet (CDAA-HFD) with hydrodynamic transfection. Using the SB transposon system, we established an NRASG12V/AKT-driven model, facilitating rapid disease progression from MASH to HCC.
Materials and Methods
Animals
Male SPF grade 4–6-week-old C57BL/6J mice were purchased from Gempharmatech Co., Ltd. (Nanjing, China). Five mice per cage were housed under a 12-h light/12-h dark cycle with ad libitum access to standard chow and water. For any invasive procedures requiring anesthesia, mice were anesthetized via intraperitoneal injection of a ketamine/xylazine cocktail (ketamine 100 mg/kg + xylazine 10 mg/kg), which provides surgical-plane anesthesia for approximately 30–45 minutes. At the experimental endpoint, all animals were humanely euthanized by intraperitoneal injection of sodium pentobarbital overdose (150 mg/kg), ensuring rapid loss of consciousness followed by respiratory and cardiac arrest without distress. All animal procedures strictly adhered to the ethical standards approved by the Ethics Committee of Shanghai Changhai Hospital (First Affiliated Hospital of Naval Medical University) [Approval No. CHEC(A.E) 2025–011].
Plasmid Construction and Extraction
The Sleeping Beauty transposase expression plasmid pCMV-SB, the transposon plasmid pT3-EF1αH-NRAS-G12V, and the reporter plasmid pT3-AKT-IRES-luc were purchased from Shanghai Xinzhuo Biotechnology Co., Ltd. All open reading frames, junction regions, and cloning sites were verified by Sanger sequencing prior to use. Plasmid maps and cloning details are available upon request.
For plasmid extraction, each plasmid was transformed into DH5αand plated on LB agar containing the Ampicillin (100 µg/mL). Single colonies were selected and cultured overnight in LB broth with the Ampicillin (100 µg/mL) at 37°C with shaking (200–250 rpm). Large-scale plasmid DNA was purified using the UElandy Plasmid Maxiprep Kit (UE-MX-P-5, UElandy, China) according to the manufacturer’s instructions. Plasmid DNA was eluted in nuclease-free water, and DNA concentration and purity were determined by spectrophotometry (A260/A280). Only plasmids with appropriate purity were used for hydrodynamic injection experiments.
Hydrodynamic Injection
Hydrodynamic injection was performed as previously described.26,27 Briefly, 10 μg of plasmid encoding pT3-EF1αH-NRAS-G12V/pT3-AKT-IRES-luc and sleeping beauty transposase were diluted in 2 mL of normal saline (0.9% NaCl) at a ratio of 25:1, filtered through 0.22 μm, and injected into the lateral tail vein of mice within 5 to 7 seconds.
Construction of MASH-Related HCC Animal Model
Feed for animal experiments was purchased from Trophic Animal Feed High-tech Co., Ltd (Nantong, China). C57BL/6J mice were fed with CDAA-HFD diet (TP1R804) to make MASH model, and the control group was fed with CSAA diet (TP1R804S). To induce liver-specific co-overexpression of oncogenic NRASG12V and AKT, hydrodynamic injection was performed after the mice had been fed special diet for 8 weeks. Three day after tail vein injection, D-luciferin potassium salt (Absin, catalog number: abs42075819) was injected intraperitoneally at a concentration of 150 mg/kg fluorescein / body weight, and 15 min after injection, Live animal imaging system (AniView600 SE, Guangzhou Biolight Biotechnology Co., Ltd, Guangzhou, China) was used for intravital imaging analysis for bioluminescent monitoring of successful liver transfection. During the experiment, the weight of mice was measured every week. At the end of the 16th week, the mice were euthanized after blood collection, and the liver specimens were weighed. The liver tissues were subsequently fixed in 4% paraformaldehyde, and the remaining liver tissues were stored in liquid nitrogen.
Histopathological Examination
At 16 weeks, the mice were euthanized, and the liver tissues were fixed with 4% paraformaldehyde. After 4% paraformaldehyde fixation for 48h, the liver specimens were paraffin embedded. Liver sections were prepared and stained with H&E, oil red O, and Masson according to standard procedures. The degree of hepatic steatosis, vacuolization and collagen deposition were evaluated.
NAFLD activity score and fibrosis stage were evaluated by an expert pathologist according to the NASH CRN scoring system.13 The histological scoring was performed blinded, with no knowledge by the pathologist of the treatment received.
Western Blotting
Total protein was extracted from liver tissue and quantified using BCA protein analysis reagent (beyotime Biotechnology). Then, equal amounts of protein (40 μ g) were separated by sodium dodecyl sulfate page, blotted on 0.22 μ m PVDF membrane. Immunoblot analysis was performed using primary antibodies for Phospho-PI3 Kinase p85 Antibody (4228S, Cell Signaling Technology, America), PI3 Kinase p85 Antibody (4292S, Cell Signaling Technology, America), Phospho-Akt Rabbit Monoclonal Antibody (4060S, Cell Signaling Technology, America), Akt Antibody (9272S, Cell Signaling Technology, America), NRAS Polyclonal antibody (Cat No. 10724-1-AP, Proteintech, Wuhan, China) and beta-Actin Rabbit Monoclonal Antibody (4970S, Cell Signaling Technology, America). To account for changes in protein loading, expression levels were normalized to internal control proteins, such as β -actin.
Biochemical Analysis
Blood was collected and then centrifuged to obtain the serum. Serum levels of alanine transaminase (ALT), aspartate transaminase (AST), triglyceride (TG) were measured using corresponding kits (Nanjing Jiancheng, Nanjing, China).
Measurement of Inflammatory Cytokines
The concentrations of inflammatory cytokines including tumor necrosis factor-α (TNF-α), interleukin (IL)-6, and IL-1β were detected by ELISA kits (Lianke, Hangzhou, China).
RNA-Sequencing and Bioinformatics Analysis
Total RNA from liver tissue was extracted using Trizol reagent according to the manufacturer’s protocol (Invitrogen, America). The quality of total RNA was checked by Agilent 2100 bioanalyzer (Agilent Technologies Inc.) to have OD260/280 ratio of between 1.8–2.0 and RNA integrity number (RIN) value higher than 8.0. The RNA samples which met the quality assessment were then subjected to Illumina Solexa sequencing using Hiseq 1500 sequencer (Illumina) for performing HiSeq sequencing run (pair end sequencing of 101bp). Each sample had an average throughput of 10.8Gb and a total throughput of 21.5Gb. An average of 94% of the bases achieved a quality score of Q30 where Q30 denotes the accuracy of a base call to be 99.9%. Expression estimation and tests for differential expression were processed by Cufflinks v2.1.1.
Human MASH-HCC sample transcriptome sequencing information (GSE164760) was obtained from Gene Expression Omnibus (GEO). Differential analysis software was used to screen differentially expressed genes based on the read count value of genes in each sample. For differential groups with biological replicates, Deseq2 (Version 1.48.1) package was used for differential analysis; For differential grouping without biological replicates, edger software was used for differential analysis. In the process of differential expression gene detection, pvalue < 0.05 was used as the screening criterion. Fold change represents the ratio of expression between two samples (groups). False discovery rate (FDR) is obtained by correcting the p-value of difference significance, indicating the significance of the difference. For the convenience of comparison, the logarithm value of the difference multiple is taken and expressed in log2FC. The greater the absolute value of log2FC, the more obvious the difference change of genes with smaller FDR value in the two groups of samples.
In order to understand the Gene Ontology (GO) terms that are significantly enriched compared with the whole genome background, the enrichment analysis of biological processes, molecular functions and cellular components was performed using the hypergeometric test method with clusterprofiler (Version 4.16.0) package for the differential gene sets of each grouping. Kyoto Encyclopedia of Genes and Genomes (KEGG) pathway enrichment analysis takes the pathway in KEGG database as the unit, and applies the hypergeometric test to find out the pathways that are significantly enriched in the differentially expressed genes compared with the whole genome background. Pathway significant enrichment can determine the main biochemical metabolic pathways and signal transduction pathways involved in genes.
Statistical Analysis
All plots and statistical analysis were performed using GraphPad Prism (version 10.0). Data were analyzed by two-tailed unpaired Student’s t-test (when comparing two groups); or one- or two-way ANOVA with Tukey or Dunnett’s post hoc tests, as appropriate, (when comparing more than two groups). The displayed results showed the means and the standard deviations, and those with p values less than 0.05 were considered statistically significant (*p<0.05, **p<0.01, ***p<0.001, ****p<0.0001). In all cases, results in the text show mean ± S.D. In all experiments, n values represent the number of independent biological samples. All experiments and statistical analysis were performed with n ≥ 3.
Results
Efficiency of NRASG12V/AKT Plasmid Delivery via Hydrodynamic Transfection
At 8 weeks following the initiation of either the CSAA or CDAA-HFD diet, hydrodynamic tail vein injection was used to deliver NRASG12V/AKT plasmids (Figure 1A). Fluorescence imaging performed 72 hours later and again at the 16-week endpoint revealed intense, liver-specific fluorescence in mice that received the NRASG12V/AKT plasmids, confirming efficient and sustained transfection restricted primarily to the liver (Figure 1B–D). Western blot analysis of liver lysates collected at 16 weeks demonstrated upregulated NRASG12V protein expression and enhanced phosphorylation of AKT and PI3K in the CSAA+NRASG12V/AKT group. These increases were even more pronounced in the CDAA-HFD+NRASG12V/AKT group (Figure 2A–D). These data verify successful NRASG12V/AKT overexpression facilitated by hydrodynamic transfection and suggest that the combined effects of the CDAA-HFD and oncogenic NRASG12V/AKT signaling may synergistically enhance pathway activation.
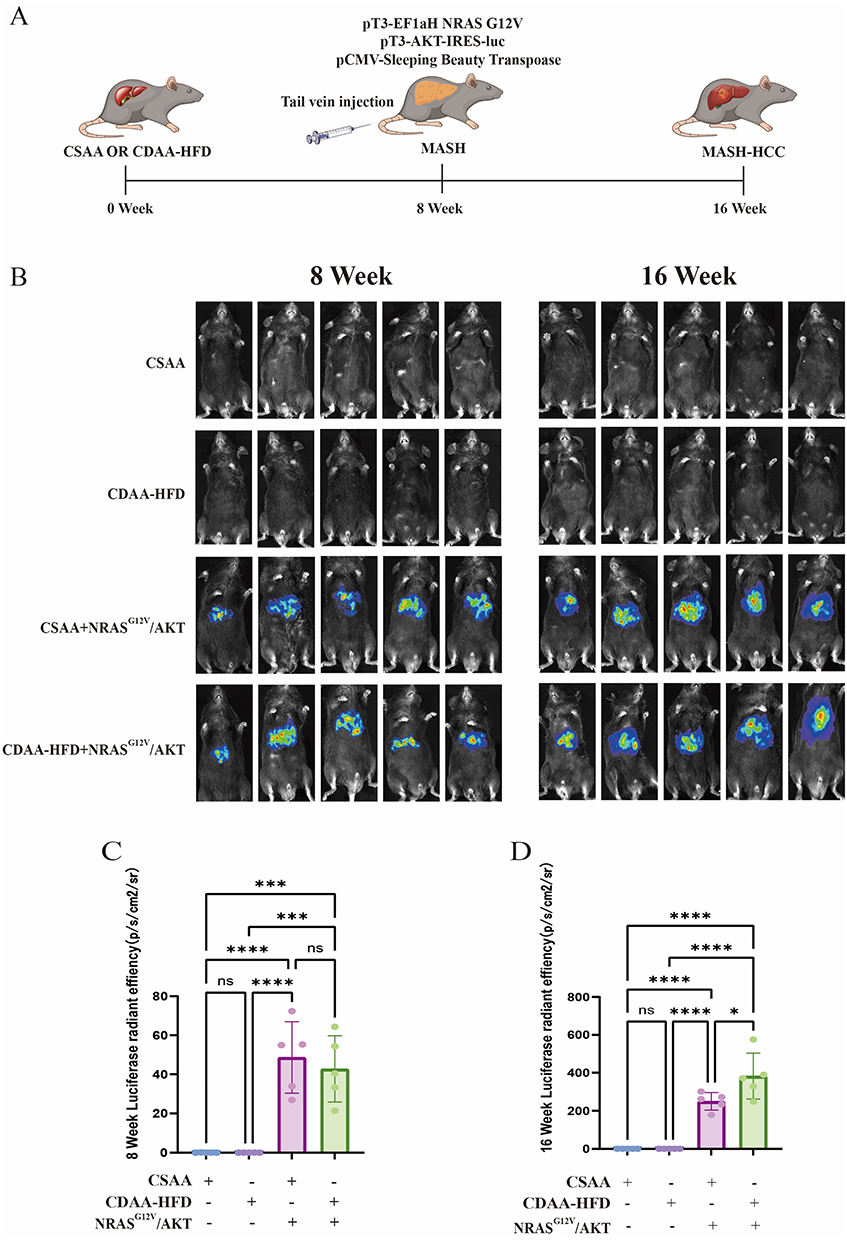 |
Figure 1 Establishment and validation of the MASH-related HCC mouse model. (A) Schematic of the experimental timeline. Mice were fed a CDAA-HFD or control CSAA diet for 16 weeks. Hydrodynamic tail vein injection of NRASG12V/AKT plasmids was performed at week 8. (B) Representative in vivo bioluminescence images of mice at 72 hours post-injection and at the 16-week endpoint. (C and D) Quantitative analysis of bioluminescence signal intensity at 72 hours post-injection (C) and at the 16-week endpoint (D). Data are mean ± SEM (n=5). ns, not significant; *, p < 0.05; ***, p < 0.001; ****, p < 0.0001 (one-way ANOVA with Tukey’s post hoc test). |
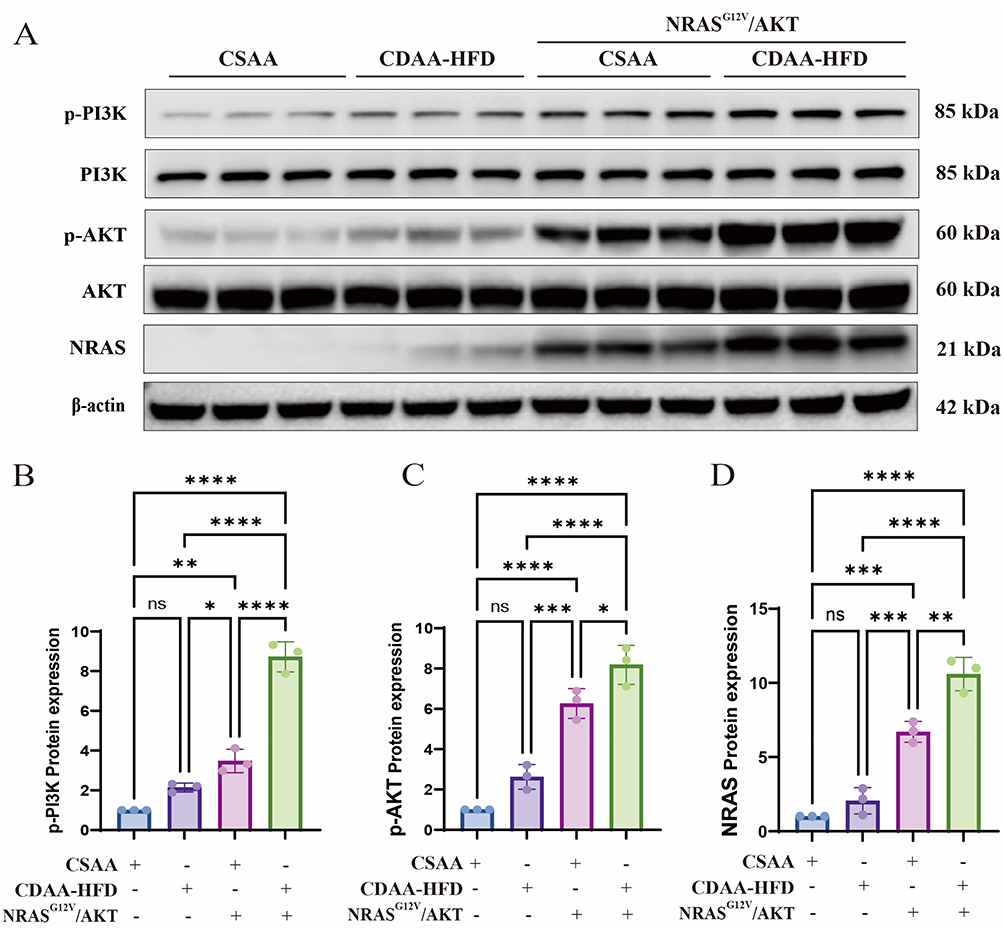 |
Figure 2 Oncogene expression and pathway activation in mouse livers. (A) Representative Western blot of PI3K, p-PI3K, AKT, p-AKT, NRAS, and β-actin in liver lysates at week 16. (B–D) Densitometric quantification of the p-PI3K/PI3K ratio (B), p-AKT/AKT ratio (C), and NRAS protein levels (D). Data are mean ± SD (n = 3). ns, not significant; *, p < 0.05; **, p < 0.01; ***, p < 0.001; ****, p < 0.0001 (one-way ANOVA with Tukey’s post hoc test). |
General Phenotypic Observations in Mice and Liver Following CDAA-HFD and NRASG12V/AKT Plasmid Transfection
During the initial 8-week period, no significant differences in body weight gain were observed among all groups. At week 8, NRASG12V/AKT overexpression was induced via plasmid transfection. From this point until week 16, CDAA-HFD-fed mice did not exhibit significant weight gain or develop obesity compared to CSAA-fed controls. NRASG12V/AKT overexpression reduced body weight in both CSAA-fed mice and CDAA-HFD-fed mice (Figure 3A and B). By week 16, the CDAA-HFD group and the CSAA+NRASG12V/AKT group exhibited increased liver weight and liver-to-body weight ratio compared to controls. The CDAA-HFD+NRASG12V/AKT group showed the highest values for both parameters (Figure 3C and D). Furthermore, no tumor nodules were observed in the livers of mice fed either CSAA or CDAA-HFD alone by week 16. In contrast, tumor nodules were detected in mice with NRASG12V/AKT overexpression under both dietary conditions, with the CDAA-HFD+NRASG12V/AKT group showing the highest nodule counts. (Figure 3E and F).
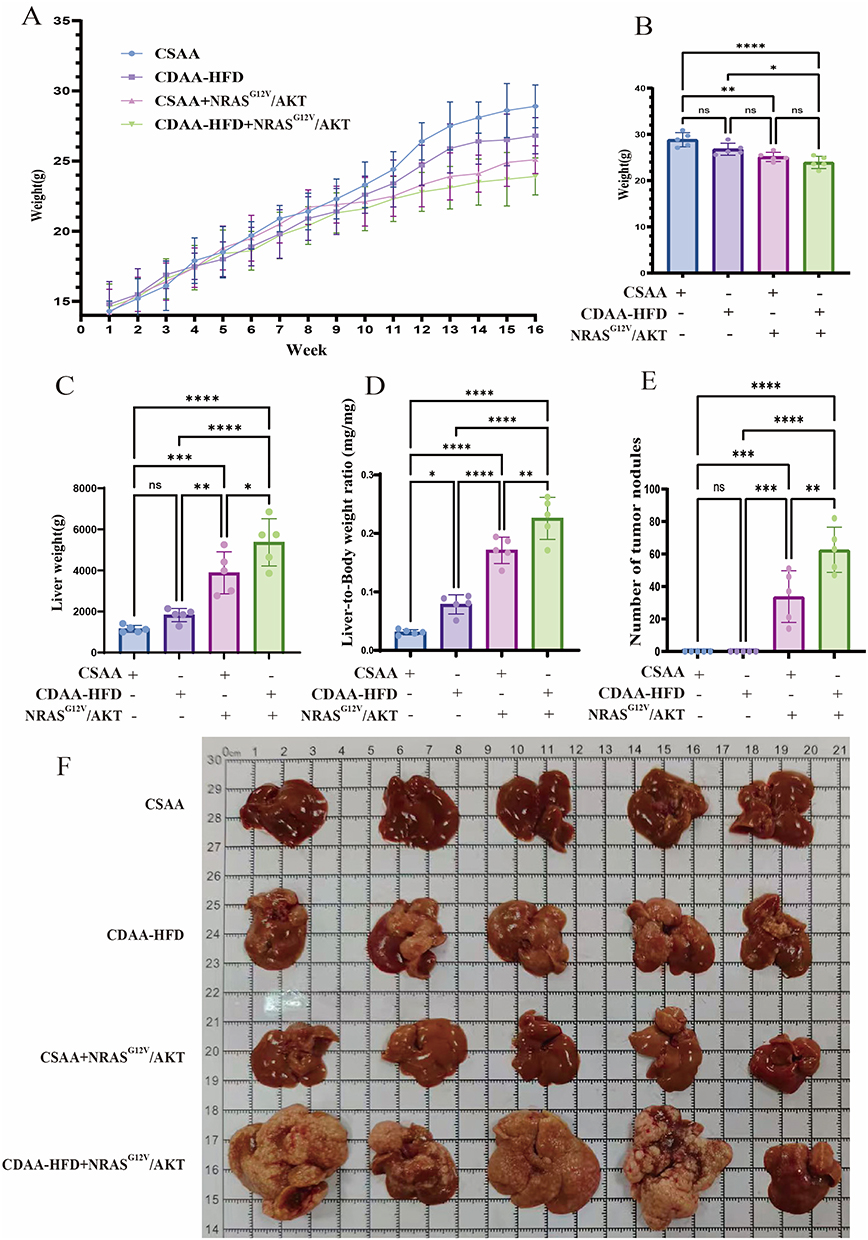 |
Figure 3 General condition and liver morphology of mice. (A) Weekly body weight changes during the 16-week experiment. (B–D) Terminal body weight (B), absolute liver weight (C), and liver-to-body weight ratio (D) at week 16. (E) Count of visible surface tumor nodules per liver. (F) Representative macroscopic images of excised livers at week 16. Data in (B–E) are mean ± SD (n = 5). ns, not significant; *, p < 0.05; **, p < 0.01; ***, p < 0.001; ****, p < 0.0001 (one-way ANOVA with Tukey’s post hoc test). |
CDAA-HFD Increases Serum Biomarkers of Liver Injury and Inflammation in Mice
At week 16, serum levels of the liver injury markers alanine aminotransferase (ALT) and aspartate aminotransferase (AST), along with the lipid parameter triglyceride (TG), were significantly elevated in CDAA-HFD-fed mice compared to CSAA-fed controls, regardless of NRASG12V/AKT status. The induction of NRASG12V/AKT overexpression alone did not significantly alter these markers compared to the controls (Figure 4A–C).
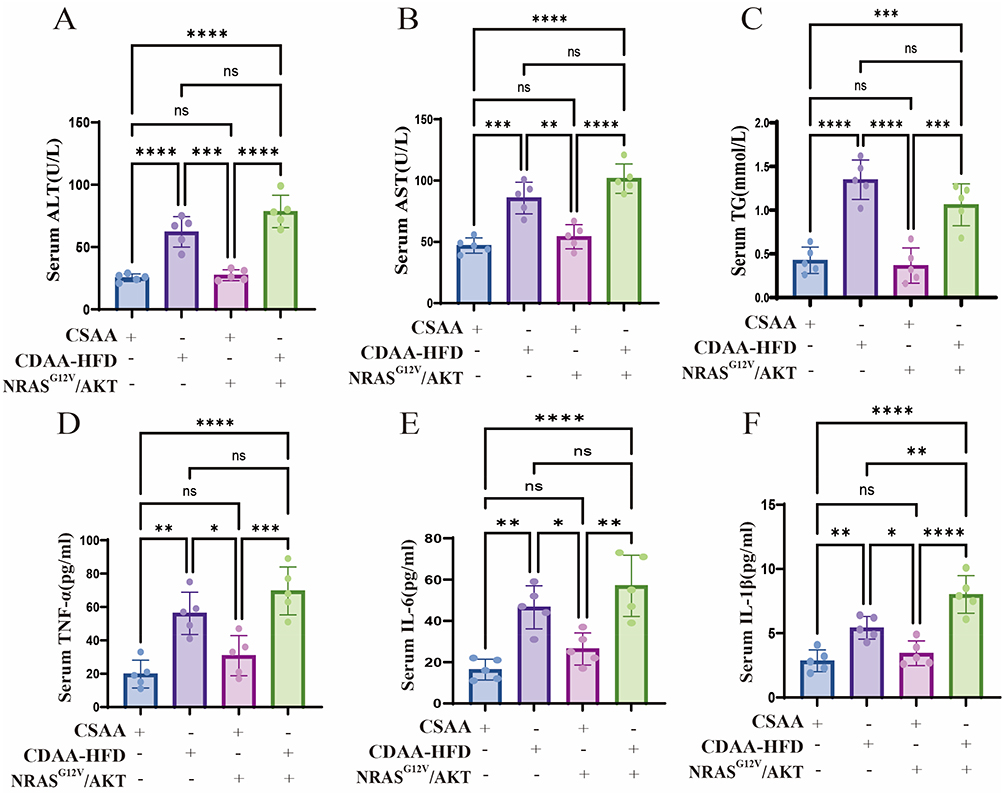 |
Figure 4 Assessment of serum markers for liver injury, lipids, and inflammation. Serum levels of ALT (A), AST (B), TG (C), TNF-α (D), IL-6 (E), and IL-1β (F) at week 16. Data are mean ± SD (n = 5). ns, not significant; *, p < 0.05; **, p < 0.01; ***, p < 0.001; ****, p < 0.0001 (one-way ANOVA with Tukey’s post hoc test). |
Furthermore, at week 16, serum levels of the pro-inflammatory cytokines tumor necrosis factor-alpha (TNF-α), interleukin-6 (IL-6), and interleukin-1beta (IL-1β) were significantly elevated in CDAA-HFD-fed mice compared to CSAA-fed controls. Notably, under the CDAA-HFD fed, the increase in IL-1β was significantly greater in mice that received NRASG12V/AKT overexpression compared to those that did not. The induction of NRASG12V/AKT overexpression alone in CSAA-fed mice did not alter these inflammatory markers (Figure 4D–F).
NRASG12V/AKT Overexpression Promoted the Progression of CDAA-HFD-Induced Steatohepatitis Toward Fibrosis and Tumorigenesis
Histopathological examination revealed that mice fed CDAA-HFD, with or without NRASG12V/AKT overexpression, developed severe steatosis, characterized by both macrovesicular and microvesicular lipid droplets (Figure 5A). This observation was quantitatively supported by Oil Red O staining analysis, which confirmed that NRASG12V/AKT overexpression alone neither induced significant steatosis nor exacerbated it in the context of CDAA-HFD feeding (Figure 5B). These findings are consistent with hepatic TG quantification (Figure 5C). In terms of inflammation, the CDAA-HFD-fed groups, with or without NRASG12V/AKT overexpression, exhibited marked lobular inflammation and ballooning degeneration (Figure 5A). Conversely, NRASG12V/AKT overexpression alone did not induce these inflammatory features above control levels, nor did it amplify them in CDAA-HFD-fed mice. These histopathological findings were supported by scores for steatosis, inflammation, and the NAFLD Activity Score (NAS) (Figure 5D–F).
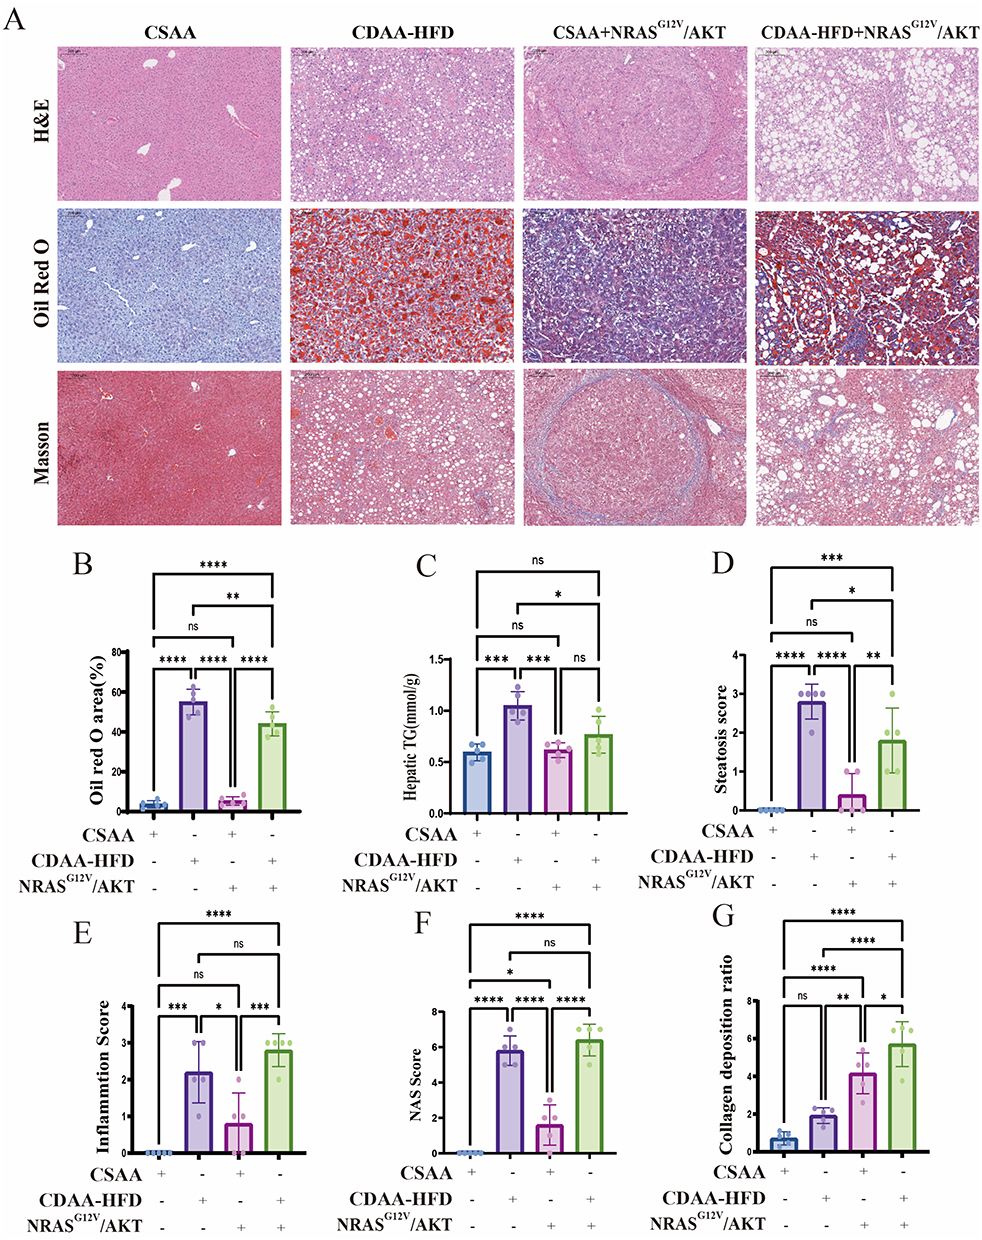 |
Figure 5 Histopathological evaluation of liver steatosis, inflammation, fibrosis, and tumorigenesis. (A) Representative liver sections stained with H&E (top), Oil Red O (middle), and Masson’s trichrome (bottom). Scale bars: 200 µm. (B) Quantification of Oil Red O-positive area (%). (C) Hepatic TG content. (D–F) Histological scores for steatosis (D), inflammation (E), and NAS (F). (G) Quantification of collagen deposition area (%). Data in (B–G) are mean ± SD (n = 5). ns, not significant; *, p < 0.05; **, p < 0.01; ***, p < 0.001; ****, p < 0.0001 (one-way ANOVA with Tukey’s post hoc test). |
Masson staining demonstrated that CDAA-HFD feeding alone induced mild collagen deposition. This fibrotic response was significantly augmented in mice receiving the combination of CDAA-HFD and NRASG12V/AKT overexpression. NRASG12V/AKT overexpression alone also elicited collagen deposition, the extent of which was intermediate between that caused by CDAA-HFD alone and the combination treatment (Figure 5A and G). Notably, H&E staining revealed foci of cells with enlarged, hyperchromatic nuclei—a feature indicative of malignancy—in the livers of CSAA+NRASG12V/AKT and CDAA-HFD+NRASG12V/AKT mice, which were absent in groups without NRASG12V/AKT overexpression (Figure 5A).
Collectively, these results demonstrate that 16 weeks of CDAA-HFD feeding successfully induced MASH in mice. While NRASG12V/AKT overexpression did not exacerbate the MASH phenotype, it markedly promoted the progression of CDAA-HFD-induced steatohepatitis toward fibrosis and tumorigenesis. Furthermore, the liver histology of CDAA-HFD+NRASG12V/AKT mice at 16 weeks closely recapitulated key features of human MASH-related HCC, including steatosis, lobular inflammation, ballooning, fibrosis, and the emergence of malignant histological characteristics, thereby establishing this combined model as one that aligns with the pathological features of human MASH-related HCC.
Global Transcriptome Dysregulation Aligns Between Human MASH-Related HCC and Mouse MASH-Related HCC Models
Our comparative transcriptomic analyses have revealed a close similarity between our murine model of MASH-related HCC and the human disease by identifying shared dysregulation in core functional pathways. Specifically, we compared the transcriptomic profiles of human MASH versus MASH-related HCC from the GEO dataset (GSE164760) with those from our mouse model, which was established by combining CDAA-HFD feeding with hydrodynamic transfection of NRASG12V/AKT plasmids.
Analyses of both human and mouse datasets identified a conserved set of enriched pathways critical to disease pathogenesis. At the GO level, key overlapping biological processes included fatty acid metabolic process and small molecule catabolic process. Notably, both species exhibited significant enrichment in the cellular component collagen-containing extracellular matrix and focal adhesion. Molecular function analysis further confirmed shared enrichment in integrin binding and growth factor binding (Figure 6A and C).
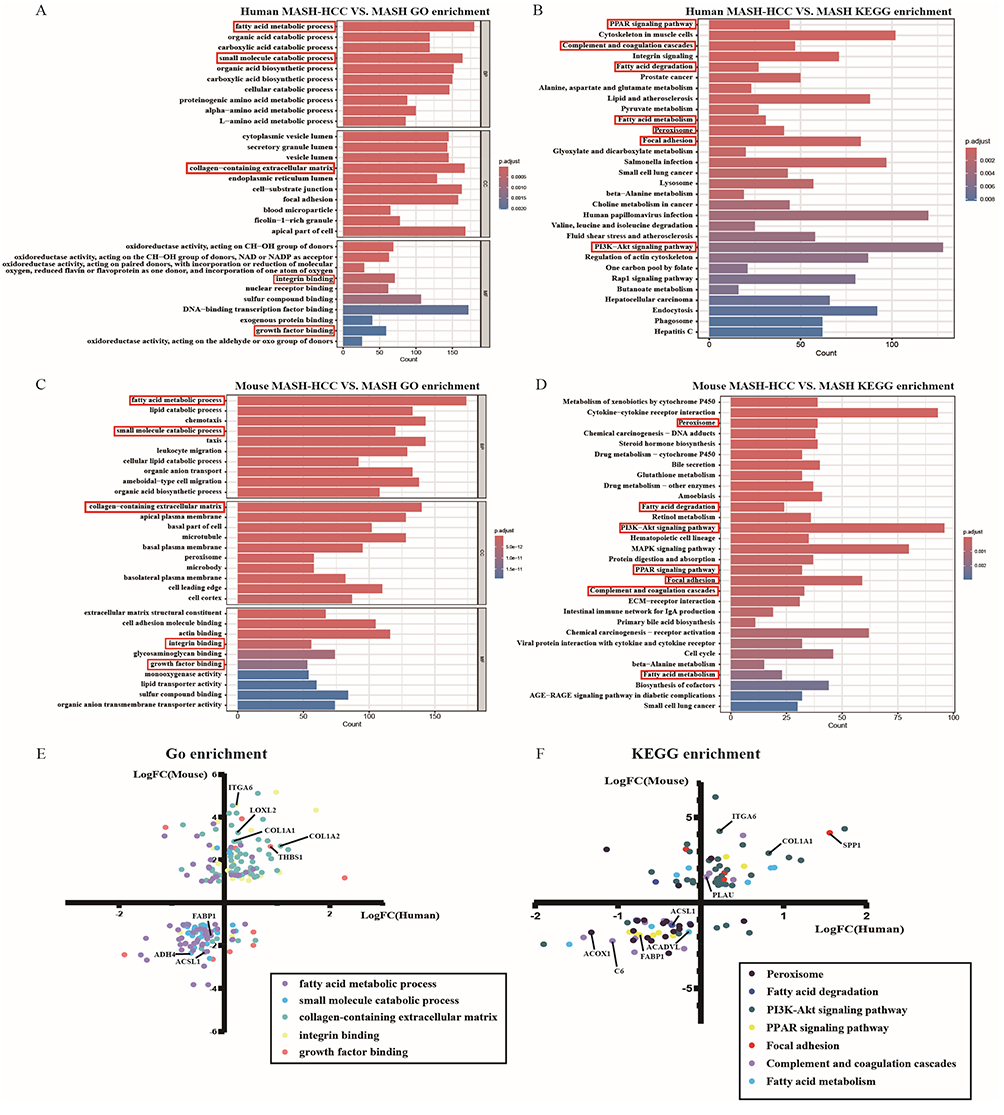 |
Figure 6 Comparative transcriptomic analysis reveals consistent pathway and gene alterations between human and mouse MASH-related HCC. (A and B) Human MASH-HCC transcriptomic analysis (dataset GSE164760, MASH-HCC vs. MASH): (A) Top 10 enriched GO terms per functional category of dysregulated genes. (B) Enriched KEGG pathways. Red boxes indicate pathways also enriched in the mouse model. Bar length represents gene count; color represents adjusted p-value (p.adjust). (C and D) Mouse MASH-HCC model transcriptomic analysis (CDAA-HFD+NRASG12V/AKT vs. CDAA-HFD): (C) Top 10 enriched GO terms per functional category. (D) Enriched KEGG pathways. Markers and plotting parameters are consistent with panels (A and B). (E and F) Concordance of expression changes in co-enriched pathways: Scatter plots show log2(fold change) of genes that were significantly differentially expressed (adjusted p < 0.05) with a concordant direction of change in both species. Points are colored by their associated GO term (E) or KEGG pathway (F). The solid line indicates the identity line (y = x). |
Most interesting, KEGG pathway analysis demonstrated a substantial concordance between our model and human MASH-related HCC. Multiple central pathways were co-enriched, prominently including PPAR signaling pathway, Focal adhesion, Complement and coagulation cascades, PI3K-Akt signaling pathway, Fatty acid degradation, Fatty acid metabolism, and Peroxisome. The shared dysregulation of these pathways, which govern lipid homeostasis, extracellular matrix interaction, inflammatory response, and oncogenic signaling, underscores a high degree of molecular fidelity (Figure 6B and D).
Gene-level concordance reinforces pathway fidelity. To substantiate the pathway-level concordance at a higher resolution, we identified genes within the co-enriched pathways that were significantly differentially expressed (adjusted p-value < 0.05) and exhibited a concordant direction of change (both up- or both down-regulated) in both species. This analysis revealed a strong positive correlation at the individual gene level, with genes clustering in the concordantly up- and down-regulated quadrants (Figure 6E and F).
The conserved dysregulation pattern was driven by key genes across functional categories. We observed consistent downregulation of genes involved in peroxisomal function and lipid metabolism, such as FABP1 (fatty acid-binding protein 1) and ACOX1 (acyl-CoA oxidase 1). Conversely, genes mediating extracellular matrix remodeling and fibrosis—including the core collagen subunits COL1A1/COL1A2 and the cross-linking enzyme LOXL2—were markedly upregulated. This pro-fibrotic state was accompanied by the coordinated activation of oncogenic and adhesion signaling pathways, exemplified by the upregulation of ITGA6 (integrin), THBS1 (matricellular protein), and SPP1 (osteopontin). Furthermore, the complement and coagulation cascade exhibited a distinct dichotomous regulation, with induction of the profibrotic protease PLAU (uPA) but suppression of the classical pathway component C6. The coordinated dysregulation of these core molecular nodes underscores that our model recapitulates specific, conserved gene-level alterations within the perturbed pathways of human MASH-related HCC.
Collectively, these results demonstrate that the dysregulated molecular landscape in our CDAA-HFD + NRASG12V/AKT murine model closely recapitulates the core pathway and gene-level alterations observed in human MASH-related HCC. This strong transcriptomic congruence, spanning metabolism, tissue remodeling, and signaling networks, validates the translational relevance of our model and establishes it as a robust platform for mechanistic investigation and therapeutic exploration.
Discussion
In the present study, we established a murine model of MASH‑related HCC by combining CDAA‑HFD with hydrodynamic delivery of NRASG12V/AKT oncogenes. This model recapitulates the full histological spectrum of human MASH-related HCC – steatosis, lobular inflammation, ballooning degeneration, fibrosis, and malignant transformation28 – within 16 weeks. Notably, NRASG12V/AKT overexpression alone did not induce significant steatosis or inflammation, but it dramatically accelerated fibrosis and tumor formation in the context of CDAA‑HFD feeding. This observation suggests that pre‑existing metabolic stress creates a permissive microenvironment in which oncogenic NRAS and AKT drive malignant progression rather than initiating de novo inflammation or steatosis. Such a two‑hit mechanism – metabolic priming followed by oncogenic amplification – closely mirrors the proposed trajectory of human disease, where chronic MASH provides a field of genotoxic stress and immune dysregulation that synergizes with acquired oncogenic mutations.29
Compared with commonly used MASH-related HCC models,30 our approach offers several practical advantages. The STAM model induces a lean, type 1 diabetic phenotype, which contrasts with the obese, type 2 diabetes background typical of human MASH-related HCC.7,29 In the HFD + DEN model, the high‑fat diet suppresses DEN bioactivation, leading to lower tumor incidence and smaller tumor sizes.8 The WD + CCl4 model is confounded by the fact that CCl4 itself reverses diet‑induced obesity and insulin resistance, and CCl4 acts as a direct genotoxin that may bypass some metabolic drivers.9 The MUP-uPA + HFD model requires up to 32 weeks to produce only small hepatic tumors.10 By contrast, our CDAA‑HFD + NRASG12V/AKT model maintains a metabolically compromised phenotype and consistently generates multifocal tumor nodules by week 16, representing a substantially shorter induction period than either CDAA‑HFD alone or the MUP-uPA + HFD model.10,13 Furthermore, hydrodynamic injection is a somatic, non‑germline technique that allows spatial and temporal control of oncogene expression, avoiding the developmental compensation often seen in conventional transgenic lines.20,27
Transcriptomic alignment between our murine model and human MASH-related HCC (GEO dataset GSE164760) revealed co‑enrichment of pathways governing lipid metabolism (for example, PPAR signaling, fatty acid degradation, and fatty acid metabolism), extracellular matrix remodeling (such as focal adhesion and the collagen‑containing extracellular matrix), and oncogenic signaling (including the PI3K‑Akt pathway). The PPAR signaling pathway, a master regulator of hepatic lipid homeostasis, is dysregulated in both human and mouse MASH-related HCC, indicating a conserved metabolic switch that promotes lipotoxicity and oxidative stress.4,13 The shared activation of focal adhesion and integrin binding pathways reflects increased matrix stiffness and epithelial‑mesenchymal transition, processes known to facilitate invasion in human MASH-related HCC.12 Importantly, the PI3K‑Akt axis was hyperactivated in our model, consistent with a recent report that a high‑fat diet drives AKT palmitoylation and liver tumorigenesis.25,31 Thus, our model captures not only individual gene expression changes but also the interconnected network perturbations that characterize the human disease.
The accelerated and reproducible nature of this model makes it particularly suitable for preclinical intervention studies. Unlike long‑term dietary models that often exhibit variable tumor latency, our combination protocol yields a high tumor burden with low inter‑animal variability, enabling smaller group sizes and faster drug efficacy testing. Moreover, because the oncogenes are delivered via hydrodynamic injection, the model can be readily adapted to test other driver mutations or to incorporate clustered regularly interspaced short palindromic repeats (CRISPR)-based knockout of tumor suppressors. This flexibility is critical for dissecting the clonal heterogeneity and therapy resistance mechanisms that define human MASH-related HCC.15
Several limitations should be acknowledged. First, only male mice were used. Given the strong male predominance of human MASH-related HCC, future studies should include female mice to assess sex‑dependent effects on tumor promotion. Second, hydrodynamic tail vein injection results in liver‑wide, synchronous oncogene expression, whereas human tumors arise from rare, clonal events. Nevertheless, this system models the consequence of oncogene activation rather than its stochastic occurrence, which is acceptable for proof‑of‑concept efficacy studies. Third, we did not perform single‑cell or spatial transcriptomics, which could reveal the contribution of distinct cell populations – for example, Kupffer cells and hepatic stellate cells – to fibrogenesis and immune evasion.32,33 Finally, the CDAA‑HFD induces a relatively lean phenotype, which may not fully recapitulate the obesity‑driven metabolic syndrome seen in many patients.
In summary, the CDAA‑HFD + NRASG12V/AKT murine model faithfully recapitulates the histopathological and molecular features of human MASH‑related HCC within a practical 16‑week timeframe. It offers distinct advantages over existing models in terms of speed, reproducibility, and pathway fidelity. This model therefore provides a robust platform for mechanistic studies of hepatocarcinogenesis in metabolic liver disease and for preclinical evaluation of novel therapeutics targeting metabolic dysfunction, extracellular matrix remodeling, or PI3K‑AKT signaling in the context of MASH‑driven liver cancer.
Conclusions
We have established a physiologically relevant murine model of MASH-related HCC through a combination of dietary and genetic modifications. The model exhibits high fidelity to human disease in both histological and molecular aspects, particularly preserving pathways involved in metabolic dysfunction, tissue remodeling, and oncogenic signaling. The strong concordance between this model and human MASH-related HCC at the pathway level underscores its value as a predictive preclinical platform. This model is poised to advance mechanistic studies on hepatocarcinogenesis in metabolic liver disease and expedite the assessment of targeted therapeutic strategies for this increasingly prevalent malignancy.
Institutional Review Board Statement
This study was conducted according to the guidelines of the Declaration of Helsinki. All animal experimental procedures were reviewed and approved by the Ethics Committee of Shanghai Changhai Hospital (First Affiliated Hospital of Naval Medical University) [Approval No. CHEC(A.E) 2025-011].
The transcriptomic analysis of human liver samples utilized de-identified data obtained from the public Gene Expression Omnibus (GEO) database (Accession GSE164760). In accordance with Item (1) of Article 32 of the “Measures for Ethical Review of Life Science and Medical Research Involving Human Subjects” (National Health Commission, China, February 18, 2023), research involving legally obtained public data is exempt from ethical review. Therefore, no additional Institutional Review Board approval was required for this portion of the study.
Data Sharing Statement
The data that support the findings of this study are available from the corresponding authors, Juan Du and Changquan Ling, upon reasonable request.
Author Contributions
All authors made a significant contribution to the work reported, whether that is in the conception, study design, execution, acquisition of data, analysis and interpretation, or in all these areas; took part in drafting, revising or critically reviewing the article; gave final approval of the version to be published; have agreed on the journal to which the article has been submitted; and agree to be accountable for all aspects of the work.
Funding
This work was financially supported by the National Natural Science Foundation of China (82374174).
Disclosure
The authors declare no conflicts of interest in this work.
References
1. Rumgay H, Arnold M, Ferlay J, et al. Global burden of primary liver cancer in 2020 and predictions to 2040. J Hepatol. 2022;77(6):1598–15. doi:10.1016/j.jhep.2022.08.021
2. Asafo-Agyei KO, Samant H. Hepatocellular Carcinoma. In: StatPearls. Treasure Island (FL): StatPearls Publishing Copyright © 2025, StatPearls Publishing LLC.; 2025.
3. El-Serag HB. Hepatocellular carcinoma. N Engl J Med. 2011;365(12):1118–1127. doi:10.1056/NEJMra1001683
4. Sergi CM. NAFLD (MASLD)/NASH (MASH): does it bother to label at all? A comprehensive narrative review. Int J Mol Sci. 2024;25(15):8462.
5. Liu Y, Zheng J, Hao J, et al. Global burden of primary liver cancer by five etiologies and global prediction by 2035 based on global burden of disease study 2019. Cancer Med. 2022;11(5):1310–1323. doi:10.1002/cam4.4551
6. Koshy A. Evolving global etiology of hepatocellular carcinoma (HCC): insights and trends for 2024. J Clin Exp Hepatol. 2025;15(1):102406. doi:10.1016/j.jceh.2024.102406
7. Fujii M, Shibazaki Y, Wakamatsu K, et al. A murine model for non-alcoholic steatohepatitis showing evidence of association between diabetes and hepatocellular carcinoma. Med Mol Morphol. 2013;46(3):141–152. doi:10.1007/s00795-013-0016-1
8. Duan XY, Pan Q, Yan S-Y, et al. High-saturate-fat diet delays initiation of diethylnitrosamine-induced hepatocellular carcinoma. BMC Gastroenterol. 2014;14:195. doi:10.1186/s12876-014-0195-9
9. Tsuchida T, Lee YA, Fujiwara N, et al. A simple diet- and chemical-induced murine NASH model with rapid progression of steatohepatitis, fibrosis and liver cancer. J Hepatol. 2018;69(2):385–395. doi:10.1016/j.jhep.2018.03.011
10. Nakagawa H, Umemura A, Taniguchi K, et al. ER stress cooperates with hypernutrition to trigger TNF-dependent spontaneous HCC development. Cancer Cell. 2014;26(3):331–343. doi:10.1016/j.ccr.2014.07.001
11. Karin M, Kim JY. MASH as an emerging cause of hepatocellular carcinoma: current knowledge and future perspectives. Mol Oncol. 2025;19(2):275–294. doi:10.1002/1878-0261.13685
12. Marengo A, Rosso C, Bugianesi E. Liver cancer: connections with obesity, fatty liver, and cirrhosis. Annu Rev Med. 2016;67:103–117. doi:10.1146/annurev-med-090514-013832
13. Nielsen MH, Nøhr-Meldgaard J, Møllerhøj MB, et al. Characterization of six clinical drugs and dietary intervention in the nonobese CDAA-HFD mouse model of MASH and progressive fibrosis. Am J Physiol Gastrointest Liver Physiol. 2025;328(1):G51–g71. doi:10.1152/ajpgi.00110.2024
14. Boycott C, Beetch M, Yang T, et al. Epigenetic aberrations of gene expression in a rat model of hepatocellular carcinoma. Epigenetics. 2022;17(11):1513–1534. doi:10.1080/15592294.2022.2069386
15. Kodama T, Yi J, Newberg JY, et al. Molecular profiling of nonalcoholic fatty liver disease-associated hepatocellular carcinoma using SB transposon mutagenesis. Proc Natl Acad Sci U S A. 2018;115(44):E10417–e10426. doi:10.1073/pnas.1808968115
16. Murugan AK, Grieco M, Tsuchida N. RAS mutations in human cancers: roles in precision medicine. Semin Cancer Biol. 2019;59:23–35. doi:10.1016/j.semcancer.2019.06.007
17. Parker JA, Mattos C. The K-Ras, N-Ras, and H-Ras isoforms: unique conformational preferences and implications for targeting oncogenic mutants. Cold Spring Harb Perspect Med. 2018;8(8):a031427. doi:10.1101/cshperspect.a031427
18. Mandalà M, Merelli B, Massi D. Nras in melanoma: targeting the undruggable target. Crit Rev Oncol Hematol. 2014;92(2):107–122. doi:10.1016/j.critrevonc.2014.05.005
19. Prior IA, Lewis PD, Mattos C. A comprehensive survey of Ras mutations in cancer. Cancer Res. 2012;72(10):2457–2467. doi:10.1158/0008-5472.CAN-11-2612
20. Yu S, Vernia S. A transposon-based mouse model of hepatocellular carcinoma via hydrodynamic tail vein injection. Methods Mol Biol. 2020;2164:129–143.
21. Zhang H, Su X, Burley SK, et al. mTOR regulates aerobic glycolysis through NEAT1 and nuclear paraspeckle-mediated mechanism in hepatocellular carcinoma. Theranostics. 2022;12(7):3518–3533. doi:10.7150/thno.72581
22. Hsieh MH, Wei Y, Li L, et al. Liver cancer initiation requires translational activation by an oncofetal regulon involving LIN28 proteins. J Clin Invest. 2024;134(15). doi:10.1172/JCI165734.
23. Glaviano A, Foo AS, Lam HY, et al. PI3K/AKT/mTOR signaling transduction pathway and targeted therapies in cancer. Mol Cancer. 2023;22(1):138.
24. Manning BD, Toker A. AKT/PKB Signaling: navigating the Network. Cell. 2017;169(3):381–405. doi:10.1016/j.cell.2017.04.001
25. Bu L, Zhang Z, Chen J, et al. High-fat diet promotes liver tumorigenesis via palmitoylation and activation of AKT. Gut. 2024;73(7):1156–1168. doi:10.1136/gutjnl-2023-330826
26. Lee SA, Ho C, Roy R, et al. Integration of genomic analysis and in vivo transfection to identify sprouty 2 as a candidate tumor suppressor in liver cancer. Hepatology. 2008;47(4):1200–1210. doi:10.1002/hep.22169
27. Carlson CM, Frandsen JL, Kirchhof N, et al. Somatic integration of an oncogene-harboring Sleeping Beauty transposon models liver tumor development in the mouse. Proc Natl Acad Sci U S A. 2005;102(47):17059–17064. doi:10.1073/pnas.0502974102
28. Farrell G, Schattenberg JM, Leclercq I, et al. Mouse models of nonalcoholic steatohepatitis: toward optimization of their relevance to human nonalcoholic steatohepatitis. Hepatology. 2019;69(5):2241–2257. doi:10.1002/hep.30333
29. Huang Y, Xie Y, Zhang Y, et al. Single-cell transcriptome reveals the reprogramming of immune microenvironment during the transition from MASH to HCC. Mol Cancer. 2025;24(1):177. doi:10.1186/s12943-025-02370-2
30. Leslie J, Krishnamurthy KA, Gopalsamy IK, et al. Metabolic dysfunction-associated steatotic liver disease and steatohepatitis-associated hepatocarcinoma preclinical models. Nat Rev Gastroenterol Hepatol. 2026;23(4):286–317. doi:10.1038/s41575-025-01162-9
31. Cui G, Zhou Y, Liao W, et al. Inhibition of GSK3 and TSC2 mediates the oncogenic activity of AKT in hepatocellular carcinoma. Cancer Res. 2025;85(24):5049–5065. doi:10.1158/0008-5472.CAN-25-1615
32. Pan Q, Wang X, Li B, et al. ScRNA-seq reveals dynamic macrophage heterogeneity in chronic liver disease progression and prognostic biomarkers KLF2/SPP1 in HCC. Front Immunol. 2026;17:1766301. doi:10.3389/fimmu.2026.1766301
33. Chen P, Geng H, Ma B, et al. Integrating spatial omics and single-cell mass spectrometry imaging reveals tumor-host metabolic interplay in hepatocellular carcinoma. Proc Natl Acad Sci U S A. 2025;122(31):e2505789122. doi:10.1073/pnas.2505789122
 © 2026 The Author(s). This work is published and licensed by Dove Medical Press Limited. The
full terms of this license are available at https://www.dovepress.com/terms
and incorporate the Creative Commons Attribution
- Non Commercial (unported, 4.0) License.
By accessing the work you hereby accept the Terms. Non-commercial uses of the work are permitted
without any further permission from Dove Medical Press Limited, provided the work is properly
attributed. For permission for commercial use of this work, please see paragraphs 4.2 and 5 of our Terms.
© 2026 The Author(s). This work is published and licensed by Dove Medical Press Limited. The
full terms of this license are available at https://www.dovepress.com/terms
and incorporate the Creative Commons Attribution
- Non Commercial (unported, 4.0) License.
By accessing the work you hereby accept the Terms. Non-commercial uses of the work are permitted
without any further permission from Dove Medical Press Limited, provided the work is properly
attributed. For permission for commercial use of this work, please see paragraphs 4.2 and 5 of our Terms.