Back to Journals » ClinicoEconomics and Outcomes Research » Volume 17
A Method for Adjusting EQ-5D-3L Health State Utilities for Cross-Country Use: Application of a Novel US-to-UK Utility Mapping Approach
Authors Omar Alsaleh AJ, Msihid J ![]() , Lew E, Nicholls C
, Lew E, Nicholls C
Received 29 April 2025
Accepted for publication 8 October 2025
Published 4 November 2025 Volume 2025:17 Pages 797—808
DOI https://doi.org/10.2147/CEOR.S532010
Checked for plagiarism Yes
Review by Single anonymous peer review
Peer reviewer comments 2
Editor who approved publication: Prof. Dr. Dean Smith
Abdul Jabbar Omar Alsaleh,1 Jerome Msihid,2 Elisheva Lew,3 Charlie Nicholls4
1Health Economics and Value Assessment, Sanofi, Milan, Italy; 2Health Economics and Value Assessment, Sanofi, Gentilly, France; 3Health Economics and Value Assessment, Sanofi, Paris, France; 4Health Economics and Value Assessment, Sanofi, Reading, Berkshire, UK
Correspondence: Abdul Jabbar Omar Alsaleh, Health Economics and Value Assessment, Sanofi, Viale Luigi Bodi, 37/b, Milan, 20158, Italy, Tel +39 344 023 74 53, Email [email protected]
Purpose: The EuroQoL-five dimensions-three levels (EQ-5D-3L) utility values vary across regions, hence become non-interchangeable. This study details a methodology to adjust EQ-5D-3L utility values from the published United States (US) scores for use in the United Kingdom (UK) when individual-level patient data (IPD) are inaccessible.
Methods: Linear and polynomial regression models were fitted to map the US-derived EQ-5D-3L health state utility weights (HSUWs) into UK values. Model fit was evaluated via visual inspection and coefficient of determination (R2). The best-fit model was used to develop a utility-adjustment algorithm. Data for external validation of the algorithm were collected through a targeted literature review, which identified studies reporting mean EQ-5D-3L utilities from both the US and UK. The coefficients of the best-fit model were validated against the published mean US and UK utilities, and the algorithm was validated by comparing published and predicted mean UK utilities.
Results: The linear model confirmed linearity between US and UK HSUWs, and was the best-fit over the polynomial model, both visually and with R2 (0.9574 vs 0.9576). Eleven publications (N = 93,625 participants) reporting the mean US and UK EQ-5D-3L utilities based on the valuation of EQ-5D-3L responses were included for validation. The linearity between the published mean US and UK EQ-5D-3L utilities was deemed valid (R2 = 0.9955) with similar slopes (1.45 vs 1.39) and intercepts (− 0.43 vs − 0.38) between the linear model and the published utility-based line. The algorithm (UtilityUK = [− 0.3813 + 1.3904 × UtilityUS]) predicted the mean UK utilities, which marginally differed from the reported mean UK utilities, confirming its validity.
Conclusion: A robust method was developed to adjust US-derived EQ-5D-3L utilities and reflect UK preferences. This method helps predict and transpose utilities from the literature across countries as a supporting tool when IPD are unavailable, which is necessary when adapting cost-effectiveness models to different settings.
Keywords: EQ-5D-3L, health utility, transferability, United Kingdom, United States, utility weight adjustment
Introduction
The EuroQoL-five dimensions (EQ-5D) questionnaire is a generic preference-based instrument designed to measure the health status of individuals ≥16 years of age in clinical trials, population studies, and real-world clinical settings.1 EQ-5D is the most widely recommended multi-attribute utility instrument by health technology assessment bodies and pharmacoeconomic guidelines internationally for cost-utility analysis.2,3 This tool quantifies individuals’ health utilities by assessing the five dimensions of health status, that is, mobility, self-care, usual activities, pain/discomfort, and anxiety/depression. Each dimension is rated on a three-level scale (no problems, some problems, and extreme problems) for the EQ-5D-3L version.4 A unique health state is defined by combining one level from each of the five dimensions, totaling 243 (35) health states. Each health state is assigned a specific health state utility weight (HSUW), also referred to as a tariff or utility score. These states reflect the preferences of the general population and are evaluated using various valuation strategies, including time trade-off techniques, population-based surveys, and discrete choice experiments. These value sets are available in several countries.5
Variability in HSUWs across various regions reflects differences in health state preferences, individual perceptions of health-related quality of life (HRQoL), and cultures, as the country-specific valuation sets usually reflect local preferences.6 These variations can lead to significant differences in quality-adjusted life years and incremental cost-effectiveness ratios, influencing both clinical and health policy decision-making.7,8 Thus, applying utilities derived from EQ-5D-3L responses interchangeably between countries in economic evaluations without appropriate adjustments can lead to misinterpretations of health states and affect cost-effectiveness outcomes, potentially resulting in incorrect decision-making.9 Leveraging country-specific tariffs to evaluate the existing or published EQ-5D-3L responses can augment the cross-country utilities transferability.
Reinforcing this, the guidelines from the National Institute for Health and Care Excellence (NICE)10 and the Professional Society for Health Economics and Outcomes Research (ISPOR)11 recommend avoiding the direct transfer of mean utilities from one country to another without adjustments because of the potential inaccuracies. Studies have identified notable differences between the EQ-5D-3L utility scores of the United Kingdom (UK) and the United States (US) populations, attributed to distinct health preferences and transformation methods for handling negative values.12,13 Variations in value transformation methodologies and the application of regression models exacerbate these differences, which can affect the outcomes of a cost-effectiveness analysis.14 Despite the NICE10 and ISPOR recommendations,11 there is currently no standard method for making such adjustments, which highlights the need for a reliable method to adjust the utility estimates between countries for making accurate cross-country predictions.4
Thus, a theoretical framework, drawn from cross-cultural health valuation research, posits that systematic adjustment models are required to account for heterogeneity in societal preferences and valuation structures. This framework justifies the focus on the US and UK, given their widespread tariff use and discrepancies in utility estimates,12,13 thereby providing an ideal case to test the robustness of adjustment approaches. Despite individual-level patient data (IPD) being the gold standard for cross-country utility adjustments,15 it is rarely available due to restricted access across jurisdictions. This lack of access creates a critical methodological gap and reinforces the need for robust utility adjustment models that can generate country-specific predictions from published aggregate-level data. Therefore, a robust method for adjusting mean utilities in economic evaluations is necessary to enhance cross-country utility transferability.
Given the feasibility of two EQ-5D versions, NICE recommended the EQ-5D-3L version over the 5L version for economic evaluations, primarily because of the availability of well-established valuation sets, making it explicitly endorsed for reference-case analyses.16–18 Building on this background, the current study aimed to develop a robust regression-based model and an algorithm to adjust mean EQ-5D-3L utilities derived from the published US utility data obtained through a targeted literature review (TLR) to predict the mean UK utilities in the absence of accessible IPD. Additionally, the study aimed to test the performance of the US to predict UK EQ-5D-3L scores by comparing the simulated results with those reported in the literature.
Methods
A brief methodology for estimating the mean EQ-5D-3L utility values from the US to the UK, encompassing the data preprocessing and algorithm development steps, is illustrated in Figure 1.
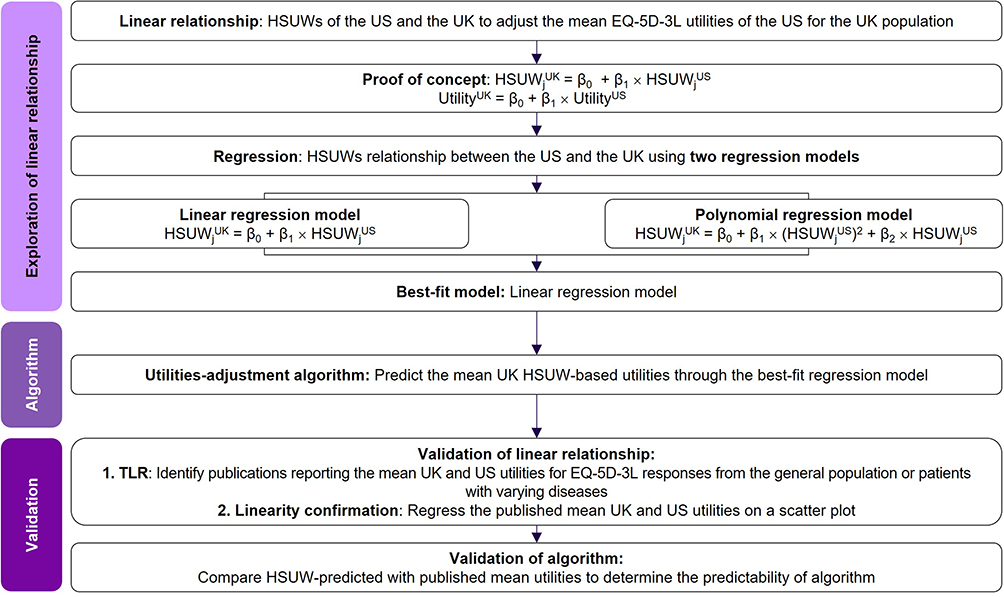 |
Figure 1 Flowchart depicting the steps for estimating the mean EQ-5D-3L utility values for the United Kingdom from those of the United States. Abbreviations: EQ-5D-3L, EuroQoL five-dimensions three-levels; HSUW, health state utility weight; j, health states from 1 to 243; n, total sample size; TLR, targeted literature review; UK, United Kingdom; US, United States; β0, slope; β1, intercept; β2, coefficient of quadratic term. |
Proof of Concept for Adjusting EQ-5D-3L Mean Utilities
The following proof of concept establishing a linear relationship between the EQ-5D-3L HSUWs of the UK17 and US18 was assumed to adjust the mean EQ-5D-3L utilities of the US to reflect the preferences of the UK population:

where HSUWjUK and HSUWjUS indicate the HSUWs for EQ-5D-3L in the UK and US populations, respectively. β0 is the intercept, β1 is the regression coefficient for the US utility weights, and index j indicates the health states from 1 to 243.
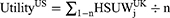
The mean utility of a specific condition in the US population (UtilityUS) is given by the following:

where UtilityUS indicates the mean utility in the US, and n refers to the total sample size.
Similarly, the mean utility of the same condition in the UK population (UtilityUK) is given by the following:
where UtilityUK indicates the mean utility in the UK and n refers to the total sample size.
Substituting Equation 1 into Equation 3 yields:

By rearranging Equation 4,

and simplifying further by incorporating Equation 2 into Equation 5, the following mathematical equation can predict the mean UK utility value from the mean US utility value:

Regression models were established using the UK16 and US17 HSUW sets as the dependent and independent variables, respectively. Two regression models via an ordinary least squares (OLS) linear regression model (Equation 7) and a polynomial regression model (Equation 8) were developed to establish an algorithm that predicts the mean UK utility from the mean US utility.
The UK and US HSUW sets were incorporated into the derived mathematical equation (Equation 1), and the respective regression models used to develop the HSUW-based algorithm are as follows:


where index j indicates the health state (j = 1–243 EQ-5D-3L states). HSUWjUK and HSUWjUS indicate the EQ-5D-3L utility weights for the UK and US populations, respectively. β0 is the intercept, β1 is the regression coefficient for the US utility weights, and β2 is the coefficient for the quadratic term. The non-linear model aimed to refine the prediction further by incorporating a quadratic term to account for the curvature.
Development of an Algorithm
The utilities adjustment algorithm, which predicted the mean UK utilities using the HSUW value set, was developed by incorporating the slope and intercept values of the best-fit regression model into Equation 6, in case of a linear relationship. In the absence of a linear relationship, a non-linear adjustment approach will be applied to account for the non-linearity in utility adjustments.19
Method Validation
Targeted Literature Search
An electronic search was conducted on March 5, 2023, using medical databases, including PubMed, EMBASE, and Google Scholar. To ensure relevance, inclusion criteria were defined using a structured population, intervention, comparator, outcomes, and study design (PICOS) framework. The studies were eligible if they involved any patient population or general population samples with varying disease conditions across different geographies and reported mean utilities based on the UK and US EQ-5D-3L response scores. No restrictions were applied on disease area, time period, intervention, and comparator to ensure inclusivity of all relevant publications from their inception to the date of search (March 5, 2023); however, the search was limited to the inclusion of the studies published in English. The publications that reported utilities based solely on a single tariff (US or UK), those not employing EQ-5D-3L, or those lacking mean values were excluded. More articles and reference lists were manually screened to identify additional studies that met the eligibility criteria, and duplicate records were removed. Search terms used to identify the relevant literature included “EQ-5D-3L”, “utility weights”, “HSUW”, “health state values”, “health-related quality of life”, “HRQoL”, “US”, “UK”, “United States”, and “United Kingdom”. The search terms were adjusted according to the peculiarities of each database. Relevant publications were included as per the predefined eligibility criteria. For data preprocessing, geographical location, population sample size, study design, and demographics, along with the reported mean utilities were extracted as presented in the included publications, without applying any imputation strategies for the missing data. Data were aggregated at the study level rather than the patient level, and the outliers identified by the studies were also included to avoid selective bias. Data obtained through TLR were utilized to externally validate the model predictions by comparing and assessing the impact of country-specific tariffs on the mean utilities, and they were not used in the development of the algorithm; thus, avoiding the risk of estimate bias. Validation was conducted in the following two stages: internal validation, which used regression diagnostics, and external validation, which used mean utilities extracted from studies identified through TLR.
Validation of the Linear Relationship
Regression models were fitted to examine the relationship between the US and UK utilities. The published US and UK utilities were obtained through a targeted literature search, and a linear relationship was assessed by plotting the published utilities on a scatter plot to confirm the linearity. In cases where non-linearity was suspected, alternative regression specifications were tested to ensure robustness. The following assumptions regarding the published utilities were made: they could be a representative of the broader population samples from which they were collected, and these values could be pooled across disease areas without introducing systematic bias.
Validation of Algorithm
The predictability of the algorithm was validated by comparing the predicted UK utilities, which were obtained by applying the algorithm to the published mean US utilities, against the published mean UK utilities.
Statistical Analysis
The number of observations was presented as aggregated by the health status. The utility dataset retrieved from the publications was presented as mean values. A Fisher’s test was conducted to determine the equality of variances between the two regression models. The data for the regression models were presented as root mean square errors, standard errors, and 95% confidence intervals (95% CIs). A linear relationship between the UK and US EQ-5D-3L HSUWs was observed using a regression equation. The corresponding slope, intercept, and R2 (the coefficient of determination) of the regression equation for both models were presented for a descriptive analysis. The goodness-of-fit for the two regression models was evaluated by visual inspection and R2 statistics to confirm their predictive capabilities. To ensure no systematic deviations, the visual inspection included an analysis of the residual plots by assessing the distribution and pattern of the plots. The R2 statistics were used to measure the proportion of variance in the dependent variable explained by the independent variable(s), providing a quantitative measure of the model fit. Regression models were developed using Stata/SE version 18.0 software (StataCorp LLC, TX, USA), and the level of significance was set at 5%.
Results
Linear Regression Model Analysis
A linear relationship was observed between the HSUWs by regressing the US and UK HSUWs (Figure 2 and Table 1). The scatter plot compared EQ-5D-3L tariffs between the US and the UK for each of the 243 health states. The linear regression model yielded a regression equation (y = 1.3904x – 0.3813; slope [95% CI: 1.3532 to 1.4277], intercept [−0.3974 to −0.3652]). The model demonstrated a strong linear association (R2 = 0.9574) between the UK and US HSUW values (Figure 2 and Table 1).
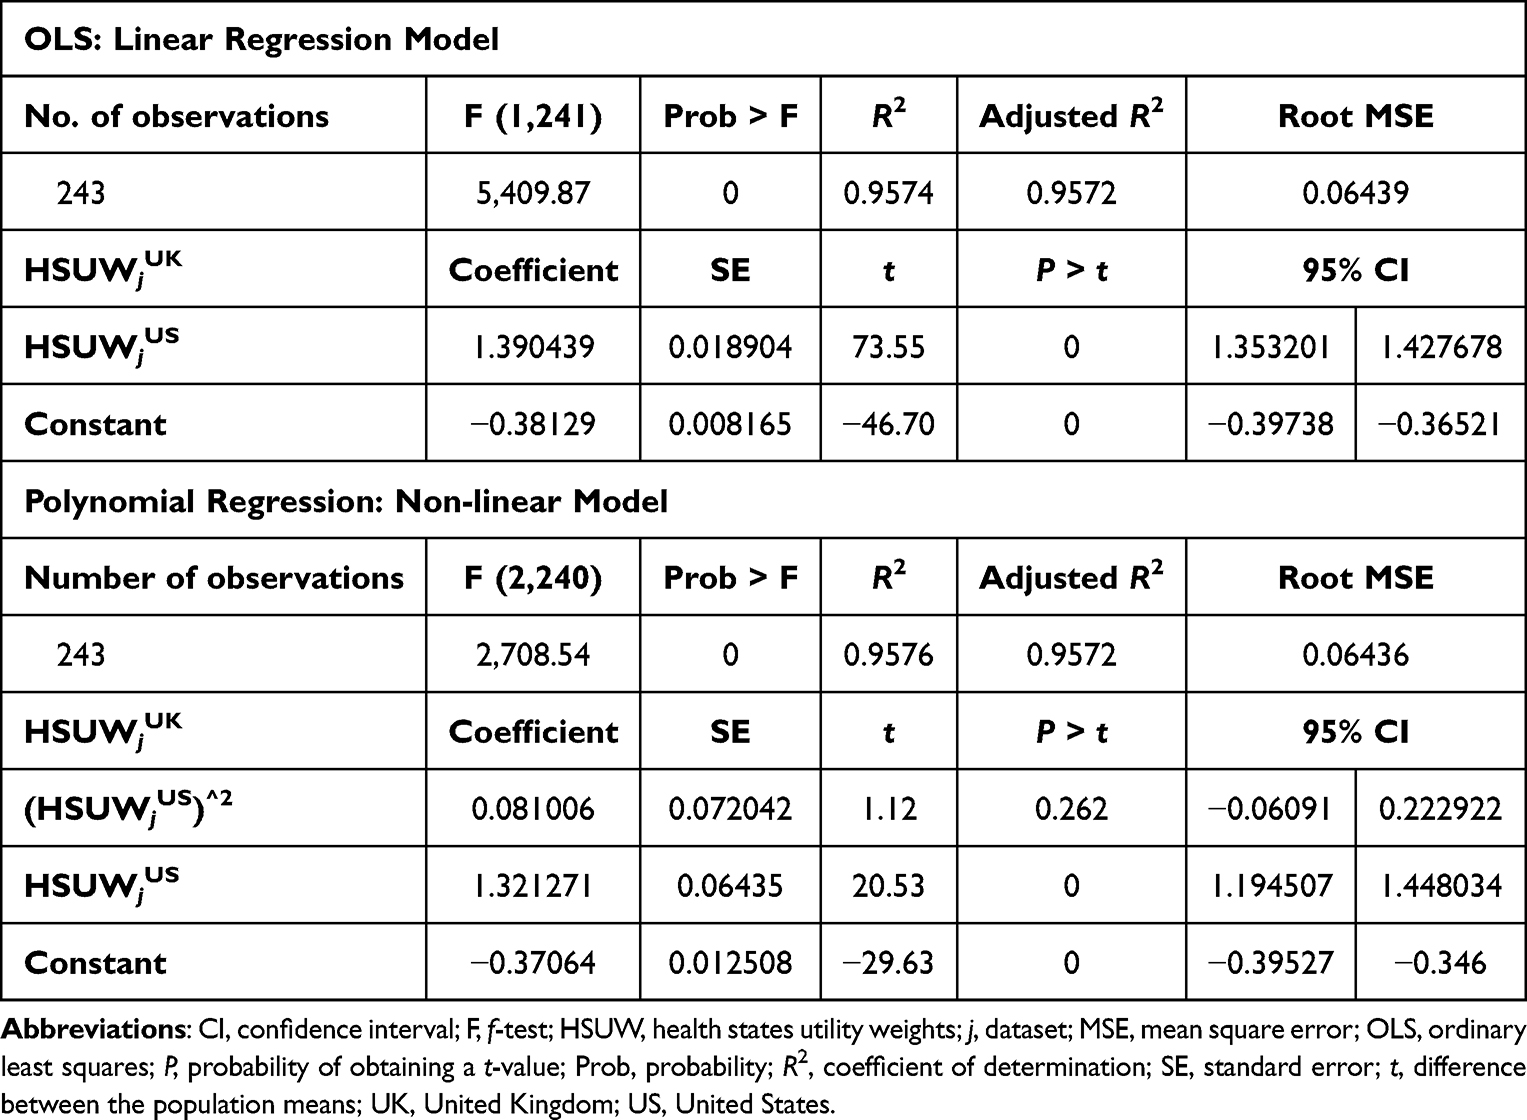 |
Table 1 Comparison of the OLS-Linear and Polynomial Non-Linear Regression Models for Data Fit |
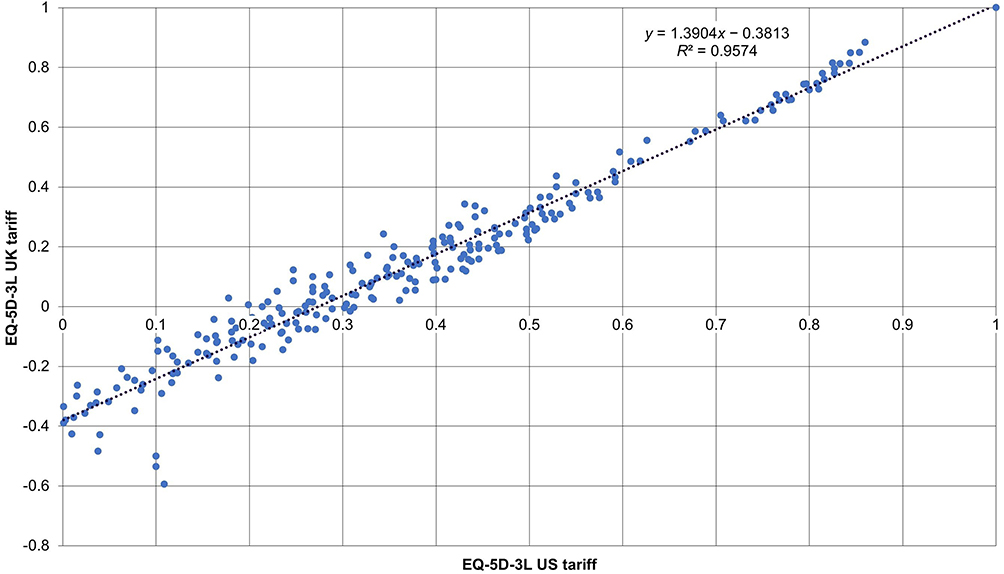 |
Figure 2 Relationship between the EQ-5D-3L US and UK tariffs using a linear regression model. Abbreviations: EQ-5D-3L, EuroQoL five-dimensions three-levels; R2, coefficient of determination; UK, United Kingdom; US, United States. |
Polynomial Regression Model Analysis
The polynomial regression model was estimated simultaneously using EQ-5D-3L tariffs for the US and the UK across 243 health states (Table 1). The regression equation derived from the non-linear model was y = 1.3213x − 0.3706 (slope [95% CI: 1.1945 to 1.4480], intercept [−0.3953 to −0.3460]). The visual inspection and R2 values (0.9574 vs 0.9576, linear vs non-linear models) indicated that the non-linear model did not enhance the linear model and fitted the data as well as the linear model. Further, the estimated coefficient for the polynomial variable in the non-linear model was statistically non-significant (P = 0.262). Consequently, the linear regression model was deemed appropriate, and the best-fit model was compared with the polynomial non-linear model.
Development of an Algorithm
The OLS-linear regression model was determined to be the best-fit model, and its regression equation was used to generate the utility-adjustment HSUW-based algorithm. By incorporating the slope (1.3904) and intercept (−0.3813) values of the linear regression equation into Equation 1, the algorithm can be written as:

Furthermore, the relationship between the HSUWs in both countries was incorporated into Equation 6, alongside the best-fit regression equation, and the mean utility equation is as follows:

The mean utility equation was used to adjust the mean EQ-5D-3L-based utilities in the US to reflect the preferences of the UK population. This algorithm was applied to all the reported mean US utilities; the predicted mean UK utilities are listed in Supplementary Table 1. The differences between the predicted and reported UK HSUWs ranged from −0.033 to 0.089, with an average deviation of 0.0065 (Supplementary Table 1).
Method Validation
Study Characteristics of Included Studies Obtained Through Targeted Literature Search
The targeted literature search resulted in the inclusion of 11 publications (Table 2).8,12,20–28 The included studies were published between 2007 and 2023, with sample sizes ranging from 33 to 55,616. They comprised surveys,12,20,22,23,27 randomized clinical trials,21,24,25 and observational8,28 and cross-sectional studies.26 The present study considered mean utilities obtained from 80,395 patients with varying disease conditions, 12,085 individuals from the rural population and 1,145 individuals from the general population, as reported in the included publications. The included studies reported mean utilities for various health conditions, including congenital malformations;28 Crohn’s disease;12 diabetes mellitus;20,26,27 blood, circulatory system, endocrine, eye, heart, nervous system, and skin disorders;28 human immunodeficiency virus disease;25,28 malignancies;22,28 Parkinson’s disease;24 rheumatoid arthritis8; and viral hepatitis.28 The characteristics of the geographical location, population sample size, study design, and demographics, such as age, gender, and disease condition, were recorded (Table 2).
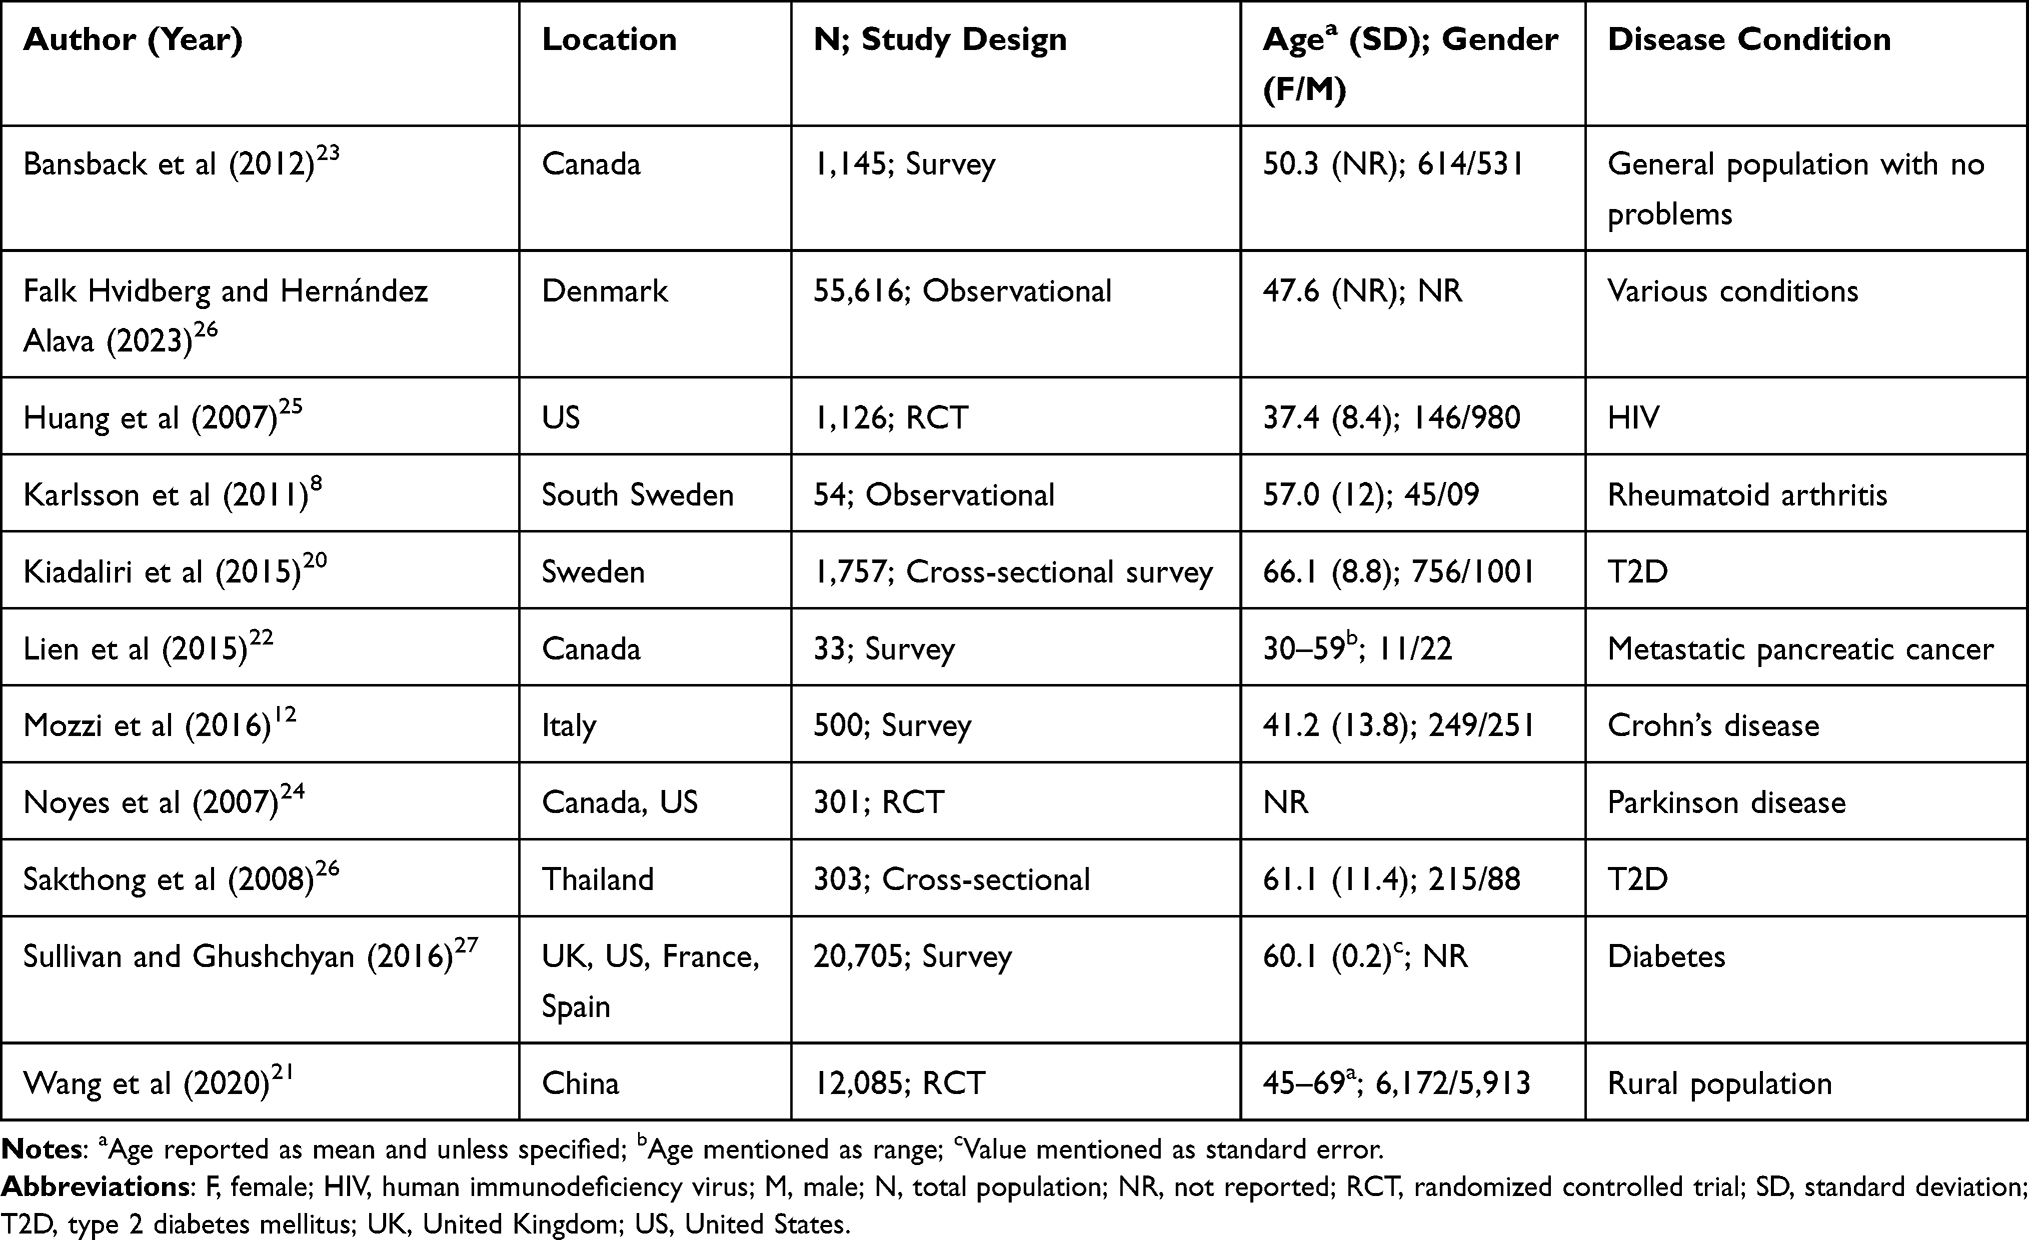 |
Table 2 Characteristics of the Included Publications |
Variations in Published Mean Utility Estimates
The included publications elicited a discrete distribution pattern for the US and UK HSUWs, as shown in the kernel density plot (Supplementary Figure 1). The differences between the published mean US and UK-HSUWs-based utilities ranged from 0.000 to 0.386, with an average deviation of 0.0353 (Supplementary Table 1). For example, Kiadaliri et al (2015)20 reported a 0.060 difference in the mean utilities among patients with type 2 diabetes in Sweden, whereas Sakthong et al (2008)26 reported a comparatively lower difference in the mean utilities (0.050) in patients with type 2 diabetes in Thailand. Variations in utility in patients with the same disease from different regions highlight the necessity for country-specific adjustments to avoid inaccuracies in health economic evaluations. The discrepancy between the mean US- and UK-HSUWs-based utility values underscored the need for adjustments to accurately reflect health state preferences in different countries. Moreover, these studies identified cross-country tariff comparisons as a potential limitation, plausibly due to the presence of substantial and clinically important differences in health state responses. Owing to these differences, the included publications emphasized the importance of country-specific tariffs in elucidating utilities.
Validation of the Linear Relationship
A linear relationship was observed by regressing the reported mean US and UK utilities obtained from the included publications (Figure 3). The scatter plot compares the reported mean US and UK utilities, with each point representing a specific health state. The regression equation obtained from the scatter plot (y = 1.4515x − 0.4278; R2 = 0.9955; slope [95% CI: 1.4371 to 1.4660], intercept [−0.4390 to −0.4166]) showed a strong correlation, indicating a high degree of association between the US and UK tariffs. The slope of the linear regression model was remarkably close to that of the HSUW-based line (1.39 vs 1.45). Similarly, the intercept of this line was remarkably close to the intercept of the HSUW-based line (−0.38 vs −0.43).
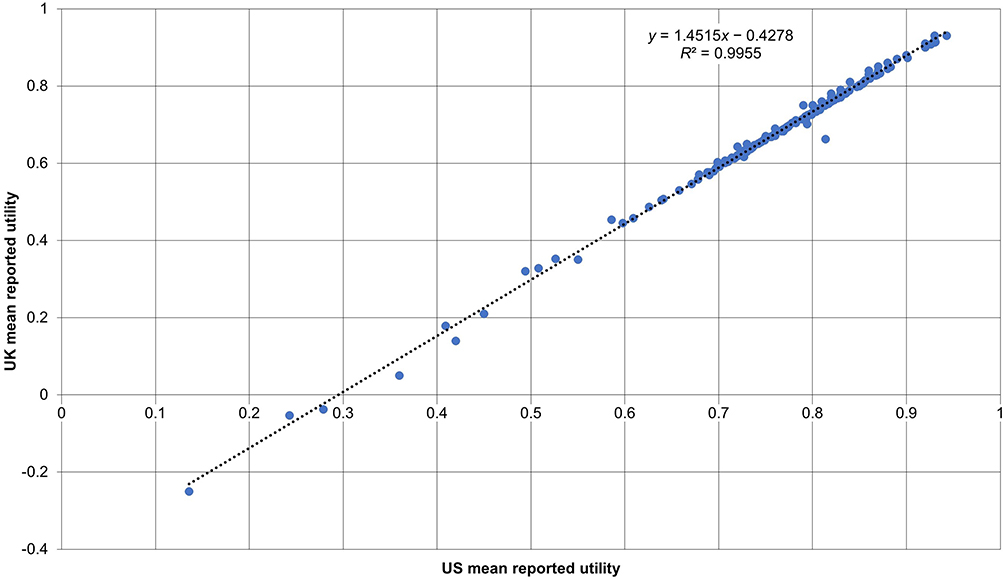 |
Figure 3 Validity of EQ-5D-3L index scores using the UK and US preference weights. Abbreviations: EQ-5D-3L, EuroQoL five-dimensions three-levels; R2, coefficient of determination; UK, United Kingdom; US, United States. |
Validation of Algorithm (Predictability of the Model)
The algorithm was validated using bootstrapping methods, and the published versus predicted utility comparisons are presented in Supplementary Table 1. There was a marginal difference in the average deviation between the predicted mean UK utilities (0.1104) and the reported mean UK utilities (0.1138). Furthermore, the differences between the reported mean US and UK utilities were also marginal when compared with the differences between the US-reported and the UK-predicted mean utilities (average deviation: 0.035 vs 0.031). Similarly, there was a slight difference between the UK-predicted and the UK-reported mean utilities (average deviation: 0.0065). This indicates the robustness and credibility of the developed method to adjust the mean EQ-5D-3L utilities derived from the US data for use in the UK by capturing even the minimal differences. The adjustments accurately predicted the mean utilities, and the health state values were relevant. Thus, the developed algorithm can be used as an alternative model to adjust the mean US utilities to better reflect the UK preferences, particularly in the dearth of IPD.
Discussion
Economic evaluations using the EQ-5D-3L have become a generic patient-reported outcome tool to measure health outcomes, irrespective of the disease condition. One major challenge with EQ-5D-3L-driven HRQoL measures is that the utility values may not be interchangeable between countries or regions because of transferability issues. Despite patients suffering from the same disease, they project varied responses owing to differences in health perspectives and regional preferences, leading to discrete value sets. This often stems from inaccessible IPD and the lack of preference weights. Thus, a method that can adjust the mean utilities between countries while ensuring accurate and reliable value-set transferability is required.
This study is the first to present a comprehensive methodology for adjusting EQ-5D-3L HSUWs derived from the US-published data for use in the UK. The main purpose of this study was to acknowledge and harmonize the inherent differences between health utilities in these two countries and to transpose the US-published utilities within the UK context. Such adjustments are essential to ensure that health economic evaluations reflect accurate and contextually relevant health state valuations, especially when UK-specific IPD are unavailable. The method provides a valid model to predict the mean UK utility values from the mean US utility values and is easy to implement when only aggregated utility values are accessible from the literature. Evidently, the average deviation of the reported mean UK utilities (0.1138) was marginally similar to the predicted mean UK utilities (0.1104), with a slight difference between the predicted and reported mean UK utilities (average deviation: 0.0065). Although negligible, this difference suggests the validity and robustness of the model in predicting accurate and credible mean UK utility values from the mean US utilities available in the literature. The linear regression model showed a strong correlation (R² = 0.9574) between the US and UK HSUWs, and the polynomial non-linear model confirmed this accuracy with a slightly higher R² value (0.9576). The findings of this study demonstrate that the algorithm, which combines the HSUW- and utility-based algorithms, improves the predictive accuracy by eliminating unexplained variations in estimates. The algorithm generated a reliable UK utility value set because it reflected the reported UK utility values accurately, thus enhancing the transferability of utilities between the two countries.
The literature highlights several differences, including varied perspectives and geographical preferences, which impact HSUWs (Supplementary Figure 1). This underscores the importance of adjusting HRQoL measures between countries to prevent misinterpretations of health economic evaluations, which can lead to suboptimal healthcare decisions.4,29,30 A comparative study that analyzed EQ-5D health states between the US and the UK observed that the US population consistently reported higher utility scores than the UK population across 39 of 42 health states (mean difference: 0.11).13 Similar findings were observed in the current study, wherein the reported mean utilities in the included publications indicated differences (mean: 0.083) in the health states between these two countries. Given the significant discrepancies observed in the reported US and UK utilities within the studies included in this research, these utilities cannot be directly interchangeable. This highlights the variation across countries and underscores the necessity of country-specific tariffs. Another study examining value sets across various countries identified that both the direction and magnitude of differences influenced HRQoL measures, indicating the need for country-specific value sets in the evaluation of treatment effects within multi-national clinical trials.31 Oddershede and Petersen (2015) developed a methodology to adjust the mean utilities from the Netherlands, Germany, and Spain to align with the UK preferences.9 Further, a recent study predicted Danish EQ-5D-5L utilities from patient-level UK EQ-5D-3L utility scores across 11 oncology clinical trials using a prediction algorithm.32 Unlike the current study, which used a targeted literature search to identify publications and adjust utilities using equations, the available studies have randomly selected data from publications.9,32 Previous studies leveraged a linear regression model to predict utilities9,32, whereas the current study formulated equations as the proof of concept and two regression models (linear and non-linear) to develop an algorithm that accurately predicted the mean UK utilities. A previous study introduced a systematic bias by allowing the direct interchange of utilities between Spain and the UK.9 In contrast, the present study introduced the algorithm and validated the regression model to best reflect the mean utilities, offering a more reliable approach for adjusting the US-based EQ-5D-3L utility scores to the UK preferences. Furthermore, the data used for predicting Danish EQ-5D-5L utilities were derived from oncology clinical trials, which may limit the applicability of the prediction algorithm to other disease areas.31 The current study leveraged data from multiple disease conditions, geographies, and populations, making the algorithm’s applicability more generalizable to different healthcare settings, as the heterogeneous dataset would better reflect the real-world data. This approach can increase the algorithm’s usefulness in broader health economic evaluations but could also introduce greater variability in predictions, as the utility scores may not follow a consistent pattern across diverse health conditions. Furthermore, as the utility data obtained via the TLR were not leveraged in the development of the utility-adjustment algorithm but were applied only for the validation of the model, the model estimates remained unbiased, strengthening the robustness and external validity of the findings.
Although this study opted to adjust utilities to the UK health preferences from the US data, the same proof of concept or rearrangement of equations could be applied to establish algorithms for adjusting utilities across any geographical region, provided that HSUWs and tariffs are available. The algorithm can be a valuable tool for multi-national clinical trials, as it provides a robust predictive mechanism for estimating country-specific health utilities, particularly when collecting IPD is not feasible. In addition, the model is versatile and applicable in diverse healthcare settings, population health studies, and health technology assessments. Future research and development of a robust methodology to adjust EQ-5D-5L HSUWs for both countries would be recommended, considering the measurement properties of the 5L version are superior to those of the 3L version, only if a reliable and appropriate value set is available.33
A key strength of the present study is the series of equations incorporated in the method development, which considers the multi-level data structure. A robust regression method was developed, and further validation of the algorithm ensured the generation of reliable mean utilities. Furthermore, establishing a linear relationship between the US and UK HSUWs utilizing well-established value sets for respective countries was deemed a valid approach for cross-country utility transposition. This approach helped reduce the bias in the methodology that may have resulted from the direct use of HSUWs of both countries.
Nevertheless, this study has a few limitations. First, it relies on secondary data from various sources, which could potentially lead to inconsistencies in data collection, methodology, or patient demographics. Second, while the algorithm adjusted the utilities for the US and UK populations, residual cultural variations might have impacted the outcomes. Third, a few value sets from the publications included in this study were quite old, questioning whether the insights elicited a decade ago could still represent the current perspectives and treatment patterns of the population. Furthermore, the algorithm developed in this study might not show a similar relationship for other value sets, as observed for the UK population.
Conclusion
This study developed and validated a method for adjusting the US-derived EQ-5D-3L utilities for the UK-based assessments. The method demonstrated a high predictive accuracy across various patient populations using both linear and polynomial regression models. The results reinforce the need for culturally adjusted models to ensure that health economic evaluations accurately represent region-specific HRQoL preferences, ultimately supporting better decision-making in healthcare policy and practice. Given that IPD remains the gold standard for utility estimation, this method should therefore be viewed as a pragmatic supporting tool rather than a substitute for IPD and should be utilized when accessibility to IPD is not feasible. This method can be applied to other settings and countries beyond the UK, allowing the adaptation of this method across different geographies as well, especially when access to IPD is limited, provided that established country-specific value sets are available.
Abbreviations
CI, Confidence Interval; EQ-5D-3L, EuroQoL five-dimensions three-levels; EQ-5D-5L, EuroQoL five-dimensions five-levels; HRQoL, Health-Related Quality of Life; HSUW, Health State Utility Weights; IPD, Individual-level Patient Data; ISPOR, Professional Society for Health Economics and Outcomes Research; NICE, National Institute for Health and Care Excellence; UK, United Kingdom; US, United States.
Data Sharing Statement
All data generated or analyzed during this study are available within the main manuscript and supplementary materials.
Ethics Approval
None required as this study involves information available from the published studies.
Acknowledgments
The authors acknowledge Paulo Carita, an employee of Sanofi, Gentilly, France, and Sergio Londono, an employee of Sanofi, Bogotá, Colombia, for their critical and valuable review of the manuscript. Medical writing support for the development of this manuscript, under the direction of the authors, was provided by Keerthana Diyya and Amit Kandhare from Sanofi, India, in accordance with the Good Publication Practice guidelines.
Author Contributions
All authors made a significant contribution to the work reported, whether that is in the conception, study design, execution, acquisition of data, analysis and interpretation, or in all these areas; took part in drafting, revising or critically reviewing the article; gave final approval of the version to be published; have agreed on the journal to which the article has been submitted; and agree to be accountable for all aspects of the work.
Consent for Publication
All the authors have given their consent for the publication of this study.
Funding
This study was funded by Sanofi. The authors are employed by the funder of the study.
Disclosure
AJOA, JM, EL, and CJN are employees of Sanofi and may hold stocks and/or stock options in the company. The authors report no other conflicts of interest in this work.
References
1. EuroQol research foundation [homepage on the internet]. EQ-5D-5L user guide. Available from: https://euroqol.org/publications/user-guides.
2. Longworth L, Yang Y, Young T, et al. Use of generic and condition-specific measures of health-related quality of life in NICE decision-making: a systematic review, statistical modelling and survey. Health Technol Assess. 2014;18(9):1–224. doi:10.3310/hta18090
3. Kennedy-Martin M, Slaap B, Herdman M, et al. Which multi-attribute utility instruments are recommended for use in cost-utility analysis? A review of national health technology assessment (HTA) guidelines. Eur J Health Econ. 2020;21(8):1245–1257. doi:10.1007/s10198-020-01195-8
4. Devlin NJ, Brooks R. EQ-5D and the euroqol group: past, present and future. Appl Health Econ Health Policy. 2017;15(2):127–137. doi:10.1007/s40258-017-0310-5
5. Balestroni G, Bertolotti G. EuroQol-5D (EQ-5D): an instrument for measuring quality of life]. Monaldi Arch Chest Dis. 2012;78(3):155–159. doi:10.4081/monaldi.2012.121
6. Roudijk B, Donders ART, Stalmeier PFM. Cultural values group.cultural values: can they explain differences in health utilities between countries? Med Decis Making. 2019;39(5):605–616. doi:10.1177/0272989X19841587
7. Noyes J, Edwards RT. EQ-5D for the assessment of health-related quality of life and resource allocation in children: a systematic methodological review. Value Health. 2011;14(8):1117–1129. doi:10.1016/j.jval.2011.07.011
8. Karlsson JA, Nilsson JA, Neovius M, et al. National EQ-5D tariffs and quality-adjusted life-year estimation: comparison of UK, US and Danish utilities in south Swedish rheumatoid arthritis patients. Ann Rheum Dis. 2011;70(12):2163–2166. doi:10.1136/ard.2011.153437
9. Oddershede L, Petersen KD. Adjustment of foreign EQ-5D-3L utilities can increase their transferability. Clinicoecon Outcomes Res. 2015;7:629–636. doi:10.2147/CEOR.S93280
10. National Institute for Health and Care Excellence [homepage on the Internet]. NICE health technology evaluations: the manual. Available from: https://www.nice.org.uk/process/pmg36.
11. International Society for Pharmacoeconomics and Outcomes Research, Inc. [homepage on the Internet]. All Economic Evaluation Reports. Available from: https://www.ispor.org/heor-resources/good-practices/economic-evaluation.
12. Mozzi A, Meregaglia M, Lazzaro C, Tornatore V, Belfiglio M, Fattore G. A comparison of EuroQol 5-Dimension health-related utilities using Italian, UK, and US preference weights in a patient sample. Clinicoecon Outcomes Res. 2016;8:267–274. doi:10.2147/CEOR.S98226
13. Johnson JA, Luo N, Shaw JW, Kind P, Coons SJ. Valuations of EQ-5D health states: are the United States and United Kingdom different? Med Care. 2005;43(3):221–228. doi:10.1097/00005650-200503000-00004
14. Augestad LA, Rand-Hendriksen K, Kristiansen IS, Stavem K. Impact of transformation of negative values and regression models on differences between the UK and US EQ-5D time trade-off value sets. Pharmacoeconomics. 2012;30(12):1203–1214. doi:10.2165/11595420-000000000-00000
15. Remiro-Azócar A, Heath A, Baio G. Methods for population adjustment with limited access to individual patient data: a review and simulation study. Res Synth Methods. 2021. 12(6):750–775. doi:10.1002/jrsm.1511
16. National Institute for Health and Care Excellence [homepage on the Internet]. Position statement on use of the EQ-5D-5L value set for England. Available from: https://www.nice.org.uk/position-statements/position-statement-on-use-of-the-eq-5d-5l-value-set-for-england-updated-october-2019.
17. Dolan P. Modeling valuations for EuroQol health states. Med Care. 1997;35(11):1095–1108. doi:10.1097/00005650-199711000-00002
18. Shaw JW, Johnson JA, Coons SJ. US valuation of the EQ-5D health states: development and testing of the D1 valuation model. Med Care. 2005;43(3):203–220. doi:10.1097/00005650-200503000-00003
19. Omar AAJ. POSB299 A New method for adjusting health state utilities to increase their transferability from UK to Italy. Value Health. 2021;25(1):S202. doi:10.1016/j.jval.2021.11.983
20. Kiadaliri AA, Eliasson B, Gerdtham UG. Does the choice of EQ-5D tariff matter? A comparison of the Swedish EQ-5D-3L index score with UK, US, Germany and Denmark among type 2 diabetes patients. Health Qual Life Outcomes. 2015;13:145. doi:10.1186/s12955-015-0344-z
21. Wang H, Cao C, Guo C, et al. An evaluation of EQ-5D-3L health utility scores using five country-specific tariffs in a rural population aged 45-69 years in Hua county, Henan province, China. Health Qual Life Outcomes. 2020;18(1):228. doi:10.1186/s12955-020-01476-z
22. Lien K, Tam VC, Ko YJ, Mittmann N, Cheung MC, Chan KK. Impact of country-specific EQ-5D-3L tariffs on the economic value of systemic therapies used in the treatment of metastatic pancreatic cancer. Curr Oncol. 2015;22(6):e443–52. doi:10.3747/co.22.2592
23. Bansback N, Tsuchiya A, Brazier J, Anis A. Canadian valuation of EQ-5D health states: preliminary value set and considerations for future valuation studies. PLoS One. 2012;7(2):e31115. doi:10.1371/journal.pone.0031115
24. Noyes K, Dick AW, Holloway RG. The implications of using US-specific EQ-5D preference weights for cost-effectiveness evaluation. Med Decis Making. 2007;27(3):327–334. doi:10.1177/0272989X07301822
25. Huang IC, Willke RJ, Atkinson MJ, Lenderking WR, Frangakis C, Wu AW. US and UK versions of the EQ-5D preference weights: does choice of preference weights make a difference? Qual Life Res. 2007;16(6):1065–1072. doi:10.1007/s11136-007-9206-4
26. Sakthong P, Charoenvisuthiwongs R, Shabunthom R. A comparison of EQ-5D index scores using the UK, US, and Japan preference weights in a Thai sample with type 2 diabetes. Health Qual Life Outcomes. 2008;6:71. doi:10.1186/1477-7525-6-71
27. Sullivan PW, Ghushchyan VH. EQ-5D scores for diabetes-related comorbidities. Value Health. 2016;19(8):1002–1008. doi:10.1016/j.jval.2016.05.018
28. Falk Hvidberg M, Hernandez AM. Catalogues of EQ-5D-3L health-related quality of life scores for 199 chronic conditions and health risks for use in the UK and the USA. Pharmacoeconomics. 2023;41(10):1287–1388. doi:10.1007/s40273-023-01285-4
29. Craig BM, Pickard AS, Rand-Hendriksen K. Do health preferences contradict ordering of EQ-5D labels? Qual Life Res. 2015;24(7):1759–1765. doi:10.1007/s11136-014-0897-z
30. Nan L, Johnson JA, Shaw JW, Coons SJ. A comparison of EQ-5D index scores derived from the US and UK population-based scoring functions. Med Decis Making. 2007;27(3):321–326. doi:10.1177/0272989X07300603
31. Gerlinger C, Bamber L, Leverkus F, et al. Comparing the EQ-5D-5L utility index based on value sets of different countries: impact on the interpretation of clinical study results. BMC Res Notes. 2019;12(1):18. doi:10.1186/s13104-019-4067-9
32. Torkilseng EB, Clarke N, Sopina L, et al. Predicting Danish EQ-5D-5L utilities based on United Kingdom EQ-5D-3L utilities for use in health economic models. Pharmacoecono Open. 2025;9:433–443. doi:10.1007/s41669-025-00562-6
33. Thompson AJ, Turner AJ. A Comparison of the EQ-5D-3L and EQ-5D-5L. Pharmacoeconomics. 2020;38(6):575–591. doi:10.1007/s40273-020-00893-8
 © 2025 The Author(s). This work is published and licensed by Dove Medical Press Limited. The
full terms of this license are available at https://www.dovepress.com/terms
and incorporate the Creative Commons Attribution
- Non Commercial (unported, 4.0) License.
By accessing the work you hereby accept the Terms. Non-commercial uses of the work are permitted
without any further permission from Dove Medical Press Limited, provided the work is properly
attributed. For permission for commercial use of this work, please see paragraphs 4.2 and 5 of our Terms.
© 2025 The Author(s). This work is published and licensed by Dove Medical Press Limited. The
full terms of this license are available at https://www.dovepress.com/terms
and incorporate the Creative Commons Attribution
- Non Commercial (unported, 4.0) License.
By accessing the work you hereby accept the Terms. Non-commercial uses of the work are permitted
without any further permission from Dove Medical Press Limited, provided the work is properly
attributed. For permission for commercial use of this work, please see paragraphs 4.2 and 5 of our Terms.