Back to Journals » International Journal of Nanomedicine » Volume 18
A Macrophages-Enriched Head and Neck Tumor Spheroid Model to Study Foslip® Behavior in Tumor Microenvironment
Authors Francois A, Dirheimer L, Chateau A, Lassalle HP ![]() , Yakavets I
, Yakavets I ![]() , Bezdetnaya L
, Bezdetnaya L
Received 17 July 2023
Accepted for publication 5 October 2023
Published 9 November 2023 Volume 2023:18 Pages 6545—6562
DOI https://doi.org/10.2147/IJN.S427350
Checked for plagiarism Yes
Review by Single anonymous peer review
Peer reviewer comments 3
Editor who approved publication: Prof. Dr. Anderson Oliveira Lobo
Aurélie Francois,1,2 Luca Dirheimer,1,2 Alicia Chateau,2 Henri-Pierre Lassalle,1,2 Ilya Yakavets,3 Lina Bezdetnaya1,2
1Research Department, Institut de Cancérologie de Lorraine, Vandoeuvre-lès-Nancy, France; 2Centre de Recherche en Automatique de Nancy, Centre National de la Recherche Scientifique, UMR 7039, Université de Lorraine, Vandoeuvre-lès-Nancy, France; 3Department of Chemistry, University of Toronto, Toronto, Canada
Correspondence: Lina Bezdetnaya, Research Department, Institut de Cancérologie de Lorraine, 6 avenue de Bourgogne, Vandoeuvre-lès-Nancy, 54519, France, Tel +33-03-8359-8353, Email [email protected]
Purpose: The tumor microenvironment (TME) is composed of various stromal components, including immune cells such as tumor-associated macrophages (TAMs), which play a crucial role in cancer initiation and progression. TAMs can exhibit either a tumor-suppressive M1 or a tumor-promoting M2 phenotype. First, we aimed to develop a 3D human heterotypic model consisting of head and neck squamous cell carcinoma (HNSCC) cells and different subtypes of macrophages to replicate the interactions between immune cells and cancer cells. We further investigated the behavior of Foslip®, a liposomal formulation of temoporfin, using a macrophage-enriched 3D model.
Methods: Monocytes were differentiated into M1 and M2 macrophages, which represent two distinct subtypes. Following histological and molecular characterization, these macrophages were used to establish a 3D spheroid model of HNSCC enriched with either polarized macrophages or conditioned media. Flow cytometry and fluorescence microscopy were used to assess the accumulation and distribution of Foslip®. The cytotoxic effect of Foslip®-mediated photodynamic therapy (PDT) was evaluated using flow cytometry.
Results: We developed heterotypic spheroids characterized by a mixed phenotype of evenly distributed macrophages. In this 3D co-culture model, both M1 and M2 macrophages showed significantly higher accumulation of Foslip® compared to the cancer cells. Although this differential accumulation did not drastically affect the overall PDT efficiency, spheroids generated with conditioned media exhibited a significant enhancement in photo-induced cell death, suggesting that the microenvironment could modulate the response to Foslip®-PDT.
Conclusion: 3D models of HNSCC cells and macrophages provide valuable insights into the complex response of HNSCC cells to PDT using Foslip® in vitro. This model can be used to screen immunomodulatory nanomedicines targeting TAMs in solid head and neck tumors, either alone or in combination with standard therapies.
Keywords: photodynamic therapy, macrophage polarization, Foslip, tumor spheroids, head and neck cancer
Graphical Abstract:

Introduction
The worldwide incidence of Head & Neck Squamous Cell Carcinoma (HNSCC) was estimated at 900,000 new cases and 467,000 deaths in 2020, making it the seventh most common malignant tumor in the world.1 Despite advances in the treatment and understanding of disease biology, the prognosis of patients with HNSCC remains uncertain. One of the major causes of therapy failure is the heterogeneity of the tumor microenvironment (TME), which creates hypoxic and acidic regions, thus affecting sensitivity to anti-cancer treatment. Moreover, the complexity and composition of the TME, along with the intricate interactions between multiple cell types, may have a substantial impact on the biodistribution of therapeutic agents.2
Tumor-associated macrophages (TAMs) are key components of the TME, and are defined as macrophages located in or near the tumor. They can account for up to 50% of the tumor mass and a prominent role in tumor growth, angiogenesis, invasion, and metastasis has been well documented.3–6 Macrophages can be framed into two well-differentiated subpopulations, known as M1 and M2 macrophages. The M1 phenotype is considered to be pro-inflammatory and anti-tumor, whereas the M2 phenotype has immunosuppressive and pro-tumor effects.7 Under the influence of several cytokines such as Interleukin (IL) −4, IL-10, and IL-13, resident M0 macrophages can be polarized into an anti-inflammatory M2 subset, whereas pro-inflammatory M1 macrophage activation occurs in response to IFN-γ, TNF-α, and bacterial components such as lipopolysaccharide (LPS). Macrophage phenotypes are far beyond the simplified M1/M2 classification because cancer cells influence TAMs polarization by releasing cytokines, glucocorticoids, and extracellular matrix components, giving rise to a large spectrum of macrophages with extreme M1 and M2 phenotypes.8,9
In oral squamous cell carcinoma10,11 and to a lesser extent in other head and neck cancer subsites, a high density of TAMs appears to be consistently associated with poor prognosis,7,12,13 mostly because of the functions related to M2 pro-tumoral macrophages.6,14 Therefore, TAMs are anticipated to be promising targets for novel anti-tumor therapeutic strategies by inhibiting the recruitment of TAMs to the tumor,6,14 re-educating TAMs from their M2-like pro-tumoral phenotype to an M1-like anti-tumoral phenotype7,15 or by killing TAMs directly.7,16
Photodynamic therapy (PDT) is a multistage treatment in which cancerous and precancerous cells are destroyed by light activation of a drug (photosensitizer).17 PDT destroys tumor cells via direct cell destruction and indirectly via vascular shutdown and induction of an acute local inflammatory response, resulting in immune system activation.18,19 PDT can provide an excellent option for direct photokilling of TAMs but also for photo-induced shift from M2 to M1.20,21 One of the most potent and clinically accepted photosensitizers is 5,10,15,20-tetrakis(meta-hydroxyphenyl)chlorine (mTHPC, temoporfin). Recently, mTHPC was given a conventional liposomal formulation, termed Foslip®, which considerably improves mTHPC water solubility, facilitates tumor accumulation, and thus has the potential to increase PDT efficiency.22,23 However, to conduct a comprehensive evaluation of the efficacy of Foslip®, it is necessary to use preclinical models that closely resemble the HNSCC microenvironment.
Three-dimensional (3D) cell culture models are commonly used to reproduce the functions and architecture of tissues as closely as possible to the in vivo environment. Multicellular tumor spheroids are widely used in preclinical research because they mimic cell–cell and cell-matrix interactions, allowing them to reproduce TME.24 The use of 3D co-culture models that mimic tumor complexity, architecture, cellular interactions, and infiltrating immune populations is becoming increasingly important, especially with advances in immunotherapy.25–27 We have already optimized the co-culture of 3D spheroids composed of tumor cells and cancer-associated fibroblasts (CAFs).28,29 These heterotypic spheroids were tested for the accumulation, penetration, and repartition of photoactive nanoparticles, aiming to better comprehension of the impact of the stroma on the response to anti-cancer therapies, including PDT.28,30,31
In this study, we established a 3D co-culture HNSCC model enriched with macrophages to accurately mimic the interactions between immune and cancer cells. The model incorporated HNSCC cells (FaDu) along with the human monocyte cell line U937, which differentiated into the M1 and M2 macrophage phenotypes. This model was tested in terms of Foslip® accumulation, penetration, and phototoxicity to gain deeper insight into the influence of macrophage-enriched stroma on Foslip® behavior.
Materials and Methods
Cell Lines
The human pharyngeal squamous carcinoma cell line FaDu and human monocyte cell line U937, derived from histiocytic lymphoma, were purchased from ATCC (Cat. No: ATCC1 HTB-43™). Cells were cultured in phenol red-free Roswell Park Memorial Institute 1640 medium (RPMI-1640, Invitrogen, Carlsbad, California, USA) supplemented with 10% (v/v) heat-inactivated fetal bovine serum (FBS, Sigma-Aldrich, Saint-Quentin Fallavier, France) and 1% (vol/vol) 0.2 M glutamin (Invitrogen, Carlsbad, California, USA). FaDu and U937 cells were maintained in a humidified incubator at 37 °C with 5% CO2 and either reseeded every week (FaDu) or twice per week for U937 cells, to ensure exponential growth.
Polarization of Macrophages
Monocyte Differentiation into Macrophages
Phorbol myristate acetate (PMA) (Sigma-Aldrich, Saint-Quentin Fallavier, France) was used to induce macrophage differentiation. U937 monocytes were plated at a concentration of 2 × 10⁶ cells/mL in a complete RPMI medium in the presence of various PMA concentrations (from 2 to 250 ng/mL) for 24h or 48h, to establish optimal conditions for macrophage differentiation. The medium containing PMA was then removed, cells were washed with Phosphate Buffer Saline Solution (PBS), afterwards fresh complete RPMI medium was added, and cells were maintained in culture for an additional resting period from 0h (M0) to 96h to obtain M0r (M0 + resting time). PMA-differentiated macrophages were harvested using Accutase Cell Dissociation Solution (GIBCO, ThermoFisher, Waltham, MA, USA) for further spheroid generation or by gentle scraping for in vitro characterization experiments. Monocyte differentiation into macrophages was assessed by flow cytometry with forward FCS-A and side-light-scatter SSC-A characteristics-gated events to identify cell populations. Flow cytometry was performed using a BD Accuri C6 Plus flow cytometer (BD Biosciences, Erembodegem, Belgium).
Polarization of Macrophages
Recombinant human IL-4, IL-10, IL-13, interferon-gamma (IFN-γ), and lipopolysaccharide (LPS) from Escherichia coli (Sigma-Aldrich, Saint-Quentin Fallavier, France) were used as polarizing agents. PMA-differentiated macrophages M0 were polarized to the M1 phenotype by treatment with a mixture of LPS (10 ng/mL) and IFN-γ (10 ng/mL) for 48h. For M2-like differentiation, a mixture of IL-4 (25 ng/mL) and IL-10 (25 ng/mL) or IL-4 (25 ng/mL) and IL-13 (20 ng/mL) was added for 72h to M0 macrophages. A schematic representation of PMA-induced U937 cell differentiation into M0 macrophages and their subsequent polarization into M1 and M2 macrophages is shown in Figure 1. The resulting M0, M1, and M2 macrophage populations were used to generate the spheroids.
 |
Figure 1 Polarization of macrophages. Schematic presentation of PMA-induced U937 cell differentiation into M0 macrophages and their subsequent polarization into M1 and M2 macrophages using polarizing agents and tumor-conditioned medium. Abbreviations: CM, conditioned medium; IFN-γ, Interferon-gamma; IL, Interleukin; LPS, Lipopolysaccharides; PMA, Phorbol myristate acetate. |
Stimulation of Macrophage with Conditioned Medium (CM)
FaDu cells (2 × 10⁶ cells) were seeded in 75 cm² flasks and grown to 90% confluence for one week in a complete RPMI medium. The cell medium was collected, centrifuged for 5 min at 300 g to remove tumor cell debris, and frozen at −20°C until further use. M0 macrophages were seeded in the flask containing either complete RPMI medium (supplemented with 10% FBS and 1% glutamine) to generate five days later M0r or a mixture of 50% complete RPMI medium supplemented with 50% of the conditioned medium to generate “M0+CM” during 5 days (37°C; 5% CO2) (Figure 1).
Cytotoxicity of Polarizing Agents by Crystal Violet Assay
U937 cells (4 × 10⁴ cells) were seeded in 96-well plates at various PMA concentrations (2, 20, 50, 100, and 250 ng/mL). After 24h or 48h of incubation with PMA, the cells were rinsed with PBS and incubated with diluted polarizing agents for 48h or 72h or with complete RPMI medium for control samples. At the end of incubation, cells were rinsed, and fixed with 70% ethanol for 10 min, followed by staining with 0.2% crystal violet in 20% ethanol for 15 min. After three washes, acetic acid (0.1% in 50% ethanol) was added to each well and optical density was measured at 540 nm using a microplate reader (Multiskan Ascent; Thermo Fisher Scientific, Waltham, Massachusetts, USA). The absorbance values for each condition were normalized to those of the PMA-differentiated M0 macrophages. PMA alone, at all applied concentrations (2–250 ng/mL), was not cytotoxic; therefore, only two concentrations (50 and 100 ng/mL) were selected for further experiments.
Characterization of 2D Macrophages
Surface Staining Assessed by Flow Cytometry Analysis
To characterize the phenotype transformation of macrophages, immunofluorescence staining was performed with purified mouse anti-human CD80 (Cat#557223) for M1, CD163 (Cat#556017) and CD206 (Cat#555953) for M2, and purified mouse IgG1 isotype control (Cat#555746) (BD Biosciences; Le Pont de Claix, France). To this end, cells were gently scraped and washed with PBS supplemented with 2% FBS. Non-specific Fc Receptor-mediated fluorescent antibody binding was blocked using a BD Pharmingen Human BD Fc Block (Cat#564220, BD Biosciences; Le Pont de Claix, France) for 10 min at room temperature. Cells were then stained with the respective antibody cocktail (prepared in PBS supplemented with 2% FBS) for 45 min. After multiple washes, the cells were incubated with a secondary goat anti-mouse IgG-FITC-conjugated antibody (Sigma-Aldrich, St. Louis, MO, USA) and analyzed by flow cytometry. Fluorescence histograms were derived from gated events with the forward FCS-A and side-light-scattered SSC-A characteristics of viable monocytes and/or macrophages.
Characterization by Immunohistochemistry
For immunohistochemical analysis, M0, M1, and M2 cells were centrifuged (5 min, 200g) and fixed in 4% paraformaldehyde solution for 4h at room temperature. After removing the fixation solution, the pellet was slowly re-suspended in a histogel (Microm Microtech France, Brignais, France) and placed at 4°C for several minutes until stiffness was achieved. The pellet was then subjected to dehydration cycles before paraffin embedding, cut into 6µm thickness sections for HES coloration (Hematoxylin Eosin Safran) with a DAKO CoverStainer (Dako Agilent, Santa Clara, US), and immunohistochemical staining. Immunological staining of CD68 (a marker for total macrophage population) and CD163 markers was performed using the Dako Omnis IHC automate (Dako Agilent, Santa Clara, US) with mouse anti-human CD68 (clone KP1, Dako Omnis Santa Clara, US) and mouse anti-human CD163 (clone 10D6, Clinisciences, Nanterre, France).
Characterization by Quantitative Reverse-Transcription PCR
M0, M1, and M2 macrophages were harvested by scraping after polarization, and total RNA was extracted using an RNeasy Mini Kit (Qiagen, Hilden, Germany) according to the manufacturer’s instructions. RNA was quantified using the Invitrogen Qubit RNA HS Assay Kit (ThermoFisher Scientific, Inc. Waltham, MA, USA). cDNA was synthesized from 1µg of total RNA using an iScript cDNA Synthesis Kit (Bio-Rad, Hercules, CA, USA). cDNA was used as a template to measure the expression of the human CD80, CD163, CD200R, TNF-α, IL-1β, IL-6, IL-8, IL-10, and IL-12 genes using quantitative real-time PCR. Quantitative PCR was performed on a LightCycler® 480 (Roche, Basel, Switzerland) using a LightCycler 480 SYBR Green I Master kit. Primers were purchased from Eurogentec (Seraing, Belgium) and their sequences are listed in Supplementary Table 1. Human β-actin was used as an internal reference gene, and the results were normalized to M0r expression of the selected genes using the standard 2−ddCt method.
3D Experimental Study
Tumor Spheroid Generation
Multicellular tumor spheroids were generated using the liquid overlay technique as previously described.28 Briefly, for homotypic spheroids, 100μL of FaDu cells (5 x 10⁴ cells/mL) and 100 μL of complete RPMI-1640 medium were added to each well of a 96-well plate previously coated with 1% agarose (w/v in water). Co-culture spheroids were obtained by seeding FaDu cells (100μL at 5 × 10⁴ cells/mL) simultaneously with 100μL of polarized macrophages (2, 5, or 10 × 104 cells/mL) at different stages of polarization (M0, M1, or M2) to generate F5M0, F5M1, or F5M2 spheroids five days post-seeding. U937 cells were polarized with 50 or 100 ng/mL PMA for 48h followed by incubation with polarizing agents for 48h and 72h to obtain M1 and M2 macrophages, respectively. For M0-enriched spheroids, macrophages were stimulated with PMA for 48h before co-culture. F5M0 spheroids were cultured in RPMI medium alone or with conditioned media consisting of FaDu supernatant (F5M0 + CM FaDu spheroids) or an appropriate cytokine cocktail (Figure 1) and were termed F5M0 + CM M1 or F5M0 + CM M2 spheroids. Spheroids were then cultured at 37°C (5% CO2) and their morphology and size were monitored from day 3 after seeding until day 10 by bright field microscopy using an inverted Olympus CK2 microscope (Olympus, Rungis, France).
To visualize macrophage distribution within spheroids, the membranes of macrophages were extemporaneously stained with the green fluorescent cell marker PKH67 (Sigma-Aldrich, St. Louis, MO, USA) according to the manufacturer’s instructions. PMA-differentiated and polarized macrophages were harvested using the Accutase Cell Dissociation Solution (GIBCO, ThermoFisher, Waltham, MA, USA). A suspension of 107 macrophages was washed once with a serum-free medium. The cell pellet was gently mixed with PKH67 (4 μM) in the diluent provided by the manufacturer for 10 min in the dark. Labelling was stopped by the addition of two volumes of serum for 2 min and then washed twice in complete medium before co-seeding with FaDu cells into agarose pre-coated plates. The efficiency and stability of membrane staining were checked by flow cytometry until seven days post-seeding.
Histological and Immunohistochemical Characterization of Spheroids
For histological analysis, frozen sections were fixed in a 4% paraformaldehyde solution for 5 min at room temperature. After washing, hematoxylin and eosin (HE) staining was performed using a DAKO CoverStainer (Agilent, Santa Clara, CA, US). For immunohistochemistry, 10µm thick frozen sections were fixed for 5 min in 96% ethanol at room temperature. Immunological staining for Ki-67 was performed using a monoclonal mouse anti-human Ki67 antigen clone Mib1 (Dako Santa Clara, CA, US) on a BechmarkUltra IHC automated Roche (Roche Diagnostics, Rotkreuz, Switzerland).
Foslip® Accumulation in 3D Cells Assessed by Flow Cytometry
Foslip® (a liposomal mTHPC formulation) was kindly provided by biolitec research GmbH (Jena, Germany). A stock solution of Foslip® (1.5 mM) was prepared in water for injection and stored at 4°C in the dark. Four days after spheroid generation, 100 µL of complete medium was carefully removed from the plates, and 100 µL of double-concentrated Foslip® solution prepared in serum-free medium, was added to obtain the final mTHPC concentration 4.5 µM. After 24h incubation with Foslip®, spheroids were washed in serum-free RPMI and used in subsequent procedures. Spheroids were transferred into a 12-well plate, washed with serum-free medium, and further incubated with 0.025% trypsin and 0.01% ethylenediaminetetraacetic acid (GIBCO, ThermoFisher, Waltham, MA, USA) for 25 min under agitation. Trypsinization was stopped by the addition of a 3 mL complete culture medium, and dissociation was completed by vigorous pipetting. The cell suspension was centrifuged at 300 g for 5 min and resuspended in 100 µL serum-free medium before flow cytometry analysis. Flow cytometry was performed using BD Accuri C6 Plus equipped with lasers emitting at 488 and 633 nm. The fluorescence of PKH67-labelled macrophages was detected in the fluorescence channel using a 533 ± 30 nm filter (λexc = 488 nm). Foslip® fluorescence was detected in the fluorescence channel using a 675 ± 25 nm filter (λexc = 633 nm). The mean fluorescence intensity (MFI) was used as a measure of the mean Foslip® uptake in 3D spheroids. The cell populations were discriminated based on Foslip® MFIs and PKH67 staining.
Laser-Scanning Fluorescence Imaging
The kinetics of Foslip® accumulation and its distribution in cells were determined using automated confocal imaging experiments in different co-culture spheroid models. With this aim, homo- and hetero-typic spheroids were generated by seeding cells on ultra-low attachment round-bottom 96-well plates (PrimeSurface®, PHC Europe BV, Avon, France) with an optically clear bottom, which is compatible with high-resolution imaging. After 4–5 days of culturing, spheroids were incubated with Foslip® from 3h to 48h. The fluorescence of PKH67 and Foslip® was recorded using an automated cell imaging system ImageXpress Confocal (Pico, Molecular Devices, UK). Fluorescence images were acquired with a 10X objective, using 543/555 and 631/640 channels for PKH67 and Foslip® fluorescence measurements, respectively. A 150–200 µm Z-stack of images with a 5 µm Z-step was acquired for each well from the spheroid surface to the center. Image processing was performed using the ImageJ software (NIH, USA), and maximum intensity projection (MIP) images were generated for each condition. Based on these images, we calculated Pearson’s correlation coefficients as an indicator of the co-localization of Foslip®- and PKH67-stained macrophages.
Photo-Induced Cell Death
For the photo-induced cell death experiment, spheroids were incubated for 24h with Foslip® at 37°C, rinsed, transferred into 35 mm Petri dishes, and then subjected to irradiation. Irradiation was performed at 652 nm using a Ceralas PDT diode laser (CeramOptec GmbH, Bonn, Germany) at 10, 20, 30, or 40 J/cm2 at a fluence rate of 30mW/cm2. For each type of 3D model, the following controls were performed: “No Light, No Drug” (NL, ND) and “Foslip® only”. Photo-induced toxicity was estimated by flow cytometry analysis of dissociated spheroids 24h post-treatment, and necrotic cells were assessed by propidium iodide (PI) staining (1 µg/mL, BioLegend, San Diego, USA) for 15 min at room temperature. PI fluorescence was detected by flow cytometry in a channel with a 585 ± 40 nm filter (λexc = 488 nm).
Statistical Analysis
Data are reported as mean ± standard error mean (SEM) from at least three independent experiments. Statistical analysis was performed using unpaired two-tailed Student’s t-test for two groups, and one-way analysis of variance (ANOVA) followed by Tukey’s multiple comparisons test was used for comparisons between groups. Data analysis was performed using Origin software (OriginLab, Northampton, MA, USA), with a significance level of p ≤ 0.05.
Results
Morphological Characteristics of U937 Cells Following PMA Differentiation
PMA stimulation induced the adherence of U937 cells to the culture substrate at the lowest PMA concentration (2 ng/mL) and after several minutes of treatment (data not shown). Almost all cells were adherent after 24h or 48h of PMA stimulation, suggesting efficient macrophage differentiation. At the end of the differentiation period (resting time without PMA), macrophages M0r showed evident morphological changes compared with macrophages without resting time (M0) (Figure 2A). At the end of 48h PMA stimulation, monocyte-derived macrophages (M0) were mostly round, lacking cellular projections, while 48h after resting, M0r were more spindle-shaped and had noticeably elongated cell projections (Figure 2A). As previously reported by Daigneault et al32 there are different features of macrophage differentiation, including enhanced granularity, as demonstrated by an increase in side scattering (SSC) on flow cytometry histograms and increased autofluorescence inherent to differentiated macrophages. Our flow cytometry results demonstrated that upon PMA activation, M0r macrophages had increased granularity (SSC), reduced size (FSC), and increased autofluorescence compared to U937 monocytes (Figure 2B), confirming PMA-induced U937 differentiation into macrophages. This differentiation was obvious starting from 20 ng/mL PMA, and the shape of the histograms did not change with increasing PMA concentrations (Figure 2B). Figure 2C shows the percentage of monocyte-derived macrophages as a function of PMA concentration, PMA incubation time, and resting time after PMA stimulation (from days 1 to 4). Macrophage differentiation achieved a plateau from 48h to 96h resting time yielding approximately 80% of activated macrophages, regardless of the initial period of PMA stimulation and PMA concentration.
 |
Figure 2 Morphological changes of PMA-induced macrophage differentiation assessed by optical microscopy and flow cytometry techniques. (A) Representative phase-contrast images of U937 cells alone or after PMA differentiation without resting time (M0) (x100) or with resting time (M0r) (x200). (B) FSC and SSC plots; histograms of autofluorescence of untreated U937 cells or treated with different PMA concentrations. (C) Percentage (%) of macrophages derived from U937 monocyte cells treated with different PMA concentrations and various resting times. Data in (C) are generated from flow cytometry plots in (B) and are representative of at least four independent experiments. ***p < 0.001 using ANOVA analysis with Tukey’s corrections. Abbreviations: PMA, Phorbol myristate acetate; FSC, forward-side light scatter; rest, resting time; SSC, side scatter. |
Phenotype and Characterization of in vitro Generated M1- and M2-Like Macrophages
In our study, the generation of M1 and M2 subsets was induced either by media containing cytokines or by soluble factors produced by tumor cells (tumor-conditioned media, TCM) (Figure 1). M0 macrophages were cultured in the presence of IFN-γ and LPS for 48h to generate M1 macrophages, whereas M2 subtypes were obtained by culturing M0 macrophages in cytokine cocktails with “IL-4 and IL-10” or “IL-4 and IL-13” for 72h. After 72h of polarization, no significant cytotoxicity was observed for M2 polarizing agents, such as IL-4, IL-10, IL-13, or their combination (Supplementary Figure 1). No toxicity was observed even with the use of doubly concentrated solutions and an extended incubation period of up to 96h (data not shown). Additionally, the M1 polarization agent LPS did not induce a significant loss in cell viability (81 ± 17%) after 48h of incubation. In contrast, IFN-γ was more toxic under the same incubation conditions, resulting in 52 ± 9% cell viability, which decreased to 41 ± 5% when combined with LPS after PMA stimulation (Supplementary Figure 1).
At the end of the polarization period, cells were harvested and analyzed for macrophage markers CD68 and CD163 by immunohistochemistry (IHC) (Figure 3A). The surface expression of CD80, CD163, and CD206 was assessed by flow cytometry using fluorescence intensity (Figure 3B) and was normalized to that of M0r macrophages. RT-qPCR analysis was performed to determine CD80, CD163, and CD200R gene expression and to characterize the effector functions of in vitro macrophages (IL-1β, IL-6, IL-8, IL-10, IL-12, and TNF-α) (Figure 3C). CD68 and CD163 are the most frequently used IHC markers to characterize TAMs in patients with head and neck tumors.7,11 Each macrophage subtype displayed a strong expression of the CD68 marker, regardless of the applied stimuli, confirming the differentiation of monocytes to macrophages (Figure 3A). As expected, the expression of CD163 was stronger in M0 and M2 macrophages than in M1 macrophages (Figure 3A). In contrast to IHC analysis, flow cytometry (Figure 3B) and qPCR-based analysis (Figure 3C) demonstrated stronger expression of CD163 and CD200R in the M1 subtype (Figure 3C). CD163 expression, which is typically associated with M2 polarization, was inherent to both groups, consistent with the observation of Bertani et al33 where CD163 was not considered a specific M2 marker. M2 macrophages, specifically those generated by IL-4 and IL-10, exhibited a significantly higher surface expression of CD206 than M1 macrophages (p = 0.0022) (Figure 3B). The M2 macrophage differentiation protocol using a cocktail of IL-4 and IL-10 rather than that with IL-4 and IL-13 was chosen for further experiments.
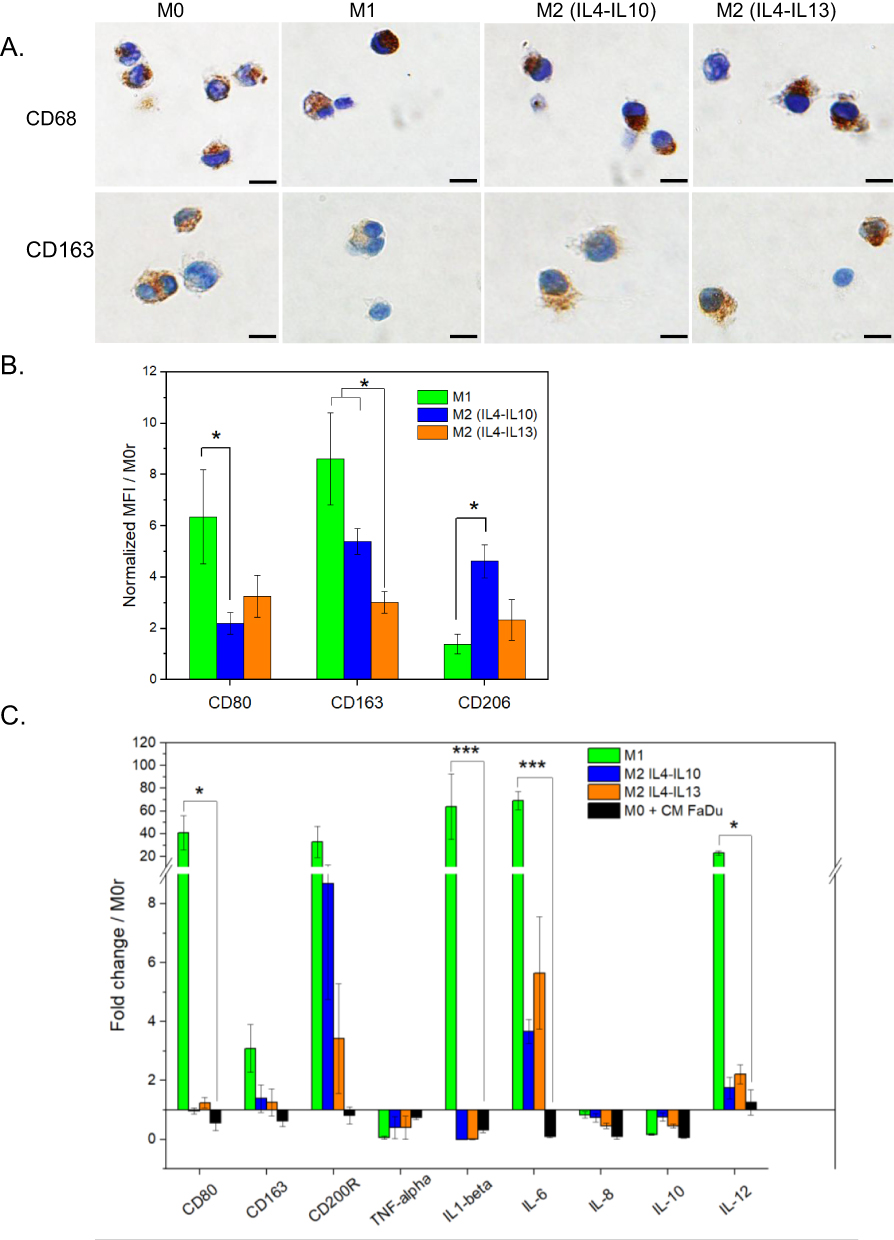 |
Figure 3 Characterization of M0 macrophage polarization into M1 and M2 macrophages. (A) CD68 and CD163 macrophage staining by immunohistochemistry. Scale bar 10 µm. (B) Surface expression of CD80, CD163 and CD206 by flow cytometry analysis. Data were normalized to M0r conditions. (C) Gene expression of macrophages after incubation with Tumor-, M1-, and M2-conditioned media were assessed using RT-qPCR. The data were normalized to the M0r conditions. *p <0.05; ***p < 0.001 using ANOVA analysis with Tukey’s corrections. Abbreviation: CD, cluster of differentiation. |
M1 macrophages displayed stronger CD80 expression than did M2-like macrophages (Figure 3B). In addition, the mRNA expression of CD80, IL1-β, IL-6, and IL-12 was significantly higher in M1 macrophages than in M2 macrophages (p < 0.05), except for TNF-α (Figure 3C). The high expression of pro-inflammatory genes after IFN/LPS polarization suggests that U937 cells are highly responsive to M1 stimulation.
To assess the phenotype of macrophages after incubation with a tumor-conditioned medium (TCM), the expression of macrophage polarization markers was analyzed and compared to that of control M1 and M2 macrophages. The gene expression profile of macrophages cultured in FaDu-derived conditioned medium was more similar to the M2 phenotype (seen by CD163 and CD200R overexpression), but not to the M1 phenotype. Significantly lower gene expression was observed for CD80, IL-1β, IL-6 and IL-12, compared for M1-related genes (p < 0.05, Figure 3C). In addition, we examined the expression levels of IL-8 and IL-10 (Figure 3C). Overall, the expression of all genes was not statistically different from that of M0, ruling out the benefits of tumor-conditioned medium on macrophage polarization.
Spheroids
Growth Kinetic and Histological Characterization
We previously established the experimental protocols for the formation of homotypic FaDu spheroids.28 Here, heterotypic spheroids were generated by seeding FaDu cancer cells with PKH67 pre-stained macrophages at different densities as 1; 2.5; 5; 10 × 104 cells/mL corresponding to 2000; 5000; 10,000; and 20,000 cells per well, respectively, to form the heterotypic spheroids. Among all the tested conditions, only the results with FaDu/macrophages at a ratio of 1:1 (concentration of 5 × 10⁴ cells/mL) are presented here.
The kinetic of spheroids’ growth is shown in Figure 4A. As previously reported,28 the mean diameter of the FaDu spheroids (F5) was approximately 400 µm and remained stable over time. Co-culturing of spheroids with macrophages slightly increased the size of the resulting spheroids compared to that of homotypic FaDu spheroids. When the average size of FaDu spheroids 5 days after culturing was 374 ± 23 µm, the sizes of co-cultured FaDu/macrophage heterotypic spheroids were 457 ± 44 µm, 451 ± 33 µm, and 423 ± 21 µm for F5M0, F5M1, and F5M2, respectively. The mean diameter of the heterotypic spheroids was not statistically different between the co-culture and macrophage phenotypes (p > 0.05). We also studied the arrangement of tumor cells and macrophages in spheroids during cell culture. The bright-field and fluorescence images of the whole spheroids are presented in (Figure 4B, panels a and b). Macrophages were stained with PKH67 membrane green dye to determine their distribution in the co-culture spheroids. Optical imaging 5 days post-seeding revealed the formation of reproducible sphere-shaped 3D heterotypic spheroids with uniformly distributed macrophages, as demonstrated by fluorescence microscopy of whole spheroids or frozen sections (Figure 4B, panels b and c). As established by flow cytometry, irrespective of macrophage phenotype, spheroids were composed mainly of FaDu cancer cells with 30.2 ± 12.3% of PKH67-prestained macrophages (data not shown). To complete the whole spheroid characterization, the macrophage-rich model was analyzed by HE (Figure 4B, panel d) and Ki-67-staining (Figure 4B, panel e) of frozen sections. HE staining revealed a uniform cell distribution and a compact core with tightly adhered cells in all three types of heterotypic spheroids. We also observed that enrichment of FaDu spheroids with macrophages did not induce necrotic zones (Figure 4B, panels d and e) until day 7 (data not shown). Ki-67 positive cells were strongly expressed in all spheroid types, with increased intensity at the periphery of the spheroids (Figure 4B, panel e).
 |
Figure 4 Characterization of co-culture spheroids. (A) Growth kinetics of co-culture spheroids at 3, 5 and 7 days post-seeding. (B) Representative images (a-e) of spheroids assessed at day 5 post-seeding. Optical imaging of whole spheroids (a); fluorescence imaging of PKH67-prestained macrophages in whole spheroid (b) and in frozen sections (c). Cryosection images of co-culture spheroids stained with HE (d) and Ki-67 (e). Scale bars: 100 µm. Abbreviation: HE, Hematoxylin eosin. |
Distribution of Foslip® in Mono and Co-Culture Spheroids
After 24h of incubation with Foslip®, homotypic and heterotypic spheroids were dissociated, and Foslip® accumulation in individual cells was assessed using flow cytometry (Figure 5). Macrophages were pre-stained with the green membrane dye PKH67 to make them more visible in spheroids. The mean fluorescence intensity of total cells in whole spheroids did not differ significantly between FaDu spheroids and co-culture spheroids; MFI was approximately 180 000 a.u. Among the two cell populations in co-culture spheroids, macrophages accumulated Foslip® significantly better compared to the dye accumulation in FaDu cells (p < 0.001), with MFI of approximately 3,00,000 a.u and 50,000 a.u., respectively (Figure 5A). If we are interested in the Foslip® fluorescence pattern obtained by flow cytometry (Figure 5B), we can identify three distinct cell populations: unstained cells and two populations exhibiting low and high mTHPC fluorescence. Based on the analysis of cell populations (Figure 5C), we observed a significant decrease in the number of unstained cells within spheroids after Foslip® incubation, especially in co-culture spheroids. The fraction of unstained cells decreased to 8.67%, which was quite remarkable when compared to homotypic FaDu spheroids with 25.85% of unstained cells. This difference was statistically significant (p = 0.025), as determined by ANOVA. It is worth noting that we observed a constant percentage of approximately 10% of unstained cells in all co-culture models, regardless of whether they were FaDu cells (Figure 5D) or macrophages (Supplementary Figure 2). Additionally, under co-culture conditions, more than 50% of the cells displayed high Foslip® fluorescence, particularly in F5M1 and F5M2 spheroids, with percentages of 52% and 61%, respectively. This was in contrast to FaDu spheroids where only 39% of cells exhibited high Foslip® fluorescence (Figure 5C).
 |
Figure 5 Flow cytometry assessed Foslip® accumulation in homotypic (FaDu) and heterotypic (FaDu/Macrophages) spheroids 24 h post-incubation. (A) mTHPC mean fluorescence intensities in whole spheroid and cell subtypes (FaDu cells and macrophages). (B) Plots of Foslip® cellular uptake with (C) corresponding percentage of Foslip® positive cells in spheroids and (D) subsequent Foslip® distribution in FaDu cells in spheroids. The concentration of Foslip® was 4.5 µM. |
The kinetics of Foslip® distribution were examined using an automated cell imaging system ImageXpress confocal microscope (Figure 6). Figure 6A shows the maximum intensity projection (MIP) images of the F5M0 spheroids as a function of Foslip® incubation time. Similar results were observed for all types of co-culture spheroids (data not shown). The kinetics of Foslip® accumulation in both homotypic and heterotypic spheroids are presented in Figure 6B. An increase in fluorescence intensity was observed in the co-culture spheroids during the incubation period from 15h to 48h (Figure 6B), and this increase was the same in all types of co-culture models (data not shown). Concomitantly, from the 15h incubation period, the Pearson correlation coefficient (PCC) reached a substantial value of 0.8, indicating a strong localization of Foslip® in macrophages, regardless of the spheroid type (Figure 6C).
 |
Figure 6 Kinetics of Foslip® distribution in spheroids assessed by ImageXpress automated cell imaging system. (A) Typical example of MIP images in function of Foslip® incubation time in F5M0 spheroids; scale bars: 100 µm. (B) Kinetics Foslip® accumulation in Fadu and FaDu-enriched spheroids. (C) Kinetics of Foslip® co-localization in PKH67-green pre-stained macrophages evaluated by Pearson correlation coefficient. *p < 0.05 and ***p < 0.001 using ANOVA analysis with Tukey’s corrections. Abbreviations: MIP, Maximum intensity projection; MFI, mean fluorescence intensity. |
Photo-Induced Cell Death
To study the effect of macrophages on the PDT response, we assessed the photo-induced cell death of spheroids treated with Foslip® for 24h and then subjected to various fluences of red-light irradiation (Figure 7). At 24h after irradiation, the spheroids were dissociated, stained with PI, and subsequently analyzed for cell death. Dark toxicity observed in all control groups remained below 20%, indicating minimal spontaneous cell death in the absence of treatment. Homotypic F5 spheroids demonstrated a progressive increase in the number of dead cells as irradiation dosage increased. Both homotypic F5 spheroids and heterotypic F5M0, F5M1, and F5M2 spheroids displayed similar dose–response curves. At an irradiation dose of 60J/cm2, the photo-induced cell death demonstrated a peak response for all types of 3D cultures, with a substantial proportion of cells (approximately 70–80%) exhibiting positive PI staining. This significant increase in PI-positive cells indicates the maximal effect of PDT on cell death in spheroids. We can conclude that spheroids generated with conditioned media demonstrate increased sensitivity to PDT mediated by Foslip®. Specifically, we observed a significantly greater number of dead cells in FaDu-conditioned media-generated spheroids at an irradiation fluence of 10 J/cm2 than F5M0 spheroids (p < 0.05) and spheroids generated with polarized macrophages (F5M1 and F5M2) (p < 0.05). At 20 J/cm², spheroids generated with M1-conditioned medium exhibited the most pronounced response to PDT treatment compared to the other heterotypic 3D models tested.
 |
Figure 7 Foslip®-induced photo-cytotoxicity in co-culture spheroids assessed by PI staining of necrotic cells. Fluence-dependent Foslip®-induced toxicity in FaDu homotypic and FaDu-enriched co-culture spheroids 24h after PDT. The mTHPC concentration was 4.5 µM. *p < 0.05; **p < 0.01 using ANOVA analysis with Tukey’s corrections. Abbreviations: NL ND, no light no drug; PI, propidium iodide. |
Discussion
Over the last few decades, multiple lines of evidence have illustrated the importance of TME and stroma–tumor interactions in accurately recapitulating the biological response to anti-cancer therapies. Macrophages are abundantly present in TME contributing to tumor progression mostly through TAMs.34 During tumor development TAMs can adopt two distinct phenotypes, namely M1 subpopulation with anti-tumor function and the M2 subpopulation, associated with the promotion of tumor growth.35 The objective of this study was to develop a 3D human heterotypic HNSCC cancer model consisting of HNSCC cells and different subtypes of macrophages to replicate the interactions between immune and cancer cells. Following the establishment of the model, we evaluated the effect of macrophage subtypes on the effectiveness of PDT using the liposomal nanomedicine Foslip®. Therefore, we conducted a comparative analysis of the photo-induced response mediated by Foslip® in homo- and heterotypic spheroids enriched with either pro-inflammatory or anti-inflammatory macrophages.
Established immortalized monocyte cell lines, such as THP-1 and U937 cells, are commonly used as macrophage precursors, due to their ability to mimic the macrophage differentiation process and exhibit various properties typical of macrophages.36,37 In our previous studies related to mTHPC-PDT38 and Foslip®-PDT39 we have already used PMA-differentiated U937 as a model of M0 macrophages. In accordance with existing literature,32,40 our results demonstrated PMA-induced differentiation of U937 monocytes into macrophages, as evidenced by notable morphological changes (Figure 2) and strong expression of the macrophage differentiation marker CD68 (Figure 3A). Consistent with other studies, TAMs have been found to consist of a mixed population of both M1 and M2 phenotypes.41,42 U937 cells exhibited greater responsiveness to stimulation with M1 polarizing agents, increasing markers such as CD80, IL-1β, IL-6, and IL-12 (Figure 3B and C). In contrast, M2 polarizing agents led to the upregulation of CD206, CD163, and CD200R expression. Previously published studies reported that U937 cells usually undergo a shift toward M2 phenotype in contrast to THP-1 macrophages.36 It is very likely that the observed contrasting findings can be attributed to differences in the protocol for macrophage polarization, including variations in the nature of polarizing agents, their concentration, duration of stimulation,36 and specific characteristics of the tissue microenvironment.43
Multiple lines of evidence suggest that TCM can influence the differentiation of human monocytes into suppressive M2 macrophages in vitro. However, in this study, when M0 macrophages were incubated with TCM, the gene expression profile closely resembled that of uncommitted M0 macrophages, with expression levels around 1.0 (Figure 3C). This finding raises questions regarding the potential benefits of using TCM for macrophage polarization. Interestingly, these results contradict a recent study that found that TCM derived from a cervical carcinoma cell line promotes the secretion of M2 growth factors, thereby supporting tumor growth.43
In our 3D co-culture models, the resulting spheroids contained 30% macrophages (data not shown), which is consistent with previous studies in which TAM accounted for up to 50% of the tumor mass.4–6 The inclusion of 30% macrophages in the spheroids resulted in an observable increase in their size (Figure 4A). Additionally, our findings revealed a uniform distribution of macrophages within heterotypic spheroids (Figure 4B). In the 3D co-culture, a mixed macrophage phenotype was observed, with a predominance of the M1 phenotype in the F5M1 spheroids and the M2 phenotype in the F5M2 spheroids. These established 3D models offer valuable insights into the complex response of HNSCC cells to PDT using Foslip® in vitro.
In our previous study involving CAF-enriched spheroids, we demonstrated the crucial role of drug penetration and distribution in achieving effective PDT outcomes.30 It highlights the importance of drug uptake and the ability of the drug to penetrate and distribute evenly throughout the tumor microenvironment. Flow cytometry was used to evaluate the cellular uptake of Foslip® by individual spheroid cells. In the co-culture FaDu/Macrophage spheroids, although the total MFI did not show a significant change, macrophages demonstrated up to six times higher accumulation of Foslip® compared to FaDu cells (Figure 5A), probably as a result of their enhanced phagocytic activity.44 Furthermore, it was observed that almost all cells within the co-culture spheroids incorporated Foslip®, albeit exhibiting varying intensities of fluorescence (Figure 5B). The proportion of unstained cells in the co-culture spheroids was significantly lower, with only 8.67% remaining unstained compared to 25.85% in the homotypic FaDu spheroids (p = 0.025). The observed increase in spheroid size may be attributed to the disruption of cell junctions between FaDu cells within the heterotypic spheroids, thus contributing to enhanced spheroid permeability and facilitating Foslip® accumulation. Similar findings were reported in our study involving CAFs, highlighting the role of altered cell junctions in modulating spheroid permeability and drug accumulation.28
We conducted a comprehensive analysis using live-time automated fluorescence microscopy to investigate changes in Foslip® concentration within the spheroids. Our results clearly demonstrated a notable increase in the total concentration of Foslip® in heterotypic spheroids, particularly after 15h of incubation (Figure 6A and B). The observed increase in fluorescence intensity was directly associated with a higher degree of co-localization between Foslip® and macrophages. The Pearson coefficient values increased from 0.1 at 9h of incubation to 0.8 at 15h (Figure 6C). This indicates that macrophages actively take up and accumulate Foslip® within spheroids, contributing to the overall fluorescence intensity.
TAMs play an essential role in the outcome of PDT for malignant lesions owing to their strong ability to absorb systemically administered photosensitizers. However, it is important to note that while high drug absorption is accompanied by decreased uptake in cancer cells, the Foslip®-induced PDT efficiency in macrophage-enriched spheroids did not significantly impact that in homotypic FaDu spheroids (Figure 7). Since resident TAMs accumulate high levels of photosensitizers, macrophage photo-damage could be expected with predominant destruction of highly invading tumor M2 macrophages.19 Modulation of the immune response by targeting the TME is one of the strategies of anticancer nanomedicine. In the TME, pro-tumoral M2 macrophages suppress cancer immunosurveillance and promote vascularization. Nanoparticle-based therapies can either neutralize or kill TAMs or polarize TAMs to the anti-tumor M1 phenotype.45,46
In our study, an improvement in the PDT response was observed when conditioned media were present at low fluences (10–20 J/cm²), in contrast to other conditions such as heterotypic F5M0 or homotypic F5 spheroids. The plausible explanation could be related to the presence of pro-inflammatory cytokines in CM. Our preliminary results, assessed by the ELISA technique indeed demonstrated a higher level of pro-inflammatory IL-6 in the supernatant of F5M0 spheroids with CM (data not shown). This finding underscores the influence of the tumor microenvironment on the response to PDT and provides a basis for further investigation using established heterotypic 3D models of HNSCC.
Obviously, our model suffers from certain limitations. Despite heterotypic spheroids reproducing key aspects of the tumor microenvironment, these models failed to recreate the physiopathology of the tumor and tumor complexity regarding the matrix microenvironment and the interactions between tumor cells and the surrounding niche. The future integration of other cell types, extracellular matrix (ECM) and interstitial flow holds the potential to facilitate the evaluation of emerging anti-cancer therapies for head and neck cancer.
Conclusion
In this study, we established a 3D co-culture HNSCC model enriched with macrophages to accurately recapitulate the interactions between immune and cancer cells. Aiming the further improvement of our model, we are developing heterotypic 3D models that incorporate HNSCC cancer cells, CAFs, TAMs, and endothelial cells. This comprehensive approach allowed us to model a heterogeneous cell population in vitro, which is essential for understanding the intricate interactions among cancer, stromal, and immune cells as well as their collective response to nanomedicines tested within the TME.
Acknowledgments
This study was supported by the Institut de Cancérologie de Lorraine. The authors thank biolitec research GmbH (Jena, Germany) for providing Foslip® formulation.
Disclosure
The authors declare that they have no known competing financial interests or personal relationships that could influence the work reported in this study.
References
1. Mhaidly N, Journe F, Najem A, et al. Macrophage profiling in head and neck cancer to improve patient prognosis and assessment of cancer cell-macrophage interactions using three-dimensional coculture models. Int J Mol Sci. 2023;24(16):12813. doi:10.3390/ijms241612813
2. Tredan O, Galmarini CM, Patel K, Tannock IF. Drug resistance and the solid tumor microenvironment. J Natl Cancer Inst. 2007;99(19):1441–1454. doi:10.1093/jnci/djm135
3. Rebelo SP, Pinto C, Martins TR, et al. 3D-3-culture: a tool to unveil macrophage plasticity in the tumour microenvironment. Biomaterials. 2018;163:185–197. doi:10.1016/j.biomaterials.2018.02.030
4. Xue Y, Song X, Fan S, Deng R. The role of tumor-associated macrophages in oral squamous cell carcinoma. Front Physiol. 2022;13:959747. doi:10.3389/fphys.2022.959747
5. Mantovani A, Allavena P. The interaction of anticancer therapies with tumor-associated macrophages. J Exp Med. 2015;212(4):435–445. doi:10.1084/jem.20150295
6. Mantovani A, Marchesi F, Malesci A, Laghi L, Allavena P. Tumour-associated macrophages as treatment targets in oncology. Nat Rev Clin Oncol. 2017;14(7):399–416. doi:10.1038/nrclinonc.2016.217
7. Evrard D, Szturz P, Tijeras-Raballand A, et al. Macrophages in the microenvironment of head and neck cancer: potential targets for cancer therapy. Oral Oncol. 2019;88:29–38. doi:10.1016/j.oraloncology.2018.10.040
8. Ruytinx P, Proost P, Van Damme J, Struyf S. Chemokine-induced macrophage polarization in inflammatory conditions. Front Immunol. 2018;9:1930. doi:10.3389/fimmu.2018.01930
9. Kuen J, Darowski D, Kluge T, Majety M. Pancreatic cancer cell/fibroblast co-culture induces M2 like macrophages that influence therapeutic response in a 3D model. Ahmad A, ed.. PLoS One. 2017;12(7):e0182039. doi:10.1371/journal.pone.0182039
10. Lee CH, Liu SY, Chou KC, et al. Tumor-associated macrophages promote oral cancer progression through activation of the axl signaling pathway. Ann Surg Oncol. 2014;21(3):1031–1037. doi:10.1245/s10434-013-3400-0
11. Alves AM, Diel LF, Lamers ML. Macrophages and prognosis of oral squamous cell carcinoma: a systematic review. J Oral Pathol Med. 2018;47(5):460–467. doi:10.1111/jop.12643
12. Curry JM, Sprandio J, Cognetti D, et al. Tumor microenvironment in head and neck squamous cell carcinoma. Semin Oncol. 2014;41(2):217–234. doi:10.1053/j.seminoncol.2014.03.003
13. Bisheshar SK, Van Der Kamp MF, De Ruiter EJ, et al. The prognostic role of tumor associated macrophages in squamous cell carcinoma of the head and neck: a systematic review and meta-analysis. Oral Oncol. 2022;135:106227. doi:10.1016/j.oraloncology.2022.106227
14. Li B, Ren M, Zhou X, Han Q, Cheng L. Targeting tumor-associated macrophages in head and neck squamous cell carcinoma. Oral Oncol. 2020;106:104723. doi:10.1016/j.oraloncology.2020.104723
15. Hagemann T, Lawrence T, McNeish I, et al. “Re-educating” tumor-associated macrophages by targeting NF-κB. J Exp Med. 2008;205(6):1261–1268. doi:10.1084/jem.20080108
16. Biswas SK, Allavena P, Mantovani A. Tumor-associated macrophages: functional diversity, clinical significance, and open questions. Semin Immunopathol. 2013;35(5):585–600. doi:10.1007/s00281-013-0367-7
17. Wiehe A, Senge MO. The Photosensitizer Temoporfin (m THPC) – chemical, Pre‐clinical and Clinical Developments in the Last Decade † ‡. Photochem Photobiology. 2023;99(2):356–419. doi:10.1111/php.13730
18. Peng Q, Nesland JM. Effects of photodynamic therapy on tumor stroma. Ultrastruct Pathol. 2004;28(5–6):333–340. doi:10.1080/01913120490515586
19. Korbelik M, Hamblin MR. The impact of macrophage-cancer cell interaction on the efficacy of photodynamic therapy. Photochem Photobiol Sci. 2015;14(8):1403–1409. doi:10.1039/c4pp00451e
20. Rumie Vittar NB, Lamberti MJ, Pansa MF, et al. Ecological photodynamic therapy: new trend to disrupt the intricate networks within tumor ecosystem. Biochim Biophys Acta Rev Cancer. 2013;1835(1):86–99. doi:10.1016/j.bbcan.2012.10.004
21. Zhu Z, Scalfi-Happ C, Ryabova A, et al. Photodynamic activity of Temoporfin nanoparticles induces a shift to the M1-like phenotype in M2-polarized macrophages. J Photochem Photobiol B. 2018;185:215–222. doi:10.1016/j.jphotobiol.2018.06.015
22. Lassalle HP, Dumas D, Gräfe S, D’Hallewin MA, Guillemin F, Bezdetnaya L. Correlation between in vivo pharmacokinetics, intratumoral distribution and photodynamic efficiency of liposomal mTHPC. J Control Release. 2009;134(2):118–124. doi:10.1016/j.jconrel.2008.11.016
23. Reshetov V, Lassalle HP, François A, et al. Photodynamic therapy with conventional and PEGylated liposomal formulations of mTHPC (temoporfin): comparison of treatment efficacy and distribution characteristics in vivo. Int J Nanomedicine. 2013:3817. doi:10.2147/IJN.S51002
24. Millard M, Yakavets I, Zorin V, Kulmukhamedova A, Marchal S, Bezdetnaya L. Drug delivery to solid tumors: the predictive value of the multicellular tumor spheroid model for nanomedicine screening. Int J Nanomedicine. 2017;12:7993–8007. doi:10.2147/IJN.S146927
25. Costa EC, De Melo-Diogo D, Moreira AF, Carvalho MP, Correia IJ. Spheroids formation on non-adhesive surfaces by liquid overlay technique: considerations and practical approaches. Biotechnol J. 2018;13(1):1700417. doi:10.1002/biot.201700417
26. Langhans SA. Three-dimensional in vitro cell culture models in drug discovery and drug repositioning. Front Pharmacol. 2018;9:6. doi:10.3389/fphar.2018.00006
27. Di Modugno F, Colosi C, Trono P, Antonacci G, Ruocco G, Nisticò P. 3D models in the new era of immune oncology: focus on T cells, CAF and ECM. J Exp Clin Cancer Res. 2019;38(1):117. doi:10.1186/s13046-019-1086-2
28. Yakavets I, Jenard S, Francois A, et al. Stroma-rich co-culture multicellular tumor spheroids as a tool for photoactive drugs screening. J Clin Med. 2019;8(10):1686. doi:10.3390/jcm8101686
29. Yakavets I, Francois A, Guiot M, et al. NIR imaging of the integrin-rich head and neck squamous cell carcinoma using ternary copper indium selenide/zinc sulfide-based quantum dots. Cancers. 2020;12(12):3727. doi:10.3390/cancers12123727
30. Yakavets I, Francois A, Lamy L, et al. Effect of stroma on the behavior of temoporfin-loaded lipid nanovesicles inside the stroma-rich head and neck carcinoma spheroids. J Nanobiotechnol. 2021;19(1):3. doi:10.1186/s12951-020-00743-x
31. Lamy L, François M, Bezdetnaya L, Yakavets I. Phototoxicity of temoporfin-loaded cyclodextrin nanosponges in stroma-rich three-dimensional models of head and neck cancer. Eur J Pharm Biopharm. 2023;184:1–6. doi:10.1016/j.ejpb.2023.01.010
32. Daigneault M, Preston JA, Marriott HM, Whyte MKB, Dockrell DH. the identification of markers of macrophage differentiation in PMA-stimulated THP-1 cells and monocyte-derived macrophages. Doherty TM, ed.. PLoS One. 2010;5(1):e8668. doi:10.1371/journal.pone.0008668
33. Bertani FR, Mozetic P, Fioramonti M, et al. Classification of M1/M2-polarized human macrophages by label-free hyperspectral reflectance confocal microscopy and multivariate analysis. Sci Rep. 2017;7(1):8965. doi:10.1038/s41598-017-08121-8
34. Wang J, Li D, Cang H, Guo B. Crosstalk between cancer and immune cells: role of tumor‐associated macrophages in the tumor microenvironment. Cancer Med. 2019;8(10):4709–4721. doi:10.1002/cam4.2327
35. Galli SJ, Borregaard N, Wynn TA. Phenotypic and functional plasticity of cells of innate immunity: macrophages, mast cells and neutrophils. Nat Immunol. 2011;12(11):1035–1044. doi:10.1038/ni.2109
36. Nascimento CR, Rodrigues Fernandes NA, Gonzalez Maldonado LA, Rossa Junior C. Comparison of monocytic cell lines U937 and THP-1 as macrophage models for in vitro studies. Biochem Biophys Rep. 2022;32:101383. doi:10.1016/j.bbrep.2022.101383
37. Harris PE, Ralph P, Litcofsky P, Moore MA. Distinct activities of interferon-gamma, lymphokine and cytokine differentiation-inducing factors acting on the human monoblastic leukemia cell line U937. Cancer Res. 1985;45(1):9–13.
38. Coutier S, Bezdetnaya L, Marchal S, et al. Foscan® (mTHPC) photosensitized macrophage activation: enhancement of phagocytosis, nitric oxide release and tumour necrosis factor-α-mediated cytolytic activity. Br J Cancer. 1999;81(1):37–42. doi:10.1038/sj.bjc.6690648
39. Reinhard A, Bressenot A, Dassonneville R, et al. Photodynamic therapy relieves colitis and prevents colitis-associated carcinogenesis in mice. Inflamm Bowel Dis. 2015;21(5):985–995. doi:10.1097/MIB.0000000000000354
40. Taniguchi K, Hikiji H, Okinaga T, et al. Essential role of lysophosphatidylcholine acyltransferase 3 in the induction of macrophage polarization in PMA-treated U937 cells. J Cell Biochem. 2015;116(12):2840–2848. doi:10.1002/jcb.25230
41. Benner B, Scarberry L, Suarez-Kelly LP, et al. Generation of monocyte-derived tumor-associated macrophages using tumor-conditioned media provides a novel method to study tumor-associated macrophages in vitro. J Immunother Cancer. 2019;7(1):140. doi:10.1186/s40425-019-0622-0
42. Sawa-Wejksza K, Dudek A, Lemieszek M, Kaławaj K, Kandefer-Szerszeń M. Colon cancer–derived conditioned medium induces differentiation of THP-1 monocytes into a mixed population of M1/M2 cells. Tumour Biol. 2018;40(9):101042831879788. doi:10.1177/1010428318797880
43. Sánchez-Reyes K, Pedraza-Brindis EJ, Hernández-Flores G, et al. The supernatant of cervical carcinoma cells lines induces a decrease in phosphorylation of STAT-1 and NF-κB transcription factors associated with changes in profiles of cytokines and growth factors in macrophages derived from U937 cells. Innate Immun. 2019;25(6):344–355. doi:10.1177/1753425919848841
44. Hu G, Guo M, Xu J, et al. Nanoparticles targeting macrophages as potential clinical therapeutic agents against cancer and inflammation. Front Immunol. 2019;10:1998. doi:10.3389/fimmu.2019.01998
45. Siegler EL, Kim YJ, Wang P. Nanomedicine targeting the tumor microenvironment: therapeutic strategies to inhibit angiogenesis, remodel matrix, and modulate immune responses. J Cell Immunother. 2016;2(2):69–78. doi:10.1016/j.jocit.2016.08.002
46. Ye J, Yang Y, Dong W, et al. Drug-free mannosylated liposomes inhibit tumor growth by promoting the polarization of tumor-associated macrophages. Int J Nanomed. 2019;14:3203–3220. doi:10.2147/IJN.S207589
 © 2023 The Author(s). This work is published and licensed by Dove Medical Press Limited. The
full terms of this license are available at https://www.dovepress.com/terms
and incorporate the Creative Commons Attribution
- Non Commercial (unported, 3.0) License.
By accessing the work you hereby accept the Terms. Non-commercial uses of the work are permitted
without any further permission from Dove Medical Press Limited, provided the work is properly
attributed. For permission for commercial use of this work, please see paragraphs 4.2 and 5 of our Terms.
© 2023 The Author(s). This work is published and licensed by Dove Medical Press Limited. The
full terms of this license are available at https://www.dovepress.com/terms
and incorporate the Creative Commons Attribution
- Non Commercial (unported, 3.0) License.
By accessing the work you hereby accept the Terms. Non-commercial uses of the work are permitted
without any further permission from Dove Medical Press Limited, provided the work is properly
attributed. For permission for commercial use of this work, please see paragraphs 4.2 and 5 of our Terms.