Back to Journals » Breast Cancer: Targets and Therapy » Volume 17
A Machine-Learning Model for the Prediction of Triple-Negative Breast Cancer Based on Multiparameter MRI
Authors Cai Y, Li Y, Wang W, Zhou Y, Wang J, Zhang L, Lu H ![]()
Received 4 January 2025
Accepted for publication 26 June 2025
Published 15 July 2025 Volume 2025:17 Pages 611—625
DOI https://doi.org/10.2147/BCTT.S513779
Checked for plagiarism Yes
Review by Single anonymous peer review
Peer reviewer comments 2
Editor who approved publication: Professor Pranela Rameshwar
Yuxin Cai,1,* Yanbo Li,1,* Wenqi Wang,1 Yaqiu Zhou,1 Jingbo Wang,1 Lina Zhang,1,2 Hong Lu1
1Department of Breast Imaging, Tianjin Medical University Cancer Institute and Hospital, National Clinical Research Center for Cancer, Tianjin’s Clinical Research Center for Cancer, Key Laboratory of Breast Cancer Prevention and Therapy, Tianjin Medical University, Ministry of Education, Key Laboratory of Cancer Prevention and Therapy, Tianjin, People’s Republic of China; 2Second Department of Breast Cancer, Tianjin Medical University Cancer Institute and Hospital, National Clinical Research Center for Cancer, Tianjin, People’s Republic of China
*These authors contributed equally to this work
Correspondence: Hong Lu, Department of Breast Imaging, Tianjin Medical University Cancer Institute and Hospital, National Clinical Research Center for Cancer, Tianjin’s Clinical Research Center for Cancer, Key Laboratory of Breast Cancer Prevention and Therapy, Tianjin Medical University, Ministry of Education, Key Laboratory of Cancer Prevention and Therapy, Tianjin, People’s Republic of China, Tel +86-18622221319, Email [email protected]
Objective: To explore the difference between triple-negative breast cancer (TNBC) and non-triple-negative breast cancer (non-TNBC) based on multi-parametric MRI imaging features and construct a prediction model to identify TNBC.
Methods: A retrospective study enrolled 1353 women with 1376 malignant lesions who had no additional therapy before surgery between January 2019 and December 2020 in a single center. The images were accessed according to BI-RADS-MR® (fifth ed.) atlas. The lesions were classified as TNBC group and non-TNBC and then randomly divided into a primary cohort (n = 963) and a validation cohort (n = 413) at a ratio of 7:3. In the primary cohort, univariate analysis, logistic regression analysis and Boruta algorithm were used to determine the independent predictors for TNBC and non-TNBC. The machine learning classifier XGboost was developed based on the features to predict TNBC. The area under the receiver operating characteristic (ROC) curve (AUC) was applied to evaluate the model prediction ability. The diagnostic performances of the model were evaluated in the validation cohort.
Results: Necrosis, edema, the maximum diameter of lesions, enhancement ratio in each phase, time to peak, gland enhancement ratio, wash-in slope and the number and diameter of the vessels were independent predictors predicting TNBC. The AUCs of the model were 0.795 (95% CI: 0.758– 0.832) and 0.705 (95% CI: 0.640– 0.770) in the primary cohort and validation cohort, respectively.
Conclusion: The model based on multiparameter MRI has good predictive ability and can be used to predict the probability of TNBC.
Keywords: triple negative breast cancer, vessel, semi-quantitative parameters, model, magnetic resonance imaging
Introduction
Breast cancer is the most common cancer among women1 and is a group of heterogeneous diseases with various clinical behaviours and responses to treatment. Triple-negative breast cancers are characterized by a lack of expression of the estrogen receptor (ER), progesterone receptor (PR), and human epidermal growth factor receptor 2 (HER2).2 BRCA1 and BRCA2 (BRCA1/2) are the most important TNBC susceptibility genes, but only BRCA1 has been identified as a triple-negative susceptibility gene.3 Furthermore, compared with other breast cancer subtypes, pathogenic variations of PALB2, BRIP1, BARD1, and RAD51C are considered to be enriched in TNBC.3 Epidemiological data show that TNBC mainly occurs in young premenopausal women under 40 years of age, accounting for about 15–20% of all breast cancer patients.4,5 Women who have TNBC cannot benefit from endocrine therapy or trastuzumab and have the worst prognosis.6 Thus, the accuracy of the identification of TNBC is essential.
Core needle biopsy (CNB) is the gold standard for identifying TNBC but has limitations. Several studies had indicated significant variability in the consistency between CNB samples and the assessment of tumor excision.7–10 The coincidence rates of ER, PR and HER2 states ranged from 61% to 99%.11,12 Intratumor heterogeneity could explain these results because of undersampling of the most informative areas by CNB.12
Dynamic contrast enhancement magnetic resonance imaging (DCE-MRI) has been extensively used in the diagnosis of breast cancer because its sensitivity is higher than other auxiliary tests. It can show malignant lesions that cannot be visualized by mammography or ultrasound.13 Previous studies mostly used functional and morphological parameters such as dynamic contrast enhancement patterns or apparent diffusion coefficient (ADC) to identify TNBC but rarely used semi-quantitative parameters to predict TNBC.14–18 Angiogenesis plays a crucial role in the development and progression of breast cancer, and its pathological quantification often relies on indirect measures, such as alternative markers of microvascular density (MVD). Angiogenesis could be displayed by a breast MRI, enhancement features such as the enhancement ration phases or time to peak (TTP) of the breast MRI were associated with microvascular density of breast cancer. An adjacent vessel sign (AVS) was first defined by Carriero et al19 as a vessel (either artery or vein) in contact with a lesion or entering it. We used maximum intensity projection (MIP) series constructed from early postcontrast images in DCE-MRI.
In recent years, due to the development of statistical theory and the advancement of scientific and technological innovations, machine learning (ML) has attracted the attention and recognition of clinicians. ML methods have been applied to prediction of TNBC neoadjuvant chemotherapy response,20 survival prediction,21 differentiation of TNBC and non-TNBC at the genetic level,22 and prediction of breast cancer outcomes in tumor tissue images.23 However, few studies have analyzed the association between multiparametric MRI (semi-quantitative parameters and the number and diameter of the vessels) with TNBC. The purpose of this study was to develop a model based on multiparametric MRI for predicting TNBC.
Materials and Methods
Patients
Medical Ethics Committee of Tianjin Cancer Hospital approved this study (Approved No. of ethic committee: Ek2021235) and required waiving the requirement for informed patient consent. Because this was a retrospective study that analyzed pre-existing and unalterable historical data, without any intervention or experimental manipulation of the patients, and the use of these data would not directly affect the patients’ current health or living conditions. A total of 1353 consecutive breast cancer patients who underwent DCE-MRI without additional treatment before surgery from January 2019 to December 2020 were retrospectively analyzed. Surgeries were performed on all of the lesions following examination. The exclusion criteria were as follows: (1) patients with occult breast cancer and lymphoma; (2) patients treated with therapy before surgery; (3) poor image quality, incomplete image artifact or post-processing failure; (4) insufficient clinical-pathological information; (5) those who underwent vacuum-assisted or excisional biopsy for diagnosis (Figure 1).
 |
Figure 1 Study flow chart. Abbreviation: DCE-MRI, dynamic contrast enhancement magnetic resonance imaging. |
Histopathological Analysis
The histopathological and IHC results were retrieved from the Hospital Information System (HIS). Stained nuclei indicated negative ER or PR expression in <1% of cancer cells on ten high-power fields. In HER2 immunohistochemical staining, a score of 0 or 1+ was negative, 3+ was positive. Tumors scored at 2+ were equivocal and sent for fluorescence in-situ hybridisation to test. If the ratio of the HER2 gene signal to the chromosome 17 signal was less than 2, it was classified as negative.14 TNBC was defined as ER negative, PR negative and HER2 negative, or ER negative, PR negative, HER2 positive and FISH negative. Breast cancer was classified into two types based on the expression of ER/PR/HER2 in immunohistochemistry.
Imaging Protocol
All MRI examinations were performed on a 3.0 T scanner using a dedicated 8-channel phased-array breast coil (Discovery MR750, GE Healthcare) and a 1.5 T scanner using a dedicated 4-channel phased-array breast coil (Signa Infinity Excite II, GE Healthcare). The routine scans including T1-weighted (T1W) sequence, a fat-saturated T2-weighted (T2W) sequence and a diffusion-weighted sequence were performed using axial planes. The same sequence parameters were: field of view, 30cm×30cm; slice thickness, 5mm; slice gap, 0.5mm. On T1W and T2W images: matrix size, 384×224; number of excitations (NEX), 2 and flip angle, 90°. Repetition time/echo time (TR/TE) of T1W, 700ms/10ms; TR/TE of T2W, 4500ms/85ms.
The different parameters were: diffusion-weighted imaging (DWI) with readout-segmented echo-planar technique: TR/TE, 6300/64ms; b-values, 0, 500 and 1000 mm2/s; matrix, 128×128. The volume imaging for breast assessment (VIBRANT) bilateral breast imaging technique: field of view, 26cm×26cm; slice thickness, 1.8mm; flip angle, 15°; matrix size, 256×128; NEX, 1 and TR/TE, 6.1ms /2.9ms.
Six dynamic sequence analyses were performed before and after contrast injection. After unenhanced acquisition, 0.2mL/kg body weight of the contrast agent (Gd-DTPA) was injected at the rate of 2.0mL/s and then followed by an equal volume of saline solution. The acquisition was repeated five times, and each phase took 60s–90s.
Image Analysis
According to American College of Radiology BI-RADS MR lexicon, magnetic resonance images were independently reviewed by two radiologists (YXC, YBL, with 3 and 8 years of experience in breast MRI, respectively); in particular, they proceeded with the method of visual inspection of MR dynamic contrast-enhanced MIP of the subtraction between unenhanced images in the dynamic sequence and the first series of contrast-enhanced images. MIP reconstruction was performed on subtracted images. Both radiologists, blinded to clinicopathological findings, compared their conclusions and resolved inconsistencies by consensus. They assessed MR imaging findings including margins, enhancement, necrosis, edema, and ADC values. For multifocal or multicentric disease, the largest lesion was measured. The distance from the lesion to the nipple was measured on the reconstructed multi-planar reformation (MPR) by turning the rotation line to align the lesion with the nipple in the sagittal position and measuring the distance from the frontal edge of the lesion to the nipple in the transverse axis position.
Coronal, sagittal and transverse MIPs were prepared from subtracted MR images and 3D rotation using Functool II software on an Advantage Workstation (AW 4.7, GE Healthcare) to assess the AVS of breast cancer. The presence of vessels either entering the enhancing lesion or in contact with the lesion edge on MIP images was considered as the presence of AVS.24–27 Count the number of these vessels, then find the largest vessel and measure its diameter.
DCE-MRI used semi-quantitative enhancement kinetic features, which had been hypothesized as the reflection of tumor angiogenesis to describe vascular changes after intravenous injection of a contrast agent.28,29 These quantitative enhancement kinetic features were based on a region of interest (ROI) plotted on the brightest enhancement region to avoid bleeding and necrosis.
ROIs plotted to be as large as possible were placed inside the tumor on the first post-contrast image of DCE-MRI scans and ADC maps, avoiding areas of hemorrhage and necrosis. When measuring the gland enhancement ratio, the ROIs were drawn in the mirror image situation of the contralateral breast. If the patients underwent the radical mastectomy and had only one side of the breast, the ROIs plotted in the situation of the most apparent glandular enhancement in the ipsilateral breast. To assess each phase signal intensity increase, we calculated the enhancement for every post-contrast image: percentage enhancement at each phase(%)=[(post-contrast signal intensity−pre-contrast signal intensity)/pre-contrast signal intensity]×100%.30 TTP, considered as the time (s) reached to achieve the maximum enhancement signal, was also assessed. Tumor size (the longest diameter of the tumor), the distance from the lesion to the nipple and the gland enhancement ratio were measured in the first phase of DCE-MRI. The gland enhancement ratio was calculated using the above formula. The maximum, minimum, mean, standard deviation and relative deviation of ADC were recorded on ADC maps.
XGBoost Model and Boruta Algorithm
The XGBoost algorithm optimizes the loss function using Newton’s method, achieved through a second-order Taylor expansion of the loss function combined with regularization terms to enhance traditional gradient boosting frameworks. During training, the objective function comprises two components: the loss function and the regularization term, which govern predictive accuracy and model complexity, respectively. Furthermore, the algorithm incorporates a “feature subsampling” strategy, where a random subset of features is selected for training each decision tree (analogous to the approach employed in Random Forest). This technique enhances the model’s generalization capability by promoting diversity among base learners, thereby effectively mitigating overfitting risks. The operational workflow of the XGBoost algorithm can be formalized as follows: feature vector with the corresponding (output) category yi31:

Feature selection: Boruta is a feature selection algorithm based on Random Forest. The Random Forest classifier is relatively fast, typically operable without parameter tuning, and provides numerical estimates of feature importance. The importance metric for a feature quantifies the loss in classification accuracy caused by the random permutation of its values across instances. A Z-score is calculated by dividing the mean loss by its standard deviation, serving as the importance measure. A shadow feature was obtained from the initial features by value resetting in a dataset copy. Shadow features were used as reference standards for selecting initial features. This method compared the Z-score between shadow features and each feature and evaluated them using a Random Forest classifier. A feature was chosen if its Z-score exceeded the highest Z-score of the shadow features.
Statistical Analysis
Continuous variables were expressed as medians with interquartile ranges (IQRs) and categorical variables as frequencies and percentages. The Mann–Whitney U-test compared continuous variables, while the Fisher exact test or Pearson χ2 test compared categorical variables. Statistical analysis was performed using R software (version 4.2.3). Univariate logistic regression identified variables associated with TNBC, and those with a p-value of < 0.1 were further analyzed using the Boruta method. An XGBoost model was built based on features selected by Boruta. Model performance for predicting TNBC was evaluated using the AUC with 95% confidence intervals (CI), and AUCs were compared using the DeLong test.
Results
Study Population
A total of 1376 lesions were detected in 1353 patients, including 23 patients with double breast cancer. Postoperative pathology confirmed 272 TNBC lesions and 1104 non-TNBC lesions. The age of patients ranged from 23 to 81 years old, and the median age was 48. The lesions were randomly divided into a primary cohort and a validation cohort at a ratio of 7:3. The clinical and MRI features of the primary cohort (963 lesions; median [interquartile range {IQR}] age, 48 [42–56] years) and validation cohort (413 lesions; median [interquartile range {IQR}] age, 47 [41–56] years) are shown in Tables 1 and 2 respectively. No significant differences were observed between the primary cohort and validation cohort. There was no difference between ADC values. (Supplementary Table 1).
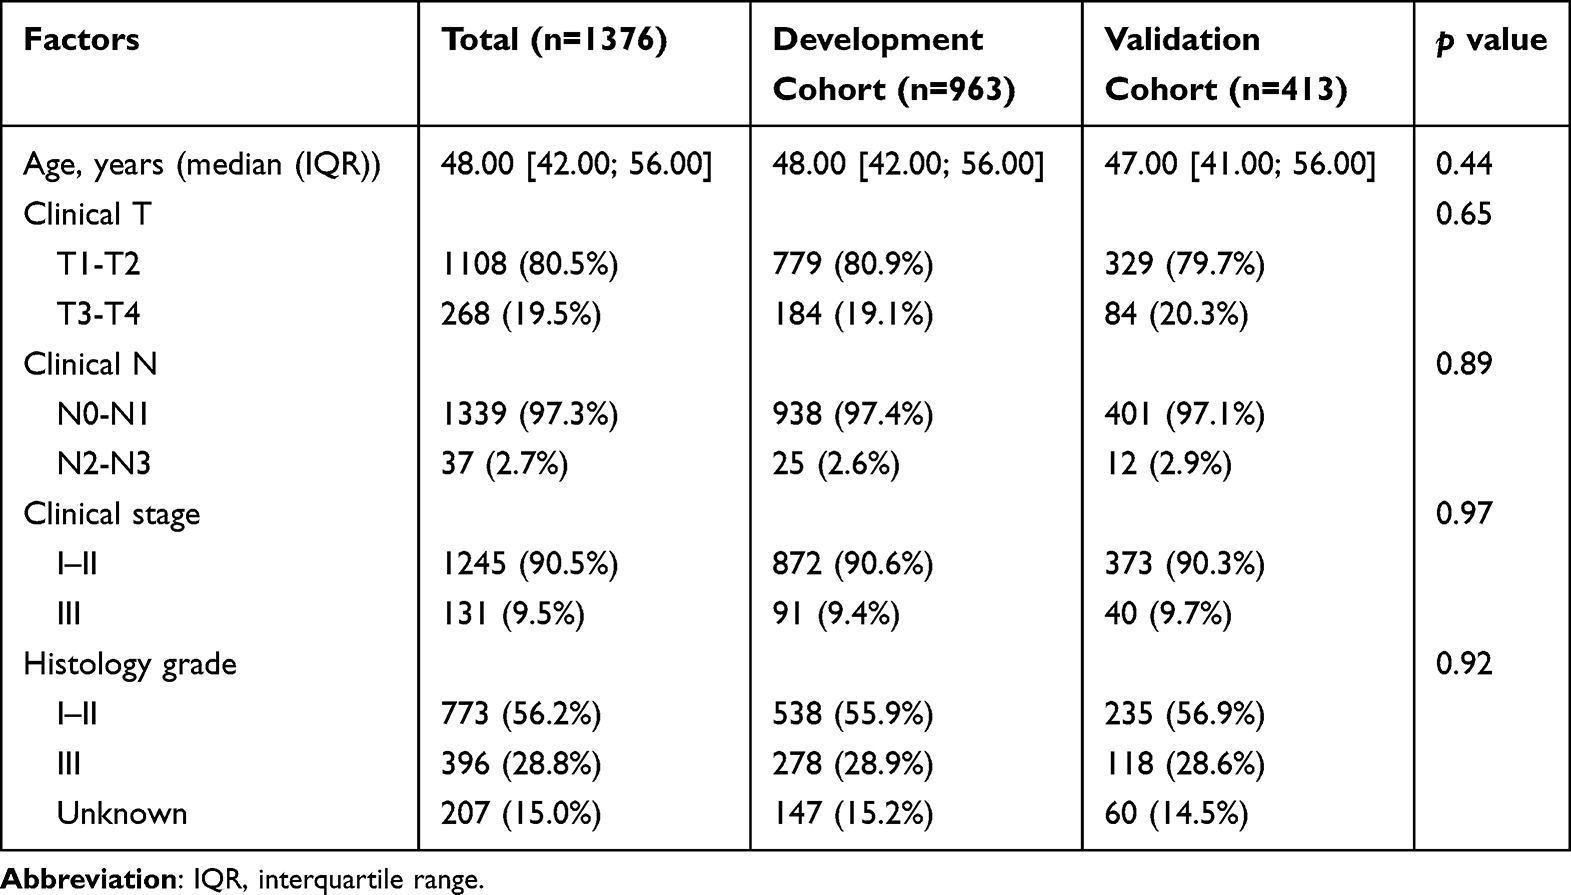 |
Table 1 The Clinicopathologic of the Study Population |
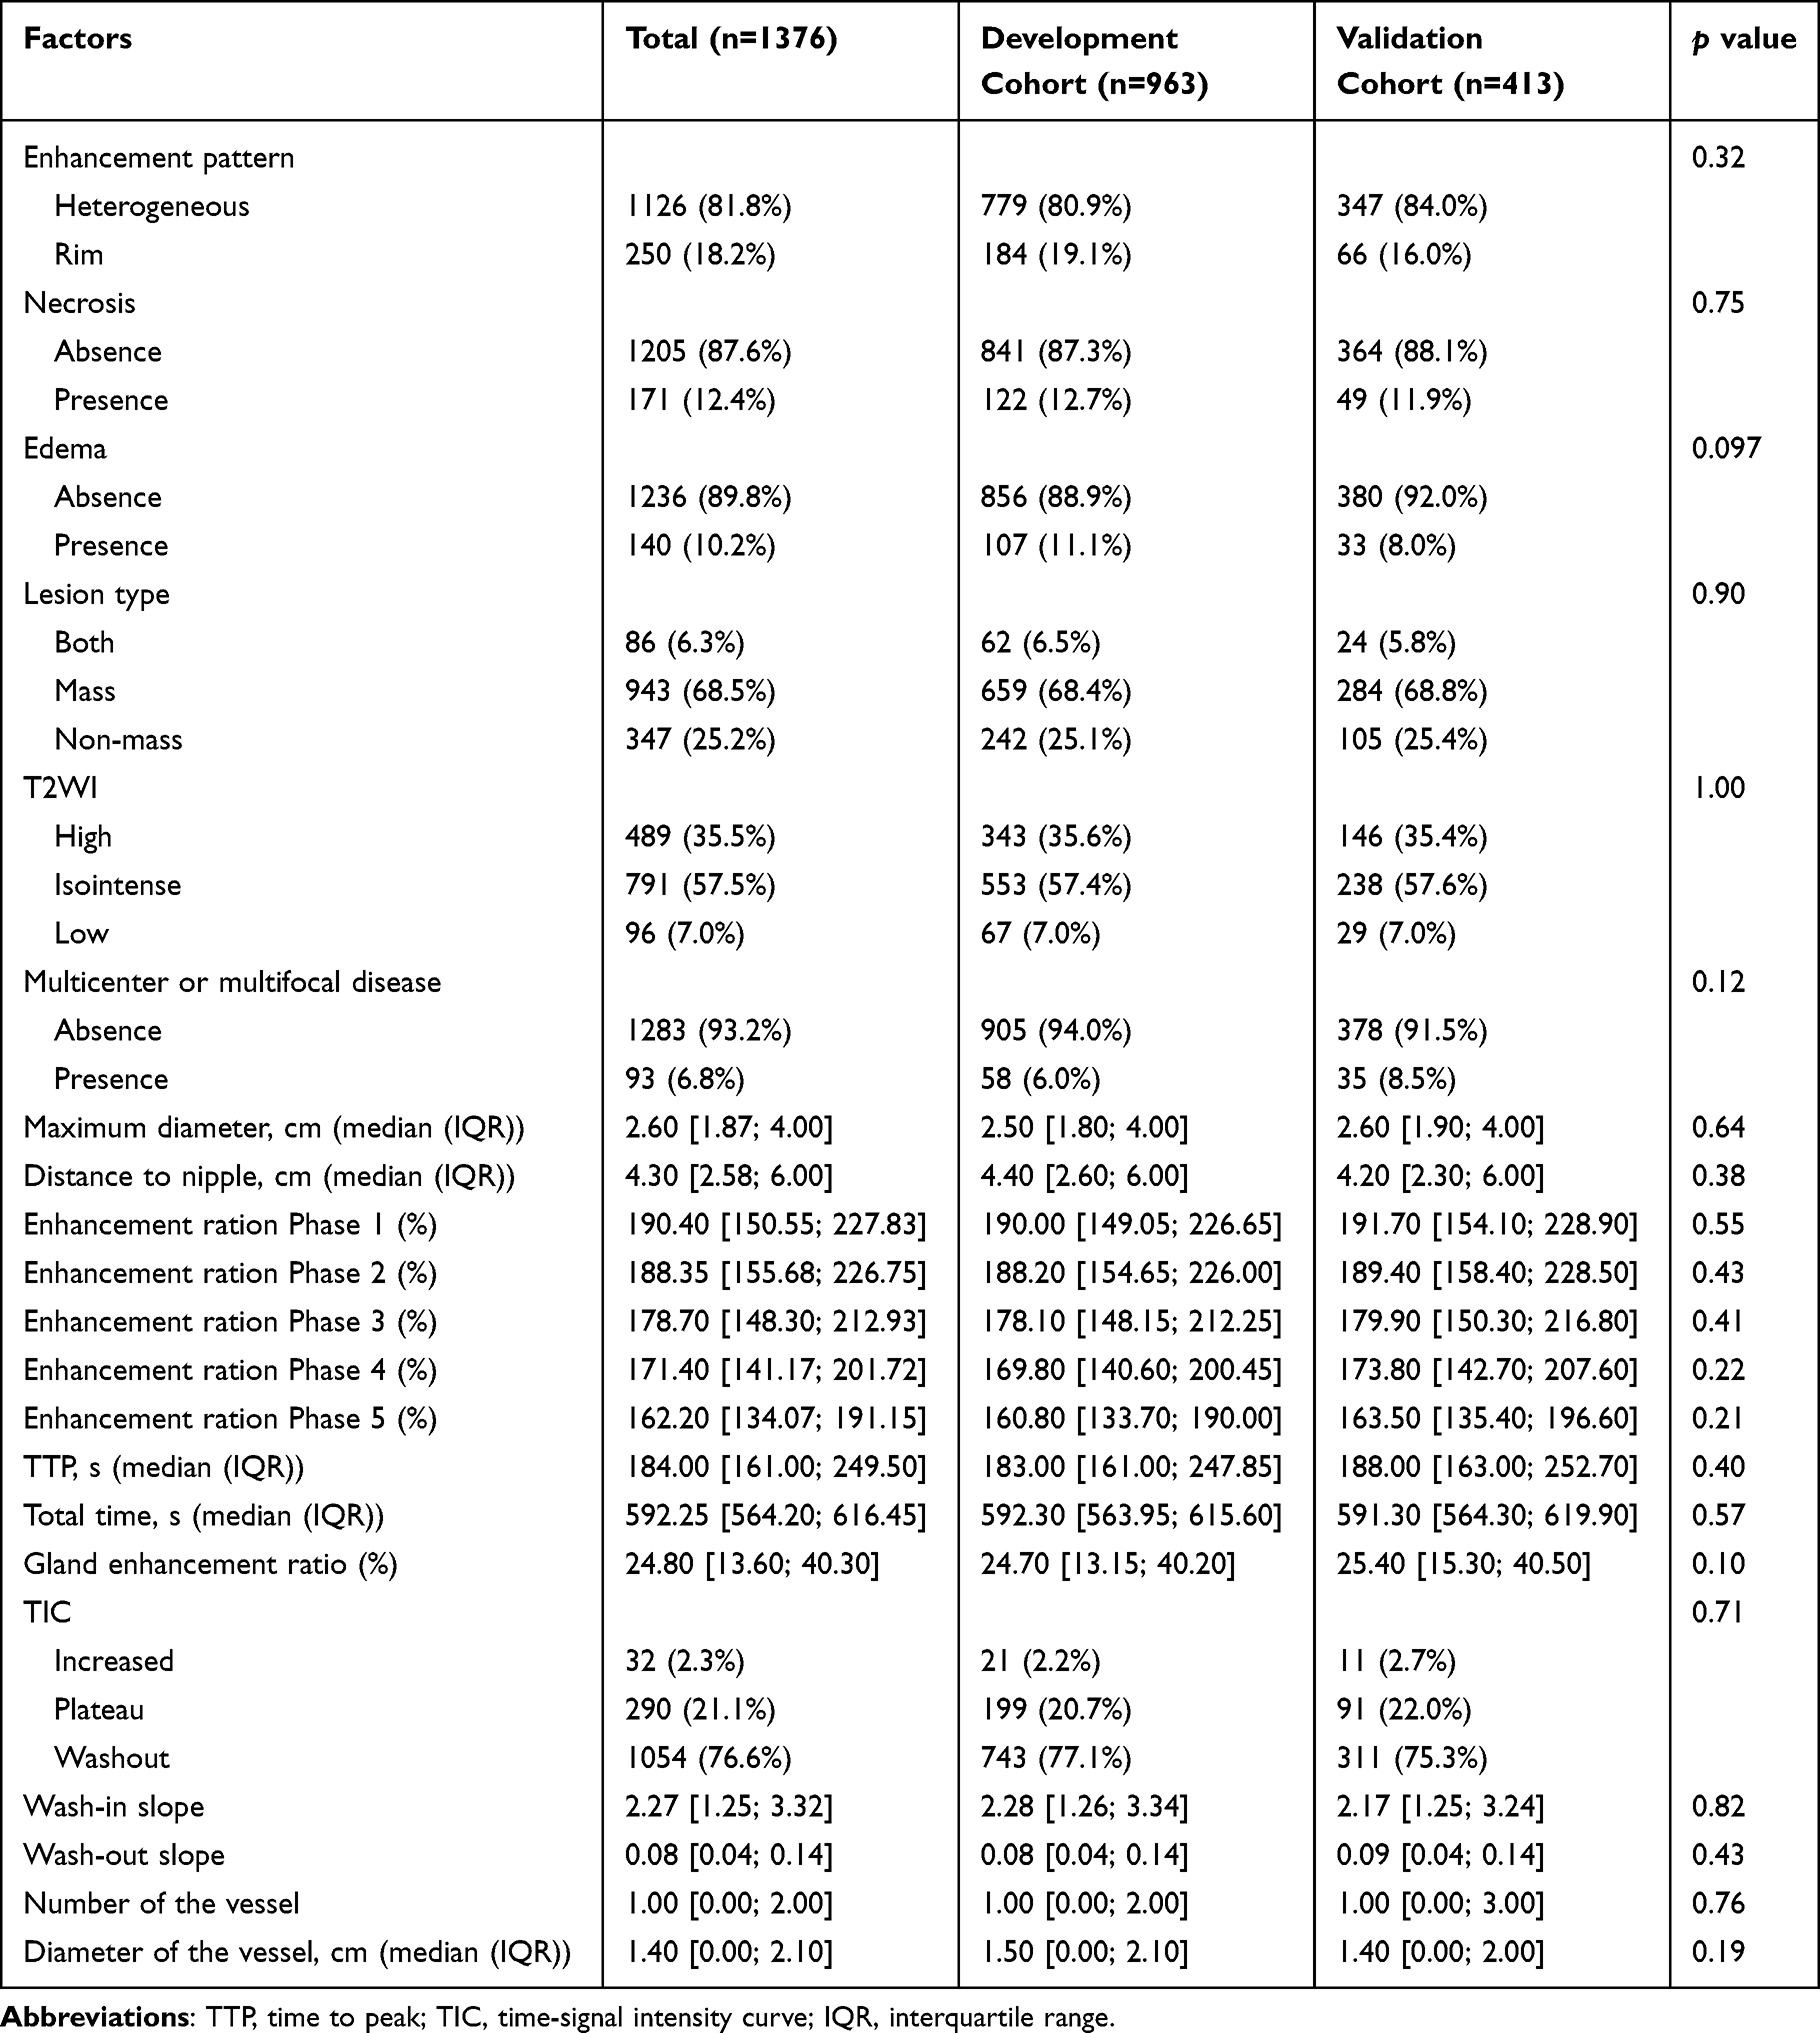 |
Table 2 The MRI Features of the Study Population |
Identification of Predictive Factors
Tables 3 and 4 summarize respectively the clinicopathological and MRI characteristics of TNBC versus non-TNBC in the primary cohort. Detailed information of ADC values is present in Supplementary Table 2. Univariate analysis revealed that TNBC had higher clinical N stage (p < 0.001) and histological grade (p < 0.001) compared to non-TNBC. MRI findings showed TNBC more frequently exhibited rim enhancement (p < 0.001), edema (p < 0.001), necrosis (p < 0.001), high T2 signal (p = 0.04), and unifocal tumors (p = 0.04). Lesions in TNBC had larger maximum diameters (p < 0.001) and were further from the nipple (p = 0.03). Semi-quantitative parameters indicated lower enhancement ratios (p < 0.05) and TTP (p < 0.001) for TNBC, while gland enhancement ratio (p = 0.001) and wash-in slope (p = 0.02) were higher than non-TNBC. Additionally, the number and diameter of the vessels on MIP maps (p < 0.001) were higher and larger in TNBC compared to non-TNBC (Table 5).
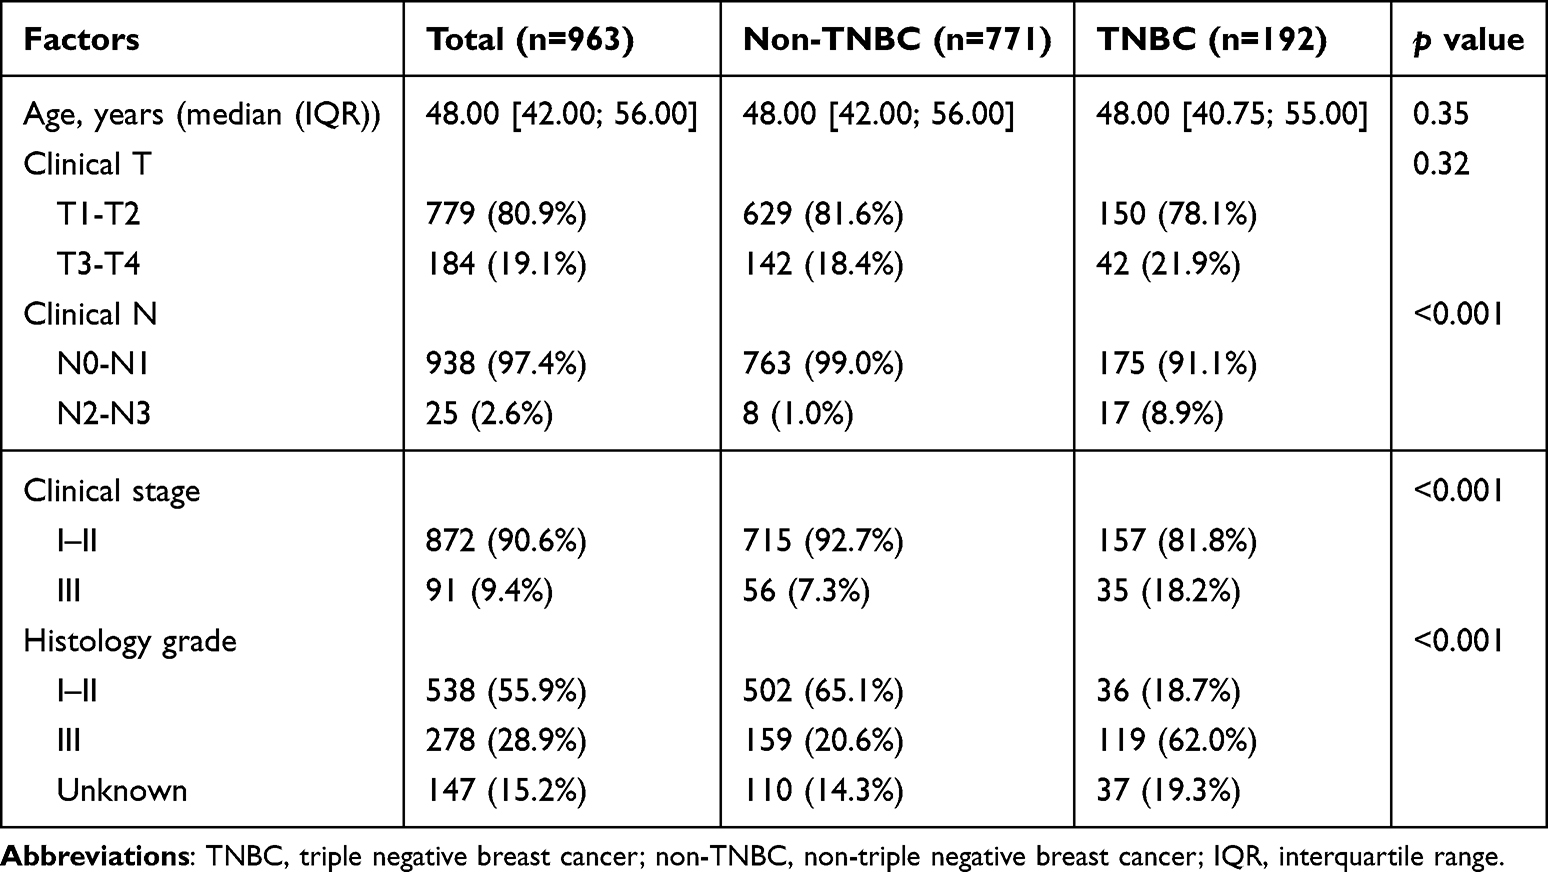 |
Table 3 Comparison of the Clinicopathological Between TNBC and Non-TNBC in the Primary Cohort |
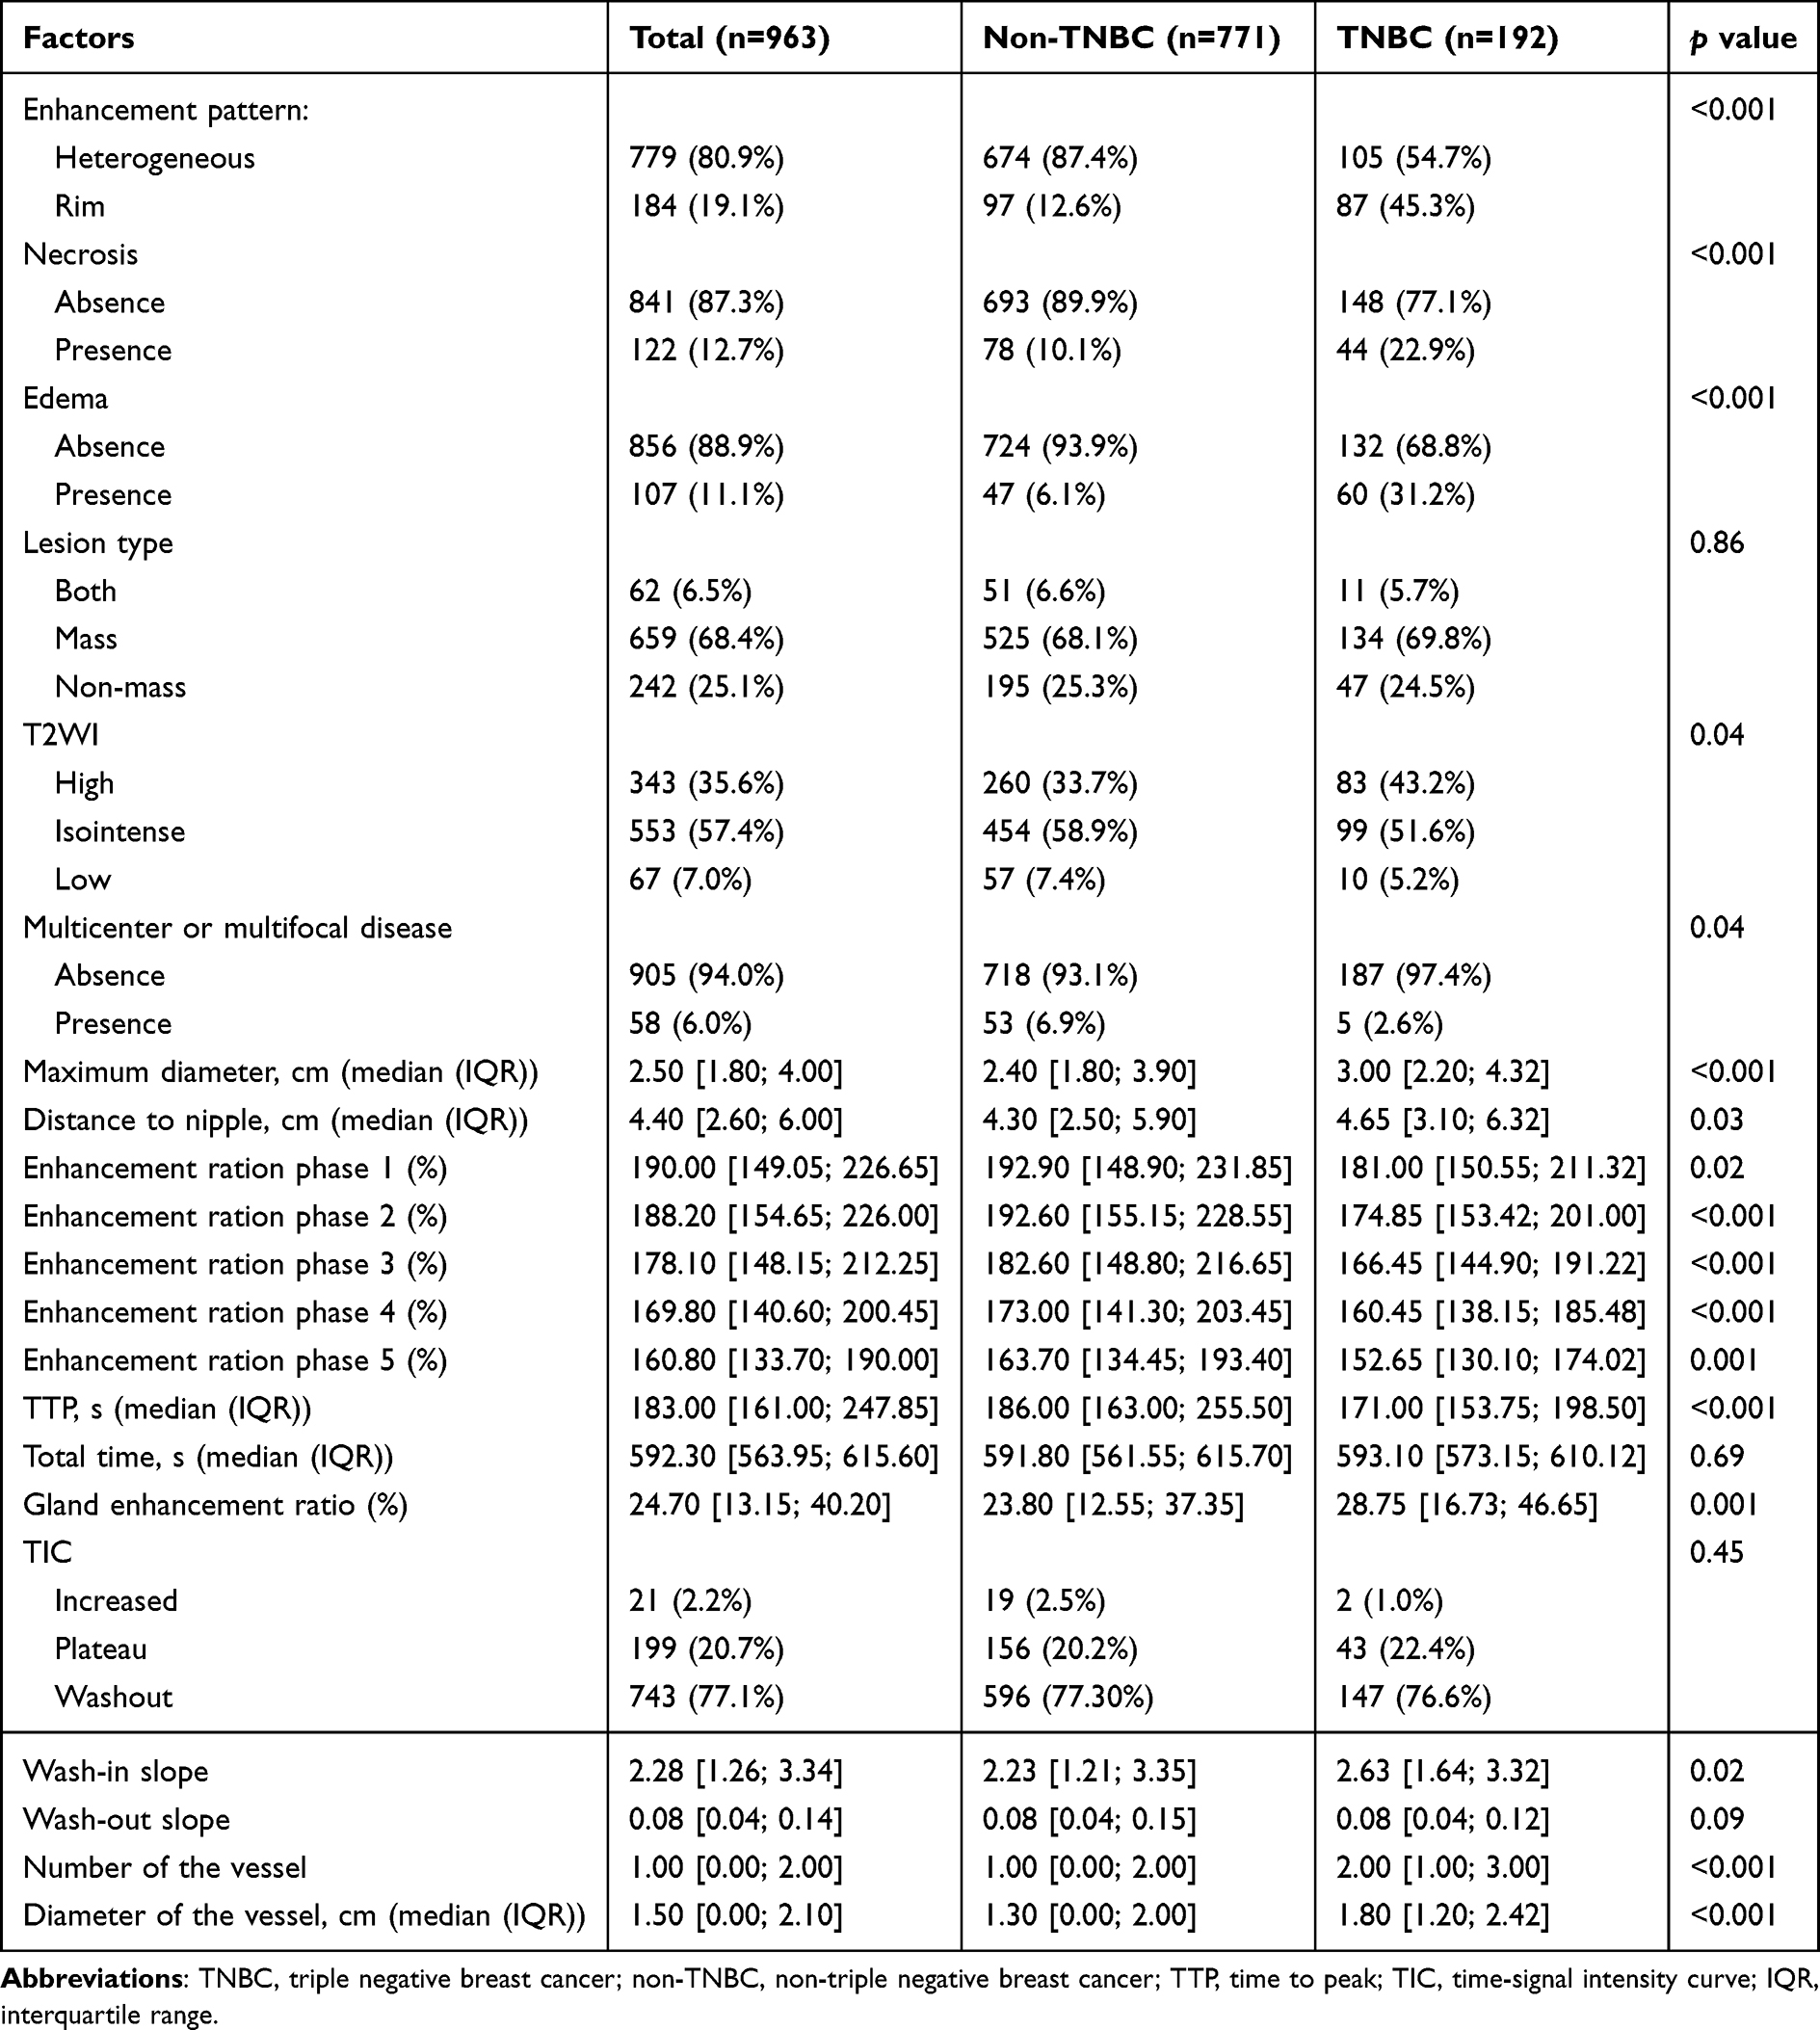 |
Table 4 Comparison of the MRI Characteristics Between TNBC and Non-TNBC in the Primary Cohort |
 |
Table 5 Univariate Logistic Regression Analysis to Determine the Factors Related to TNBC |
Development and Validation of the Predictive Model
The Boruta algorithm was used for feature selection to identify significant parameters for distinguishing TNBC from non-TNBC. The selection criterion required that a feature’s Z-score surpass the peak Z-score of the shadow features. (Figure 2a) The Boruta R package (accessed February 18, 2022)32 was employed, running the algorithm 100 times with 250 iterations each. (Figure 2b) Parameters selected in 90% or more of the runs were deemed significant, resulting in 13 critical parameters.
 |
Figure 2 Boruta result plot. Feature selection analyzed by Boruta algorithm. Green and red boxplots represent confirmed and rejected attributes respectively. Yellow boxplot represent tentative attribute. Blue boxplots correspond to maximum, average, and minimal Z score of a shadow attribute (a). Z score evolution during Boruta run. Green lines correspond to confirmed attributes, yellow to tentative attribute, red to rejected ones and blue to respectively minimal, average and maximal shadow attribute importance. The vertical axis represents the importance of features, and the horizontal axis represents the number of runs of the classifier (b). Abbreviation: TTP, time to peak. |
The XGBoost model was developed using critical variables identified by Boruta in the primary cohort (Figure 3). SHAP, a unified framework for model interpretation, assigned significance values to features, indicating their impact on model decisions. A higher SHAP value for a given feature in the model means a more significant impact on the decision of the model. The prediction model calculated the probability of TNBC based on necrosis, edema, lesion diameter, enhancement ratios, TTP, gland enhancement ratio, wash-in slope, and the vessel characteristics. Typical MRI examples of patients with TNBC and non-TNBC and their models are shown in Figure 4. Model performance was assessed using the AUC of the ROC curve, as well as accuracy, sensitivity, and specificity. The AUCs were 0.795 (95% CI: 0.758–0.832) for the primary cohort and 0.705 (95% CI: 0.640–0.770) for the validation cohort, demonstrating good predictive ability for TNBC (Figure 5).
 |
Figure 3 SHAP model construction. The SHAP importance score of each feature in the XGBoost classifier. The darker the color (black), the greater the contribution to the prediction result (a). The relationship between feature value and the predicted probability is visually reflected by the color of the scatter plot of the SHAP summary plot, including positive and negative predictive effects. The color from light (yellow) to dark (black) indicates that the feature value is from high to low. SHAP value greater than zero, the greater the possibility of TNBC (b). Abbreviation: TTP, time to peak. |
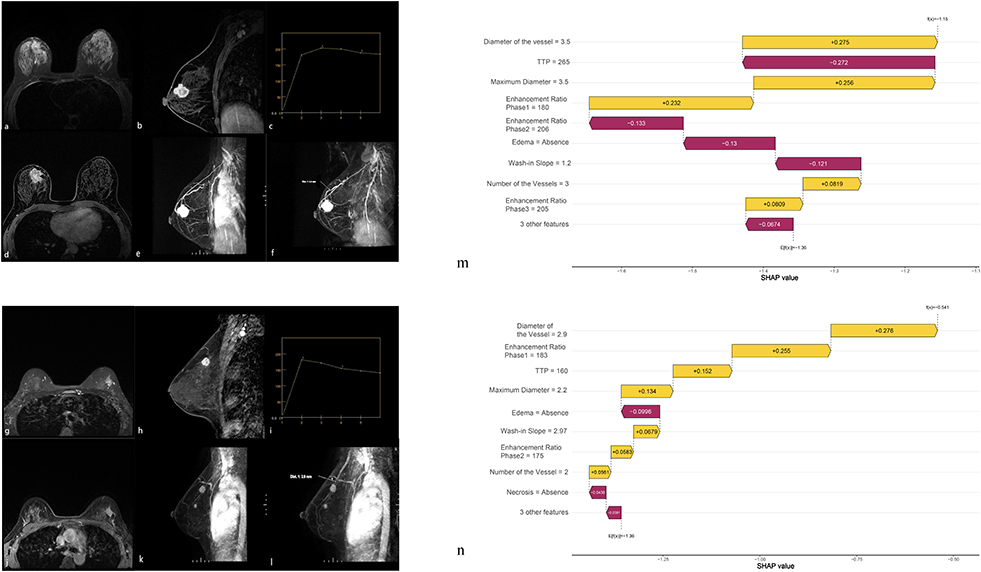 |
Figure 4 Pretreatment MR Images of non-TNBC patients and TNBC patients. (a–f) Axial fat-saturated T2W images, first sagittal post-contrast MR images acquired approximately 60s-90s after the contrast medium injection, kinetics, axial volume imaging for breast assessment, MR dynamic contrast-enhanced maximum intensity projection of non-TNBC and measurement of vessels. (g–l) Axial fat-saturated T2W images, first sagittal post-contrast MR images acquired approximately 60s-90s after the contrast medium injection, kinetics, axial volume imaging for breast assessment, MR dynamic contrast-enhanced maximum intensity projection of TNBC and measurement of vessels. (m) The waterfall chart of the XGBoost model predicted the possibility of non-TNBC in this case. (n) The waterfall chart of the XGBoost model (showing log odds ratio) predicted the possibility of TNBC in this case. Negative values indicate the probability that a lesion is a TNBC is less than 0.5. The features that are the yellow bars contribute to a prediction that a lesion is TNBC, while the features that are the purple bars contribute to a prediction that a lesion is non-TNBC. Features are ranked from top to bottom in terms of importance. Abbreviation: TTP, time to peak. |
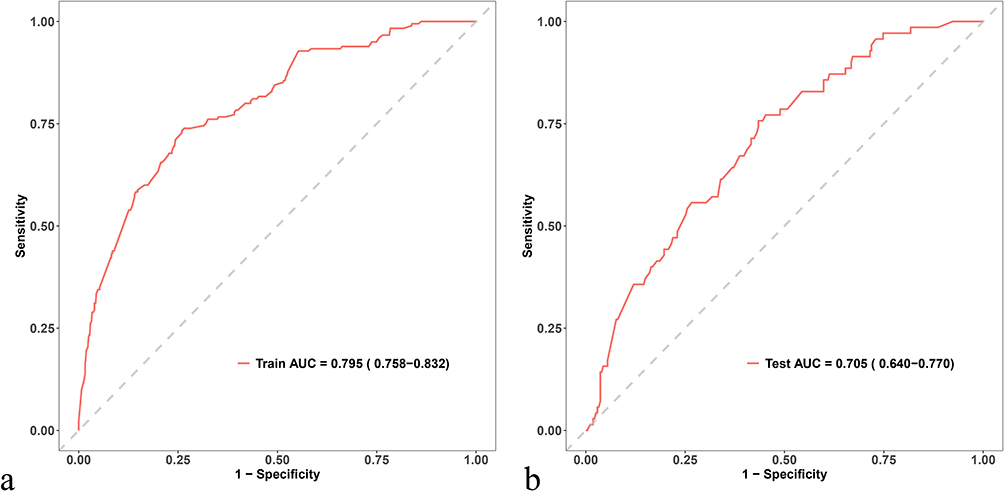 |
Figure 5 The ROC curves of the primary cohort’s model and the validation cohort’s model. The AUC is 0.795 for the primary cohort (a) and 0.705 for the validation cohort (b). Abbreviation: AUC, area under curve. |
Discussion
The early identification of breast cancer subtypes is crucial for personalized treatment. It is one of the leading causes of cancer-related deaths.33 This study utilized non-invasive MRI to differentiate between TNBC and non-TNBC and developed a prediction model based on multi-parametric MRI features. The XGBoost model has the characteristics of being fast and accurate. Compared with traditional machine learning algorithms, XGBoost is more original and better.34 In this study, necrosis, edema, maximum lesion diameter, enhancement ratio in each stage, peak time, gland enhancement ratio, washout slope, number and diameter of blood were independently associated with TNBC. The model combining these predictors demonstrated good predictive performance, with AUCs of 0.795 (95% CI: 0.758–0.832) and 0.705 (95% CI: 0.640–0.770) in the primary and validation cohorts. This model demonstrates significant clinical value by enabling early TNBC identification on preoperative MRI, thus guiding personalized therapeutic strategies.
The vessel formation is crucial for the growth of malignant tumors including breast cancer.35 TNBC exhibits the highest MVD among the breast cancer subtypes, partly due to elevated vascular growth factor expression.36–39 Tumors with high MVD may benefit from antiangiogenic therapy.35 TNBC is often associated with central necrosis and fibrosis, with rim enhancement as a characteristic feature.14,15,40 Our study found rim enhancement in 45.31% of TNBC cases, aligning with the 41% to 80% range reported in the literature.15 Rim enhancement, a marker of high angiogenesis and tumor aggression, is linked to the overexpression of vascular endothelial growth factor and intratumoral hypoxia.16,41 Reduced vessel numbers in central necrotic or fibrotic areas also contribute to rim enhancement.28,42–44 Therefore, we suggest that rim enhancement in TNBC is associated with vessels.
While some studies have compared vessel differences between benign and malignant lesions,45,46 there is limited focus on vessel differences across breast cancer subtypes. Chen et al47 examined the role of vessel presence in distinguishing TNBC from non-TNBC using MRI. Our study included the number and diameter of the vessels in MIP. We found that the number of the vessels in TNBC was higher and the diameter of the vessels was larger than non-TNBC.
In this study, kinetic semi-quantitative parameters were crucial for identifying TNBC. Our data indicated that enhancement ratios at each stage, TTP, and wash-in slope were independently correlated with TNBC. Specifically, the enhancement ratios for TNBC were approximately 10% lower than that of non-TNBC. A recent study17 found that the initial enhancement ratio, indicative of early contrast wash-in, was elevated in HER2+ and TNBC compared to ER+/PR+ breast cancers. Previous research focused on early enhancement ratio and peak enhancement ratio with inconsistent results.14,18 And Kim et al48 reported that TTP had no concern with molecular typing. Our findings may differ due to a larger sample size. The enhancement ratio may be linked to tumor angiogenesis, with higher peak enhancement ratio associated with increased blood flow.49,50 We speculated that TNBC’s high peripheral and low central vascular density contributes to higher TTP and wash-in slope and lower enhancement ratios at each stage.
High signal intensity on T2-weighted images was associated with necrosis within the tumor.40 Similar to previous reports,13,15,40,51 TNBCs were most frequently observed with high intratumoral signal intensity on T2-weighted images in our study.
Background parenchymal enhancement (BPE) in the breast, seen on MRI post-contrast injection, was influenced by endogenous estrogens, fibroglandular tissue, and menstrual phase. BPE was higher in women with more glandular tissue, extensive blood vessels and hormone sensitivity.52 While some studies53,54 found higher BPE in basal-like and TNBC subtypes, others55 reported lower BPE in TNBC compared to luminal A and B subtypes. However, Ha et al56 demonstrated that there is no statistical correlation between BPE and molecular subtypes. This study agreed with Dilorenzo et al54 in finding higher BPE in TNBC compared to non-TNBC, suggesting that BPE could be a valuable predictive factor for TNBC diagnosis despite variability in measurement standards. In this article, BPE was represented by gland enhancement ratio.
TNBC exhibits distinct MRI characteristics compared to other subtypes, including rim enhancement, unifocal lesions, higher histological grade, and high T2 signal intensity.14,15,57 In this article, we found that the histological grade of TNBC had higher than that of non-TNBC, but it was not included in the model because the histological grade of some lesions was unknown. Edema, a marker of aggressiveness, is more common in TNBC.58,59 Our study found that TNBC had a higher probability of edema. Chen et al58 reported non-luminal breast cancer, including TNBC, showed more focal edema and higher breast edema scores (BES) than luminal breast cancer, with both measures correlating with tumor size and axillary lymph node metastasis. However, the link between tumor subtype and lymph node status is inconsistent. Some studies reported no significant differences in HER-2, ER, and PR positivity between ALNM and NALNM groups,60,61 while others noted higher lymph node metastasis rates in TNBC.62,63 This study suggested TNBC’s higher clinical N stage might be due to specific gene expression changes associated with survival and spread.64
We observed that the distance from the TNBC lesion to the nipple was farther away. Kim et al65 found that TNBC was located significantly closer to the chest wall. The results may account for our observation.
DWI is an MRI technique based on Brownian water motion, with the ADC reflecting proton diffusion. A recent meta-analysis indicated that ADC cannot predict breast cancer subtypes66 and that some angiogenesis markers are not correlated with ADC values.67 This study found no statistically significant ADC differences between TNBC and non-TNBC, suggesting that histopathological differences among subtypes may be too subtle for DWI to predict reliably.66
There are some limitations to our study. Firstly, it is a monocentric and retrospective analysis; therefore, results need to be further validated in the prospective studies. Secondly, branching vessels may cause counting problems. In this study, we treated a Y-shaped vessel as a dual vessel if it satisfied the counting criteria. Finally, we manually mapped the ROI on the largest slice of the tumor and the statistics for the selected area might differ from the measurements for the entire tumor.
In conclusion, the model combining MRI parameters and machine learning method could predict the probability of TNBC before surgery and help implement targeted treatment for patients as early as possible.
Abbreviations
TNBC, Triple negative breast cancer; non-TNBC, Non-triple-negative breast cancer; ROC, Receiver operating characteristic curve; AUC, Area under curve; ER, Estrogen receptor; PR, Progesterone receptor; HER2, Human epidermal growth factor receptor 2; CNB, Core needle biopsy; DCE-MRI, Dynamic contrast enhancement magnetic resonance imaging; ADC, Apparent diffusion coefficient; MVD, Microvascular density; TTP, Time to peak; AVS, Adjacent vessel sign; MIP, Maximum intensity projection; T1W, T1-weighted; T2W, T2-weighted; NEX, Number of excitations; TR/TE, Repetition time/echo time; DWI, Diffusion-weighted imaging; VIBRANT, volume imaging for breast assessment; MPR, multi-planar reformation; ROI, region of interest; IQR, interquartile range; CI, confidence intervals; BPE, Background parenchymal enhancement; BES, breast edema scores.
Data Sharing Statement
The datasets generated and analyzed during this study are not publicly available due to potential patient identifiable data but are available from the corresponding author on reasonable request.
Ethics Approval and Informed Consent
This study was performed in line with the principles of the Declaration of Helsinki. Approval was granted by the Ethics Committee of Tianjin Medical University Cancer Institute and Hospital.
Consent for Publication
All authors confirm that the details of any images, recordings can be published, and that the persons providing consent have been shown the article contents to be published.
Funding
This study has received funding by the National Natural Science Foundation of China [Grant No.82172025]. The Chinese National Key Research and Development Project (Grant No. 2021YFC2500400 and Grant No.2021YFC2500402), Tianjin Key Medical Discipline (Specialty) Construction Project (TJYXZDXK-009A).
Disclosure
All authors declare no relevant financial or non-financial interests to disclose.
References
1. Bray F, Laversanne M, Sung H, et al. Global cancer statistics 2022: GLOBOCAN estimates of incidence and mortality worldwide for 36 cancers in 185 countries. CA Cancer J Clin. 2024;74:229–263. doi:10.3322/caac.21834
2. Leon-Ferre RA, Polley M-Y, Liu H, et al. Impact of histopathology, tumor-infiltrating lymphocytes and adjuvant chemotherapy on prognosis of triple-negative breast cancer. Breast Cancer Res Treat. 2018;167:89–99. doi:10.1007/s10549-017-4499-7
3. Karim AM, Eun Kwon J, Ali T, et al. Triple-negative breast cancer: epidemiology, molecular mechanisms, and modern vaccine-based treatment strategies. Biochem Pharmacol. 2023;212:115545. doi:10.1016/j.bcp.2023.115545
4. Waks AG, Winer EP. Breast cancer treatment: a review. JAMA. 2019;321:288–300. doi:10.1001/jama.2018.19323
5. Criscitiello C, Azim HA, Schouten PC, et al. Understanding the biology of triple-negative breast cancer. Ann Oncol off J Eur Soc Med Oncol. 2012;23 Suppl 6:vi13–18. doi:10.1093/annonc/mds188
6. Foulkes WD, Smith IE, Reis-Filho JS. Triple-negative breast cancer. N Engl J Med. 2010;363:1938–1948. doi:10.1056/NEJMra1001389
7. Arnedos M, Nerurkar A, Osin P, et al. Discordance between core needle biopsy (CNB) and excisional biopsy (EB) for estrogen receptor (ER), progesterone receptor (PgR) and HER2 status in early breast cancer (EBC). Ann Oncol off J Eur Soc Med Oncol. 2009;20(12):1948–1952. doi:10.1093/annonc/mdp234
8. Badoual C, Maruani A, Ghorra C, et al. Pathological prognostic factors of invasive breast carcinoma in ultrasound-guided large core biopsies-correlation with subsequent surgical excisions. Breast Edinb Scotl. 2005;14:22–27. doi:10.1016/j.breast.2004.07.005
9. Burge CN, Chang HR, Apple SK. Do the histologic features and results of breast cancer biomarker studies differ between core biopsy and surgical excision specimens? Breast. 2006;15:167–172. doi:10.1016/j.breast.2005.06.004
10. Cavaliere A, Sidoni A, Scheibel M, et al. Biopathologic profile of breast cancer core biopsy: is it always a valid method? Cancer Lett. 2005;218:117–121. doi:10.1016/j.canlet.2004.07.041
11. Lorgis V, Algros MP, Villanueva C, et al. Discordance in early breast cancer for tumour grade, estrogen receptor, progesteron receptors and human epidermal receptor-2 status between core needle biopsy and surgical excisional primary tumour. Breast Edinb Scotl. 2011;20:284–287. doi:10.1016/j.breast.2010.12.007
12. Loubeyre P, Bodmer A, Tille J-C, et al. Concordance between core needle biopsy and surgical excision specimens for tumour hormone receptor profiling according to the 2011 St. Gallen Classification, in clinical practice. Breast J. 2013;19:605–610. doi:10.1111/tbj.12181
13. Be D, Lw T. Imaging of triple-negative breast cancer. Ann Oncol off J Eur Soc Med Oncol. 2012;23 Suppl 6. doi:10.1093/annonc/mds191.
14. Youk JH, Son EJ, Chung J, et al. Triple-negative invasive breast cancer on dynamic contrast-enhanced and diffusion-weighted MR imaging: comparison with other breast cancer subtypes. Eur Radiol. 2012;22:1724–1734. doi:10.1007/s00330-012-2425-2
15. Chen H, Li W, Wan C, Zhang J. Correlation of dynamic contrast-enhanced MRI and diffusion-weighted MR imaging with prognostic factors and subtypes of breast cancers. Front Oncol. 2022;12:942943. doi:10.3389/fonc.2022.942943
16. Liu H-L, Zong M, Wei H, et al. Added value of histogram analysis of apparent diffusion coefficient maps for differentiating triple-negative breast cancer from other subtypes of breast cancer on standard MRI. Cancer Manag Res. 2019;11:8239–8247. doi:10.2147/CMAR.S210583
17. Heacock L, Lewin AA, Gao Y, et al. Feasibility analysis of early temporal kinetics as a surrogate marker for breast tumor type, grade and aggressiveness. J Magn Reson Imag JMRI. 2018;47:1692–1700. doi:10.1002/jmri.25897
18. Leong LCH, Gombos EC, Jagadeesan J, Fook-Chong SMC. MRI kinetics with volumetric analysis in correlation with hormonal receptor subtypes and histologic grade of invasive breast cancers. AJR Am J Roentgenol. 2015;204:W348–W356. doi:10.2214/AJR.13.11486
19. Carriero A, Di Credico A, Mansour M, Bonomo L. Maximum intensity projection analysis in magnetic resonance of the breast. J Exp Clin Cancer Res CR. 2002;21:77–81.
20. Bhattarai S, Saini G, Li H, et al. Predicting neoadjuvant treatment response in triple-negative breast cancer using machine learning. Diagn Basel Switz. 2023;14:74. doi:10.3390/diagnostics14010074
21. Montazeri M, Montazeri M, Montazeri M, Beigzadeh A. Machine learning models in breast cancer survival prediction. Technol Health Care off J Eur Soc Eng Med. 2016;24:31–42. doi:10.3233/THC-151071
22. Wu J, Hicks C. Breast cancer type classification using machine learning. J Pers Med. 2021;11:61. doi:10.3390/jpm11020061
23. Ma M, Liu R, Wen C, et al. Predicting the molecular subtype of breast cancer and identifying interpretable imaging features using machine learning algorithms. Eur Radiol. 2022;32:1652–1662. doi:10.1007/s00330-021-08271-4
24. Kul S, Cansu A, Alhan E, et al. Contribution of diffusion-weighted imaging to dynamic contrast-enhanced MRI in the characterization of breast tumors. AJR Am J Roentgenol. 2011;196:210–217. doi:10.2214/AJR.10.4258
25. Han M, Kim TH, Kang DK, et al. Prognostic role of MRI enhancement features in patients with breast cancer: value of adjacent vessel sign and increased ipsilateral whole-breast vascularity. Am J Roentgenol. 2012;199(4):921–928. doi:10.2214/AJR.11.7895
26. Dietzel M, Baltzer PAT, Vag T, et al. The adjacent vessel sign on breast MRI: new data and a subgroup analysis for 1084 histologically verified cases. Korean J Radiol. 2010;11:178–186. doi:10.3348/kjr.2010.11.2.178
27. Fischer DR, Wurdinger S, Boettcher J, et al. Further signs in the evaluation of magnetic resonance mammography: a retrospective study. Invest Radiol. 2005;40(7):430–435. doi:10.1097/01.rli.0000167138.52283.aa
28. Liu P, Bao R, Niu Y, Yu Y. Breast lesions: correlation of dynamic contrast enhancement patterns on MR images with tumor angiogenesis. Chin J Clin Oncol. 2004;1:78–85. doi:10.1007/BF02759452
29. Weidner N, Semple JP, Welch WR, Folkman J. Tumor angiogenesis and metastasis — correlation in invasive breast carcinoma. N Engl J Med. 1991;324:1–8. doi:10.1056/NEJM199101033240101
30. Kuhl CK, Mielcareck P, Klaschik S, et al. Dynamic breast MR imaging: are signal intensity time course data useful for differential diagnosis of enhancing lesions. Radiology. 1999;211:101–110. doi:10.1148/radiology.211.1.r99ap38101
31. Li C, Liu, M, Li, J et al. (). Machine learning predicts the prognosis of breast cancer patients with initial bone metastases. Front Public Health., 2022;10:1003976. doi:10.3389/fpubh.2022.1003976
32. Kursa MB, Rudnicki WR. Feature selection with the boruta package. J Stat Softw. 2010;36:1–13. doi:10.18637/jss.v036.i11
33. Krizmanich-Conniff KM, Paramagul C, Patterson SK, et al. Triple receptor–negative breast cancer: imaging and clinical characteristics. Am J Roentgenol. 2012;199:458–464. doi:10.2214/AJR.10.6096
34. Chen T, Guestrin C. XGBoost: a Scalable Tree Boosting System. In:
35. Mohammed RAA, Ellis IO, Mahmmod AM, et al. Lymphatic and blood vessels in basal and triple-negative breast cancers: characteristics and prognostic significance. Mod Pathol off J U S Can Acad Pathol Inc. 2011;24:774–785. doi:10.1038/modpathol.2011.4
36. Mirando AC, Patil A, Rafie CI, et al. Regulation of the tumor immune microenvironment and vascular normalization in TNBC murine models by a novel peptide. Oncoimmunology. 2020;9:1760685. doi:10.1080/2162402X.2020.1760685
37. Linderholm BK, Hellborg H, Johansson U, et al. Significantly higher levels of vascular endothelial growth factor (VEGF) and shorter survival times for patients with primary operable triple-negative breast cancer. Ann Oncol off J Eur Soc Med Oncol. 2009;20:1639–1646. doi:10.1093/annonc/mdp062
38. Christmas BJ, Rafie CI, Hopkins AC, et al. Entinostat converts immune-resistant breast and pancreatic cancers into checkpoint-responsive tumors by reprogramming tumor-infiltrating MDSCs. Cancer Immunol Res. 2018;6:1561–1577. doi:10.1158/2326-6066.CIR-18-0070
39. Qian B, Pollard JW. Macrophage diversity enhances tumor progression and metastasis. Cell. 2010;141:39–51. doi:10.1016/j.cell.2010.03.014
40. Uematsu T, Kasami M, Yuen S. Triple-negative breast cancer: correlation between MR imaging and pathologic findings. Radiology. 2009;250:638–647. doi:10.1148/radiol.2503081054
41. Angelini G, Marini C, Iacconi C, et al. Magnetic resonance (MR) features in triple negative breast cancer (TNBC) vs receptor positive cancer (nTNBC). Clin Imaging. 2018;49:12–16. doi:10.1016/j.clinimag.2017.10.016
42. Jeh SK, Kim SH, Kim HS, et al. Correlation of the apparent diffusion coefficient value and dynamic magnetic resonance imaging findings with prognostic factors in invasive ductal carcinoma. J Magn Reson Imag JMRI. 2011;33:102–109. doi:10.1002/jmri.22400
43. Teifke A, Behr O, Schmidt M, et al. Dynamic MR imaging of breast lesions: correlation with microvessel distribution pattern and histologic characteristics of prognosis. Radiology. 2006;239:351–360. doi:10.1148/radiol.2392050205
44. Kobayashi M, Kawashima H, Matsui O, et al. Two different types of ring-like enhancement on dynamic MR imaging in breast cancer: correlation with the histopathologic findings. J Magn Reson Imag JMRI. 2008;28:1435–1443. doi:10.1002/jmri.21622
45. Zhao S, Tan R, Xiu J, et al. Adjacent vessel sign and breast imaging reporting and data system are valuable for diagnosis of benign and malignant breast lesions. Biotechnol Biotechnol Equip. 2014;28(6):1121–1126. doi:10.1080/13102818.2014.974016
46. Verardi N, Di Leo G, Carbonaro LA, et al. Contrast-enhanced MR imaging of the breast: association between asymmetric increased breast vascularity and ipsilateral cancer in a consecutive series of 197 patients. Radiol Med. 2013;118:239–250. doi:10.1007/s11547-012-0864-0
47. Chen H, Min Y, Xiang K, et al. DCE-MRI performance in triple negative breast cancers: comparison with non-triple negative breast cancers. Curr Med Imaging. 2022;18:970–976. doi:10.2174/1573405618666220225090944
48. Kim JY, Kim SH, Kim YJ, et al. Enhancement parameters on dynamic contrast enhanced breast MRI: do they correlate with prognostic factors and subtypes of breast cancers? Magn Reson Imaging. 2015;33:72–80. doi:10.1016/j.mri.2014.08.034
49. Buadu LD, Murakami J, Murayama S, et al. Breast lesions: correlation of contrast medium enhancement patterns on MR images with histopathologic findings and tumor angiogenesis. Radiology. 1996;200:639–649. doi:10.1148/radiology.200.3.8756909
50. Eby PR, Partridge SC, White SW, et al. Metabolic and vascular features of dynamic contrast-enhanced breast magnetic resonance imaging and (15)O-water positron emission tomography blood flow in breast cancer. Acad Radiol. 2008;15:1246–1254. doi:10.1016/j.acra.2008.03.019
51. Bonzanini M, Morelli L, Bonandini EM, et al. Cytologic features of triple-negative breast carcinoma. Cancer Cytopathol. 2012;120(6):401–409. doi:10.1002/cncy.21207
52. Liao GJ, Bancroft LH, Strigel RM, et al. Background parenchymal enhancement on breast mri: a comprehensive review. J Magn Reson Imag JMRI. 2020;51:43–61. doi:10.1002/jmri.26762
53. Wu J, Sun X, Wang J, et al. Identifying relations between imaging phenotypes and molecular subtypes of breast cancer: model discovery and external validation. J Magn Reson Imag JMRI. 2017;46:1017–1027. doi:10.1002/jmri.25661
54. Dilorenzo G, Telegrafo M, La Forgia D, et al. Breast MRI background parenchymal enhancement as an imaging bridge to molecular cancer sub-type. Eur J Radiol. 2019;113:148–152. doi:10.1016/j.ejrad.2019.02.018
55. You C, Zhang Y, Chen Y, et al. Evaluation of background parenchymal enhancement and histogram-based diffusion-weighted image in determining the molecular subtype of breast cancer. J Comput Assist Tomogr. 2021;45:711–716. doi:10.1097/RCT.0000000000001239
56. Ha R, Mango V, Al-Khalili R, et al. Evaluation of association between degree of background parenchymal enhancement on MRI and breast cancer subtype. Clin Imaging. 2018;51:307–310. doi:10.1016/j.clinimag.2018.05.008
57. Öztürk VS, Polat YD, Soyder A, et al. The relationship between MRI findings and molecular subtypes in women with breast cancer. Curr Probl Diagn Radiol. 2020;49:417–421. doi:10.1067/j.cpradiol.2019.07.003
58. Chen Y, Wang L, Luo R, et al. Focal breast edema and breast edema score on T2-weighted images provides valuable biological information for invasive breast cancer. Insights Imaging. 2023;14:73. doi:10.1186/s13244-023-01424-7
59. Panzironi G, Moffa G, Galati F, et al. Peritumoral edema as a biomarker of the aggressiveness of breast cancer: results of a retrospective study on a 3 T scanner. Breast Cancer Res Treat. 2020;181(1):53–60. doi:10.1007/s10549-020-05592-8
60. Chen H, Meng X, Hao X, et al. Correlation analysis of pathological features and axillary lymph node metastasis in patients with invasive breast cancer. J Immunol Res. 2022;2022:1–7. doi:10.1155/2022/7150304
61. Chung MJ, Lee JH, Kim SH, et al. Simple prediction model of axillary lymph node positivity after analyzing molecular and clinical factors in early breast cancer. Medicine. 2016:95:e3689. doi:10.1097/MD.0000000000003689.
62. Chintapally N, Englander K, Gallagher J, et al. Tumor characteristics associated with axillary nodal positivity in triple negative breast cancer. Diseases. 2023;11:118. doi:10.3390/diseases11030118
63. Jamaris S, Jamaluddin J, Islam T, et al. Is pre-operative axillary ultrasound alone sufficient to determine need for axillary dissection in early breast cancer patients? Medicine. 2021100:e25412. doi:10.1097/MD.0000000000025412.
64. Mathe A, Wong-Brown M, Morten B, et al. Novel genes associated with lymph node metastasis in triple negative breast cancer. Sci Rep. 2015;5:15832. doi:10.1038/srep15832
65. Kim WH, Han W, Chang JM, et al. Location of triple-negative breast cancers: comparison with estrogen receptor-positive breast cancers on MR imaging. PLoS One. 2015;10:e0116344. doi:10.1371/journal.pone.0116344
66. Meyer H-J, Wienke A, Surov A. Diffusion-weighted imaging of different breast cancer molecular subtypes: a systematic review and meta-analysis. Breast Care. 2022;17:47. doi:10.1159/000514407
67. Meyer H-J, Wienke A, Surov A. Association between VEGF expression and diffusion weighted imaging in several tumors—A systematic review and meta-analysis. Diagnostics. 2019;9:126. doi:10.3390/diagnostics9040126
 © 2025 The Author(s). This work is published and licensed by Dove Medical Press Limited. The
full terms of this license are available at https://www.dovepress.com/terms
and incorporate the Creative Commons Attribution
- Non Commercial (unported, 4.0) License.
By accessing the work you hereby accept the Terms. Non-commercial uses of the work are permitted
without any further permission from Dove Medical Press Limited, provided the work is properly
attributed. For permission for commercial use of this work, please see paragraphs 4.2 and 5 of our Terms.
© 2025 The Author(s). This work is published and licensed by Dove Medical Press Limited. The
full terms of this license are available at https://www.dovepress.com/terms
and incorporate the Creative Commons Attribution
- Non Commercial (unported, 4.0) License.
By accessing the work you hereby accept the Terms. Non-commercial uses of the work are permitted
without any further permission from Dove Medical Press Limited, provided the work is properly
attributed. For permission for commercial use of this work, please see paragraphs 4.2 and 5 of our Terms.