Back to Journals » Neuropsychiatric Disease and Treatment » Volume 12
A longitudinal, event-related potential pilot study of adult obsessive-compulsive disorder with 1-year follow-up
Authors Yamamuro K, Okada K, Kishimoto N, Ota T ![]() , Iida J, Kishimoto T
, Iida J, Kishimoto T
Received 13 July 2016
Accepted for publication 10 August 2016
Published 26 September 2016 Volume 2016:12 Pages 2463—2471
DOI https://doi.org/10.2147/NDT.S117100
Checked for plagiarism Yes
Review by Single anonymous peer review
Peer reviewer comments 2
Editor who approved publication: Professor Taro Kishi
Kazuhiko Yamamuro,1 Koji Okada,2 Naoko Kishimoto,1 Toyosaku Ota,1 Junzo Iida,3 Toshifumi Kishimoto1
1Department of Psychiatry, Nara Medical University School of Medicine, 2Department of Psychiatry, Jingumaecocorono-Clinic, 3Faculty of Nursing, Nara Medical University School of Medicine, Kashihara, Japan
Aim: Earlier brain imaging research studies have suggested that brain abnormalities in obsessive-compulsive disorder (OCD) normalize as clinical symptoms improve. However, although many studies have investigated event-related potentials (ERPs) in patients with OCD compared with healthy control subjects, it is currently unknown whether ERP changes reflect pharmacological and psychotherapeutic effects. As such, the current study examined the neurocognitive components of OCD to elucidate the pathophysiological abnormalities involved in the disorder, including the frontal-subcortical circuits.
Methods: The Yale-Brown Obsessive-Compulsive Scale was used to evaluate 14 adult patients with OCD. The present study also included ten age-, sex-, and IQ-matched controls. The P300 and mismatch negativity (MMN) components during an auditory oddball task at baseline for both groups and after 1 year of treatment for patients with OCD were measured.
Results: Compared with controls, P300 amplitude was attenuated in the OCD group at Cz and C4 at baseline. Pharmacotherapy and psychotherapy treatment for 1 year reduced OCD symptomology. P300 amplitude after 1 year of treatment was significantly increased, indicating normalization compared with baseline at Fz, Cz, C3, and C4. We found no differences in P300 latency, MMN amplitude, or MMN latency between baseline and after one year of treatment.
Conclusion: ERPs may be a useful tool for evaluating pharmacological and cognitive behavioral therapy in adult patients with OCD.
Keywords: obsessive-compulsive disorder, event-related potentials, P300, mismatch negativity, improvement
Introduction
Obsessive-compulsive disorder (OCD) is characterized by recurrent intrusive thoughts and repetitive behaviors that are sufficiently severe to interfere with daily functioning and has a lifetime prevalence of 2%–3%.1 OCD is a chronic disorder with substantial impacts on the functional capacity and quality of life of patients.2 Although the clinical manifestations of OCD are well-characterized, the neurobiological mechanisms underlying the disorder remain unclear.
Many studies have investigated the relationship between obsessive-compulsive symptomatology and a variety of brain structures. Structural and functional neuroimaging studies of young people and adults with OCD have suggested an impairment of the cortico–striatal–thalamic–cortical circuits.3–6 In addition, positron emission tomography studies have shown increased glucose metabolism in patients with OCD, particularly in the orbitofrontal cortex (OFC), anterior cingulate cortex, and caudate nucleus.7–10 Similarly, studies of patients with OCD using single-photon emission computed tomography have indicated dysfunction in the OFC and caudate nucleus.11,12 Several functional magnetic resonance imaging studies have indicated overactivity in the OFC, anterior cingulate cortex, caudate nucleus, and thalamus.13–16 Taken together, these findings have informed the most prevalent view of the pathophysiology of OCD, which proposes that the disorder is caused by abnormal activation of neural circuits encompassing the prefrontal cortex and basal ganglia, resulting in a disinhibition of abnormal or maladaptive habits, over which patients are unable to exert sufficient cognitive control.5,17
Event-related potentials (ERPs) are commonly used as a physiological measure of cognitive function, as they are easily measured and noninvasive, allowing the exploration of the underlying neurophysiological mechanisms and characteristics of the cognitive dysfunction of several psychiatric disorders, including pediatric OCD18 and attention deficit/hyperactivity disorder.19 The P300 component, which is observed ~300 ms after stimulus onset, is considered an index of information processing in the brain. It has been used to assess the mechanisms involved in updating cognitive models of the environment for the production of appropriate responses,20 the information processing involved in consciousness,21 and template matching.22 Moreover, it has been reported to occur within a widely distributed network, including the medial temporal lobe, temporoparietal junction, OFC, and cingulate cortex.20,23,24 Mismatch negativity (MMN) is commonly used as a measure of a distinctive stimulus discrimination process involving sensory memory of previously presented stimuli and is considered an important mechanism for the rapid detection of changes in the external environment that are outside of explicit consciousness.25 Thus, MMN appears to reflect an automatic cerebral discrimination process that is not under conscious control. Several previous studies of patients with OCD have found inconsistent ERP abnormalities, including shortened P300 latency.26–30 However, other studies have reported prolonged latency in patients with OCD.31 Similarly, while some studies have reported increased P300 amplitude in people with OCD,32 others have reported decreased P300 amplitude.31,33 As such, it remains unclear whether ERPs reflect the pharmacological and/or cognitive behavioral components of OCD.
In the present study, ERPs were used to examine cognitive function during an auditory oddball task in patients with OCD. It was hypothesized that patients with OCD would show abnormal P300 and MMN components and that the affected ERPs would improve, at least partly, after 1 year of treatment that led to clinical improvement. To test this hypothesis, ERPs were measured during an auditory oddball task for patients with OCD, compared with age- and sex-matched control subjects. Moreover, ERP activity was also compared at baseline and after 1 year of treatment in patients with OCD.
Methods
Participants
We recruited 14 individuals with OCD (nine males, mean age 34.89 years [standard deviation, SD =11.56]; five females, mean age 29.60 years [SD =6.84]) from the outpatient clinic at the Department of Psychiatry at Nara Medical University, Japan (Table 1). In addition, 10 age-, sex-, and IQ-matched healthy controls were recruited. The absence of any psychiatric diagnosis in the control group was confirmed using a standard clinical assessment that included a psychiatric evaluation and a structured diagnostic interview (Structured Clinical Interview for Diagnostic and Statistical Manual of Mental Disorders, 4th Edition, Text Revision [DSM-IV-TR] Axis Disorders Non-Patient Edition). All the participants in the OCD patient group were right-handed and of Japanese descent and were diagnosed with OCD according to the DSM-IV-TR. All participants and/or their caregivers provided written informed consent for their participation in the study. This study was approved by the Institutional Review Board at Nara Medical University.
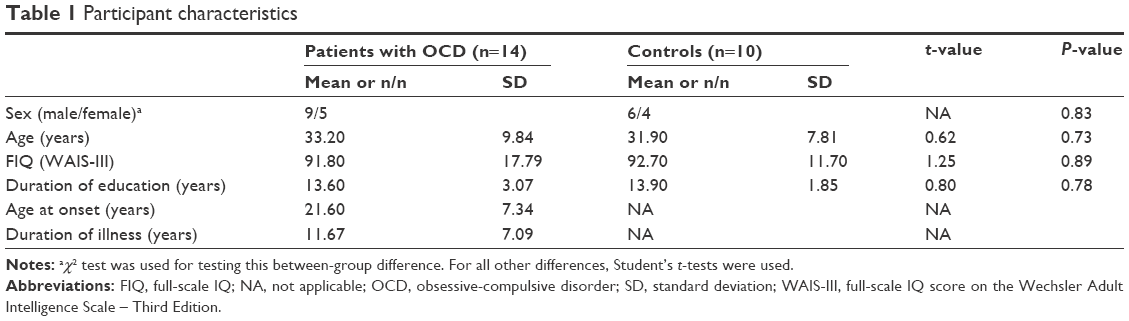 | Table 1 Participant characteristics |
Patients were deemed eligible if they had received a DSM-IV diagnosis of OCD, according to a standard clinical assessment comprising a psychiatric evaluation, a structured diagnostic interview (Structured Clinical Interview for DSM-IV Axis I Disorders Patients Edition), and a medical history evaluation conducted by experienced psychiatrists. None of the patients with OCD had comorbidity with attention deficit/hyperactivity disorder, major depressive disorder, anxiety disorder, personality disorder, schizophrenia, autism spectrum disorder, or epilepsy. All patients selected for the present study had been medicated for OCD. In addition, all patients had received standard treatments, including pharmacotherapy and psychotherapy and had received psychotherapy for ~1 year (once or twice per month). In addition, 12 patients have been treated with selective serotonin reuptake inhibitors, such as fluvoxamine, paroxetine, and sertraline, and two patients had received tetracyclic antidepressants, such as clomipramine. In the current study, the baseline was defined as the first day of testing; the post-treatment assessment occurred ~1 year after the baseline test. On average, patients received 147.31 mg (SD =68.15) of clomipramine equivalent at the baseline and an average of 128.08 mg (SD =60.33) of clomipramine equivalent at post-treatment.
Exclusion criteria included any neurological disorder, head injury, serious medical condition, or a history of substance abuse/dependence. We assessed the intellectual ability of participants using the Wechsler Adult Intelligence Scale (Third Edition). Individuals with full-scale IQ scores <70 were identified by a trained psychologist and excluded from the study. Finally, 14 patients with OCD and ten controls were enrolled in the present study. None of the participants dropped out of the study.
Assessment of OCD symptoms
The Yale-Brown Obsessive-Compulsive Scale (Y-BOCS)34 was used to evaluate the symptoms of patients with OCD. The Y-BOCS is a well-accepted ten-item semistructured clinician-rated instrument designed to assess the presence and severity of current OCD symptoms. Obsessions and compulsions are each rated using five items, with a 5-point scale (with scores ranging from 0 to 4), to assess multiple domains of OCD symptom severity, including time, interference, distress, resistance, and control. Consequently, the Y-BOCS yields an obsession score (0–20), a compulsion score (0–20), and a combined total score (0–40), with higher scores indicating higher symptom severity. Participants with OCD were assessed with the Y-BOCS on the same day that ERPs were measured. However, the Y-BOCS symptom checklist was not used.
Task
On the basis of the guidelines for evoked potential measurements, the P300 component was elicited using an auditory oddball task.35 Auditory stimuli were delivered through headphones at an intensity of 80 dB using two different oddball paradigms. We used an NEC Multi Stim II auditory stimulus system (NEC, Tokyo, Japan). Target stimuli were presented infrequently, as 2,000 Hz tone bursts (P=0.2). Nontarget stimuli were presented frequently, as 1,000 Hz bursts (P=0.8). Both the types of stimuli were presented for 50 ms at 1.5-second intervals and at an intensity of 80 dB, with 10 ms rise/fall times. Infrequent and frequent stimuli were randomly presented through headphones. Participants were instructed to keep their eyes open, to listen carefully for the target stimuli, and to press a response button as quickly as possible upon hearing each target stimulus. They were also asked to report any prior hearing abnormalities, but no formal hearing test was conducted before enrollment. The physical examination or neuroimaging did not reveal auditory canal anomalies in all participants.
The same system was used to elicit MMN components. Standard stimuli were 1,000 Hz tone bursts (P=0.9) and deviant stimuli were 1,100 Hz bursts (P=0.1). Stimuli were presented for 50 ms at 500 ms intervals and at an intensity of 80 dB. The infrequent and frequent stimuli were randomly presented through headphones. MMN components were measured while participants were instructed to read a book or magazine of their choice, without paying particular attention to the auditory stimuli.
Recording and analysis
ERPs were recorded with an MEB 2200 evoked potential measuring system (Nihon Kohden, Tokyo, Japan). Electroencephalograms were obtained at Fz, Cz, Pz, C3, and C4 positions on the scalp using disk electrodes. All electrodes were re-referenced offline to the average of the two mastoid electrodes. The impedance of the electrodes was set at ≤5 kΩ, and the P300 was analyzed during the period between 200 ms prestimulus and 750 ms poststimulus. MMN was analyzed during the period between the 50 ms prestimulus and 360 ms poststimulus. Artifact-free responses to the stimuli were summed and averaged after electroencephalogram amplitude data ≥100 μV. To reduce high-frequency content irrelevant to the components of interest, a digital bandpass filter set from 0.5 to 70 Hz (attenuation by 12 dB/octave) was used on all data before conducting analyses. Finally, data were corrected for eye-movement artifacts.36
To prevent participants from becoming tired of, or used to, performing the tasks, each trial was conducted only once. The mean response to infrequent targets was calculated by averaging across 30 trials.
P300
The duration of the auditory oddball task was 240 seconds. Infrequent and frequent stimuli were presented 30 and 120 times, respectively. The sample rate was 1,000 Hz. Thirty responses to infrequent target stimuli were averaged. The P300 was identified as a positive wave with a peak latency occurring between 250 and 550 ms, and its mean latency and amplitude were calculated.
MMN
The duration of the auditory oddball task was 250 seconds. Infrequent and frequent stimuli were presented 50 and 450 times, respectively. The sample rate was 5,000 Hz. The 450 responses to the frequent standard stimuli and the 50 responses to the infrequent deviant stimuli were averaged separately, and a waveform was calculated as the difference between the averaged waveforms (frequent minus infrequent). MMN was identified from the difference waveform as a negative wave with a peak latency between 100 and 250 ms, and its latency and amplitude were recorded.
Statistical analyses
We analyzed differences in the demographic and clinical characteristics between OCD and control groups using χ2 tests for categorical variables, and Student’s t-tests for the other variables (P<0.05 was considered significant). We compared the latencies and amplitudes of both the P300 and MMN components between baseline and 1 year posttreatment using a two-tailed paired t-test. Spearman’s correlation coefficients (r) were calculated for the relationships between OCD scores and electrophysiological variables (P<0.05 was considered statistically significant). We used Predictive Analytics Software Statistics 18.0 J for Windows (SPSS, Tokyo, Japan) to conduct the statistical analyses.
Results
Demographic data
The demographic characteristics of the study participants are presented in Table 1. The participant groups did not differ in terms of sex (χ2=1, df=1, P=0.83), average age (t=0.62, df=22, P=0.73), average full-scale IQ (t=1.25, df=22, P=0.89), or average duration of education (t=0.80, df=22, P=0.78). One year of pharmacotherapy and psychotherapy improved OCD symptoms, according to obsession scores (t=2.42, df=13, uncorrected P<0.05), compulsion scores (t=7.06, df=13, uncorrected P<0.001), and combined total scores (t=4.36, df=13, uncorrected P<0.01; Table 2).
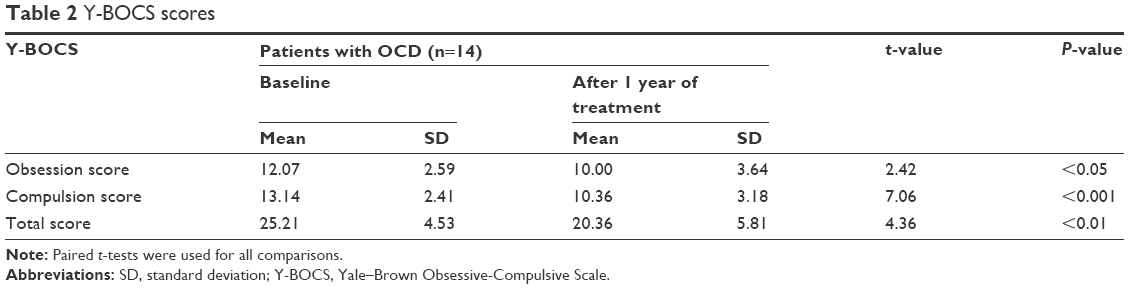 | Table 2 Y-BOCS scores |
ERP components in control subjects and patients with OCD before 1 year of treatment
Component amplitudes and latencies are shown in Table 3. It was found that the grand average of the P300 amplitude in the OCD group was significantly smaller than that in the control group at Cz (t=2.25, df=13, uncorrected P<0.05) and C4 (t=1.77, df =13, uncorrected P<0.05). There were no significant differences in the grand average of the P300 latency between the OCD and control groups and also no significant differences in the grand average MMN amplitude or latency between the OCD and control groups.
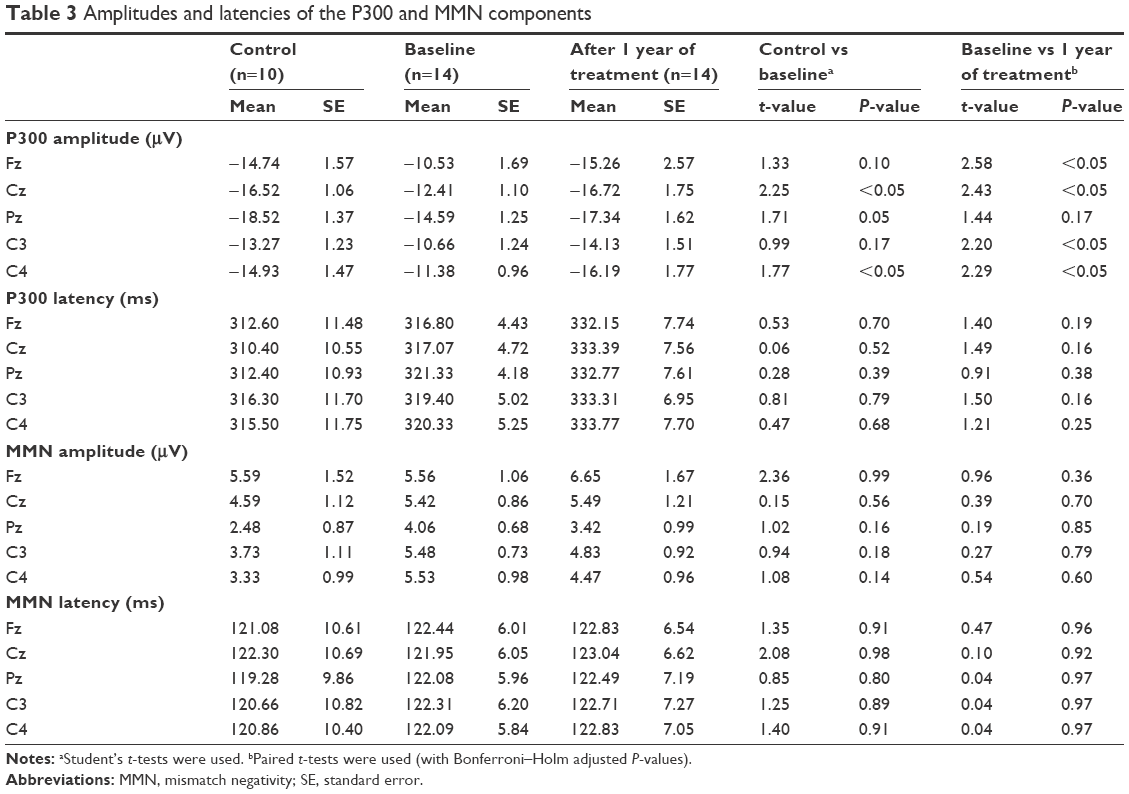 | Table 3 Amplitudes and latencies of the P300 and MMN components |
ERP components between baseline and after 1 year of treatment
The grand average of the P300 in people with OCD at 1 year follow-up was lower than that at baseline (Figure 1). The amplitudes and latencies are shown in Table 3. The mean P300 amplitude for people with OCD at the 1 year follow-up was significantly greater than that at baseline at Fz (t=2.58, df=13, corrected P<0.05), Cz (t=2.43, df=13, corrected P<0.05), C3 (t=2.20, df=13, corrected P<0.05), and C4 (t=2.29, df=13, corrected P<0.05). No differences were found in P300 latency in patients with OCD between baseline and after 1 year of treatment. Furthermore, there were no differences in the mean MMN amplitude or latency in OCD patients between baseline and after 1 year of treatment (Figure 2).
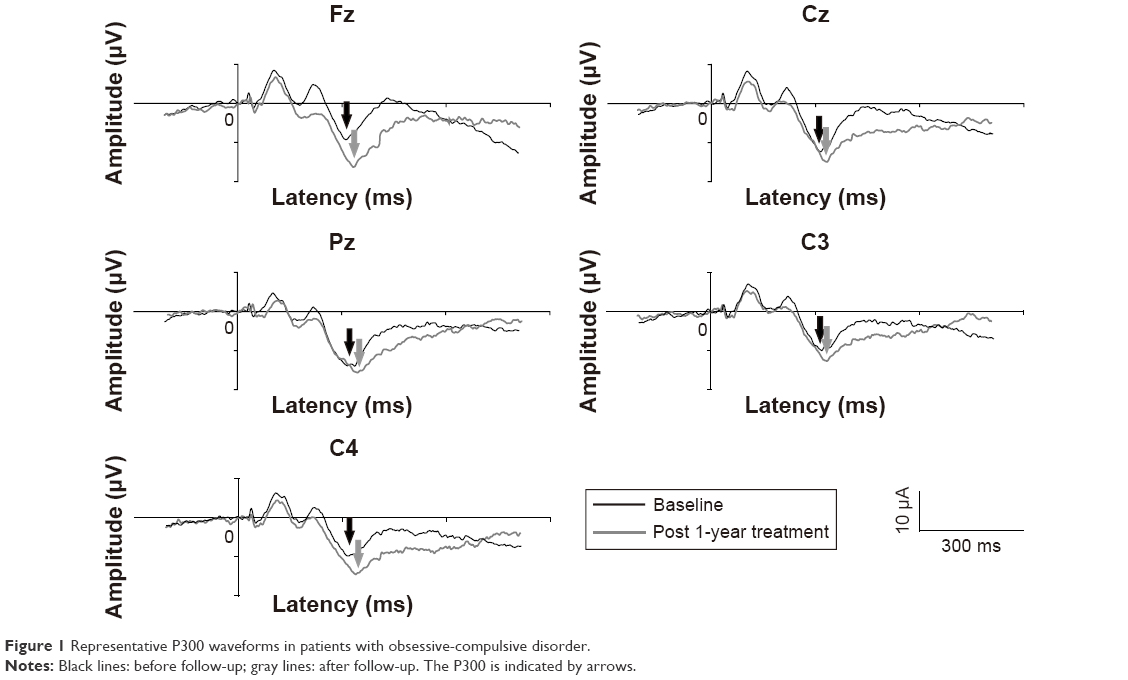 | Figure 1 Representative P300 waveforms in patients with obsessive-compulsive disorder. |
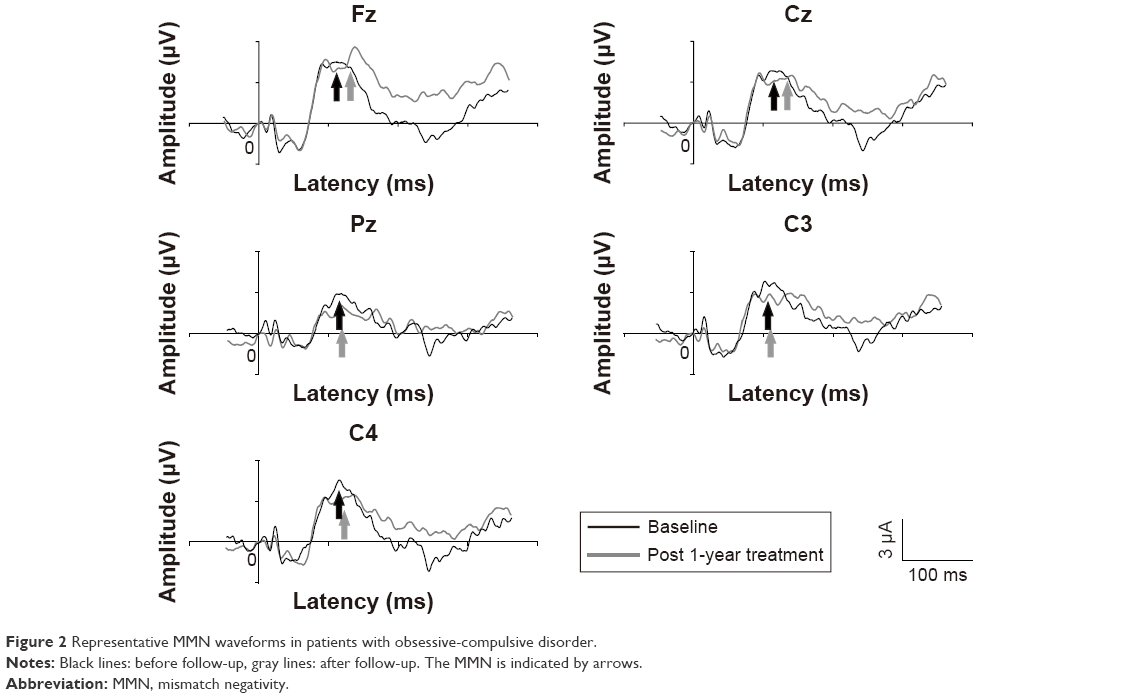 | Figure 2 Representative MMN waveforms in patients with obsessive-compulsive disorder. |
Correlations between P300 amplitude and participant characteristics
As the patients varied considerably in terms of P300 amplitude, Spearman’s ρ (rho) correlations between P300 amplitude and age, full-scale IQ, duration of illness, Y-BOCS score, and medication dose (clomipramine equivalent; Table 4) were calculated, and no correlations were found between P300 amplitude and these indices in either group.
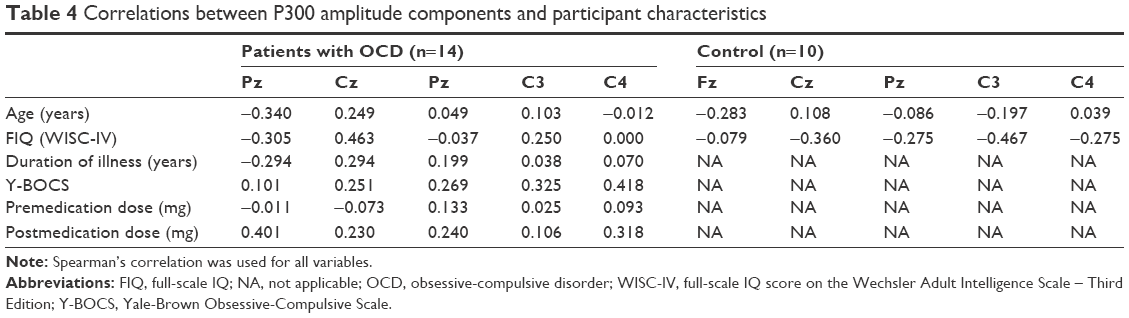 | Table 4 Correlations between P300 amplitude components and participant characteristics |
Discussion
To the best of our knowledge, only one previous study, by Sanz et al, reported increased P300 amplitude at Pz in patients with OCD after treatment during an auditory oddball task, and this was only a near-significant trend rather than a significant increase.31 However, Sanz et al did not investigate any other ERP components. Because OCD is reported to be related to prefrontal cortex impairment, ERPs were examined at Fz, Cz, C3, and C4, as well as Pz, to compare the P300 and MMN in individuals with OCD between baseline and after 1 year of treatment, using an auditory oddball task. We found that the OCD group showed significantly lower P300 amplitudes at Cz and C4 than healthy control participants. In addition, those in the OCD group exhibited significantly greater P300 amplitudes at Fz, Cz, C3, and C4 after 1 year of treatment, compared with pretreatment baseline. These findings suggest that P300 amplitude abnormalities at least partially improved after 1 year of pharmacotherapy and psychotherapy treatment.
In the present study, patients with OCD showed significantly lower P300 amplitudes at Cz and C4 compared with healthy controls. This finding is inconsistent with previous studies investigating ERP components in adult and pediatric OCD patients and controls.26,29,30,32 One possible explanation for this inconsistency is that this electrophysiological abnormality may be influenced by OCD severity. Another possibility is that the effect size for this dysfunction was small and may be more difficult to detect in smaller samples. Finally, another possible explanation is that ERP measurements in adult OCD patients might be influenced by comorbidity and longer illness duration. However, it should also be noted that our findings are consistent with one previous study of pediatric OCD patients,18 and several other studies of adult patients with OCD.31,33
Various techniques have been used to compare brain abnormalities between baseline and following treatment for OCD. Treatment effects on brain activation in OCD patients have primarily been investigated in adults. Some researchers have reported OFC hyperactivity in individuals with OCD, which decreased after pharmacological treatment.37–40 By contrast, other studies reported an inverse relationship between brain activity and response to pharmacological treatment.38,41–43 Sanz et al31 examined the P300 component at Pz in 18 adult patients with OCD and 19 healthy controls during an auditory oddball task. They observed a lower P300 amplitude and longer P300 latency in patients with OCD compared with control subjects. Additionally, a trend toward increased P300 amplitude was observed in patients with OCD after treatment. In the present study, we found that P300 amplitude was significantly enhanced after 1 year of treatment, resulting in a normalization of measurements at Fz, Cz, C3, and C4. This might indicate that the pathophysiology of OCD involves the cortico-striatal-thalamo-cortical circuits, particularly the prefrontal cortex. Moreover, several studies of adult patients with OCD have suggested that P300 amplitude may be linked to the patient’s likelihood of responding to treatment.19,44 These findings suggest that cognitive function in patients with OCD changes with improvements in clinical symptoms following treatment. From a neurocognitive perspective, P300 amplitude has been related to contextual memory updating44 and response certainty.19 Relative to healthy controls, participants with OCD have been reported to exhibit poorer performance on tests of logical memory, short-term and long-term visual memory.45–47 It has also been proposed that uncertainty and low confidence levels might impede information processing in patients with OCD, resulting in memory impairment.19,44 Repetitive thoughts and actions characterizing OCD may be related to repetitive neural signals indicating that a task has not been adequately carried out.48 The resulting uncertainty could impact on memory functions and, consequently, on the capacity to inhibit thoughts and actions.46
Several potential limitations should be considered while interpreting the current findings. First, the sample size was relatively small. As such, it would be valuable for future studies to employ a larger sample size. Second, OCD symptoms were evaluated using the Y-BOCS alone. It may thus be helpful for future studies to employ a wider range of neuropsychological test batteries to validate the present findings. Third, the OCD patients in the current study were not treatment naïve at baseline, having already received treatment with several medications and/or psychotherapy. However, one might speculate whether our results are specific to such a population. Fourth, in an ideal experimental design, ERP components in control subjects would be assessed after 1 year, to control for P300 amplitude variation with age.49 However, because the follow-up period was relatively short and the age at baseline was relatively high, age is unlikely to have greatly influenced P300 amplitude. Fifth, no significant correlations were found between P300 amplitude and Y-BOCS, in contrast to a previous study that reported a relationship between P300 amplitude and Y-BOCS in children with OCD.18 Future studies should use a larger sample size to further investigate the correlations between ERP measurements and participant characteristics.
In conclusion, the present data revealed hypoactivation of the cortical circuits that mediate symptomatic expression of patients with OCD. This hypoactivation decreased after pharmacotherapy and psychotherapy and the improvement of symptoms. Thus, these findings suggest that ERPs can be used to measure pharmacological and cognitive behavioral effects in adult patients with OCD.
Acknowledgments
We wish to thank the participants for their involvement in the study. The authors would also like to thank NEC for the NEC Multi Stim II equipment and the skilled technical and methodological support.
Author contributions
All authors contributed toward data analysis, drafting and critically revising the paper, gave final approval of the version to be published, and agree to be accountable for all aspects of the work.
Disclosure
The authors report no conflicts of interest in this work.
References
Weissman MM, Bland RC, Canino GJ, et al. The cross national epidemiology of obsessive compulsive disorder. The Cross National Collaborative Group. J Clin Psychiatry. 1994;55(Suppl):5–10. | ||
Ruscio AM, Stein DJ, Chiu WT, Kessler RC. The epidemiology of obsessive-compulsive disorder in the National Comorbidity Survey Replication. Mol Psychiatry. 2010;15(1):53–63. | ||
Saxena S, Brody AL, Schwartz JM, Baxter LR. Neuroimaging and frontal-subcortical circuitry in obsessive-compulsive disorder. Br J Psychiatry Suppl. 1998(35):26–37. | ||
Saxena S, Bota RG, Brody AL. Brain-behavior relationships in obsessive-compulsive disorder. Semin Clin Neuropsychiatry. 2001;6(2):82–101. | ||
Graybiel AM, Rauch SL. Toward a neurobiology of obsessive-compulsive disorder. Neuron. 2000;28(2):343–347. | ||
Menzies L, Chamberlain SR, Laird AR, Thelen SM, Sahakian BJ, Bullmore ET. Integrating evidence from neuroimaging and neuropsychological studies of obsessive-compulsive disorder: the orbitofronto-striatal model revisited. Neurosci Biobehav Rev. 2008;32(3):525–549. | ||
Baxter LR Jr, Phelps ME, Mazziotta JC, Guze BH, Schwartz JM, Selin CE. Local cerebral glucose metabolic rates in obsessive-compulsive disorder. A comparison with rates in unipolar depression and in normal controls. Arch Gen Psychiatry. 1987;44(3):211–218. | ||
Evans DW, Lewis MD, Iobst E. The role of the orbitofrontal cortex in normally developing compulsive-like behaviors and obsessive-compulsive disorder. Brain Cogn. 2004;55(1):220–234. | ||
Swedo SE, Rapoport JL, Leonard H, Lenane M, Cheslow D. Obsessive-compulsive disorder in children and adolescents. Clinical phenomenology of 70 consecutive cases. Arch Gen Psychiatry. 1989;46(4):335–341. | ||
Swedo SE, Schapiro MB, Grady CL, et al. Cerebral glucose metabolism in childhood-onset obsessive-compulsive disorder. Arch Gen Psychiatry. 1989;46(6):518–523. | ||
Busatto GF, Zamignani DR, Buchpiguel CA, et al. A voxel-based investigation of regional cerebral blood flow abnormalities in obsessive-compulsive disorder using single photon emission computed tomography (SPECT). Psychiatry Res. 2000;99(1):15–27. | ||
Machlin SR, Harris GJ, Pearlson GD, Hoehn-Saric R, Jeffery P, Camargo EE. Elevated medial-frontal cerebral blood flow in obsessive-compulsive patients: a SPECT study. Am J Psychiatry. 1991;148(9):1240–1242. | ||
Pujol J, Torres L, Deus J, et al. Functional magnetic resonance imaging study of frontal lobe activation during word generation in obsessive-compulsive disorder. Biol Psychiatry. 1999;45(7):891–897. | ||
Ursu S, Stenger VA, Shear MK, Jones MR, Carter CS. Overactive action monitoring in obsessive-compulsive disorder: evidence from functional magnetic resonance imaging. Psychol Sci. 2003;14(4):347–353. | ||
Viard A, Flament MF, Artiges E, et al. Cognitive control in childhood-onset obsessive-compulsive disorder: a functional MRI study. Psychol Med. 2005;35(7):1007–1017. | ||
Rauch SL, Wedig MM, Wright CI, et al. Functional magnetic resonance imaging study of regional brain activation during implicit sequence learning in obsessive-compulsive disorder. Biol Psychiatry. 2007;61(3):330–336. | ||
Saxena S, Brody AL, Ho ML, et al. Cerebral metabolism in major depression and obsessive-compulsive disorder occurring separately and concurrently. Biol Psychiatry. 2001;50(3):159–170. | ||
Yamamuro K, Ota T, Nakanishi Y, et al. Event-related potentials in drug-naive pediatric patients with obsessive-compulsive disorder. Psychiatry Res. 2015;230(2):394–399. | ||
Kutas M, McCarthy G, Donchin E. Augmenting mental chronometry: the P300 as a measure of stimulus evaluation time. Science. 1977;197(4305):792–795. | ||
Linden DE. The p300: where in the brain is it produced and what does it tell us? Neuroscientist. 2005;11(6):563–576. | ||
Picton TW. The P300 wave of the human event-related potential. J Clin Neurophysiol. 1992;9(4):456–479. | ||
Hillyard SA, Squires KC, Bauer JW, Lindsay PH. Evoked potential correlates of auditory signal detection. Science. 1971;172(3990):1357–1360. | ||
Brazdil M, Dobsik M, Mikl M, et al. Combined event-related fMRI and intracerebral ERP study of an auditory oddball task. NeuroImage. 2005;26(1):285–293. | ||
Mulert C, Pogarell O, Juckel G, et al. The neural basis of the P300 potential. Focus on the time-course of the underlying cortical generators. Eur Arch Psychiatry Clin Neurosci. 2004;254(3):190–198. | ||
Jonkman LM, Kemner C, Verbaten MN, et al. Event-related potentials and performance of attention-deficit hyperactivity disorder: children and normal controls in auditory and visual selective attention tasks. Biol Psychiatry. 1997;41(5):595–611. | ||
Miyata A, Matsunaga H, Kiriike N, Iwasaki Y, Takei Y, Yamagami S. Event-related potentials in patients with obsessive-compulsive disorder. Psychiatry Clin Neurosci. 1998;52(5):513–518. | ||
Morault P, Guillem F, Bourgeois M, Paty J. Improvement predictors in obsessive-compulsive disorder. An event-related potential study. Psychiatry Res. 1998;81(1):87–96. | ||
Morault PM, Bourgeois M, Laville J, Bensch C, Paty J. Psychophysiological and clinical value of event-related potentials in obsessive-compulsive disorder. Biol Psychiatry. 1997;42(1):46–56. | ||
Towey J, Bruder G, Hollander E, et al. Endogenous event-related potentials in obsessive-compulsive disorder. Biol Psychiatry. 1990;28(2):92–98. | ||
Towey J, Bruder G, Tenke C, et al. Event-related potential and clinical correlates of neurodysfunction in obsessive-compulsive disorder. Psychiatry Res. 1993;49(2):167–181. | ||
Sanz M, Molina V, Martin-Loeches M, Calcedo A, Rubia FJ. Auditory P300 event related potential and serotonin reuptake inhibitor treatment in obsessive-compulsive disorder patients. Psychiatry Res. 2001;101(1):75–81. | ||
Towey JP, Tenke CE, Bruder GE, et al. Brain event-related potential correlates of overfocused attention in obsessive-compulsive disorder. Psychophysiology. 1994;31(6):535–543. | ||
Malloy P, Rasmussen S, Braden W, Haier RJ. Topographic evoked potential mapping in obsessive-compulsive disorder: evidence of frontal lobe dysfunction. Psychiatry Res. 1989;28(1):63–71. | ||
Nakajima T, Nakamura M, Taga C, et al. Reliability and validity of the Japanese version of the Yale-Brown Obsessive-Compulsive Scale. Psychiatry Clin Neurosci. 1995;49(2):121–126. | ||
Picton TW, Bentin S, Berg P, et al. Guidelines for using human event-related potentials to study cognition: recording standards and publication criteria. Psychophysiology. 2000;37(2):127–152. | ||
Gratton G, Coles MG, Donchin E. A new method for off-line removal of ocular artifact. Electroencephalogr Clin Neurophysiol. 1983;55(4):468–484. | ||
Rubin RT, Ananth J, Villanueva-Meyer J, Trajmar PG, Mena I. Regional 133xenon cerebral blood flow and cerebral 99mTc-HMPAO uptake in patients with obsessive-compulsive disorder before and during treatment. Biol Psychiatry. 1995;38(7):429–437. | ||
Saxena S, Brody AL, Maidment KM, et al. Localized orbitofrontal and subcortical metabolic changes and predictors of response to paroxetine treatment in obsessive-compulsive disorder. Neuropsychopharmacology. 1999;21(6):683–693. | ||
Saxena S, Brody AL, Ho ML, et al. Differential cerebral metabolic changes with paroxetine treatment of obsessive-compulsive disorder vs major depression. Arch Gen Psychiatry. 2002;59(3):250–261. | ||
Kang DH, Kwon JS, Kim JJ, et al. Brain glucose metabolic changes associated with neuropsychological improvements after 4 months of treatment in patients with obsessive-compulsive disorder. Acta Psychiatr Scand. 2003;107(4):291–297. | ||
Swedo SE, Pietrini P, Leonard HL, et al. Cerebral glucose metabolism in childhood-onset obsessive-compulsive disorder. Revisualization during pharmacotherapy. Arch Gen Psychiatry. 1992;49(9):690–694. | ||
Brody AL, Saxena S, Schwartz JM, et al. FDG-PET predictors of response to behavioral therapy and pharmacotherapy in obsessive compulsive disorder. Psychiatry Res. 1998;84(1):1–6. | ||
Rauch SL, Shin LM, Dougherty DD, Alpert NM, Fischman AJ, Jenike MA. Predictors of fluvoxamine response in contamination-related obsessive compulsive disorder: a PET symptom provocation study. Neuropsychopharmacology. 2002;27(5):782–791. | ||
Donchin E. Presidential address, 1980. Surprise!…Surprise? Psychophysiology. 1981;18(5):493–513. | ||
Sher KJ, Mann B, Frost RO. Cognitive dysfunction in compulsive checkers: further explorations. Behav Res Ther. 1984;22(5):493–502. | ||
Zitterl W, Urban C, Linzmayer L, et al. Memory deficits in patients with DSM-IV obsessive-compulsive disorder. Psychopathology. 2001;34(3):113–117. | ||
Christensen KJ, Kim SW, Dysken MW, Hoover KM. Neuropsychological performance in obsessive-compulsive disorder. Biol Psychiatry. 1992;31(1):4–18. | ||
Pitman RK. A cybernetic model of obsessive-compulsive psychopathology. Compr Psychiatry. 1987;28(4):334–343. | ||
Tsai ML, Hung KL, Lu HH. Auditory event-related potentials in children with attention deficit hyperactivity disorder. Pediatr Neonatol. 2012;53(2):118–124. |
 © 2016 The Author(s). This work is published and licensed by Dove Medical Press Limited. The
full terms of this license are available at https://www.dovepress.com/terms
and incorporate the Creative Commons Attribution
- Non Commercial (unported, 3.0) License.
By accessing the work you hereby accept the Terms. Non-commercial uses of the work are permitted
without any further permission from Dove Medical Press Limited, provided the work is properly
attributed. For permission for commercial use of this work, please see paragraphs 4.2 and 5 of our Terms.
© 2016 The Author(s). This work is published and licensed by Dove Medical Press Limited. The
full terms of this license are available at https://www.dovepress.com/terms
and incorporate the Creative Commons Attribution
- Non Commercial (unported, 3.0) License.
By accessing the work you hereby accept the Terms. Non-commercial uses of the work are permitted
without any further permission from Dove Medical Press Limited, provided the work is properly
attributed. For permission for commercial use of this work, please see paragraphs 4.2 and 5 of our Terms.