Back to Journals » Patient Related Outcome Measures » Volume 16
A Guide to Understanding and Analysing PROMs Scores in Wales
Authors Pruski M ![]() , Palmer RI, Pickles T
, Palmer RI, Pickles T ![]() , Withers KL
, Withers KL ![]()
Received 10 October 2025
Accepted for publication 12 March 2026
Published 27 May 2026 Volume 2025:16 Pages 343—353
DOI https://doi.org/10.2147/PROM.S572978
Checked for plagiarism Yes
Review by Single anonymous peer review
Peer reviewer comments 2
Editor who approved publication: Dr Mithi Ahmed-Richards
Michal Pruski,1,2 Robert I Palmer,1,3 Tim Pickles,4,5 Kathleen L Withers1,6
1CEDAR, Cardiff and Vale UHB, Cardiff, Wales, UK; 2School of Health Sciences, The University of Manchester, Manchester, England, UK; 3School of Applied Health Sciences, University of Birmingham, Birmingham, England, UK; 4Centre for Trials Research, Cardiff University, Cardiff, Wales, UK; 5Psychology, School of Humanities and Social Sciences, Leeds Beckett University, Leeds, England, UK; 6School of Medicine, Cardiff University, Cardiff, Wales, UK
Correspondence: Kathleen L Withers, CEDAR, Cardiff Medicentre, Heath Park, Cardiff, Wales, CF14 4UJ, UK, Tel +029 21844771, Email [email protected]
Abstract: This perspective article outlines the recommendations for the analysis and presentation of data collected via patient-reported outcome measures (PROMs), to promote good practice across Wales. We do not present detailed instructions or repeat what can be easily found in statistics texts, but rather focus on the overall approach that should be adopted when dealing with such data. Throughout the article, we introduce the importance of patient-reported outcome data within the National Health Service (NHS) Wales. We then briefly describe how PROM questionnaires are validated. We then introduce the different data types and describe how PROM questionnaires are structured. Following this, we highlight how the way that patient-reported outcome data is collected can affect appropriate analysis and what should be kept in mind when comparing different items within a questionnaire. We then provide some recommendations as to how to present such data and how to go about choosing appropriate inferential statistics tests for further analysis. Finally, we go over some of the potential consequences of not analysing the data appropriately. Additionally, we also include a simplified version of these recommendations that can be shared with a wider audience.
Keywords: PROM, PRO, value-based healthcare, prudent healthcare, data analysis, visualisation
Introduction
Value-Based Health Care (VBHC) is a way of working to help achieve the best possible outcomes as a result of health care in a financially sustainable way, by considering the outcomes achieved in relation to the cost of delivering that health care.1 As patients are best-placed to assess the outcomes on their quality of life,2 gathering this information from the patient’s point of view as part of routine health care data collection has been gathering momentum.
A construct is a property of the patient that we want to know about (eg., sleep quality).3 A Patient-Reported Outcome (PRO) is the patient’s self-description of their health-related outcome without anyone else’s interpretation of that self-description.4,5 Asking multiple patients to describe their health outcomes in terms of a construct (such as asking them to describe their sleep quality) may lead to unstructured and non-numerical responses. PROs are therefore subjective in nature, as is the case with many clinicians reported outcomes. Consequently, to be able to consistently analyse them, these outcomes need to be collected quantitively and in a standardised way. A convenient way to do this is via a Patient-Reported Outcome Measure (PROM), which, as the name suggests, is a tool to measure PROs, and is essentially a standardised questionnaire which should have undergone a rigorous scientific validation processes.
Development of This Guide
The Value Transformation team (VT), part of National Health Service (NHS) Wales Performance and Improvement, has a mission to implement VBHC across NHS Wales. A major part of this work is to implement a digital strategy to standardise the collection of PROs across the country, by ensuring that the same PROMs are used at the same times relative to the patient’s pathway and establishing a consistent data flow so that clinicians and analysts can access PROs at a single central repository. However, internal experience shows that data collected by the same PROMs have been treated and analysed differently by different groups, leading to different results and interpretations from the same datasets (for example, the authors know of the same PROMs dataset being analysed by two different organisations, with one organisation using the mean and the other the median, resulting in opposite conclusions as to which organisation’s patients had overall higher PROM scores). This is not surprising considering there is debate amongst experts as to how data collected in this way should be treated.6
While settling the debates in the literature is out of scope, the aim of this work is to provide suggestions on ways to analyse PROMs so that analysts working in Wales can analyse aggregate PROs consistently with each other in research, evaluation and service improvement projects. Decisions leading to the suggestions outlined in this work will be transparent, and these should be regularly reviewed and challenged to ensure consensus on how to deal with PROs in NHS Wales, hence the choice of the format adopted by this publication. This work has been commissioned by the VT. This work has two components, (1) a guide which provides more in-depth explanations of the relevant concepts and allows readers to comment on its content (2) a simplified guide, which is provided here as Supplementary File 1, which will be also published on an NHS Wales website, where a link will be provided to this paper. This will provide users with brief “How to” instruction methods in the form of the simplified guide, written in more accessible language, with more detailed information available in this article detailing the rationale behind these instructions.
This guide has been written by three members of the CEDAR team, which supports VT in the implementation of PROMs, clinical teams with PROMs work, and undertakes commissioned PROMs analysis projects. As such, members of this team are aware of many local challenges faced by those analysing PROMs data in Wales and utilising this data clinically. The fourth team member is a statistician with a professional focus in PROMs data. The team have developed the guide based on experience of these local issues, their familiarity with PROMs documentation such as PROM development papers and scoring guides, and statistical expertise. This guide might be of interest to those outside of Wales if they face similar challenges or seek to understand the fundamentals of PROMs data analysis, as good data analysis processes remain constant (though governance consideration about data disclosure might vary). Nevertheless, this guide focuses on the use of aggregate data collected as part of routine clinical care, rather than data collected as part of clinical trials or the development of new PROM tools. We hope that this guide will promote best practice and uniformity of approach across Wales to allow for comparability of results from different centres in Wales.
Questionnaire Validation
Validation relates to the process of ensuring that the questionnaire measures what it is supposed to measure. One framework, Classical Test Theory, includes ensuring such things as content validity (the degree to which the content of the tool is an adequate reflection of the construct to be measured)7, construct validity (the degree to which the scores are consistent with hypotheses based on the assumption that the tool measures the construct to be measured),7 internal consistency (“the degree of the interrelatedness among the items”)7, reliability (the proportion of the total variance in the measurements which is because of true differences among patients rather than systemic or random error)7. Other process for developing robust questionnaires exist, including Item Response Theory.8
While it is not important here to appreciate how this validation is undertaken, it is important to understand that if these processes have been done, their results only apply to the version of the questionnaire as presented. If such a questionnaire were to be used in a different way (eg. scores calculated differently or items were to be added or omitted) or in a different population, this would affect the validity of results. Additionally, questionnaire instructions sometimes provide information on how to deal with missing data items, and these instructions should be followed.
Questionnaire Quality and Measurement Error
While this guide provides advice on best practice in PROMs data analysis, it is important to consider the impact of the questionnaire itself on the extent of error in the results as well as the error caused by inappropriate analysis. Considerations of measurement error can have important consequences on the results of data analysis and the interpretation of results through consideration of the minimal detectable change. However, the additional problems caused by these errors are beyond the scope of this guide, though publications on this topic are available for clinicians and analysts.9–11
Using a poorly developed questionnaire, or even using a well-developed questionnaire inappropriately (eg. for a different condition or in a population for which it was not tested), decreases the confidence that one can have that the questionnaire measures what one deployed it to measure.12
Similarly, using the incorrect type of data analysis might lead to inappropriate conclusions about the data; for example, it is well acknowledged that inappropriately using parametric statistic methods is more likely to result in finding a statistically significant difference between groups where the test is not powered appropriately to detect such a difference.13
While using an inappropriate questionnaire might contribute more to the misinterpretation of results than using an inappropriate analytic approach, using the correct analysis method will always decrease the likelihood of error. Nevertheless, it is important to only use tools within the context in which they are specified for use.12
Data Types
The first step in analysing data collected as part of clinical care (after it has been cleaned and checked), is to understand what types of data one has. While a lot of people think of data as either categorical or continuous, conventional typology and theory outlines four ways to define the numbers assigned to categories in response scales; these four ways can be described as data types or levels of measurement (Table 1; see also Supplementary Table 1).14
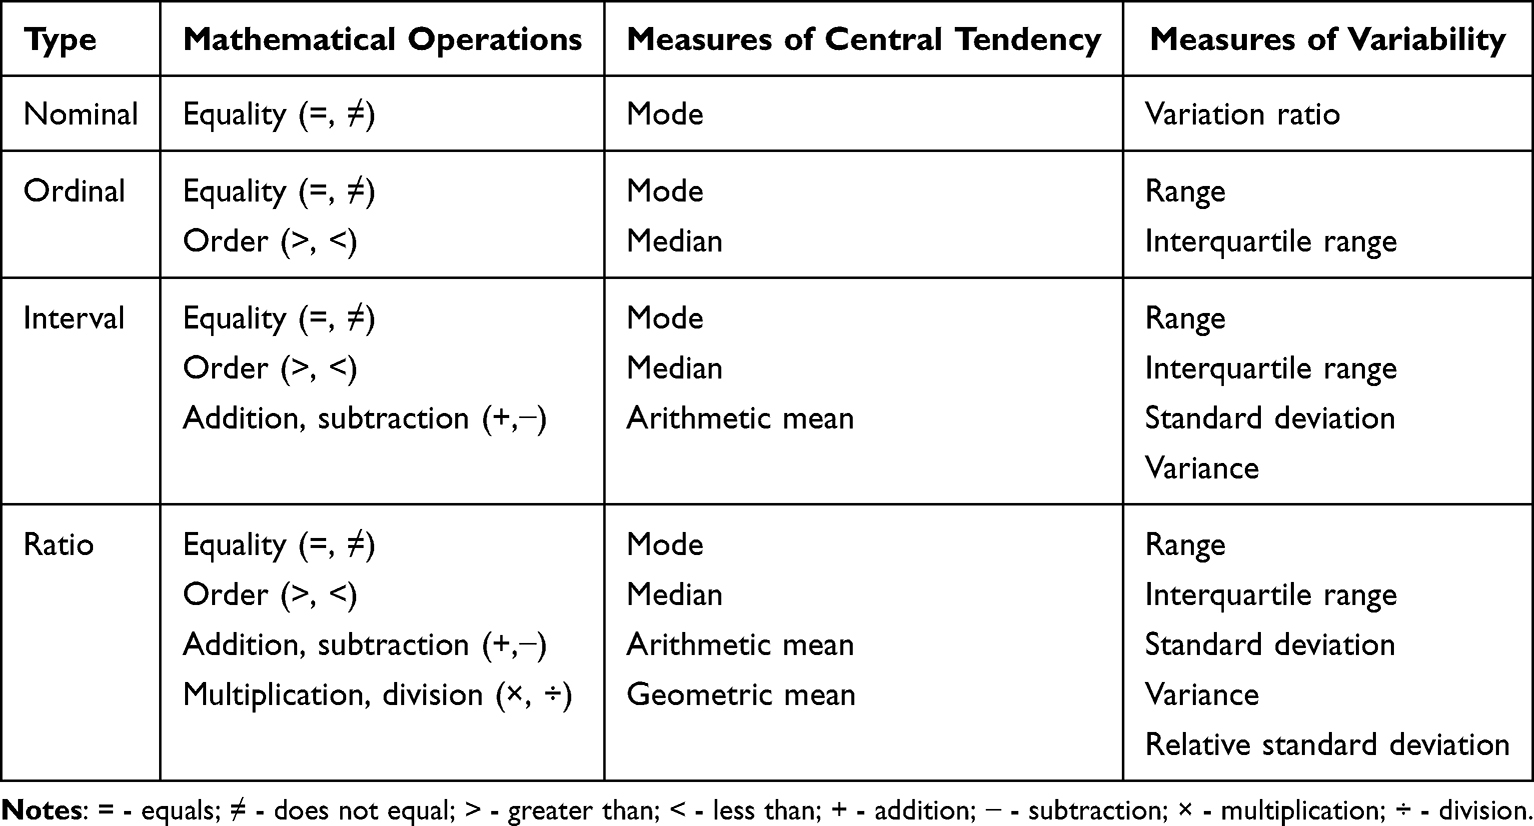 |
Table 1 Conventional Data Typology |
The first data type is “nominal” data. This is categorical data with no obvious order like, for example, colour or flavour. While it would be possible to group respondents by eye colour, there would not be an obvious way to rank them in a meaningful way using this trait. There is not much statistics that one can give for this type of data besides stating frequencies and giving the mode, but PROMs should not in general contain nominal data. An example of such items in PROM tools is a dichotomous yes/no question.
The next category is “ordinal” data. This is categorical data that can be ordered, but the spacing between each rank is unknown and may not be equal. A 5-point Likert scale asking a patient about a recent increase in their experience of pain might represent categorical data, since a response of “strongly agree” represents a greater change than “agree”, nevertheless it is uncertain if “strongly agree” is associated with twice as much an increase of pain perception compared to “agree” or a 50% increase in the perception of pain, or any other value. It is important to remember that ordinal data might be represented in numbers. For example, a five-point rating scale might be used to ascertain how important something is for patients, with possible values of 1, 2, 3, 4 and 5 (from least to most important). Here, again, it is uncertain if a rating of 4 represents twice the importance of 2. This is a very important point, as often after a patient fills out a questionnaire, their rating are assigned a numerical value (think, for example, of the Oxford Knee Score).15 Consider a question where the answer options may be “none”, “a little”, “some”, “a lot” and “all”, and that these are respectively given values from 1 to 5. While both a change from “none” to “some”, and “a little” to “a lot”, could be described as a change by 2 points, you cannot state that a change from “none” to “some” is of the same magnitude as “a little” to “a lot”. As such, it is important to remember that just by virtue of assigning a number to a descriptor does not mean that the data becomes interval or ratio (which are described in the next sections). Hence, it is preferable to use the non-numerical descriptors of such items whenever possible (eg. in our example, talk about “none”, “a little”, “some”, “a lot” and “all”, rather than values of 1 to 5 which are used during the score calculation process). It is also important to remember that dichotomous data might be ordinal. For example, the PHQ-2 questionnaire utilises a final score of whether a respondent scored below or above a threshold, and as such there is an order to this binary response.16
Ordinal data goes beyond categorical data in that there is an order to the responses and so a median can be calculated. Since you do not know how much distance there is between the various response options you cannot calculate the mean (as you do not know where the middle is). It is important that if the median falls between two scores (eg. a median of 2.5 on a 5-point scale) this does not mean that the average value lies exactly in the middle between values 2 and 3, but somewhere in the range expressed by values 2 and 3 (eg. in our example, somewhere between “a little” and “some”). Therefore, we suggest that when summarising the overall PROM score the median is used, but when reporting results for individual items it is best to report the number (n) of responses and the percentage of responses falling within each ordinal category (though in general looking at individual items should be avoided, as it is the sum scores that have been validated). Note that in principle you cannot add or subtract ordinal values (for the same reason why you cannot calculate a mean), but PROMs will often use a sum score (such as an overall score or a domain score). This is because it is the sum score that has been validated during the questionnaire validation process. Ordinal data is probably the most frequently encountered data type among PROM items.
“Interval” data has the properties of categorical data, with the added property of being equally spaced, but it lacks a true zero. Interval data can be discrete or continuous. The best everyday example of it is temperature measured in degree Celsius. Consider a temperature of 10°C and of 20°C. You can say that the latter is 10 degrees warmer than the former, but you cannot say that it is twice as hot. Any ranking scale, where 0 does not represent an absolute absence of a phenomenon or effect, but there is equal spacing between scale intervals is of the interval data type. With interval data, we can calculate the arithmetic mean as well as subtract and add, in addition to all the operations we can undertake with ordinal data.
The last category is “ratio” data, which has a true zero, in addition to all the properties that interval data has. Ratio data can be discrete or continuous. With this data you can perform all the manipulations that you can perform with interval data, as well as multiply and divide the values, and calculate other types of mean, such as the geometric mean. The pain visual analogue scale (VAS) in principle represents ratio data, since its zero represents the absence of pain.
Both interval and ratio data can be discrete (only some values are possible) or continuous. While this does not affect the response scale, it might affect which statistical test one can use and how to interpret these. This will be discussed in the analysis section.
The Anatomy of a PROM
Before the above information can be applied to the analysis of PROMs data, it is important to understand what a PROM tool consists of, or to put it differently, how it is built. The most important hierarchical structure of a PROM is the “construct”. In the context of PROs, constructs are health-related properties of patients that you want to know about.3
Most constructs are measured by calculating “scores” and consist of one or many “items” that are used to elicit the appropriate information from patients in a structured form. In practical terms, “items” are the questions in a questionnaire, while the constructs are often described in PROMs as “scales”, “scores”, “domains” or “status”, and even sometimes unhelpfully as “items”. For example, in the EORTC QLQ-C30,17 there are 15 “constructs” which are measured using 30 items, with eg., the “financial difficulties” construct being measured by one item, and the “physical functioning” construct being measured by five items.
If a score is measured using multiple items, it is important to understand how the items are combined to generate it. The score might be simply a summation or taking the mean of the individual items or a more complex formula might be used to obtain it. Some tools utilise more refined methods of obtaining scores. Techniques such as Rasch measurement theory (eg., used to develop the Cat-PROM5),18 Item Response Theory (eg., used to develop the PROMIS Global Health Scale),8,19 or composite time trade-off supplemented by discrete choice experiments (eg., used to develop the EQ-5D),20 are methods of converting item responses into a single score on an interval level. Nevertheless, just because a score is converted into a percentage, t- or z-score does not mean that it can be analysed on a continuous scale like ratio data; eg., the KOOS developmental paper explicitly states that while the data appears as percentages, it is ordinal data and should be analysed using non-parametric statistical tests.21 This is an important consideration for how to analyse the data, to which we will return later.
PROMs Data Entry
It is important to note the method in which a response for a specific item is recorded (ie., how response options are presented). Consider a rating scale from 0 to 10, like in the VAS Back & Leg tool. If a respondent can only select a value of “0”, “1”, “2”, “3”, “4”, “5”, “6”, “7”, “8”, “9” or “10” then this is discrete data, but if users can simply type in any value, including decimal point values, between zero and 10, or mark a point along a line then the scale may be of a continuous type (although it is also important to consider if such level of precision of measurement is practically possible).
To illustrate this, consider the following two scenarios. In each scenario, two respondents have answered a VAS pain question before and after an intervention.22
In the first scenario, the VAS was collected on a continuous scale and in the second scenario on a discrete scale. In the first scenario, respondent A scored 2.6 before and 2.4 after an intervention, while responded B scored 3.4 before and 1.6 after the same intervention. This means that respondent A had a 0.2 improvement in their pain, while responded B had a 1.8 improvement in their pain. In the second scenario, both respondents would likely score 3 before the intervention and 2 after the intervention, meaning that both had an improvement of 1 in their pain (if we were to use the scores to calculate a difference in the scores, which you should not do with ordinal data). This might be tolerable when tracking changes in individual patients, but if such data is used on a population level, these potential errors might become prohibitive to using parametric statistics (see the analysis section further in the manuscript). Of course, this is just an example to illustrate the point about the impact of data collection methods on the data, and in practical terms the impact of measurement error should also be considered.
This is an important implementation consideration, as the way data is recorded will affect not only its analysis, but also the validity of the data collected by the questionnaire. If the originally developed and validated paper version of the questionnaire utilised eg., continuous response options but the implemented digital tool collected discrete responses, then not only are the results of the paper and digital versions not comparable to each other, but the digital version stops being a validated tool (it might be possible to eg. utilise differential item functioning to overcome such a problem, but this is outside of the scope of this guide). Moreover, it is not only important how the question is visually presented, but also how the instructions note to analyse it. For example, a VAS might be presented on paper, but instructions might only ask to measure the responses in full centimetres, rather than as a continuous variable.
Finally, it is worth mentioning the descriptors used in questions. If a question asks a respondent to rate a phenomenon on a VAS but does not define whether a zero represents the absence of a phenomenon, the smallest imaginable amount of the phenomenon or no change in the phenomenon, then we must assume that the data is interval. If a zero does indeed represent the absence of a phenomenon, the smallest imaginable amount of the phenomenon or no change in the phenomenon, then the data can be considered ratio. If in doubt, we suggest analysing the data as interval, as in such situations, the data should always be assumed to be of the simplest of the available alternatives, eg. if the uncertainty is between ratio and interval data, the data should be assumed to be of an interval type. Even if the data is ratio, it is not inappropriate to analyse it as interval.
Comparing Items
It is important to understand that two items expressed on the same scale might not have the same level of measurement. Consider a 5-point scale, and that it could be used to measure an ordinal variable or one that could be expressed on an interval scale. Therefore when analysing data, one should carefully consider the level of measurement one is dealing with.
Additionally, two items utilising similar scales and contributing to the same score might not affect the score in the same way. Consider the EQ-5D-5L questionnaire,20 which consists of five questions on an ordinal scale, and then a single VAS item. Scores from the five ordinal items are used to generate a health state and are not simply added together. The health state is then used to generate a utility, which is affected by the geographical region in which the respondent lives. Because of this, an increase of one point on one of the five ordinal scale items does not have the same effect on the index value as an increase of one point on another item. Similarly, it cannot be simply stated that someone who has a health state of “22222” has twice the score of someone who has a health state of “11111”.
Additionally, even if scores from individual items contribute to the construct score in the same way, it does not mean that you can compare responses to one item with responses to another item. This is because individual items might relate to the constructs in different ways (eg., because the PROM has been developed in a formative way).9,12,23,24
Consider different respondents answering four items relating to a construct as represented in Figure 1. Assume that the construct being measured in Figure 1 is mobility. Line A could represent a question such as “how mobile are you” with 1 representing being bed bound and 5 representing full mobility, while line B could a question such as “how far can you walk” with 1 representing not being able to walk at all, while 5 representing being able to walk more than 10 kilometres. While in both cases, 1 represents a similarly low level of mobility, answers of 5 represent a different relationship to the limit of mobility. Similarly, questions relating to a person being able to conduct their daily activities have some relationship to mobility, but will likely not have as a high of an overlap with the construct as more specific questions would. Importantly, individuals might place a different weight or importance to different questions for personal reasons, for example, if they need to be mobile to undertake daily tasks or because of how they like to spend their leisure time. To illustrate this, consider Figure 1, where the third score of each Likert scale item represents a different quantity of the construct (except for lines A and D). Moreover, an increase or decrease of one point on item A has a bigger impact than the same change on item D, while a score of five on line B has a similar weight for this specific patient as a score of three on item C (represented by the dashed line z). Therefore, responses to different items should not be compared with each other even if they form part of the same construct.
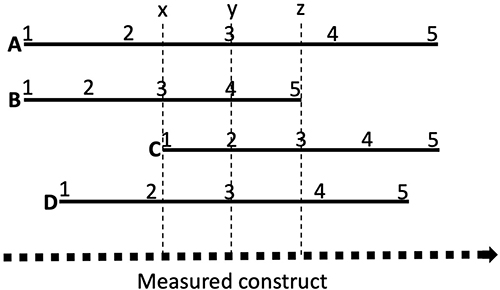 |
Figure 1 The relationship of different items to the construct (represented by the dotted line) they are intended to measure. Solid lines (A–D) represent different items on a 5-point scale. Dashed line y represents the third score on solid lines (A and D) the fourth score on (B) and second score on (C). Dashed lines x and z represent the third scores on solid lines (B and C), respectively. For a practical application of this concept consider e.g. how a scores of a person’s ability to climb stairs and a score of a person’s ability to kneel relate to the construct of mobility. |
Consider again EORTC QLQ-C30,17 where the emotional functioning scale is measured by items asking about feelings of tension, irritability, depression and if the person worries. Anyone respondent might apply a different weight to these feelings and worrying. Now consider the Oxford Knee Score and the items relating to the respondent’s ability to do their shopping, household tasks, kneeling down, and washing oneself.15 The impact of these questions on a particular respondent will be different depending on whether they are a keen gardener whose shopping is delivered to their home and most of the household tasks are done by their spouse, as opposed to a lonely elderly person who lives in a flat but cannot do shopping online. Nevertheless, within a large sample, one would hope that some of these interpersonal differences average out.
Presenting Data
It is important to remember that data need to be visualised appropriately (see also Supplementary Figure 1). As a general rule, we suggest that results from PROM items should be visualised using formats such as pie charts and bar graphs showing the distribution of scores (rather than average scores). We do not recommend using the averages, because they provide a poor representation of the overall data. Moreover, you cannot use a mean with ordinal data, while the conceptual understanding of a median can be difficult if it falls on a mid-point between available response options, and the mode can be misleading with skewed data.
For interval or ratio data, where average scores and a measure of variability can be calculated, other visualisation formats such as box plots can be used.
Scores for individual items within constructs that are on different scales must not be visualised on the same axis. Plotting individual items on the same axis should only be done when you are certain that the impact of improving any item score by the same value has the same effect on the overall construct score. In scores involving more complex calculations (see eg., EQ-5D or WPAI(-GH))20,25 the relationship between individual items and a domain score is difficult to illustrate visually.
For construct scores where all items have the same weight, improving any one item by one point will have the same effect on the construct score (see eg. the Oxford Knee Score).15 But when visualising these, one should be careful, since the direction of change which would signify improvement might be different for different items (ie. either lowest possible score or the highest possible score might signify greatest patient wellbeing). For example, in the ReQoL tool, all questions are asked a 5-point scale from “none of the time” to “most or all of the time”, but when using numerical notation sometimes “none of the time” is assigned 0 and sometimes “most or all of the time” is assigned 0;26 in the EORTC QLQ-C30 tool, for some of the items the largest numerical score indicates best outcome, while for others the lowest score indicates the best outcome.17
Hypothesis Testing
One of the biggest issues with PROMs data analysis is selecting whether a parametric or non-parametric test could be used. While there is more to deciding if a parametric test can be used, one of the fundamental questions in this decision is to ascertain what level of measurement does the data represent. As highlighted in this work, neither adding together numerical scores of an ordinal item nor taking the mean of such items transforms an ordinal item into an interval item. Consider the Oxford Knee Score.15 In their 1998 paper a team from Oxford University describes the questionnaire as “the final version contains 12 questions, each with five categories of response [reference omitted]. Each item is scored from 1 to 5, from least to most difficulty or severity, and combined to produce a single score with a range from 12 (least difficulties) to 60. (most difficulties)”.27 This indicates that the score represents a sum of values derived from ordinal scales. In a 2007 paper the team from Oxford University provided the following comment on the analysis of the data from the questionnaire “Hence, data from the Oxford scores obtained at these different times tend to be skewed in either direction. It could therefore be argued that the use of transformations or non-parametric statistics for analyses involving absolute scores are sensible. However, we have found that parametric statistics have generally been satisfactory in most analyses”.28 It is unclear what the authors mean when they state that “parametric statistics have generally been satisfactory in most analyses”. Yet, Altman cautions against the temptation to treat categorical data as interval or ratio data (p12).29 This problematic treatment of ordinal PROM sum scores as continuous data has been highlighted elsewhere, and it has also been suggested that applying Item Response Theory to the Oxford Knee Score questionnaire could overcome this problem.9
Conversely, Altman notes that “we do not worry too much” about analysing interval data as ratio data, as long as it is “a large number of different possible values”, though he does not quantify how many values are necessary to be regarded as “large” (p12).29 Consequently, it might be possible to treat VAS results as a continuous variable, even if it is implemented via a digital system which only allows discrete values to be selected, or if it does not have a true zero. Nevertheless, it should not be assumed outright that you can do that. It needs to be first considered if there is any reason to suspect that the data could be parametric. With respect to the pain VAS, there is some evidence that the way respondents select their answers on a VAS does not align with an interval data type or that clinically the data is used in an ordinal manner.30
Consider Figure 2, and that the clinical significance of the phenomenon changes more between points “y” and “z” than between “w” and “x”, even though the change on the VAS is the same in both instances. For example, different analgesics might be used in both instances,30 or the change in one instance might trigger a clinical response but not in the other. If it can be ascertained that there is good reason to suspect that the data might be interval or ratio, then it needs to be ensured that that the distribution of the residuals after a parametric statistical test is normally distributed, and to ensure that the assumptions of the test are not violated. In case of doubt, it is important to remember that one can always use a non-parametric test with parametric data, but one should not use a parametric test with non-parametric data.
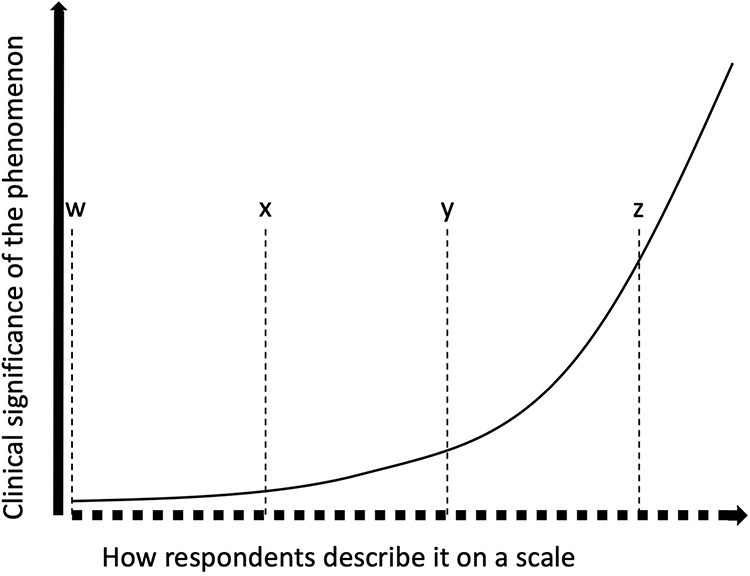 |
Figure 2 Example of a relationship between responses on a scale and the clinical significance of a phenomenon. The bold dotted line represents a hypothetical VAS. The thick solid line is an axis representing the clinical significance of the phenomenon. The thin solid line shows the relationship between respondent answers on the VAS and the clinical phenomenon. Dotted lines “w”, “x”, “y” and “z” show four points on the VAS with the distance between adjacent lines being equidistant. |
Importantly, collecting interval or ratio data will in general allow for more elaborate analysis than with ordinal or categorical data. Nevertheless, appropriate statistical tools exist to analyse most types of data when answering a range of questions.
While already mentioned in the section on PROMs anatomy, questionnaires can be developed and tested using various methods that ensure that their data is present on an ordinal or ratio scale. We have already mentioned Rasch measurement theory or the use of composite time trade-off supplemented by discrete choice experiments, which ensures that the scores can be assumed to represent values on a ratio scale. We do not have space here to explain here in detail how this is achieved, but these are complex analyses that ensure that items cover the whole span of a construct and reliably measure various points on its continuum. If a questionnaire employed such techniques during its development, then the scores obtained from such a questionnaire can be treated as ratio data.
Making decisions as to how to analyse PROMs data is often challenging, because the PROM instructions might require summing multiple individual ordinal item values to obtain a score for a particular construct, despite there being no reassurance that the response scale is of an interval or ratio type. In such cases, a researcher should follow the scoring method outlined in the PROM tool used, since this methodology was used when the tool was validated. Nevertheless, non-parametric tests should be employed. We recommend that researchers in Wales strictly follow the advice described in well-respected statistical textbooks, like Altman’s,29 with regard to the selection of specific tests, and as such information on these tests is readily available (see eg., “Statistics at Square One” available from BMJ.com)20 it will not be expanded on here. Complex modelling should not be undertaken without the involvement of an experienced data analyst or statistician.
Implications of Inappropriate Analysis
We hope that the data analysis and presentation recommendations discussed here are of use to the clinical and research communities. The advancement of person-centred and value-based healthcare is dependent upon the correct understanding and use of such data. In this final section, we highlight risks to value-based healthcare and person-centred healthcare that can result from inappropriate analysis of PROMs.
Consider an investigation whether one treatment approach (pathway, drug or medical device) is associated with better outcomes than alternative approaches. If the collected PROMs are of an ordinal type and the statistical analysis has been carried out using parametric statistical tests, which in general have more statistical power (ie. more likely to find a significant difference between the studied groups), then the analysis might find differences between the treatment groups that do not actually exist. This is because the assumptions for the validity of the test are likely not met. While this might appear to be a primarily academic matter as there are many published papers that use inappropriate statistical methods, this can have gross consequences for the healthcare system and patients. If decisions are made based on such analyses and any further health economics analyses, then perhaps one treatment approach might be endorsed while others discarded. If the endorsed treatment is somewhat slightly more expensive than a discarded treatment option, this can result in additional healthcare system costs that might not have been incurred if the data analyses had been carried out correctly and no difference was found between treatment approaches. For patients, this might mean that an alternative treatment is not offered to them because it is falsely seen as more costly, limiting their choice, which might be important if the alternative treatments are associated with different side effects or fit better with the patient’s lifestyle.
Inappropriate visualisation of patient-level data can also have consequences for planning care interventions. Consider the previous example of EQ-5D,20 and that a specific patient’s EQ-5D score is being reviewed during a multidisciplinary meeting to plan occupational therapy interventions for that patient. If the data was present on a radar plot visualising scores for specific items, this might give a false impression as to which aspect of the patient’s wellbeing to target to achieve the best overall improvement in health utility because the area of the radar plot is perceived as equivalent to overall health utility, or because it is thought that improving an item that score 1 to a score of 2 would result in doubling the utility associated with that domain.
Conclusion
Those analysing PROM data should treat the data as non-parametric, unless there is good reason to suspect otherwise. This means that data should be presented as medians and inter-quartile ranges, visualised using methods that reliably show the distribution of scores, and non-parametric statistical tests should be used. PROMs should be scored using the scoring instructions provided, but those analysing the data should remember that just because scores are presented in a numerical format, does not mean they represent interval or ratio data. If there is good reason to suspect that the data is parametric (and the fact that an article has analysed similar data using a parametric test should not be considered a good reason in itself), it should be ensured that the data meets the assumptions of any statistical test that is used to analyse it. Finally, the impact of how the data were collected should be accounted for, as it might affect the data type of the given responses.
Acknowledgments
CEDAR is part funded by Value Transformation. Value Transformation did not play any part in the design, writing or approval for publishing of this article. We acknowledge our CEDAR team members, particularly Katherine Woolley, for their comments and suggestions on early drafts of this article.
Author Contributions
All authors made a significant contribution to the work reported, whether that is in the conception, execution, or interpretation, or in all these areas; took part in drafting, revising or critically reviewing the article; gave final approval of the version to be published; have agreed on the journal to which the article has been submitted; and agree to be accountable for all aspects of the work.
Funding
This work has been funded by the Value Transformation (part of NHS Wales Performance and Improvement) programme.
Disclosure
The authors report no conflicts of interest in this work.
References
1. Porter ME. What is value in health care? N Engl J Med. 2010;363(26):2477–2481. doi:10.1056/NEJMp1011024
2. Donald A. What Is Quality of Life? Hayward Medical Communications; 2001.
3. Johnston B, Patrick D, Devji T, et al. Chapter 18: patient-reported outcomes. In: Cochrane Handbook for Systematic Reviews of Interventions Version 6.5. Cochrane; 2024.
4. FDA. Guidance for industry; patient-reported outcome measures: use in medical product development to support labeling claims; 2009.
5. Prinsen CAC, Mokkink LB, Bouter LM, et al. COSMIN guideline for systematic reviews of patient-reported outcome measures. Qual Life Res. 2018;27(5):1147–1157. doi:10.1007/s11136-018-1798-3
6. Tanujaya B, Prahmana RCI, Mumu J. Likert scale in social sciences research: problems and difficulties. FWU J Soc Sci. 2022;16(4):89–101. doi:10.51709/19951272/Winter2022/7
7. Mokkink LB, Terwee CB, Patrick DL, et al. The COSMIN study reached international consensus on taxonomy, terminology, and definitions of measurement properties for health-related patient-reported outcomes. J Clin Epidemiol. 2010;63(7):737–745. doi:10.1016/j.jclinepi.2010.02.006
8. Nguyen TH, Han HR, Kim MT, Chan KS. An introduction to item response theory for patient-reported outcome measurement. Patient. 2014;7(1):23–35. doi:10.1007/s40271-013-0041-0
9. Harrison CJ, Plessen CY, Liegl G, et al. Item response theory may account for unequal item weighting and individual-level measurement error in trials that use PROMs: a psychometric sensitivity analysis of the TOPKAT trial. J Clin Epidemiol. 2023;158:62–69. doi:10.1016/j.jclinepi.2023.03.013
10. Van Der Willik EM, Terwee CB, Bos WJW, et al. Patient-reported outcome measures (PROMs): making sense of individual PROM scores and changes in PROM scores over time. Nephrology. 2021;26(5):391–399. doi:10.1111/nep.13843
11. Davidson M, Keating J. Patient-reported outcome measures (PROMs): how should I interpret reports of measurement properties? A practical guide for clinicians and researchers who are not biostatisticians. Br J Sports Med. 2014;48(9):792–796. doi:10.1136/bjsports-2012-091704
12. Krogsgaard MR, Brodersen J, Jensen J, Hansen CF, Comins JD. Potential problems in the use of patient reported outcome measures (PROMs) and reporting of PROM data in sports science. Scand J Med Sci Sports. 2021;31(6):1249–1258. doi:10.1111/sms.13888
13. Burke DA, Whittemore SR, Magnuson DSK. Consequences of common data analysis inaccuracies in CNS trauma injury basic research. J Neurotrauma. 2013;30(10):797–805. doi:10.1089/neu.2012.2704
14. Stevens SS. On the Theory of Scales of Measurement. Science. 1946;103(2684):677–680. doi:10.1126/science.103.2684.677
15. Oxford Knee Score. Available from: https://innovation.ox.ac.uk/outcome-measures/oxford-knee-score-oks/.
16. INSTRUCTION MANUAL. Instructions for patient health questionnaire (PHQ) and GAD-7 measures’ Available from: https://case.edu/medicine/wellness-pathway/sites/default/files/2018-05/instructions.pdf.
17. Fayers PM, Aaronson N, Bjordal K, et al. The EORTC QLQ-C30 Scoring Manual.
18. Sparrow JM, Grzeda M, Frost A, et al. Work package 1: development of Cat-PROM5, a brief cataract patient-reported outcome measure. In: Developing Decision Support Tools Incorporating Personalised Predictions of Likely Visual Benefit Versus Harm for Cataract Surgery: Research Programme. National Institute for Health and Care Research; 2022.
19. www.healthmeasures.net. Global Health Scoring Manual: a brief guide to scoring the PROMIS® Global Health instruments; 2021. Available from: https://www.healthmeasures.net/images/PROMIS/manuals/Scoring_Manuals_/PROMIS_Global_Health_Scoring_Manual.pdf.
20. EuroQol Research Foundation. EQ-5D-5L user guide; 2025. Available from: https://euroqol-domain.ams3.digitaloceanspaces.com/wp-content/uploads/2025/01/12124516/EQ-5D-5L-Userguide-2025-04.pdf.
21. Roos EM, Roos HP, Lohmander LS, Ekdahl C, Beynnon BD. Knee Injury and Osteoarthritis Outcome Score (KOOS)—development of a self-administered outcome measure. J Orthop Sports Phys Ther. 1998;28(2):88–96. doi:10.2519/jospt.1998.28.2.88
22. Huskisson EC. Measurement of pain. Lancet. 1974;304(7889):1127–1131. doi:10.1016/S0140-6736(74)90884-8
23. Adams M, Taylor RM. Developing patient reported outcome measures for children with cancer: a current perspective. EJC Paediatr Oncol. 2025;6:100312. doi:10.1016/j.ejcped.2025.100312
24. Diamantopoulos A, Siguaw JA. Formative versus reflective indicators in organizational measure development: a comparison and empirical illustration. Br J Manag. 2006;17(4):263–282. doi:10.1111/j.1467-8551.2006.00500.x
25. Reilly Associates. WPAI:GH V2.0; 2004. Available from: http://www.reillyassociates.net/wpai_gh.html.
26. Keetharuth AD, Brazier J, Connell J, et al. Recovering Quality of Life (ReQoL): a new generic self-reported outcome measure for use with people experiencing mental health difficulties. Br J Psychiatry. 2018;212(1):42–49. doi:10.1192/bjp.2017.10
27. Dawson J, Fitzpatrick R, Murray D, Carr A. Questionnaire on the perceptions of patients about total knee replacement. J Bone Joint Surg Br. 1998;80(1):63–69. doi:10.1302/0301-620x.80b1.7859. PMID: 9460955.
28. Murray DW, Fitzpatrick R, Rogers K, Pandit H, Beard DJ, Carr AJ, Dawson J. The use of the Oxford hip and knee scores. J Bone Joint Surg Br. 2007 Aug;89(8):1010–1014. doi: 10.1302/0301-620X.89B8.19424. PMID: 17785736.
29. Altman DG. Practical Statistics for Medical Research.
30. Heller GZ, Manuguerra M, Chow R. How to analyze the visual analogue scale: myths, truths and clinical relevance. Scand J Pain. 2016;13(1):67–75. doi:10.1016/j.sjpain.2016.06.012
 © 2026 The Author(s). This work is published and licensed by Dove Medical Press Limited. The
full terms of this license are available at https://www.dovepress.com/terms
and incorporate the Creative Commons Attribution
- Non Commercial (unported, 4.0) License.
By accessing the work you hereby accept the Terms. Non-commercial uses of the work are permitted
without any further permission from Dove Medical Press Limited, provided the work is properly
attributed. For permission for commercial use of this work, please see paragraphs 4.2 and 5 of our Terms.
© 2026 The Author(s). This work is published and licensed by Dove Medical Press Limited. The
full terms of this license are available at https://www.dovepress.com/terms
and incorporate the Creative Commons Attribution
- Non Commercial (unported, 4.0) License.
By accessing the work you hereby accept the Terms. Non-commercial uses of the work are permitted
without any further permission from Dove Medical Press Limited, provided the work is properly
attributed. For permission for commercial use of this work, please see paragraphs 4.2 and 5 of our Terms.