")
Back to Journals » Journal of Multidisciplinary Healthcare » Volume 15
A Factor Analysis Model for Rapid Evaluation of the Semen Quality of Fertile Men in China
Authors Wang N, Song M, Gu H, Gao Y, Yu G, Lv F, Shi C, Wang S, Sun L, Xiao Y, Zhang S
Received 26 September 2021
Accepted for publication 20 December 2021
Published 3 March 2022 Volume 2022:15 Pages 431—441
DOI https://doi.org/10.2147/JMDH.S341444
Checked for plagiarism Yes
Review by Single anonymous peer review
Peer reviewer comments 4
Editor who approved publication: Dr Scott Fraser
Ning Wang,1 Meifang Song,2 Haike Gu,2 Yiyuan Gao,1 Ge Yu,3 Fang Lv,4 Cuige Shi,5 Shangming Wang,5 Liwen Sun,1 Yang Xiao,6 Shucheng Zhang1
1Department of Health Quality Center, National Research Institute for Family Planning, Beijing, People’s Republic of China; 2Beijing Radiation Center, Beijing Academy of Science and Technology, Beijing, People’s Republic of China; 3Department of Gynecology, Harbin Medical University Cancer Hospital, Harbin, People’s Republic of China; 4Reproductive Medicine Center, Department of Obstetrics and Gynecology, the Second Affiliated Hospital of Soochow University, Soochow, People’s Republic of China; 5Department of Cell Biology, National Research Institute for Family Planning, Beijing, People’s Republic of China; 6Graduate School of Chinese Academy of Agricultural Sciences, Beijing, People’s Republic of China
Correspondence: Shucheng Zhang; Yang Xiao, Tel/Fax +86 10 62197760 ; +86 10 82109683, Email [email protected]; [email protected]
Objective: The objective of this study is to reduce the dimension of several indicators with a strong correlation when conducting semen quality analysis in a small number of comprehensive variables that could retain most of the information in the original variables.
Methods: A total of 1132 subjects were recruited from the Maternal and Child Health Institutions of seven provinces in mainland China. They completed the questionnaire and provided semen samples. Visualization of the correlation between variables was realized by using a function chart and correlation in the PerformanceAnalytics package of the R programming language (version 3.6.3 [2020-02-29]). Factor analysis was conducted using the principal function in the psych package of R. Principal component analysis, combined with varimax rotation, was used in the operation of the model, and two common factors were selected and measured to provide values for the common factor. The score coefficient was estimated using the regression method.
Results: The contribution rates of the two common factors to variable X were 43.7% and 33.98%, respectively. When the two common factors were selected, approximately 78% of the information of the original variables could be explained. The correlation coefficients between the first common factor (the quantitative factor) and sperm density, total sperm count, and semen volume were 0.824, 0.984, and 0.544, respectively. The correlation coefficients between the second common factor (the quality factor) and sperm motility and the percentage of forward-moving (progressive spermatozoa) sperm were 0.978 and 0.976, respectively.
Conclusion: The correlation between the original variables of a semen quality analysis was strong and suitable for dimensionality reduction by factor analysis. Factor analysis and dimensionality reduction provide a fast and accurate assessment of semen quality. Patients with low fertility or infertility can be identified and provided with corresponding treatments.
Keywords: semen quality analysis, factor analysis, score coefficient, dimensionality reduction
Introduction
Semen quality analysis is one of the important methods to assess male fertility and is also the primary experimental basis for the diagnosis and treatment of male infertility. In recent years, with environmental pollution, increased life pressure, lifestyle changes, and other factors, the quality of semen has decreased.1 Therefore, semen quality assessment is very important for the management of infertility. Routine semen analysis is the most basic method for evaluating sperm quality and male fertility, which includes assessment of semen volume, sperm survival rate, forward motility rate, concentration (density), morphology, etc. However, a routine semen analysis cannot accurately assess male fertility or predict sperm fertilization and pregnancy outcomes. Previous evidence has shown that 15% of men with normal semen parameters have infertility.2 In recent years, with the increase in unhealthy living habits and the worsening of environmental quality, the incidence of infertility has also increased. Male infertility accounts for approximately half of the infertility cases. Among them, only 14–15% have oligospermia, asthenospermia, or teratospermia.3 Therefore, semen parameters may not accurately indicate male fertility.
Semen quality is the most basic and direct indicator for establishing male reproductive health.4–6 The primary indicators for evaluating the quality of semen include semen volume, sperm concentration and motility, the percentage of progressive spermatozoa, and standard sperm percentage. These indicators can be detected and analyzed by computer-aided sperm analysis.
Due to a large number of indicators in the current context and the strong correlations between them, an overlap of information may occur. However, in practical applications, it is hoped that a few unrelated comprehensive variables that can retain most of the original information could be used to replace the original variables, thereby achieving the purpose of dimensionality reduction and enabling concise and effective statistical analysis.
Commonly used methods of dimensionality reduction include principal component and factor analysis. The principal component analysis only involves general linear transformations and no models. As such, when using this approach, it may not be easy to explain the principal component as it relates to the actual background and meaning of variables. Conversely, because factor analysis can manipulate the matrices through orthogonal or oblique rotation, the analysis results are easier to interpret; it has therefore been widely used in clinical practice.7–9 When conducting comprehensive evaluation, some scholars have employed principal component or factor analysis,10–13 adopting the variance contribution rate of the extracted common factors as weighting coefficients, linearly combining the common factors, and integrating multiple original indicators into one indicator to evaluate a sample. However, the weight coefficient reflects the importance of the variable, and a factor that introduces large variances will not necessarily represent the important factor in the original information. Considering the limitations of this method, the current study attempted to use orthogonal factor analysis to reduce the dimensions of multiple indicators into several uncorrelated common factors and then analyze their influencing factors from different perspectives. Fewer evaluation indices are needed for sperm quality assessment after dimensionality reduction, which is convenient for rapid evaluation in a large population or self-assessment.
Methods
Ethics Approval and Consent to Participate
The Ethics Committee of the National Research Institute for Family Planning approved the study. All participants were informed about this study and signed consent forms before completing the questionnaire and agreeing to donate a sample of semen in the current scientific research. Informed consent was obtained from all participants. All methods were carried out in accordance with relevant guidelines and regulations.
Subjects
1) Experimental areas: In this study, provincial-level regions were selected from six main geographic areas (ie, northeast, northwest, east, southwest, north, and central south) of China. These regions were middle-developed, non-coastal regions with large populations, representing the population in these areas.
2) Participants:
The target population was healthy and fertile male adults (aged 18–42 years) from pregnancy checkups, birth checkups, perinatal health care services, and pre-pregnancy eugenics screening staff. Preference was given to those who caused a pregnancy within 100 days. Subjects who met the criteria were recruited from the Maternal and Child Health Institutions of these regions. They completed a questionnaire, underwent physical examination, and provided semen samples.
A total of 1132 adult men from seven provinces in China (ie, Zhejiang, Henan, Hebei, Guangxi, Jiangxi, Heilongjiang, and Xinjiang) were recruited. The sample sizes were 229, 324, 212, 103, 85, 107, and 72, respectively.
Physical Examinations
This study followed the principle of voluntary participation. Before data collection, the researchers communicated with the participants to explain the purpose of the study, the significance of the investigation, and the investigative process. The researchers used a unified questionnaire to conduct face-to-face interviews; the topics of these interviews were primarily related to the participants’ family situation, the general situation of both spouses, established an evaluation of family life (sex/marital life, etc.), and living habits (smoking, drinking, etc.). Additionally, each participating male had to provide a semen sample at the survey site. Before conducting the physical examination, the men who met the required days of abstinence provided semen samples through masturbation.
Laboratory Tests
The leading indicators for evaluating the quality of semen include semen volume, sperm concentration and motility, the percentage of progressive spermatozoa, and total sperm count. The semen quality qualification standard of the World Health Organization (WHO) “Male Semen Quality Diagnostic Criteria 2010 Fifth Edition”14–16 was adopted. The semen collection methods, instructions, and precautions were introduced to all subjects by a doctor before sample collection to ensure its integrity. Subjects performed semen collection by masturbation in a separate room. The abstinence time (the time since the last ejaculation) was 48 hours to 7 days.
Semen volume: A semen sample was collected in a sample container and weighed. A semen density of 1 g/mL was assumed for all samples.
Semen pH value: The semen was thoroughly mixed. Then, a drop of semen was placed on the pH test paper. After the color of the dipping area was completely uniform, it was compared with the standard pH strip, and the pH value was recorded.
The semen was thoroughly mixed, and a small proportion of samples was removed for microscopic observation. More than 10 fields of view were observed under a 400× microscope, and over 200 sperm were counted. Sperm motility and movement classification were analyzed.
The total number of sperm in semen was calculated by measuring the concentration of sperm in the semen and the semen volume. Sperm concentration was performed using a modified Neubauer blood cell counting plate, and more than 200 sperm were counted for each sample.
Correlation Analysis
The correlation analysis among variables was performed using “chart.Correlation” in the PerformanceAnalytics package of the R programming language (version 3.6.3 [2020-02-29]).
Factor Analysis
Factor analysis focuses on finding the internal structure between variables by studying the correlation matrix or covariance matrix of the variables involved. Accordingly, it establishes several common factors (or principal/latent factors) that control all of the variables; the purpose of doing so is to reduce the dimensionality of the original variables. Factor analysis must establish a mathematical model and make certain assumptions about the relevant preconditions. In the present study, X=(X1, X2, …, Xp)’ was the research vector, and F=(F1, F2, …, Fm)’ was the vector comprising common factors. Generally, m<p for the model was X=AF + ε if the following constraints were met:


When cov(Fi, Fj)=0, i≠j, the X=AF + ε model was labeled the orthogonal factor model; otherwise it was called the oblique rotation model, where matrix A=(αij)p×m was labeled the factor loading matrix, and αij reflected the closeness of the relationship between the ith variable and the jth public factor. The larger the value of |αij| was, the closer the correlation between the ith variable and the jth public factor. If Xi was the standardized variable, αij was the correlation coefficient between the ith variable and the jth public factor.  was the variance contribution of the jth common factor and was an index for measuring the importance of the jth common factor, ie, Fj; the larger this value was, the greater the contribution of Fj to X. It was generally required that the cumulative variance contribution rate be greater than 70%.13 The researcher could decide the number of common factors to retain based on the cumulative variance contribution rate.
The suitability of factor analysis was tested using Bartlett’s test of sphericity. The Kaiser–Meyer–Olkin (KMO) sampling adequacy measure was used to represent the correlation between variables.
The visualization of correlations between variables was realized using a function chart and correlation in the PerformanceAnalytics package of the R programming language (version 3.6.3 [2020-02-29]). Factor analysis was carried out using the principal function of the psych package in R. The operation of the model was carried out using principal component analysis and varimax rotation. The contribution rates of the first two common factors to the X variable were 43.7% and 33.98%, respectively. When two common factors were selected, approximately 78% of the information of the original variables could be explained. Since the first two common factors could explain most of the information of the original variables, only two common factors were selected in this study.
Results
Analysis of Demographic Characteristics
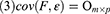
Of the 1132 samples studied, most were males between 25–30 years old, accounting for 58.3% of the overall sample; 19.27% of the participants were over 30 years old. Industrial workers, police, and scientific research technicians accounted for a large proportion of the research subjects, ie, 20.14, 29.2, and 30.05%, respectively. In terms of education level, the participants who graduated from junior high school accounted for a large proportion (39.9%); the proportion of high school and college graduates was 27.4% and 19.7%, respectively (Table 1).
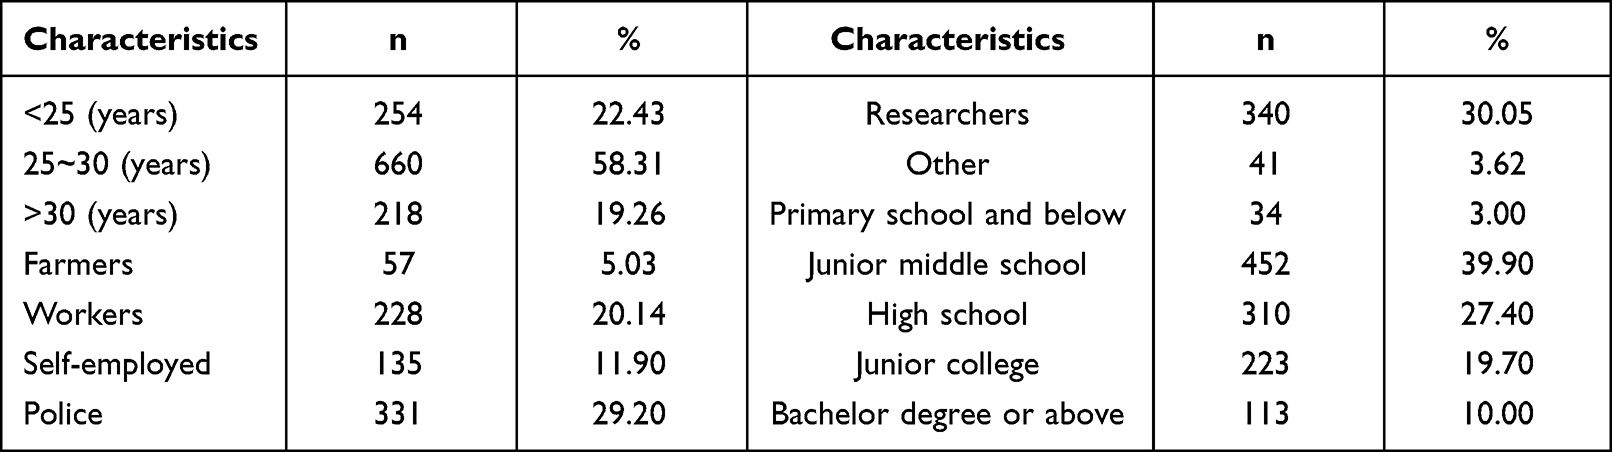 |
Table 1 Analysis of Demographic Characteristics |
Analysis of Semen Quality Indices
In this study, the average semen volume of the 1132 adult males was 3.0245 mL. Based on the evaluation standard of semen quality, the abnormal rate was 3.2%; the average semen concentration was 57.99 million/mL, and the abnormal rate was 4.2%. The average value of the total sperm count was 175.57 million, and the abnormal rate was 5.2%. The average percentage of forward-moving sperm was 43.7%, and the abnormal rate was 16.5%. The average sperm motility rate was 51.22%, and the abnormal rate was 19.4%; in this instance, the abnormal rates of forward-moving sperm and sperm motility were the highest, and these two aspects were also the leading research indicators of abnormal semen quality (Table 2).
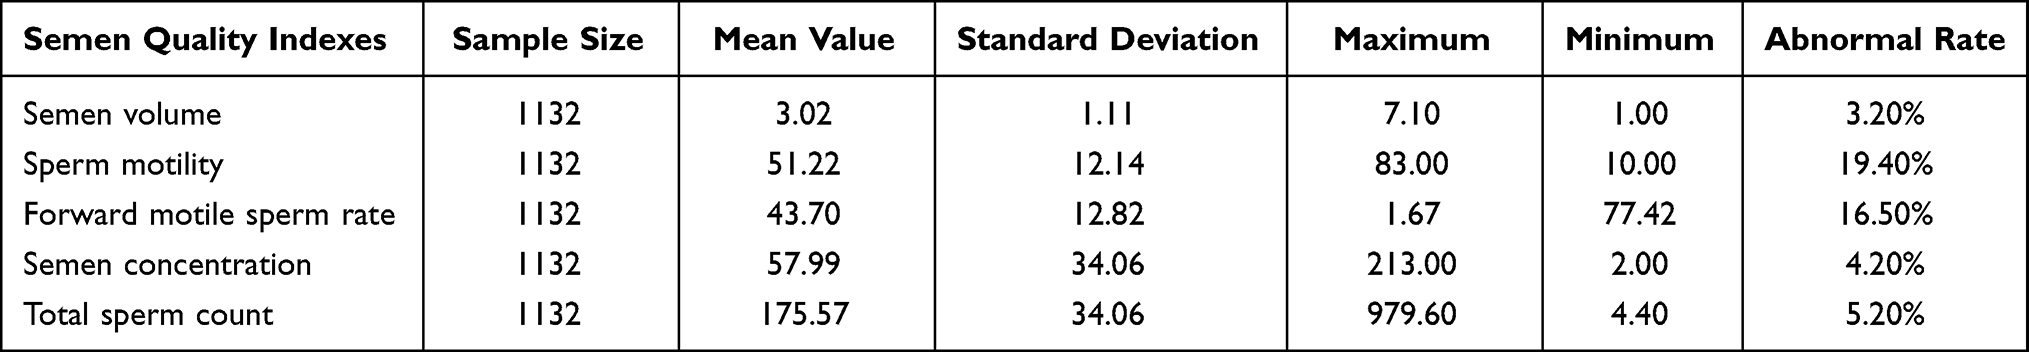 |
Table 2 Descriptive Statistical Analysis of Semen Quality Indexes |
Correlation Analysis of Semen Quality Indices
When the volume of semen was large, other indicators could also be larger. Therefore, the correlation between variables was strong. As shown in Figure 1, Pearson’s correlation coefficient yielded the following results: (1) between the forward movement of sperm and sperm motility, the correlation coefficient was as high as 0.92; (2) the correlation coefficient between total sperm count and semen concentration was 0.81; (3) the correlation coefficient between semen volume and total sperm count was 0.51; (4) between total sperm count and forward-moving sperm rate the correlation coefficient was 0.15. These correlations were significant at a 0.001 level. Pearson’s correlation coefficient between semen concentration and the forward-moving rate of sperm, as well as between total sperm count and sperm forward-moving rate, was significant at the level of 0.05. Because of the strong correlation between the original variables, we first conducted dimensionality reduction using factor analysis. The purpose was to seek out potential factors that controlled all of the included variables.
 |
Figure 1 Pearson’s correlation coefficient was performed to analyze the correlations of semen quality indicators using the correlation function in the Performance Analytics package of the R language (**P<0.01, ***P<0.001). |
Factor Analysis
Factor analysis is conducted to find the internal structure of variables and requires a sample of adequate size; the ratio of the sample size to variable number should be more than 5:1, and the total sample size should not be less than 100. In this study, the sample size was 1132, and the number of research variables was 5, thereby meeting the requirements of factor analysis. Bartlett’s test of sphericity showed that the chi-square value of the statistics was 4852.91, the degree of freedom was 10, the P-value was 0.000, and the correlation between variables was significant. The KMO value of this study was 0.78, and the correlation between the variables was strong; these results were suitable for conducting factor analysis.
In this study, factor analysis was carried out using the principal function in the psych package of the R programming language. Additionally, principal component analysis, combined with varimax rotation, was used in the operation of the model. The contribution rates of the first two common factors to variable X were 43.7% and 33.98%, respectively. When two common factors were selected, approximately 78% of the information of the original variables could be explained. Since the first two common factors could explain most of the information of the original variables, this study selected two common factors only. The common degrees of variables among semen volume, sperm motility rate, forward-movement rate, concentration, and total sperm count were 0.30, 0.957, 0.958, 0.695, and 0.976, respectively. Except for the semen volume variable, other variables could be explained by the first two common factors. Accordingly, when the two common factors were selected, more information was retained from the original variables, which was considered a reasonable result. The factor analysis model is given as follows:
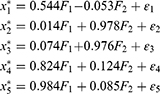
All of  in the above formula were standardized variables. The factor model shows that the correlation coefficients between the quantitative factor and sperm density, total sperm count, and semen volume were 0.824, 0.984, and 0.544, respectively. All three correlation coefficients were positive, suggesting that the greater the amount of semen, the greater the density of the sperm; additionally, the greater the sperm count, the greater the value of the quantitative factor. Furthermore, the density and concentration of sperm were significantly correlated with the total sperm count. These three indicators reflected quantitative information, and, as such, this factor can be considered quantitative in nature. The correlation coefficients between the quality factor, sperm motility, and the percentage of forward-moving sperm were 0.978 and 0.976, respectively; both correlation coefficients were positive, suggesting that the higher the sperm activity rate, and the greater the percentage of forward-moving sperm, the greater the value of the quality factor. These two indicators mainly reflected the motility of sperm, and the stronger the activity ability, the higher the quality of sperm would be. This factor can therefore be considered to be qualitative in nature. Because the orthogonal factor model was used, the two common factors were uncorrelated and had no overlapping information.
Factor Loading Analysis
The relationship between the above variables and common factors was also clearly reflected by the factor load diagram. This diagram was created using the ggplot2 package of the R programming language. Figure 2 shows that sperm concentration, semen volume, and total sperm count are clustered near the positive half-axis of the quantitative factor, suggesting that they are highly correlated with one another and have the closest relationship with the quantitative factor. The forward-moving sperm rate and motility rate were clustered near the positive half-axis of the quality factor, suggesting that they were highly correlated with one another and had the closest relationship with the quality factor. Hence, the first two common factors extracted most of the information of the original variables, had strong comprehensive abilities, and could describe the primary characteristics of semen (Figure 2).
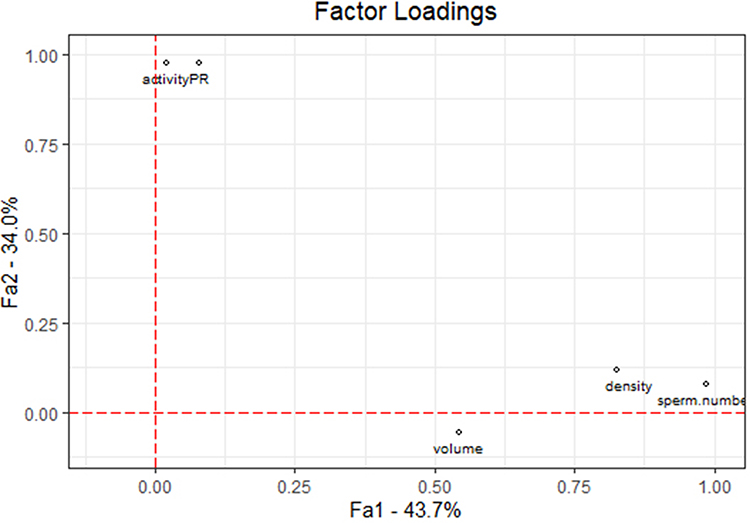 |
Figure 2 The factor load diagram was obtained using the principal function in the psych package of the R language. |
In the above sections, the problem of using a linear combination of common factors to represent a group of observation variables was solved. If we want to apply these factors to other studies, eg, adopting the obtained factors as variables to classify or evaluate samples, the measurement of common factors must be conducted. That is, the values of the common factor must be provided. Here, the principal function of the psych package in the R programming language was used, and the score coefficient was estimated using the regression method as follows:
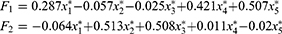
The variables in the above formula were normalized; the order of importance of the variables was consistent with the load coefficient of the above common factors. By substituting the normalized value of the X variable into the above formula, the values of the first and second common factors of each observation in the sample could be obtained. In the quantitative factor expression, the coefficients of semen volume (x1), semen concentration (x4), and total sperm count (x5) were relatively large; when these values of a participant were comparatively large, the score of the quantitative factor was large, suggesting that the overall sperm count was large. In quality factor expression, the coefficients of sperm motility (x2) and forward-moving sperm rate (x3) were large; where this was the case, the score of the quality factor was large, suggesting that the quality of sperm was relatively high. Taking P5 as the lower reference limit and P100 as the upper reference value, the reference value range of the quantitative factor value was –1.2515 to 5.2812, and the reference value range of the quality factor value was –1.7376 to 2.5731. In the cohort, 1024 participants had a score above P5 for both factors, accounting for 90.46% of the total sample size. The following section focuses on the main factors affecting semen and sperm quantity.
Statistical Analysis of Other Factors
The indicators affecting semen quality may include age, body weight, body mass index (BMI), age of the first spermatorrhea, the frequency of sexual intercourse, and may also include lifestyle habits, such as whether the men smoked or drank, the number of abstinence days, men’s level of satisfaction with their married and sexual lives, as well as other factors. The meanings of these variables and the average values of common factors among the corresponding groups are presented in Table 3.
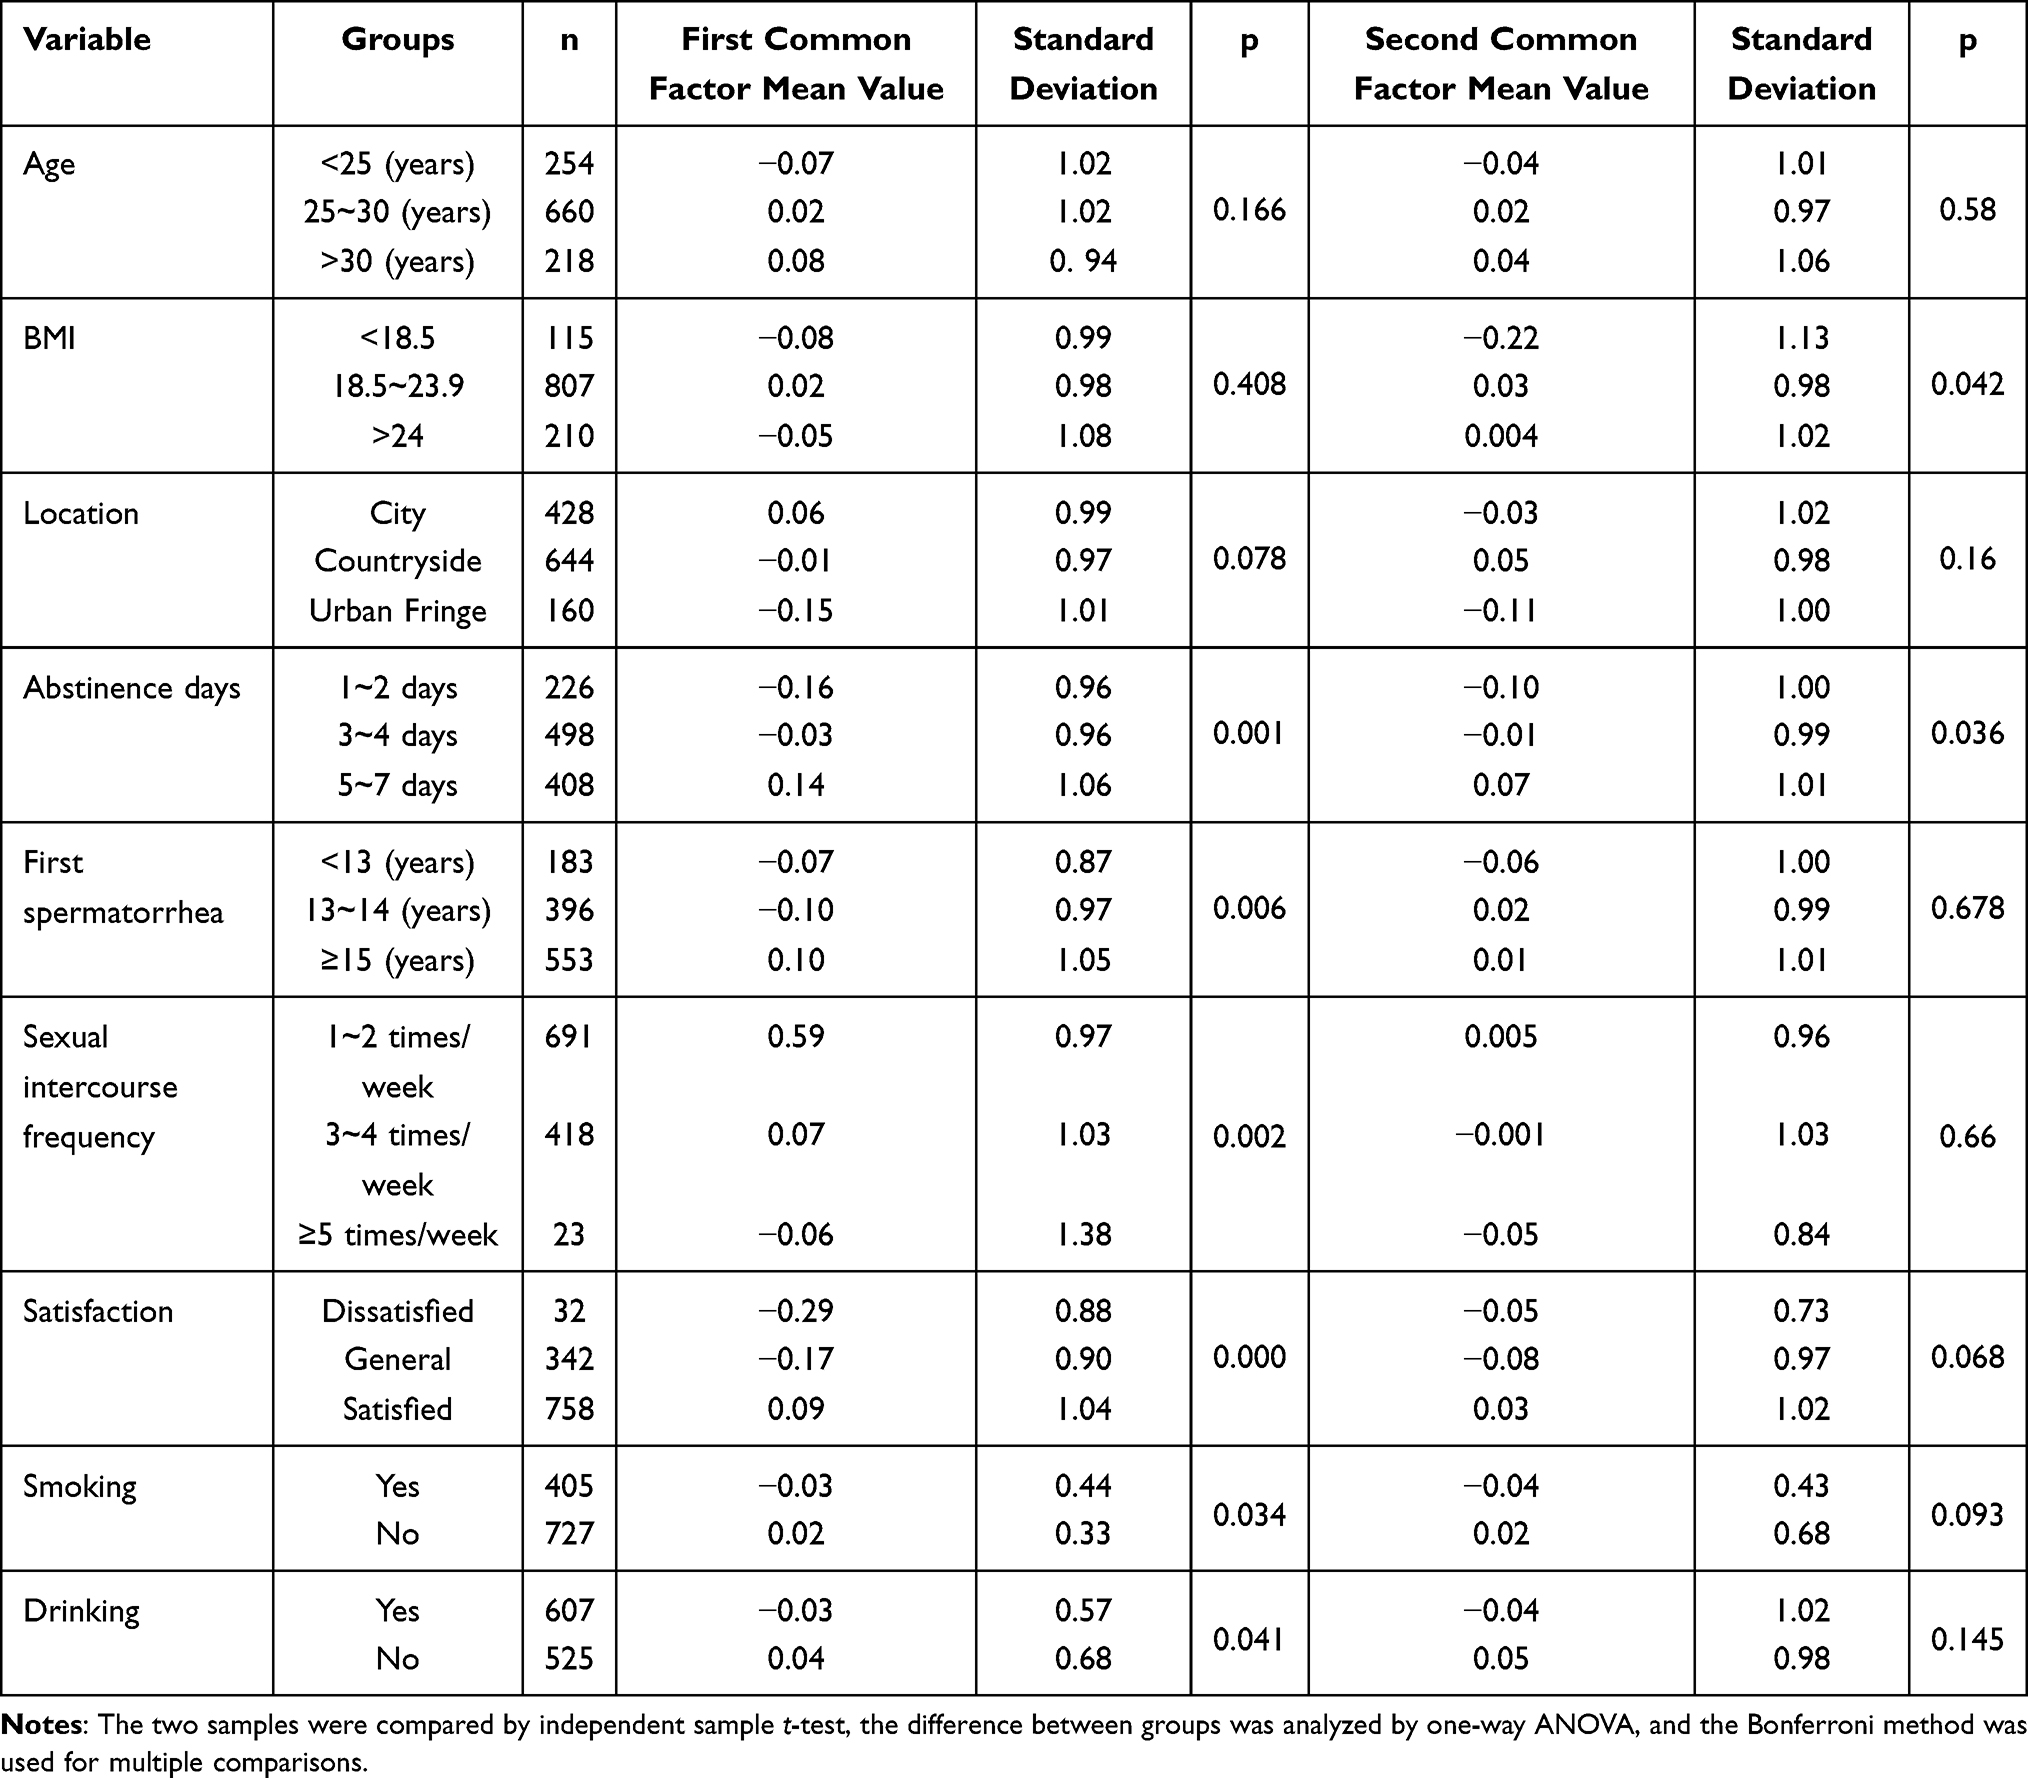 |
Table 3 Descriptive Statistical Analysis of Influencing Factors and Variables |
Discussion
Semen is mainly composed of sperm and seminal plasma. Semen parameters are used as a surrogate index for the clinical evaluation of male fertility. The purpose is to evaluate male fertility levels, especially for those with low fertility or infertility, provide treatment guidance, evaluate curative effects, and assist reproductive technology outcome prediction. Parameters such as the total number of sperm, concentration, and motility in a routine semen analysis are important parameters for evaluating semen quality. Although semen analysis cannot be used as a direct evaluation method and the gold standard for male fertility, it is the simplest, most intuitive, and most important evaluation method.
Semen quality itself consists of multiple indicators. How to accurately judge the quality of semen through the original semen analysis data report has always been a problem that plagues male doctors. Although there is a universal WHO semen quality evaluation standard globally, the test items of the evaluation standard are scattered. The statistical analysis combined with WHO standards and comprehensive evaluation of semen quality indicators will help clinicians accurately judge semen quality and research quality trends. It was found that the total number of sperm and the speed of movement play an important role in evaluating semen quality using factor analysis. This conclusion is consistent with previous studies.17 Combined with the semen indicators established by WHO, principal component analysis and factor analysis have been applied to semen quality evaluation.10,17–19 Previous studies have found that the principal component analysis method is ideal to comprehensively judge the factors affecting the semen quality of infertile men, but it is not necessarily suitable for the evaluation of the factors affecting the semen quality of normal men.19 In a study of 120 fertile men in Tianjin using WHO standards, only the influence of a single factor on a single component of semen quality was analyzed, and whether a single factor affecting the overall semen quality was not evaluated.20
Regarding the reference value of the WHO semen index at home and abroad, using statistical methods to study the influencing factors of semen quality in different groups, it was found that in different groups, whether living habits affect semen quality is controversial.10 Many scholars have also discussed how an unhealthy lifestyle affects semen quality.21–30 In this study, two common factors were found through factor analysis: the quality and quantity factors. Through the analysis of lifestyle and other factors, it was found that abstinence time, sexual satisfaction, and smoking impact quality and quantitative factors. The age of the first spermatorrhea, frequency of having sex every week, place of residence, and alcohol consumption mainly affect the quantitative factors. BMI affects the quality factor within a certain range. Because there was no correlation between the common factors of the orthogonal factor model and as the results were easy to explain, the orthogonal factor model was used for analysis in this study. Research vector X is a commonly used measurement indicator of semen quality in terms of semen volume and concentration, sperm activity rate, total sperm count, and the forward-moving sperm rate. In this study, based on the factor model, the score coefficient of the common factor was estimated using the regression method, and the common factor was expressed as a linear combination of different variables to further obtain the factor score for each observation. In this way, the problem of the original p-dimensional space was transformed into the problem of the m (m<p) dimensional space. It is clear how lifestyle affects the quality of semen in a low-dimensional space.
The indicators derived from factor analysis are also the easiest to obtain. Compared with sperm morphology analysis and function analysis, the main work is done manually and only requires the assistance of a microscope and hemocytometer. Semen quality analysis requires that the collected fresh semen be tested and analyzed after being liquefied for 0.5 hours. In remote areas with limited equipment, only manual testing can be done. Moreover, after the dimensionality reduction of conventional semen analysis results, the number of observation indicators is reduced, which is beneficial for community workers to quickly assess the semen quality of men of reproductive age, and it is also convenient for large-scale inspections.
There are several limitations in this study that still need to be improved. First of all, we focused on male respondents who had been confirmed to be fertile and excluded female-related infertility issues; therefore, the population distribution may not be even. As a result, when analyzing the population according to five-year intervals, the age of volunteers was relatively concentrated in the 25–30 age range. Second, we focused on fertile populations, and most of them were normal populations. We did not refer to the standard BMI of ≥25 in the WHO male infertility research but adopted the WHO standard according to the Chinese BMI of ≥24 to analyze its effect on semen quality for overweight individuals. These data may not be generalized. Third, the data were from fertile males in mainland China. When applying the results to other regions or ethnic groups worldwide, additional adjustment factors may be added. Fourth, some variables that might affect semen quality parameters were not included, such as detailed smoking status and nutritional content. Therefore, the smoking status coefficient in this study may not reveal the relationship between different smoking statuses and semen quality in the real world. In future semen analysis, quantitative and qualitative factors can be combined to describe the quality of semen.
Conclusion
In this study, factor analysis was used to evaluate semen quality. According to the constructed factor analysis model, the quantitative factor had a significant correlation with semen volume and concentration, as well as total sperm count, and was thus denoted a quantitative factor. The common quality factor was highly correlated with sperm motility and the forward-movement sperm rate and was thus denoted as being a quality factor. Also, fewer evaluation indices are needed for sperm quality assessment after dimensionality reduction, which is convenient for rapid evaluation in a large population.
Ethics Approval and Consent to Participate
This study was conducted with approval from the Ethics Committee of National Research Institute for Family Planning (No:2013FY110500). This study was conducted in accordance with the declaration of Helsinki. Written informed consent was obtained from all participants.
Consent for Publication
All participants signed a document of informed consent.
Funding
This study was funded by the Special Foundation for State Basic Research Program of China (2013FY110500); Developing Science and Education Foundation of Second Affiliated Hospital of Soochow University (XKTJ-RC202002).
Disclosure
The authors report no conflicts of interest in this work.
References
1. Zhu QX, Meads C, Lu ML, Wu JQ, Zhou WJ, Gao ES. Turning point of age for semen quality: a population-based study in Chinese men. Fertil Steril. 2011;96(3):572–576. doi:10.1016/j.fertnstert.2011.06.058
2. Agarwal A, Allamaneni SS. Sperm DNA damage assessment: a test whose time has come. Fertil Steril. 2005;84(4):850–853. doi:10.1016/j.fertnstert.2005.03.080
3. Dada R, Gupta NP, Kucheria K. Molecular screening for Yq microdeletion in men with idiopathic oligozoospermia and azoospermia. J Biosci. 2003;28(2):163–168. doi:10.1007/BF02706215
4. Bartoov B, Eltes F, Pansky M, Lederman H, Caspi E, Soffer Y. Estimating fertility potential via semen analysis data. Hum Reprod. 1993;8(1):65–70. doi:10.1093/oxfordjournals.humrep.a137876
5. Wright A. The current state and future of factor analysis in personality disorder research. Personal Disord. 2017;8(1):14–25. doi:10.1037/per0000216
6. Akeroyd MA, Guy FH, Harrison DL, Suller SL. A factor analysis of the SSQ (Speech, Spatial, and Qualities of Hearing Scale). Int J Audiol. 2014;53(2):101–114. doi:10.3109/14992027.2013.824115
7. Danielewicz A, Przybyłowicz KE, Przybyłowicz M. Dietary patterns and poor semen quality risk in men: a cross-sectional study. Nutrients. 2018;10:1162.
8. Nassan FL, Jensen TK, Priskorn L, Halldorsson TI, Jrgensen N, Jørgensen N. Association of dietary patterns with testicular function in young Danish men. JAMA Network Open. 2020;3(2):e1921610. doi:10.1001/jamanetworkopen.2019.21610
9. Ana CT, Evdochia A, Navarrete-Muoz EM, et al. Adherence to diet quality indices in relation to semen quality and reproductive hormones in young men. Human Reprod. 2019;10(10):1866.
10. Agarwal A, Sharma RK, Nelson DR. New semen quality scores developed by principal component analysis of Semen characteristics. J Androl. 2003;24(3):343–352. doi:10.1002/j.1939-4640.2003.tb02681.x
11. World Health Organization. WHO Laboratory Manual for the Examination and Processing of Human Semen.
12. Cooper TG, Auger J, Baker HWG, et al. World Health Organization reference values for human semen characteristics. Hum Reprod Update. 2010;16(3):231–245. doi:10.1093/humupd/dmp048
13. Rowe P, Comhaire F, Hargreave T, et al. WHO Manual for the Standardized Investigation, Diagnosis and Management of the Infertile Male.
14. Rahban R, Nef S. Regional difference in semen quality of young men: a review on the implication of environmental and lifestyle factors during fetal life and adulthood. Basic and Clinical Andrology. 2020;30. doi:10.1186/s12610-020-00114-4
15. Chung MK, Buck Louis GM, Kannan K, et al. Exposome-wide association study of semen quality: systematic discovery of endocrine disrupting chemical biomarkers in fertility require large sample sizes. Environ Int. 2019;125:505–514. doi:10.1016/j.envint.2018.11.037
16. Yang H, Chen Q, Zhou N, Sun L, Cao J. Lifestyles associated with human semen quality: results from marhcs cohort study in Chongqing, China. Medicine. 2015;94(28):e1166. doi:10.1097/MD.0000000000001166
17. Wang QL. [Application of factor analysis in comprehensive evaluation of semen quality]. Natl J Androl. 2012;18(08):731–737. Chinese.
18. Wu JQ, Gao ES, Yang QY, et al. [Principal component analysis of semen quality of Chinese young men]. Chin J Health Stat. 2003;2003(04):25–28. Chinese.
19. Zhang XX, Sun H, Jian BL. [Evaluation of semen quality of infertile men by principal component analysis]. J Med Forum. 2010;31(22):
20. XIu RJ, Zhao L, Dong Y, et al. [Analysis of semen quality of 120 fertile men in Tianjin]. J Int Reprod Health/Fam Plan. 2012;31(02):
21. Gabrielsen JS, Tanrikut C. Chronic exposures and male fertility: the impacts of environment, diet, and drug use on spermatogenesis. Andrology. 2016;4(4):648–661. doi:10.1111/andr.12198
22. Omran GA, Gaber HD, Mostafa NAM, et al. Potential hazards of bisphenol A exposure to semen quality and sperm DNA integrity among infertile men. Reprod Toxicol. 2018;81:188–195. doi:10.1016/j.reprotox.2018.08.010
23. Han X, Zhou N, Cui Z, et al. Association between urinary polycyclic aromatic hydrocarbon metabolites and sperm DNA damage: a population study in Chongqing, China. Environ Health Perspect. 2011;119(5):652–657. doi:10.1289/ehp.1002340
24. Zhou N, Cui Z, Yang S, et al. Air pollution and decreased semen quality: a comparative study of Chongqing urban and rural areas. Environ Pollut. 2014;187:145–152. doi:10.1016/j.envpol.2013.12.030
25. Eisenberg ML, Kim S, Chen Z, Sundaram R, Schisterman EF, Buck Louis GM. The relationship between male BMIand waist circumference on semen quality: data from theLIFE study. Hum Reprod. 2014;29(2):193–200. doi:10.1093/humrep/det428
26. Jurewicz J, Radwan M, Sobala W, et al. Lifestyle and semen quality: role of modifiable risk factors. Syst Biol Reprod Med. 2014a;60(1):43–51. doi:10.3109/19396368.2013.840687
27. Sharma R, Harlev A, Agarwal A, Esteves SC. Cigarette smoking and semen quality: a new meta-analysis examining the effect of the 2010 World Health Organization laboratory methods for the examination of human semen. Eur Urol. 2016b;70(4):635–645. doi:10.1016/j.eururo.2016.04.010
28. Ruixue W, Hongli Z, Zhihong Z, Rulin D, Dongfeng G, Ruizhi L. The impact of semen quality, occupational exposure to environmental factors and lifestyle on recurrent pregnancy loss. J Assist Reprod Genet. 2013;30(11):1513–1518. doi:10.1007/s10815-013-0091-1
29. Mikkelsen EM, Riis AH, Wise LA, et al. Alcohol consumption and fecundability: prospective Danish cohort study. BMJ. 2016;354:i4262. doi:10.1136/bmj.i4262
30. Teijón M, López GF, Serra O, et al. Semen quality in a population of volunteers from the province of Barcelona. Reprod Biomed Online. 2007;15(4):434–444. doi:10.1016/S1472-6483(10)60370-7
 © 2022 The Author(s). This work is published and licensed by Dove Medical Press Limited. The full terms of this license are available at https://www.dovepress.com/terms.php and incorporate the Creative Commons Attribution - Non Commercial (unported, v3.0) License.
By accessing the work you hereby accept the Terms. Non-commercial uses of the work are permitted without any further permission from Dove Medical Press Limited, provided the work is properly attributed. For permission for commercial use of this work, please see paragraphs 4.2 and 5 of our Terms.
© 2022 The Author(s). This work is published and licensed by Dove Medical Press Limited. The full terms of this license are available at https://www.dovepress.com/terms.php and incorporate the Creative Commons Attribution - Non Commercial (unported, v3.0) License.
By accessing the work you hereby accept the Terms. Non-commercial uses of the work are permitted without any further permission from Dove Medical Press Limited, provided the work is properly attributed. For permission for commercial use of this work, please see paragraphs 4.2 and 5 of our Terms.