Back to Journals » Clinical Interventions in Aging » Volume 17
A Dynamic Nomogram to Identify Patients at High Risk of Poor Outcome in Stroke Patients with Chronic Kidney Disease
Authors Wang F, Zheng X, Zhang J, Jiang F, Chen N, Xu M, Wu Y, Zhou J, Cui X, Zou J ![]()
Received 14 December 2021
Accepted for publication 18 April 2022
Published 10 May 2022 Volume 2022:17 Pages 755—766
DOI https://doi.org/10.2147/CIA.S352641
Checked for plagiarism Yes
Review by Single anonymous peer review
Peer reviewer comments 2
Editor who approved publication: Dr Zhi-Ying Wu
Fusang Wang,1,2,* Xiaohan Zheng,1,2,* Juan Zhang,3,* Fuping Jiang,4 Nihong Chen,5 Mengyi Xu,5 Yuezhang Wu,2 Junshan Zhou,5 Xiaoli Cui,3 Jianjun Zou,2,6
1School of Basic Medicine and Clinical Pharmacy, China Pharmaceutical University, Nanjing, People’s Republic of China; 2Department of Clinical Pharmacology, Nanjing First Hospital, Nanjing Medical University, Nanjing, People’s Republic of China; 3Department of Neurology, Nanjing Yuhua Hospital, Yuhua Branch of Nanjing First Hospital, Nanjing Medical University, Nanjing, People’s Republic of China; 4Department of Geriatrics, Nanjing First Hospital, Nanjing Medical University, Nanjing, People’s Republic of China; 5Department of Neurology, Nanjing First Hospital, Nanjing Medical University, Nanjing, People’s Republic of China; 6Department of Clinical Pharmacology, Nanjing First Hospital, China Pharmaceutical University, Nanjing, People’s Republic of China
*These authors contributed equally to this work
Correspondence: Jianjun Zou; Xiaoli Cui, Email [email protected]; [email protected]
Background and Purpose: Predicting poor outcome for stroke patients with chronic kidney disease (CKD) in clinical practice is difficult. There are no tools available to use for predicting poor outcome in these patients. We aimed to construct and validate a dynamic nomogram to identify CKD–stroke patients at high risk of a 3-month poor outcome.
Patients and Methods: We used data for 502 CKD patients who had an acute ischemic stroke, from Nanjing First Hospital, between September 2014 and September 2020, to train the nomogram. An additional 108 patients enrolled from October 2020 to May 2021 were used for temporal external validation. The performance of the nomogram was evaluated by the area under the receiver operating characteristics curve (AUC) and a calibration plot. The clinical utility of the nomogram was measured by decision curve analysis (DCA) and the clinical impact curve (CIC).
Results: The median age of the cohort was 79 (70– 84) years. Age, urea, premorbid modified Rankin Scale (mRS), National Institutes of Health Stroke Scale (NIHSS) on admission, hemiplegia, mechanical thrombectomy, early neurological deterioration, and respiratory infection were used as predictors of 3-month poor outcome to develop the nomogram. In the training set, the AUC of the dynamic nomogram was 0.873 and the calibration plot showed good predictive ability, and both DCA and CIC indicated the excellent clinical usefulness and applicability of the nomogram. In the external validation set, the AUC was 0.875 and the calibration plot also showed good agreement.
Conclusion: This is the first dynamic nomogram constructed for CKD–stroke patients to precisely and expediently identify patients with a high risk of 3-month poor outcome. The outstanding performance and great clinical predictive utility demonstrated the ability of the dynamic nomogram to help clinicians to deploy preventive interventions.
Keywords: dynamic nomogram, stroke, chronic kidney disease, poor outcome, predict
Introduction
Stroke is the leading cause of death and disability-adjusted life-years in China.1 The prevalence of chronic kidney disease (CKD) ranges from 20% to 35% in patients with stroke.2 CKD–stroke patients are at significantly higher risk of poor outcome or mortality relative to stroke patients without kidney disease.3–6 However, the prediction of poor outcome for CKD–stroke patients is still difficult in clinical practice. So far, there have been no predictive tools that clinicians can use to predict the risk in CKD–stroke patients.
Several nomograms have been developed to predict poor outcome of stroke.7,8 However, because of the impact of CKD on stroke, the pathogenesis, pathological process, and disease progression of CKD–stroke may differ from those of general stroke.9 Hence, the risk factors leading to poor outcome in CKD–stroke patients may be different from those in general stroke patients. These nomograms were constructed using data from general stroke patients rather than CKD–stroke patients, which indicates that the predictors used in these nomograms7,8 may not be applicable to CKD–stroke patients and the nomograms were certainly not appropriate for CKD–stroke patients. Moreover, traditional nomograms have some calculation inferiorities, such as the time-consuming and laborious calculation program, and the fact that only a rough approximation is calculated. The need to develop a clinically applicable predictive tool targeted to CKD–stroke patients has become apparent. A dynamic nomogram is an excellent tool for clinicians to achieve a visualized and rapid risk evaluation according to the patient’s disease characteristics, and has been successfully used for clinical decision making in patients.10–12
As such, we aimed to construct and validate a dynamic nomogram based on independent risk factors to identify CKD–stroke patients who were at high risk of a 3-month poor outcome. We hope that our nomogram can provide useful clinical therapeutic evidence and assistance for clinical decision making.
Materials and Methods
Study Design and Participants
We enrolled acute ischemic stroke patients who were registered in the National Advanced Stroke Center of Nanjing First Hospital (China) between September 2014 and September 2020. Patients were included if they met the following criteria: (1) with a diagnosis of acute ischemic stroke on admission; (2) with a diagnosis of CKD on admission; and (3) age 18 years or older. We excluded patients who: (1) lacked a 3-month modified Rankin Scale (mRS) score; or (2) lacked two or more variables. CKD was diagnosed by two experienced physicians, and was defined as estimated glomerular filtration rate (eGFR) <60 mL/min/1.73 m2 for 3 months or more. All patients were classified into a good outcome group (mRS 0–2) and a poor outcome group (mRS 3–6) according to the 3-month mRS score. This dataset was defined as the training set. We also enrolled patients using same inclusion criteria from October 2020 to May 2021. This dataset was defined as the temporal external validation set. In addition, data from patients aged >65 years and with an eGFR <45 mL/min/1.73 m2 in the temporal external validation set were used for subgroup validation. This study was approved by the Ethics Committee of Nanjing First Hospital (document number: ChiCTR-OCH-14004382) and complied with the Declaration of Helsinki. Informed consent was waived because of the anonymous data.
Variables
Baseline characteristics were recorded on admission, including demographic characteristics, such as age and sex; laboratory data, such as fasting blood glucose and triglycerides; medical history, such as diabetes mellitus and hypertension; medical treatment history, such as previous antiplatelet and previous anticoagulation; and clinical assessment on admission, such as National Institutes of Health Stroke Scale (NIHSS) score on admission and stroke subtype. In-hospital treatment and clinical assessment at discharge were also recorded, including in-hospital medical treatment, such as antiplatelet and anticoagulation; clinical assessment in hospital, such as hemorrhagic transformation and electrolyte disturbance; and clinical assessment at discharge, such as diabetes mellitus and atrial fibrillation. All recorded variables were diagnosed by experienced clinicians according to diagnostic standards. Stroke subtypes were categorized into five different subtypes in accordance with Trial of Org 10172 in Acute Stroke Treatment (TOAST): large artery atherosclerosis, small artery occlusion, cardioembolism, stroke of other determined cause, and stroke of undetermined cause.13 Early neurodeterioration (END) was defined as an increase of 4 points or more in NIHSS score during hospitalization. Dyslipidemia was diagnosed if two or more of the following symptoms occurred: (1) total cholesterol ≥200 mg/dL (5.20 mmol/L); (2) triglyceride ≥150 mg/dL (1.70 mmol/L); (3) low-density lipoprotein ≥120 mg/dL (3.12 mmol/L); and (4) high-density lipoprotein ≤35 mg /dL (0.91 mmol/L).14
Outcome and Renal Function Evaluation
The outcome was a poor outcome, defined as a 3-month mRS score of 3–6 after stroke onset. Follow-up was performed by telephone interview or face to face at 3 months after disease onset. Admission serum creatinine was measured using an enzymatic method and the eGFR was calculated by the Chronic Kidney Disease Epidemiology Collaboration equation: eGFR (mL/min/1.73 m2) = 141 × min (Scr/κ, 1)α × max (Scr/κ, 1)−1.209 × 0.993Age × 1.018 [if female] × 1.159 [if black].15 Renal function was further divided into three stages according to eGFR level: stage 3 (30< eGFR <60), stage 4 (15< eGFR ≤30), and stage 5 (eGFR ≤15).
Statistical Analysis
All data were compared between patients with good outcome and those with poor outcome. Continuous variables were presented as mean ± standard deviation or median with interquartile range, as appropriate. Categorical variables were presented as proportions. The eGFR value was used as a continuous measure. The methods used for nomogram development were as follows. Missing values with missing proportion <5% in the training set were therefore interpolated by k-nearest neighbor classification algorithm. The two-tailed t-test or Mann–Whitney U-test was conducted for all continuous variables and the χ2-test or Fisher’s exact test for categorical variables, as appropriate, to identify candidate covariates. Then, all potential confounders with a P-value <0.1 were included in the multivariate logistic regression model based on the forward stepwise method to select the significant predictors of a 3-month poor outcome. Variables with a P-value <0.05 were considered as independent risk factors and were then used to develop the dynamic nomogram though “Dynnom” package.
The performance of the dynamic nomogram was evaluated in terms of discrimination, calibration, and net benefit. The discriminatory ability of the nomogram was assessed by the area under the receiver operating characteristics curve (AUC). An AUC >0.80 was deemed to show relatively good discrimination. Calibration was mirrored by a calibration plot, which described the degree of fitting between real-world and model-predicted poor outcome. A 45° diagonal line is considered to indicate that model-predicted probabilities are identical to the real-world situation, indicating excellent calibration. Internal validation was carried out using bootstrap resampling to avoid overfitting. In addition, the net benefit of the nomogram was measured by decision curve analysis (DCA)16 and the clinical impact curve (CIC).17 DCA is based on the difference between the proportions of true positives and false positives, and the CIC shows the difference between the number of high-risk cases predicted by the model and the number that actually occurred. Net benefit was calculated using the following formula:

Results
Patient Characteristics
In the training cohort, a total of 793 patients met the inclusion criteria. After excluding 125 patients with a missing 3-month mRS score and 166 patients who were missing two or more variables, 502 CKD–stroke patients were eventually included in our study. The baseline characteristics on admission of patients in the training cohort are summarized in Table 1. The median age of the cohort was 79 years, with 303 males (60.4%). The median eGFR level was 49.13 mL/min/1.73 m2, which implied moderate CKD. Among them, 216 patients (43.0%) were in the good outcome group (median age: 75 years; number of male patients: 142) and 286 patients (57.0%) were in the poor outcome group (median age: 81 years; number of male patients: 141). In the external validation cohort, a total of 108 patients were included, with a median age of 77 years, 59 males (54.6%), and median eGFR of 46.08 mL/min/1.73 m2. There was no significant difference in mortality between patients with different eGFR values (P=0.847), or between patients with and without dialysis dependence (P=0.790) (Table S1). The baseline characteristics of patients in the external validation cohort are described in Table S2. The comparison of baseline characteristics between the training cohort and the external validation cohort is presented in Table S2, and the comparison of in-hospital characteristics between the two cohorts is provided in Table S3.
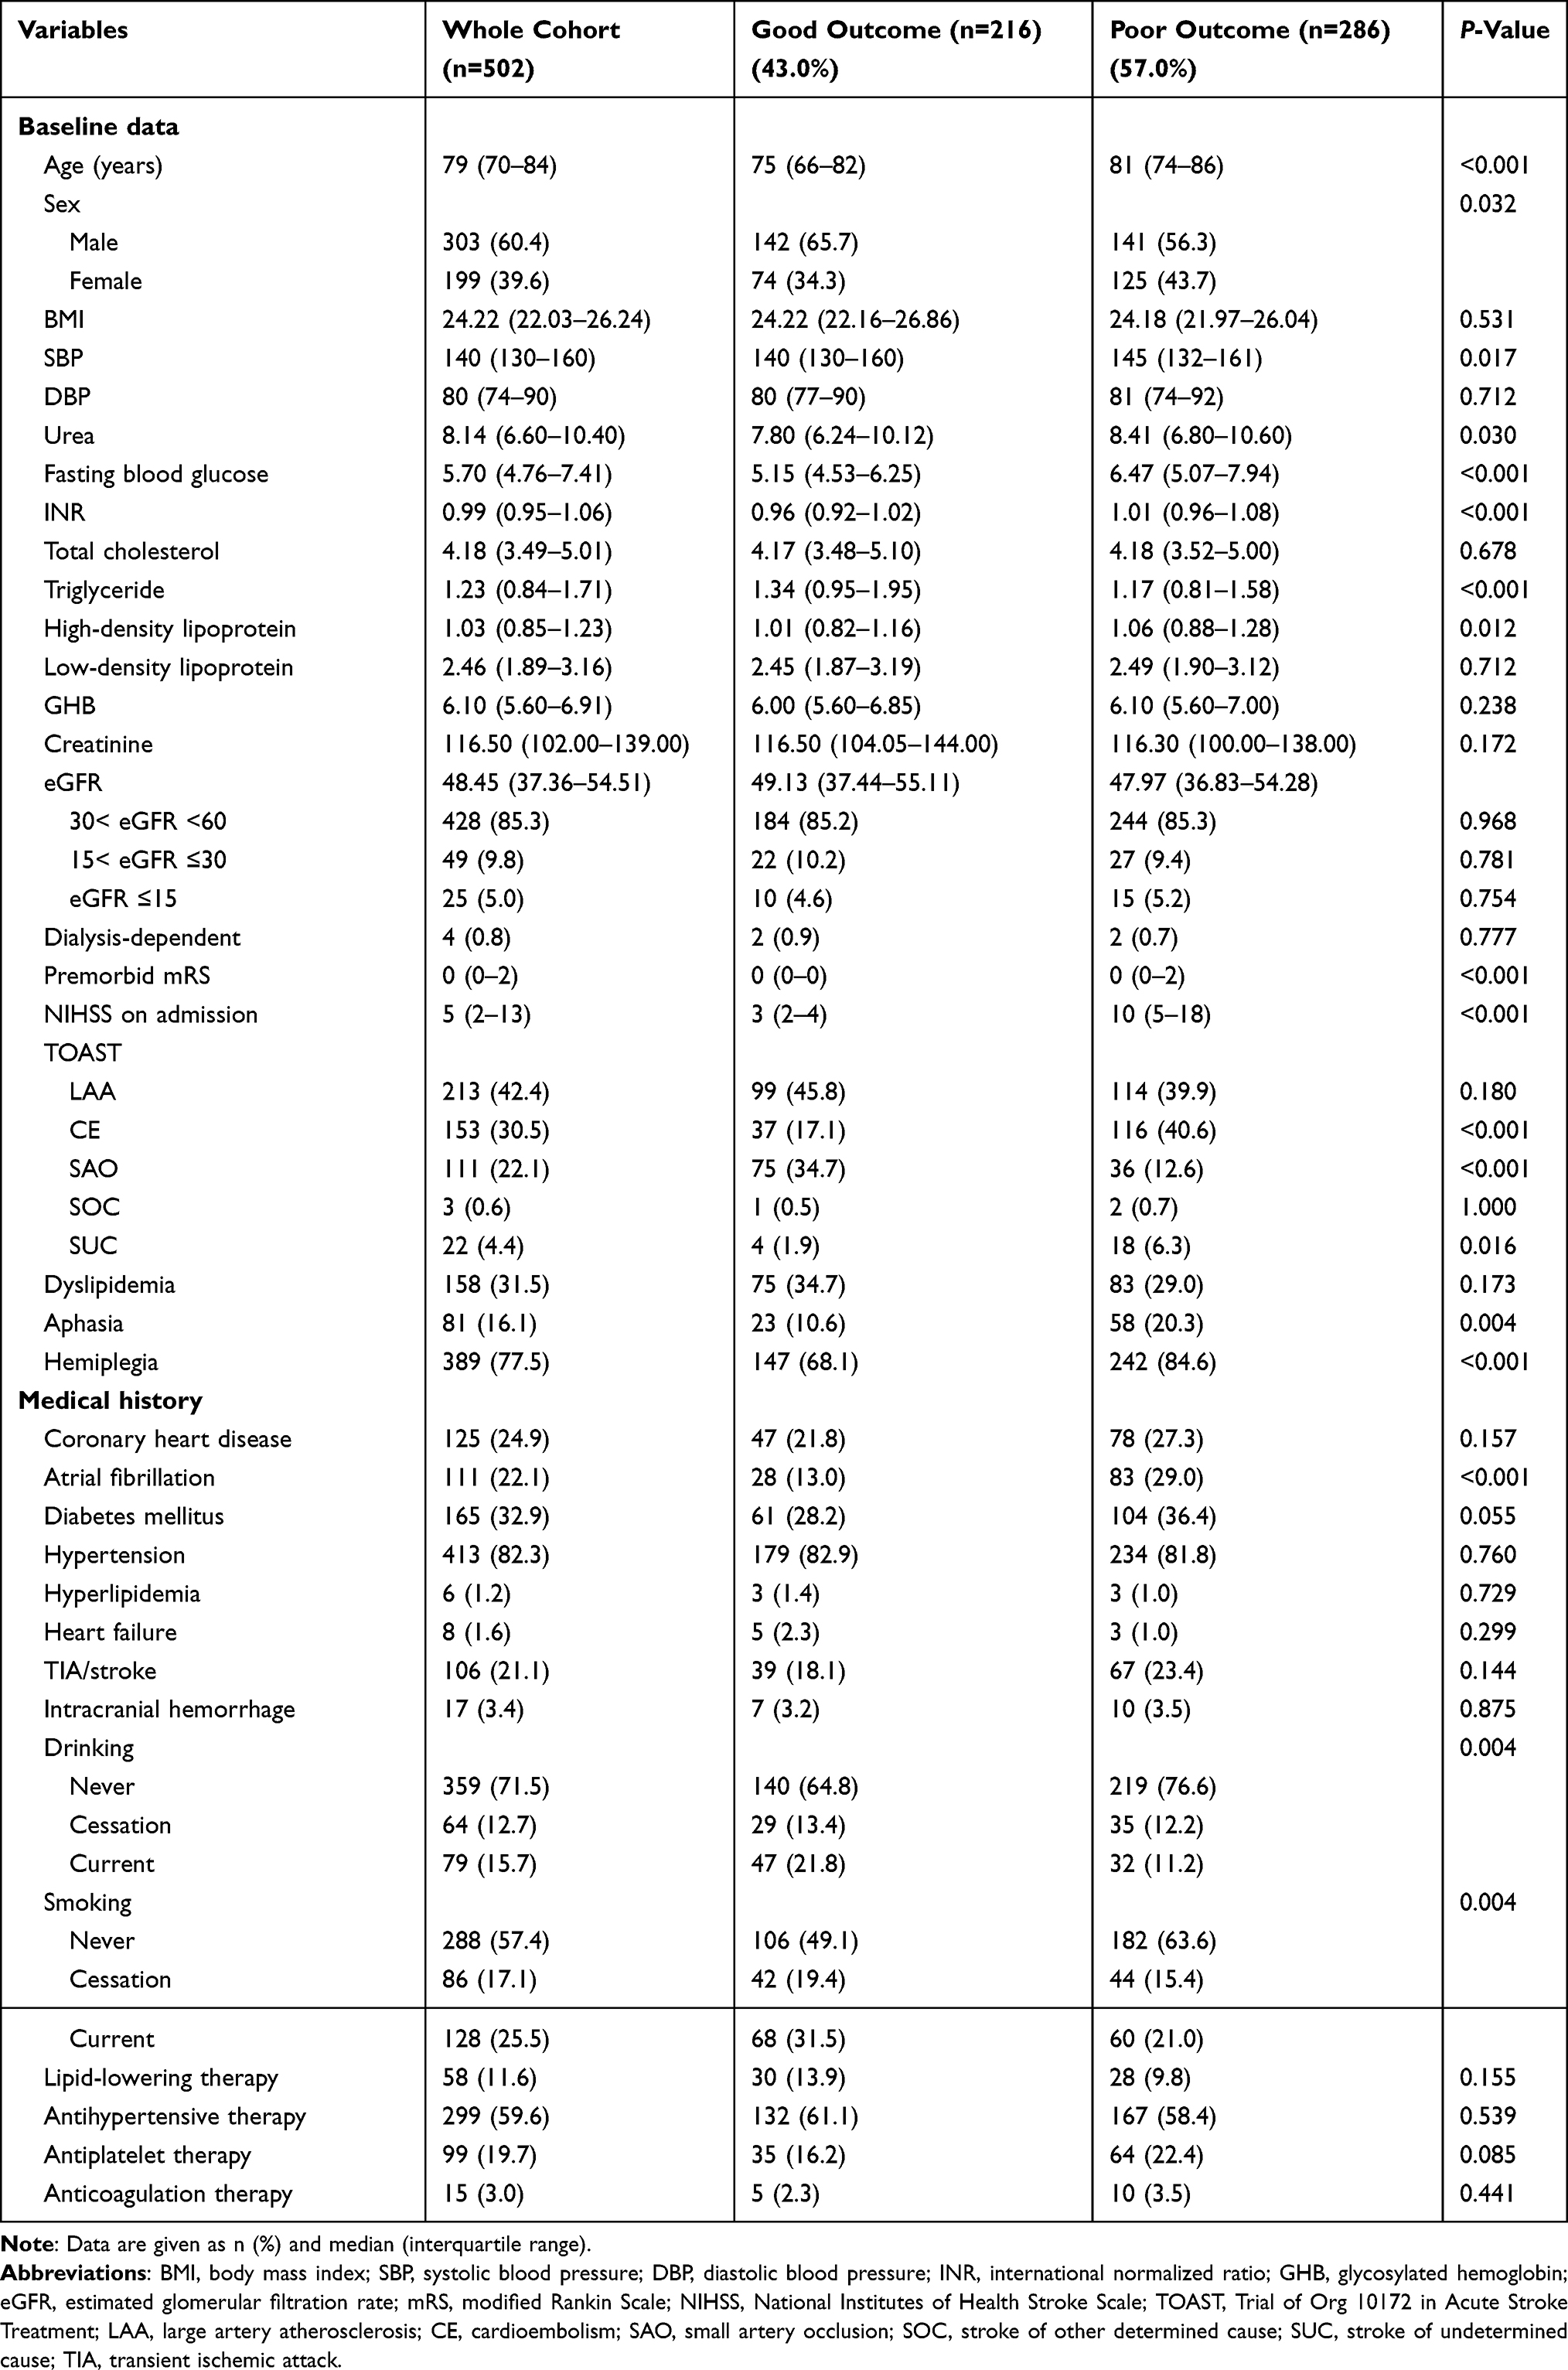 |
Table 1 Baseline Characteristics in the Whole Cohort and Potential Risk Factors Related to 3-Month Poor Outcome by Univariate Analysis |
Variable Selection
Potential risk factors analyzed by univariate analysis for 3-month poor outcome in patients’ baseline characteristics are shown in Table 1, and factors relating to in-hospital characteristics are shown in Table 2. A total of 29 variables (P<0.1) were included in multivariate logistic regression analysis. After adjusting for covariates, eight variables were selected as independent risk factors. The details for selected variables are presented in Table 3, including age (OR: 1.023, 95% CI: 1.001–1.046, P=0.045), urea (OR: 1.069, 95% CI: 1.016–1.125, P=0.010), premorbid mRS (OR: 1.680, 95% CI: 1.298–2.173, P<0.001), NIHSS on admission (OR: 1.187, 95% CI: 1.120–1.258, P<0.001), hemiplegia (OR: 1.942, 95% CI: 1.057–3.568, P=0.032), mechanical thrombectomy (MT) (OR: 0.373, 95% CI: 0.145–0.964, P=0.049), END (OR: 12.744, 95% CI: 3.348–48.508, P<0.001), and respiratory infection (OR: 2.021, 95% CI: 1.162–3.514, P=0.013).
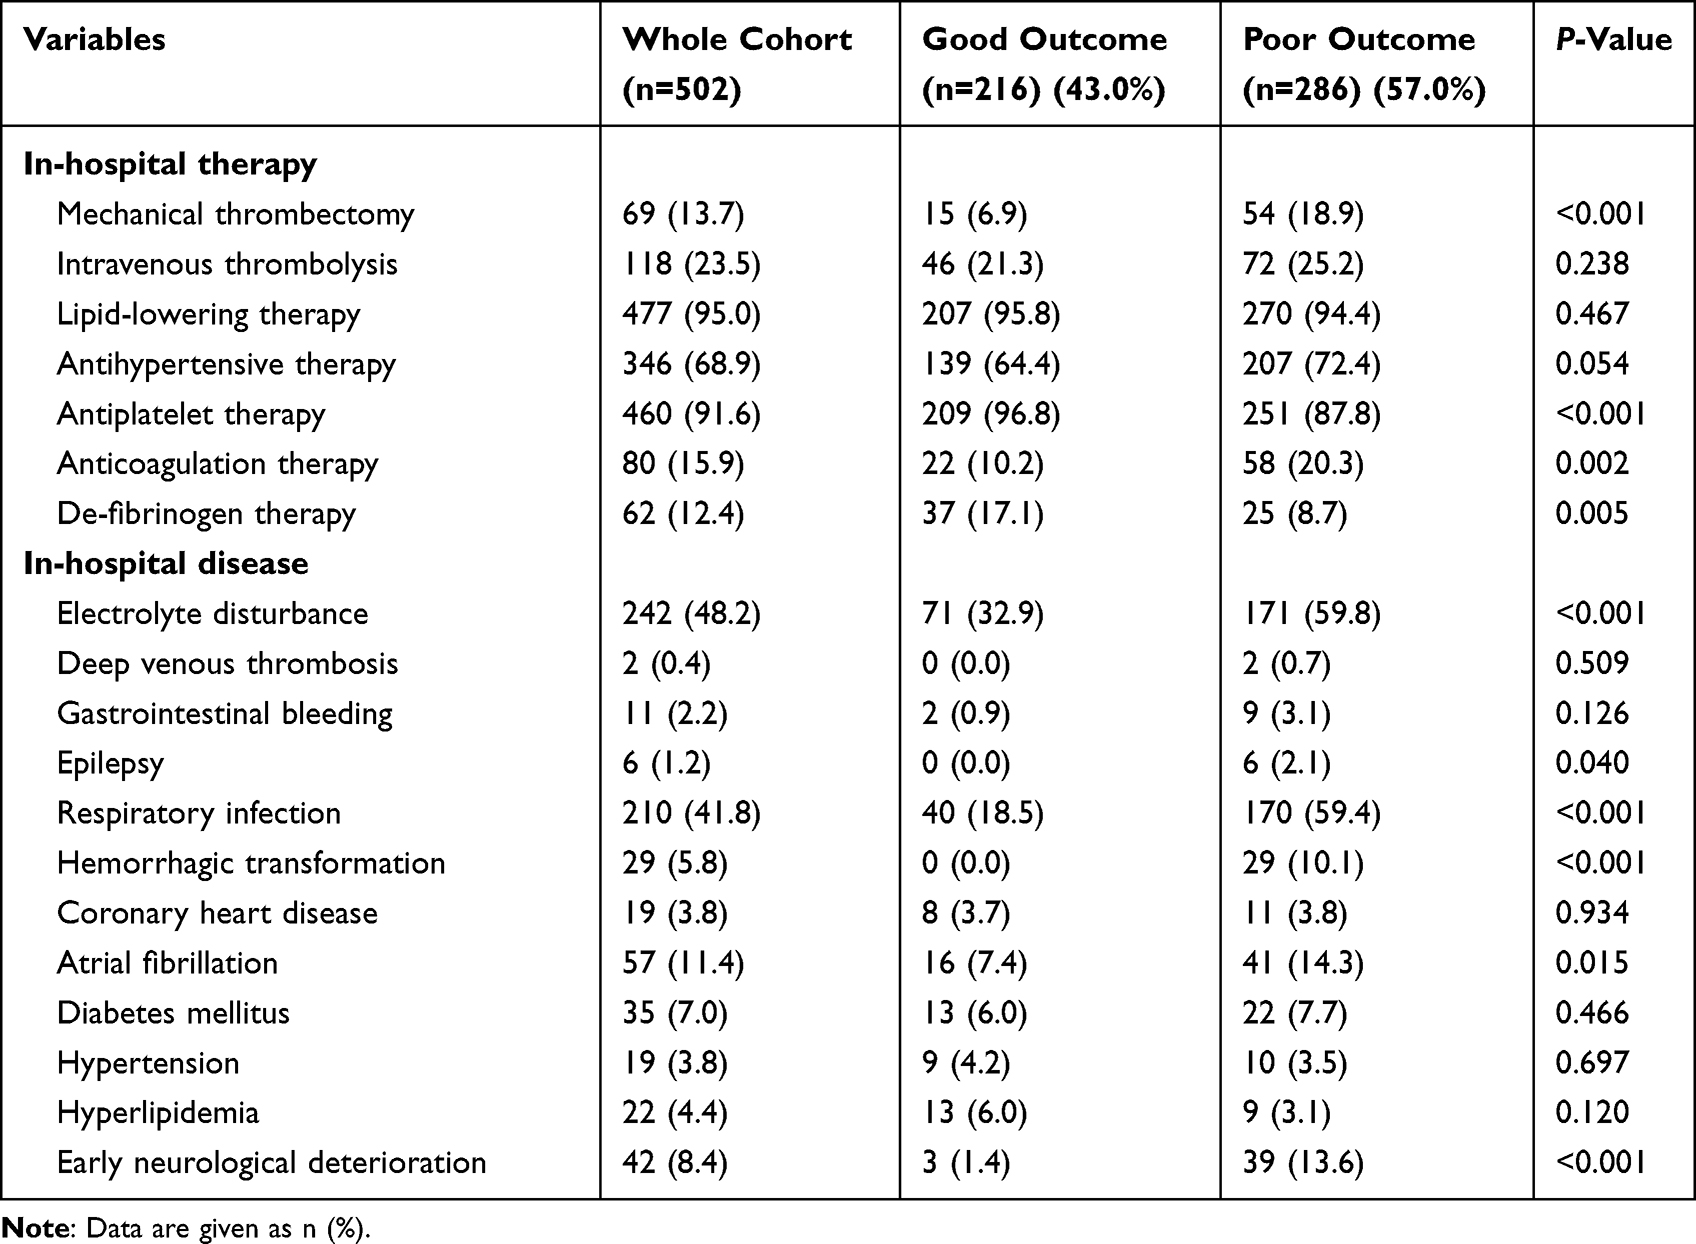 |
Table 2 In-Hospital Characteristics in the Whole Cohort and Potential Risk Factors Related to 3-Month Poor Outcome by Univariate Analysis |
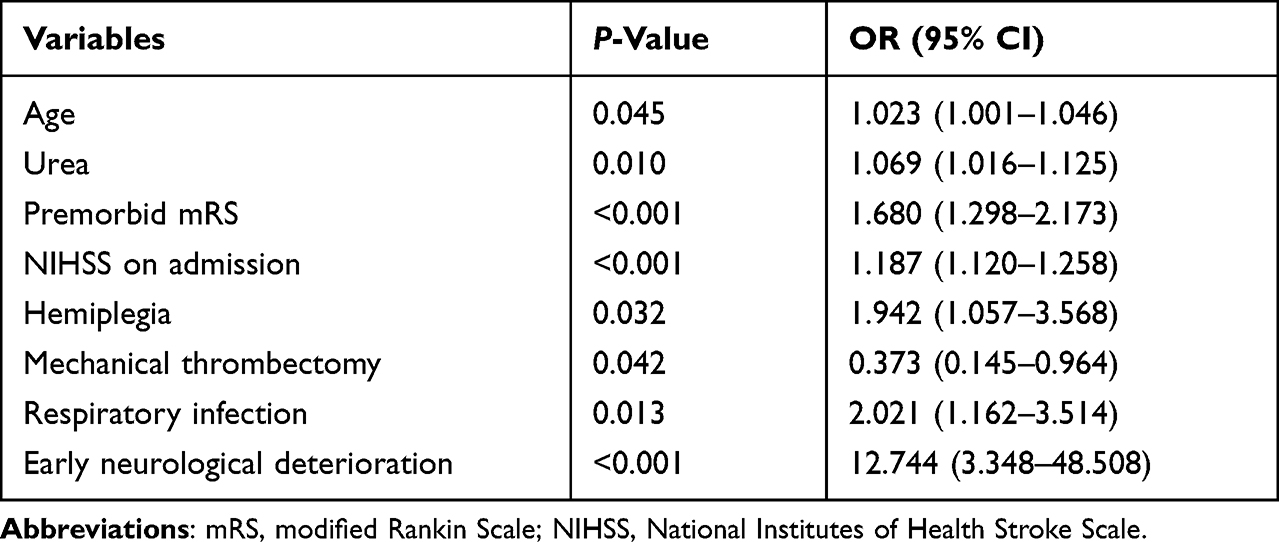 |
Table 3 Independent Risk Factors Related to 3-Month Poor Outcome by Multivariate Logistic Regression Analysis |
Construction of Traditional and Dynamic Nomograms
The traditional nomogram is shown in Figure 1. Calculation of the eventual probability of a 3-month poor outcome is divided into three steps. First, a vertical line is drawn from the axis of each predictor to the “Points” axis to obtain the point of each predictor. Second, the total point is summed by all points assigned to each of the predictors. Third, the same method used in step 1 from the “Total points” axis to the “Risk” axis is used to acquire the probability of 3-month poor outcome. For example, a patient was aged 75 years, with hemiplegia, premorbid mRS score 1, NIHSS score 15, urea 5%, MT, and respiratory infection, and without END. The points of each predictor were 15, 9, 7.5, 37.5, 5, 0, 10, and 0, respectively. Then, we could obtain the total points of 84, which corresponded to the probability of 80.0%. The predicted probability of 3-month poor outcome is approximately 80% for this patient. The dynamic nomogram is exhibited at https://zxhwyf.shinyapps.io/DynNomapp-CKD/. A nomogram page is shown in Figure 2. After entering the values of the eight variables in the example above, we obtained the patient’s precise probability of developing a poor outcome, 78.9%.
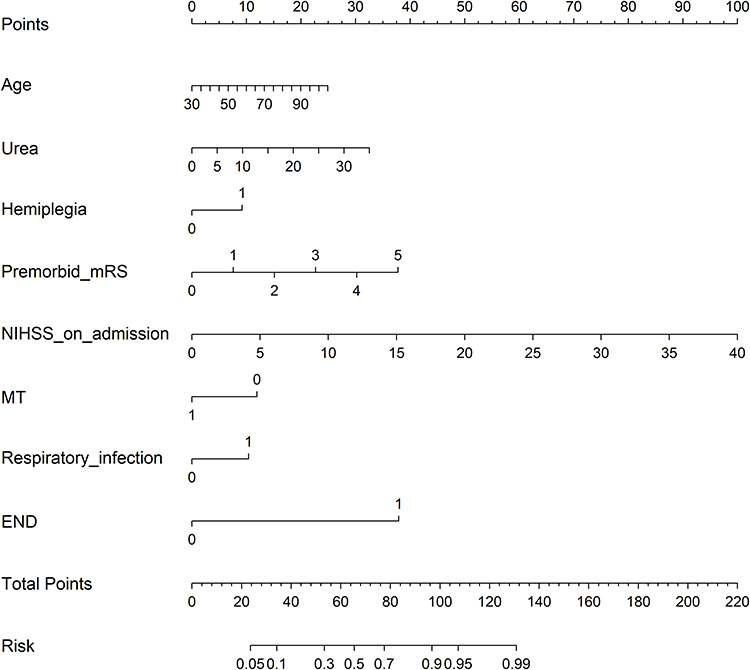 |
Figure 1 Traditional nomogram to predict 3-month poor outcome for CKD–stroke patients. |
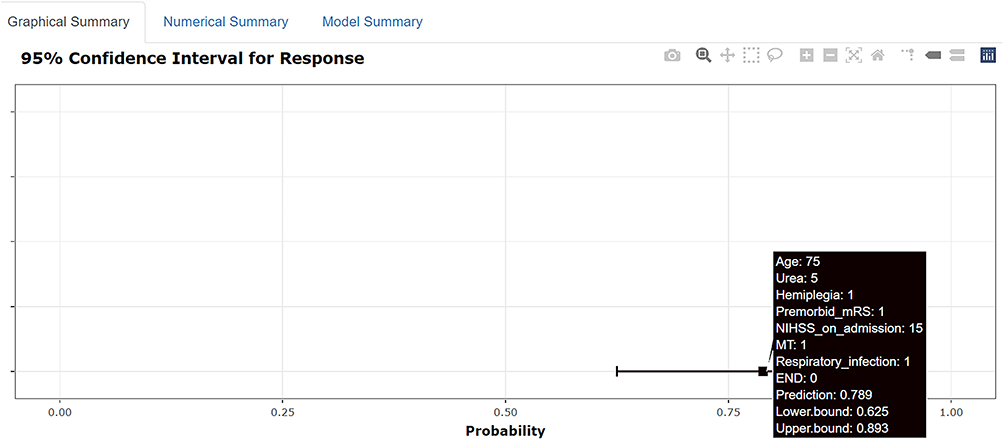 |
Figure 2 Dynamic nomogram to predict 3-month poor outcome for CKD–stroke patients. The procedure for using the dynamic nomogram is as follows. First, enter the value of each variable. Then, click on the “Predict” button and the result will be displayed on the right side of the page. After completing the prediction for the current patient, click the “Quit” button and repeat the above steps to start the prediction for the next patient. If the “Quit” button is not clicked, the website may not work when someone else logs in and uses it again. |
Performance of the Dynamic Nomogram
In the training set, the AUC of the nomogram was 0.873, indicating a good discrimination (Figure 3A), and the calibration curve suggested that the predicted probabilities were in good agreement with the actual probabilities (Figure 3B). In the external validation set, the AUC was 0.875 (Figure 3C) and the calibration curve also showed good agreement (Figure 3D). In subgroup validation, both the AUC value (0.813) (Figure S1) and the calibration curve (Figure S2) were suggested to be good. The comparison among the AUCs of the three cohorts is presented in Figure S3, revealing a slight difference. The results of DCA in the training set implied that using the nomogram to predict 3-month poor outcome would generate more net benefit than the “treat all” or “treat none” strategies when the threshold probabilities ranged from 10% to 99% (Figure 4A). In this example, if a 40% risk threshold was selected, this meant that patients would receive some therapeutic interventions if the probability of a 3-month poor outcome was >40%. The net benefit was about 0.42. The CIC in the training set visually showed the estimated number of high-risk patients predicted by the nomogram and actual numbers for each risk threshold (Figure 4B). For example, if a 40% risk threshold was used, 1000 patients would be screened, and then 610 patients would be predicted as being high risk, but about 450 patients were actually high risk.
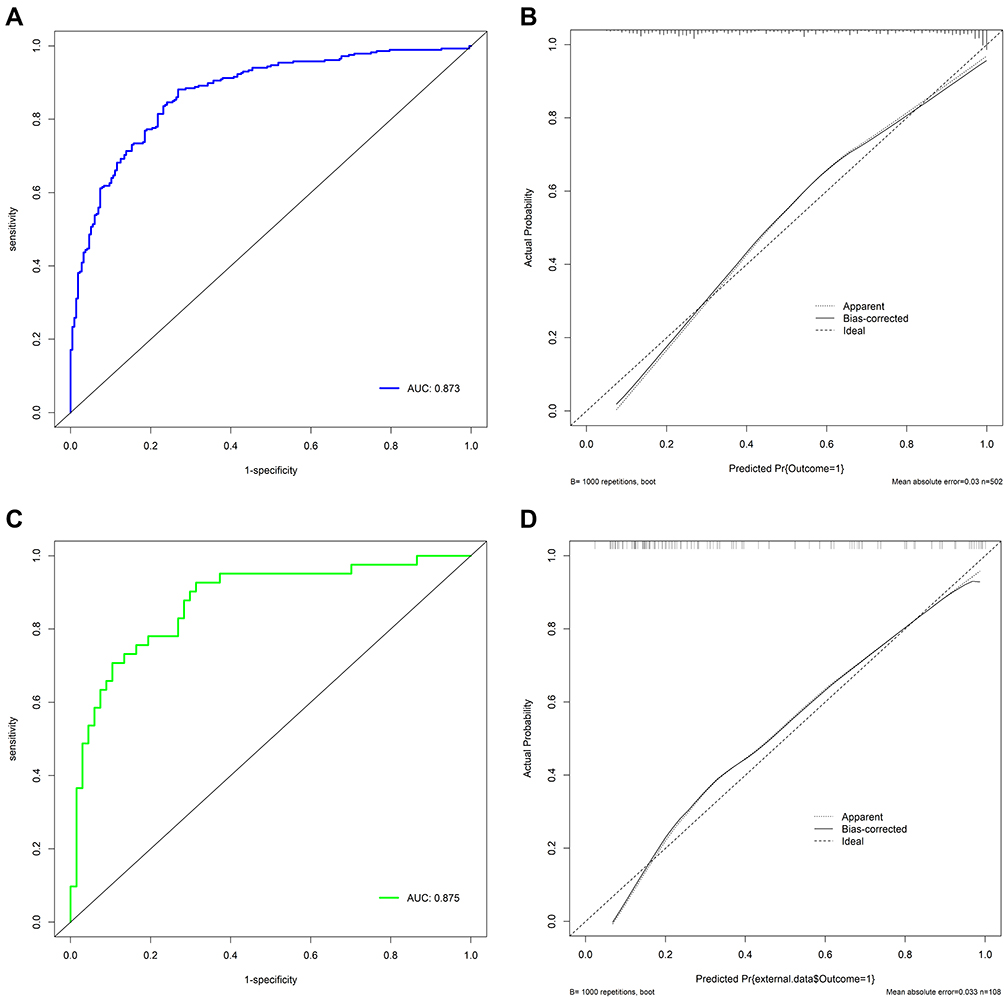 |
Figure 3 (A) Receiver operating characteristics (ROC) curves of the nomogram in the training set; (B) calibration curve of the nomogram in the training set; (C) ROC curves of the nomogram in the external validation set; (D) calibration curve of the nomogram in the external validation set. |
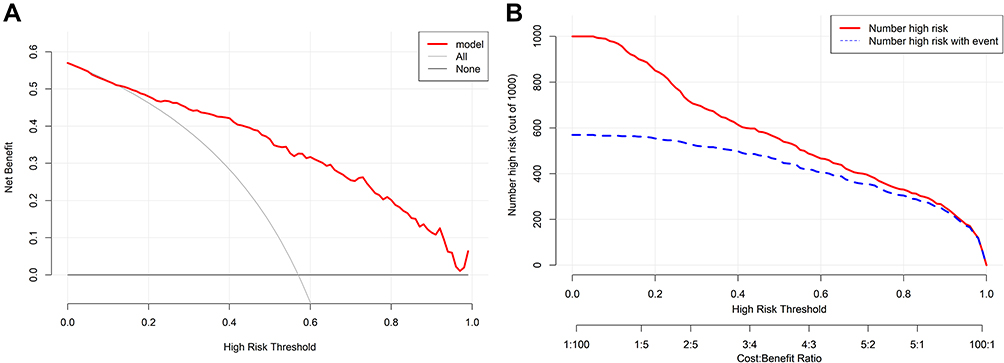 |
Figure 4 (A) Decision curve of the nomogram; (B) clinical impact curve of the nomogram. |
Discussion
The clinical management of CKD–stroke patients can be very challenging. In order to aid clinicians in their decision making, we utilized the advantages of a dynamic nomogram with clinical characteristics to establish an effective 3-month poor outcome prognostic model for CKD–stroke patients. We identified eight independent predictors, namely, age, premorbid mRS score, NIHSS score on admission, END, hemiplegia, SBP, urea, and MT. More importantly, the dynamic nomogram achieved excellent performance and good clinical application value.
This is the first predictive model for 3-month poor outcome in CKD–stroke patients. The eventual precise value of risk could be calculated directly and automatically based on the input value of each variable in the dynamic nomogram. This makes it easy to apply to assist in clinical decision making and it is a promising tool in clinical prediction. We used DCA and CIC to evaluate the clinical utility of the dynamic nomogram. These two metrics can help clinicians to set a risk threshold; that is, to determine who should receive some therapeutic intervention to avoid the occurrence of a 3-month poor outcome, which can maximize the reasonable distribution of medical resources in clinical practice. It is therefore an essential validation tool on top of measures such as discrimination and calibration. The results of DCA and CIC demonstrated that the nomogram developed in this research had good clinical practical value.
An important point that should be noted is that the median eGFR value of the whole cohort was 48.45 mL/min/1.73 m2, suggesting moderate CKD. However, since stroke patients are predominantly elderly and their renal function will decline physiologically, eGFR <45 mL/min/1.73 m2 in elderly patients is regarded as clinically significant. Hence, a further external validation in the subgroup of patients aged >65 with eGFR <45 mL/min/1.73 m2 was conducted in our study to validate the model performance in these patients. Our results confirmed the model’s excellent predictive ability in severe or advanced CKD and older patients.
Considering that several studies have demonstrated that dialysis would increase the mortality in stroke patients,18–20 we further investigated the association between dialysis dependence and mortality (mRS=6). Mortality in dialysis-dependent patients was 25%, and we did not find a relationship between dialysis dependence and mortality. There are three likely reasons for this. First, the general population constituted the non-dialysis-dependent group in these studies, while the CKD patients made up the non-dialysis-dependent group in our study. This means that the gap in renal function between the two groups in our study was smaller than in the previous studies, and therefore the difference in mortality was less pronounced in our study. Second, one study claimed that dialysis patients were less likely to be managed on an acute stroke unit after stroke onset during their admission, and admission to a stroke unit was associated with lower risk of death.18 This may explain the mortality in dialysis-dependent patients in our study being similar to that of other stroke patients. Third, there were only four patients in the dialysis-dependent group, which is likely to result in a coincidental outcome. In general, larger studies on CKD–stroke patients are needed to validate our results, by including more dialysis-dependent patients.
Eight predictors that may affect the risk of a 3-month poor outcome for CKD–stroke patients were found in our study. Age is a well-recognized risk factor in relation to 3-month poor outcome in stroke patients, and has been confirmed by previous studies.21,22 For CKD patients, advanced age also increased the risk of poor prognosis. END during hospitalization was also an independent risk factor for 3-month poor outcome in the cohort. A previous study determined that END was related to poor outcome in stroke patients.23 Kumai et al confirmed a higher risk of END occurring in stroke patients with CKD than in those without CKD.5 In-hospital respiratory infection increased the risk of poor outcome. Patients with stroke or CKD are at growing risk of developing infections because of their impaired immune systems.24,25 Stroke-associated pneumonia was a common complication after stroke and resulted in poor outcome,26 and the existence of CKD also increased the risk of lower respiratory infection.27 Hence, since the above factors can increase the risk of poor prognosis in patients with stroke or CKD, we consider it reasonable that they are also predictors of poor outcome in CKD–stroke patients.
Hemiplegia, higher NIHSS score on admission, and premorbid mRS score were associated with 3-month poor outcome in the CKD–stroke patients. Both NIHSS score and premorbid mRS score were shown to be risk factors of 3-month stroke poor outcome. Furthermore, these three variables were indicators of stroke severity. There is a robust two-way correlation between stroke and CKD,2 indicating that they will mutually promote each other’s disease progression, eventually resulting in a poorer clinical outcome.
Urea was identified as an indicator to predict poor outcome in CKD–stroke patients. For CKD patients, increasing urea concentration will result in molecular changes associated with insulin resistance, free radical production, apoptosis, and disruption of the protective intestinal barrier, which could lead to a poor prognosis in CKD.28 MT was negatively related with poor outcome in our study. Evidence has suggested that MT can significantly improve the functional outcome of stroke patients.29 Although contrast-induced nephropathy induced by computed tomography before MT remains a concern, a randomized controlled trial published in 2020 also demonstrated that contrast-induced nephropathy has a low rate of occurrence (1.2%) in clinical practice and did not mediate the correlation between pre-angiography eGFR and 3-month death,30 and computed tomography before MT did not worsen renal function.31 A previous study also verified that CKD was not related to 3-month poor outcome for patients treated with MT.32
The dynamic nomogram that we constructed has great clinical application value. A dynamic nomogram is more appropriate and convenient in clinical application than a traditional nomogram, and this is beneficial to the model’s validation and promotion in clinical practice. Our nomogram can identify patients at high risk of 3-month poor outcome, which has important clinical significance. The clinical application value lies in its usefulness for clinicians, who should make preventive interventions in time for these high-risk patients. The earlier high-risk patients are identified, the earlier treatment can be initiated, especially for stroke patients with moderate CKD. This will be helpful to greatly decrease the risk of disability or death for the patient, which will benefit patients, their family, and our society.
Two limitations in our study should be acknowledged. First, the database we used is from a single stroke center with a small sample size. Multicenter validation is also essential. In order to compensate for this, a dynamic nomogram was therefore developed, since it can be easily accessed for use. Researchers all over the world who are interested in our nomogram can use it for further validation. Second, despite the difference of 0.6 mmol/L between the good and poor outcome groups being statistically significant, it may be hardly clinically significant. Hence, although external validation in our study has demonstrated the efficacy of urea in the nomogram, studies with more cases and multicenter designs should be conducted to further examine the connection between urea and poor outcome for CKD–stroke patients. Third, the nomogram should be applied with caution to dialysis-dependent patients. Owing to the absence of dialysis-dependent patients in the validation cohort and the fact that model cannot be validated in data from the training set, we cannot additionally validate the model’s predictive ability for dialysis patients. Furthermore, the dialysis-dependent cohort was too small and not well represented in our study. Hence, we cannot guarantee the performance of the model when applied to such patients.
Conclusion
This is the first dynamic nomogram for identifying CKD–stroke patients who have a high risk of a 3-month poor outcome. The nomogram not only has good predictive accuracy and discriminative ability, but also has considerable clinical usefulness and applicability. Further external validation in other centers is needed to verify its practical clinical validity. We hope that our nomogram can assist in the decision-making process in clinical practice and provide good value for clinical application.
Ethics Approval and Informed Consent
This study followed approval by the ethics committee of Nanjing First Hospital (document number: ChiCTR-OCH-14004382) and complied with the Declaration of Helsinki. Informed consent was waived because of the anonymous data.
Acknowledgments
We thank all authors for their important contributions.
Author Contributions
All authors made a significant contribution to the work reported, whether that is in the conception, study design, execution, acquisition of data, analysis and interpretation, or in all these areas; took part in drafting, revising or critically reviewing the article; gave final approval of the version to be published; have agreed on the journal to which the article has been submitted; and agree to be accountable for all aspects of the work. Fusang Wang, Xiaohan Zheng, and Juan Zhang share first authorship.
Funding
This study was supported by the National Natural Science Foundation of China [grant 81673511], Jiangsu Key Research and Development Plan [grant BE2017613], and Jiangsu Six Talent Peaks Project [grant WSN-151].
Disclosure
The authors report no conflicts of interest in this work.
References
1. Zhou M, Wang H, Zeng X, et al. Mortality, morbidity, and risk factors in China and its provinces, 1990-2017: a systematic analysis for the global burden of disease study 2017. Lancet. 2019;394:1145–1158. doi:10.1016/S0140-6736(19)30427-1
2. Toyoda K, Ninomiya T. Stroke and cerebrovascular diseases in patients with chronic kidney disease. Lancet Neurol. 2014;13:823–833.
3. Yahalom G, Schwartz R, Schwammenthal Y, et al. Chronic kidney disease and clinical outcome in patients with acute stroke. Stroke. 2009;40:1296–1303. doi:10.1161/STROKEAHA.108.520882
4. Rowat A, Graham C, Dennis M. Renal dysfunction in stroke patients: a hospital-based cohort study and systematic review. Int J Stroke. 2014;9:633–639. doi:10.1111/ijs.12264
5. Kumai Y, Kamouchi M, Hata J, et al. Proteinuria and clinical outcomes after ischemic stroke. Neurology. 2012;78:1909–1915.
6. van der Velde M, Matsushita K, Coresh J, et al. Lower estimated glomerular filtration rate and higher albuminuria are associated with all-cause and cardiovascular mortality. A collaborative meta-analysis of high-risk population cohorts. Kidney Int. 2011;79:1341–1352. doi:10.1038/ki.2010.536
7. Cappellari M, Mangiafico S, Saia V, et al. IER-START nomogram for prediction of three-month unfavorable outcome after thrombectomy for stroke. Int J Stroke. 2020;15:412–420. doi:10.1177/1747493019837756
8. Cappellari M, Turcato G, Forlivesi S, et al. The START nomogram for individualized prediction of the probability of unfavorable outcome after intravenous thrombolysis for stroke. Int J Stroke. 2018;13:700–706. doi:10.1177/1747493018765490
9. Ghoshal S, Freedman BI. Mechanisms of stroke in patients with chronic kidney disease. Am J Nephrol. 2019;50:229–239. doi:10.1159/000502446
10. Chen S, Li X, Lv H, et al. Prognostic dynamic nomogram integrated with inflammation-based factors for non-small cell lung cancer patients with chronic hepatitis B viral infection. Int J Biol Sci. 2018;14:1813–1821. doi:10.7150/ijbs.27260
11. Wu Y, Han C, Wang Z, et al. An externally-validated dynamic nomogram based on clinicopathological characteristics for evaluating the risk of lymph node metastasis in small-size non-small cell lung cancer. Front Oncol. 2020;10:1322. doi:10.3389/fonc.2020.01322
12. Luo D, Li H, Yu H, et al. Predictive value of preoperative and postoperative peripheral lymphocyte difference in hepatitis B virus-related hepatocellular cancer patients: based on the analysis of dynamic nomogram. J Surg Oncol. 2020;122:1553–1568. doi:10.1002/jso.26195
13. Adams HP Jr, Bendixen BH, Kappelle LJ, et al. Classification of subtype of acute ischemic stroke. Definitions for use in a multicenter clinical trial. TOAST. Trial of Org 10172 in Acute Stroke Treatment. Stroke. 1993;24:35–41. doi:10.1161/01.STR.24.1.35
14. Vekic J, Zeljkovic A, Stefanovic A, Jelic-Ivanovic Z, Spasojevic-Kalimanovska V. Obesity and dyslipidemia. Metabolism. 2019;92:71–81. doi:10.1016/j.metabol.2018.11.005
15. Levey AS, Stevens LA, Schmid CH, et al. A new equation to estimate glomerular filtration rate. Ann Intern Med. 2009;150:604–612. doi:10.7326/0003-4819-150-9-200905050-00006
16. Vickers AJ, Elkin EB. Decision curve analysis: a novel method for evaluating prediction models. Med Decis Making. 2006;26:565–574. doi:10.1177/0272989X06295361
17. Kerr KF, Brown MD, Zhu K, Janes H. Assessing the clinical impact of risk prediction models with decision curves: guidance for correct interpretation and appropriate use. J Clin Oncol. 2016;34:2534–2540. doi:10.1200/JCO.2015.65.5654
18. Findla Y, Dawson J, MacIsaac R, et al. Inequality in care and differences in outcome following stroke in people with ESRD. Kidney Int Rep. 2018;3:1064–1076. doi:10.1016/j.ekir.2018.04.011
19. de Jager DJ, Grootendorst DC, Jager KJ, et al. Cardiovascular and noncardiovascular mortality among patients starting dialysis. JAMA. 2009;302:1782–1789. doi:10.1001/jama.2009.1488
20. Ocak G, Noordzij M, Rookmaaker MB, et al. Mortality due to bleeding, myocardial infarction and stroke in dialysis patients. J Thromb Haemost. 2018;16:1953–1963. doi:10.1111/jth.14254
21. Wang Z, Li B, Wang Y, et al. The association between serum adiponectin and 3-month outcome after ischemic stroke. Cardiovasc Diabetol. 2019;18:105. doi:10.1186/s12933-019-0908-z
22. Suda S, Aoki J, Shimoyama T, et al. Stroke-associated infection independently predicts 3-month poor functional outcome and mortality. J Neurol. 2018;265:370–375. doi:10.1007/s00415-017-8714-6
23. Seners P, Turc G, Oppenheim C, Baron JC. Incidence, causes and predictors of neurological deterioration occurring within 24 h following acute ischaemic stroke: a systematic review with pathophysiological implications. J Neurol Neurosurg Psychiatry. 2015;86:87–94. doi:10.1136/jnnp-2014-308327
24. Elkind MS, Boehme AK, Smith S, Meisel A, Buckwalter CJ. Infection as a stroke risk factor and determinant of outcome after stroke. Stroke. 2020;51:3156–3168. doi:10.1161/STROKEAHA.120.030429
25. Syed-Ahmed M, Narayanan M. Immune dysfunction and risk of infection in chronic kidney disease. Adv Chronic Kidney Dis. 2019;26:8–15. doi:10.1053/j.ackd.2019.01.004
26. Koennecke HC, Belz W, Berfelde D, et al. Factors influencing in-hospital mortality and morbidity in patients treated on a stroke unit. Neurology. 2011;77:965–972. doi:10.1212/WNL.0b013e31822dc795
27. Xu H, Gasparini A, Ishigami J, et al. eGFR and the risk of community-acquired infections. Clin J Am Soc Nephrol. 2017;12:1399–1408. doi:10.2215/CJN.00250117
28. Vanholder R, Gryp T, Glorieux G. Urea and chronic kidney disease: the comeback of the century? (in uraemia research). Nephrol Dial Transplant. 2018;33:4–12. doi:10.1093/ndt/gfx039
29. Martins SO, Mont’Alverne F, Rebello LC, et al. Thrombectomy for stroke in the public health care system of Brazil. N Engl J Med. 2020;382:2316–2326. doi:10.1056/NEJMoa2000120
30. Weisbord SD, Palevsky PM, Kaufman JS, et al. Contrast-associated acute kidney injury and serious adverse outcomes following angiography. J Am Coll Cardiol. 2020;75:1311–1320. doi:10.1016/j.jacc.2020.01.023
31. Cereda CW, Mlynash M, Cippà PE, et al. Renal safety of multimodal brain imaging followed by endovascular therapy. Stroke. 2021;52:313–316. doi:10.1161/STROKEAHA.120.030816
32. Fandler-Höfler S, Odler B, Kneihsl M, et al. Acute and chronic kidney dysfunction and outcome after stroke thrombectomy. Transl Stroke Res. 2021;12:791–798. doi:10.1007/s12975-020-00881-2
 © 2022 The Author(s). This work is published and licensed by Dove Medical Press Limited. The
full terms of this license are available at https://www.dovepress.com/terms
and incorporate the Creative Commons Attribution
- Non Commercial (unported, 3.0) License.
By accessing the work you hereby accept the Terms. Non-commercial uses of the work are permitted
without any further permission from Dove Medical Press Limited, provided the work is properly
attributed. For permission for commercial use of this work, please see paragraphs 4.2 and 5 of our Terms.
© 2022 The Author(s). This work is published and licensed by Dove Medical Press Limited. The
full terms of this license are available at https://www.dovepress.com/terms
and incorporate the Creative Commons Attribution
- Non Commercial (unported, 3.0) License.
By accessing the work you hereby accept the Terms. Non-commercial uses of the work are permitted
without any further permission from Dove Medical Press Limited, provided the work is properly
attributed. For permission for commercial use of this work, please see paragraphs 4.2 and 5 of our Terms.