")
Back to Journals » Drug Design, Development and Therapy » Volume 17
A Drug–Drug Interaction Study to Evaluate the Impact of Simvastatin and Itraconazole on Erlotinib Pharmacokinetics in Rats by UPLC-MS/MS
Authors Fan Z , Gao X , Wang M, Tian Z
Received 16 August 2023
Accepted for publication 9 October 2023
Published 18 October 2023 Volume 2023:17 Pages 3129—3138
DOI https://doi.org/10.2147/DDDT.S427213
Checked for plagiarism Yes
Review by Single anonymous peer review
Peer reviewer comments 3
Editor who approved publication: Dr Qiongyu Guo
Zaiwen Fan,1 Xiaonan Gao,2 Mingxia Wang,2 Ziqiang Tian1
1Department of Thoracic Surgery, The Fourth Hospital of Hebei Medical University, Shijiazhuang, People’s Republic of China; 2Department of Clinical Pharmacology, The Fourth Hospital of Hebei Medical University, Shijiazhuang, People’s Republic of China
Correspondence: Ziqiang Tian, Department of Thoracic Surgery, The Fourth Hospital of Hebei Medical University, 12 Jiankang Road, Shijiazhuang, Hebei, 050011, People’s Republic of China, Email [email protected] Mingxia Wang, Department of Clinical Pharmacology, The Fourth Hospital of Hebei Medical University, 12 Jiankang Road, Shijiazhuang, 050011, People’s Republic of China, Email [email protected]
Aim: The goal of our study was to investigate the effects of single-dose simvastatin and itraconazole application on the pharmacokinetics of erlotinib in rats.
Methods: Twenty-one male Sprague-Dawley rats were randomly divided into 3 groups, including erlotinib combined with simvastatin, erlotinib combined with itraconazole and erlotinib alone groups. The rats were given a single dose of 2 mg/kg simvastatin, 15 mg/kg itraconazole or 0.5% sodium carboxymethyl cellulose followed by 12 mg/kg erlotinib. The concentration of erlotinib in rat plasma was determined by UPLC-MS/MS. As internal standard, tinidazole was used for chromatographic analysis on the Kinetex C18 column (100× 2.1 mm, 2.6 μm).
Results: Erlotinib was validated in the calibration range of 5– 1000 ng/mL. The lower limit of quantification (LLOQ) was 5 ng/mL. The inter- and intra-day precisions for erlotinib were less than 10.56%, and the accuracies were in the range of 98.61– 104.99%. The validated UPLC-MS/MS method was successfully applied to this study. Compared with the erlotinib alone group, the values of AUC0-t, AUC0-∞, Cmax, Vz/F and t1/2 in the simvastatin group showed no statistical differences among pharmacokinetic parameters (P> 0.05). However, the values of AUC0-t, AUC0-∞ and Cmax, in the itraconazole group were approximately 1.32-fold, 1.32-fold and 1.34-fold higher, and the CL/F was lower than those in the erlotinib alone group; the difference was statistically significant (P< 0.05).
Conclusion: Simvastatin had no significant effect on the pharmacokinetics of erlotinib, whereas co-administration of itraconazole considerably increased the exposure of erlotinib. Therefore, we should pay more attention to the potential drug-drug interaction to ensure safety in cancer patient treatment.
Keywords: erlotinib, simvastatin, itraconazole, drug–drug interaction, UPLC-MS/MS, pharmacokinetic
Introduction
Erlotinib is an orally active, potent, selective human epidermal growth factor receptor tyrosine-kinase inhibitor (EGFR-TKI) with demonstrated antitumor activity in preclinical and clinical studies,1,2 which not only inhibits angiogenesis but also the expansion of tumor cells verified both in vivo and in vitro.3,4 Completed Phase III clinical trial in patients with advanced refractory solid cancer have proved that erlotinib is well tolerated and broadly used in a variety of tumors.5–8 Metabolism and excretion of erlotinib studied by Jie Ling et al9 has indicated the absorption of erlotinib was rapid after oral administration, extensively metabolized in the liver and eliminated mainly via urine and feces route (91%). Unchanged erlotinib represented the major circulating component. The metabolism of erlotinib is mediated predominantly by cytochrome P450 (CYP) enzyme 3A4/3A5, to a lesser extent by CYP1A1/1A2 isoenzymes, to the active metabolite desmethyl erlotinib (OSI-420), which subsequently undergoes oxidation and glucuronidation.
Cancer patients often have accompanying diseases in addition to cancer-related symptoms and suffer from adverse effects induced by anticancer drugs. Thus, their treatments are frequently influenced by drugs against common diseases, for instance, drugs against infection, cardiovascular disease, respiratory system disease, and nausea.10,11 CYP-based drug-drug interaction (DDI) is common in clinical practice. Therefore, evaluating pharmacokinetic DDI, especially CYP3A4 involved metabolic interaction is essential to ensure safety in cancer patients.12
Primary hyperlipidemia can contribute to atherosclerosis and its progressive development in patients which is an important factor contributing to cardiovascular and cerebrovascular diseases, as well as being a high-risk factor for the development of hypertension and diabetes.13 Simvastatin is an inhibitor of HMG-CoA reductase, which can inhibit the synthesis of cholesterol and achieve the effect of lowering blood lipids and is important in the treatment of cardiovascular and cerebrovascular diseases. It has been shown that simvastatin is mainly metabolized by the CYP3A4 in vivo.14
Fungal infections are common infectious diseases, especially in patients with cancer, organ transplants, and hematological diseases, and can seriously damage the health of patients.15 Itraconazole is an anti-fungal drug of the triazole class and has been used clinically for more than 30 years. However, itraconazole has a strong inhibitory effect on CYP3A4 and is recommended by the FDA16 and European Medicines Agency’s guidelines17 for clinical DDI study. It can interact with a variety of drugs, which require caution when they are combined.18
Erlotinib efficacy has been related to CYP1A2 and CYP3A4 metabolism and could be affected by drugs that inhibit these cytochromes, leading to pharmacokinetic alterations. As far as we know, DDI between simvastatin or itraconazole and erlotinib has never been reported. In our study, a rapid, sensitive and economical UPLC-MS/MS method was developed and validated for erlotinib analysis, in order to determine plasma concentrations and evaluate the pharmacokinetic profile of erlotinib. The ultimate goal was to propose recommendations for the therapeutic management of cancer patients taking erlotinib.
Materials and Methods
Chemicals and Reagents
Reference standard of erlotinib (Lot No. 183319–69-9, Shanghai yuanye Bio-Technology Company. Ltd); tinidazole (internal standard, IS, Lot No.100336–200703, National Institutes for Food and Drug Control); acetonitrile and methanol (HPLC grade, Fisher Scientific); Ultrapure water (A.S. Watson & Company); formic acid (FA) and ammonium acetate (HPLC grade, Mreda Technology Inc).
Animals
Total of 21 male Sprague-Dawley (SD) rats (220–260g) were procured from the Experimental Animal Center of Hebei Medical University (Laboratory animal license number: SCXK 2013-1-003). All animal-related experimental procedures complied with the Guide for Care and Use of Laboratory Animals and were approved by the Animal Research Ethics Committee of the Fourth Hospital of Hebei Medical University (No. 2019031). All rats were kept for a week before experiment to acclimatize to the well-ventilated conditions with 22°C±1°C of room temperature; 55%±10% of relative humidity; 12/12-h light/dark cycle. The rats could access the water freely while diet was prohibited for 12 h before drug.
Pharmacokinetic Experiment
All rats were randomized into 3 groups (n = 7) as follows: Group A, control group with erlotinib alone; Group B, erlotinib combined with simvastatin; Group C, erlotinib combined with itraconazole.
Rats of all groups (A, B, C) received a single dose of 0.5% sodium carboxymethyl cellulose (CMC-Na), simvastatin (2 mg/kg in 0.5% CMC-Na), and itraconazole (15 mg/kg in 0.5% CMC-Na), respectively. Then they were treated with erlotinib (12 mg/kg in 0.5% CMC-Na) through oral gavage after 30 min. Subsequently, approximately 0.3 mL of whole blood were collected from tail vein into 1.5 mL heparinized centrifuge tubes before (0 h) and post dosing at 0.25, 0.5, 1, 1.5, 2, 3, 4, 6, 8, 10, 24 h. These were centrifuged at 3000 rpm for 10 min, and the samples were then stored at −80°C until analysis.
Instrumentation and UPLC-MS/MS Conditions
The UPLC was performed using an ExionLC™ analytical system (AB Sciex, USA), including a binary pump, a AD controller, and a degasser.
UPLC analysis was performed on a Kinetex C18 column (100×2.1 mm, 2.6 μm; Phenomenex, USA), and the temperature was set at 50°C. Isocratic elution was performed with a mobile phase consisting of two solvents: solvent A (acetonitrile) and solvent B (water containing 0.1% FA with 10 mM ammonium acetate) in the ratio of 70: 30, v/v, respectively. The elution flow rate was as follows: 0.01–0.50 min, 0.2 mL/min; 0.50–1.50 min, 0.4 mL/min; 1.50–2.50 min, 0.4 mL/min; 2.50–2.60 min, 0.2 mL/min; 3.50 min, stop.
Mass spectrometric analysis was performed on AB Sciex Triple Quad™ 4500 mass spectrometer equipped with an ESI source in a positive ion mode. Multiple reaction monitoring (MRM) was selected in quantification of erlotinib and IS with the ion transitions monitored m/z 394.2→336.0 for erlotinib and m/z 248.1→121.0 for IS. The collision energy and declustering potential values were 38 V and 120 V for erlotinib and 22 V and 90 V for IS, respectively. The secondary mass spectrograms of erlotinib and IS are shown in Figure 1.
 |
Figure 1 Product ion spectrum of erlotinib (A) and IS tinidazole (B). |
Stock and Standard Solutions
1 mg of erlotinib or tinidazole (IS) was dissolved in 50% methanol (methanol: H2O=1:1) to achieve the concentration of 1 mg/mL. Calibration curves and quality control (QC) samples were prepared separately, then stored at −80°C. The working solution of erlotinib was diluted with 50% methanol to 10 μg/mL. For IS, a standard solution was diluted to 30 ng/mL with acetonitrile.
Calibration Standards and QC Samples
50 μL of blank plasma and 50 μL of the corresponding erlotinib standard solution were combined to yield eight concentrations of 5, 10, 20, 50, 100, 200, 500, and 1000 ng/mL as calibration standards. Similarly, QC samples were prepared to give final erlotinib concentrations of high quality control (HQC; 800 ng/mL), medium (MQC; 80 ng/mL), lower (LQC; 8 ng/mL), and lower limit of quantitation (LLOQ; 5 ng/mL).
Sample Preparation
50 μL of blank plasma samples and 50 μL of working solution or QC solutions at different concentrations were spiked to a 1.5 mL centrifuge tube, vortex for 30 s. Then, 400 μL IS solution were added to precipitate plasma proteins, vortex-mixed for 3 min, and centrifuged for 10 min at 15,000×g. 50 μL of the supernatant and 200 μL of water were vortex-mixed for 1 min. Subsequently, the mixture was centrifuged for 3 min at 15,000×g and 3 μL supernatant were prepared for analysis.
Method Validation
The method validation was carried out for specificity, accuracy, precision, linearity, recovery, carryover, matrix effect and stability according to the rules of Bioanalytical Method Validation by the Chinese Pharmacopoeia and FDA guidelines.19
Specificity and Selectivity
Method specificity was assessed by comparing the chromatograms of blank plasma samples from six different batches. The IS (tinidazole) was added to all samples. These samples were free of interference of the analyte (a response lower than 20% of LLOQ for erlotinib and lower than 5% for the IS) at the retention time.
Carryover
Carryover was evaluated by spiking a blank plasma sample after 1000 ng/mL in three independent runs. The response should not be >20% of the LLOQ and >5% of IS.
Lower Limit of Quantification and Linearity
The calibration curve ranged from concentrations of 5 ng/mL to 1000 ng/mL for erlotinib, and the regression equation was calculated with the peak area ratio of erlotinib to IS as dependent variable (y), the concentration of erlotinib as the independent variable (x), and 1/x2 as weight factor. The regression coefficient (r2) should be greater than 0.99 to ensure linearity. LLOQ was defined as S/N≥10. The accuracy was within ±15% and ±20% for LLOQ.
Precision and Accuracy
Inter-day and intra-day precision and accuracy were evaluated by the QC samples of erlotinib at 5, 8, 80 and 800 ng/mL with five replicates on the same day and more than two days, respectively. Accuracy was defined as the percentage of measured concentration/theoretical concentration. The precision was expressed as RSD (%), RSD = (standard deviation of the mean/mean)×100%. Inter-day and intra-day variations of the QC samples in the developed method were less than ±15% (±20% at LLOQ) for all analytes.
Matrix Effect and Recovery
Matrix effect (ME) and extraction recovery of erlotinib were estimated by analyzing five replicates at four QC concentration levels. ME was determined by comparing the peak area ratio of erlotinib/IS in post-extraction spiked samples (A) against the neat samples at the corresponding concentration (B), which was calculated by the following equation: ME = A/B×100%. The recovery was calculated by the ratio of the peak area extracted with the matrix (blank matrix spiked before extraction) to the peak area in the presence of matrix (blank matrix spiked after extraction).
Stability
QC samples with 8 and 800 ng/mL erlotinib, and five samples were measured in parallel for each concentration. The stability was assessed while plasma samples were stored at room temperature for 4 h and −80°C for 60 days, freeze-thaw for 3 cycles, treated plasma samples at 4°C for 24 h.
Dilution Study
Erlotinib standard solution (>1000 ng/mL) was spiked to blank plasma. Then five replicates of the QC sample were analyzed after being diluted by 10-fold and 20-fold with blank plasma to assess dilution stability.
PK Calculations and Statistical Analysis
GraphPad Prism 8.0.1 was used for drawing a concentration time curve. The corresponding pharmacokinetic parameters were calculated by the WinNonlin® software (version 8.3.1, Pharsight, USA). SPSS 25.0 was applied to statistical analysis. All data were represented as mean ± standard deviation (SD). The difference between groups was evaluated using one-way ANOVA analysis of variance followed by Dunnett t-test. Tmax data for the groups were compared using the Wilcoxon signed-rank test.
Results
UPLC-MS/MS Method Validation
Selectivity and Specificity
No interfering peaks were recorded at the retention time of either erlotinib or tinidazole (IS). Figure 1 showed the MRM chromatograms of blank plasma, plasma spiked with erlotinib at LLOQ level and IS at 30 ng/mL and plasma sample at 0.25 h after administration. The retention times of erlotinib and tinidazole (IS) were 1.30 min and 1.11 min, respectively (Figure 2).
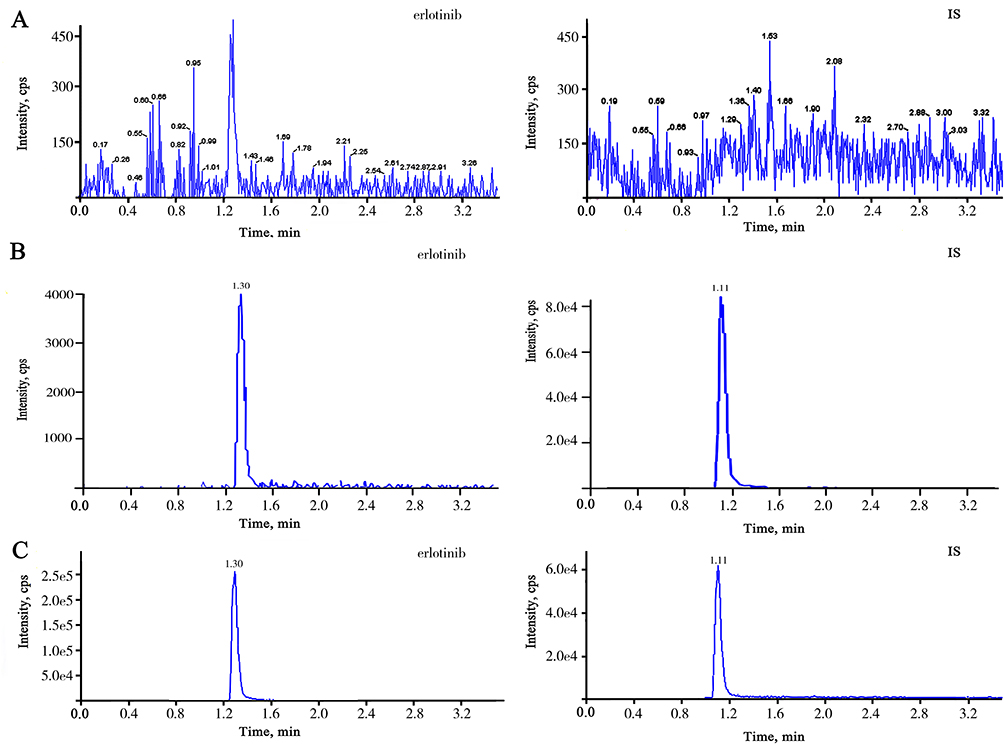 |
Figure 2 Typical MRM chromatograms of erlotinib (left panels) and IS (right panels). (A) blank plasma sample; (B) blank plasma sample spiked with erlotinib at 5 ng/mL and IS at 30 ng/mL; (C) plasma sample from a patient after erlotinib (12 mg/kg) administration at 0.25h. |
Carryover
The analytes showed no significant peak (≤20% of the LLOQ and 5% of the IS) in blank samples injected after the highly concentrated plasma samples.
Lower Limit of Quantification, Calibration Curve, and Linearity
The obtained erlotinib LLOQ (5 ng/mL) is shown in Figure 2. The regression equation of calibration curve was y = 0.00553x +0.0273 (r2=0.9973). For erlotinib, linearity was good at the range of 5–1000 ng/mL.
Precision and Accuracy
Precision and accuracy are shown in Table 1, and the permitted limits were within 10.56% for LLOQ and 3.01% for higher concentrations. Thus, the method was considered precise and accurate at intra-day and inter-day levels, which complied with Chinese Pharmacopoeia and FDA requirements.
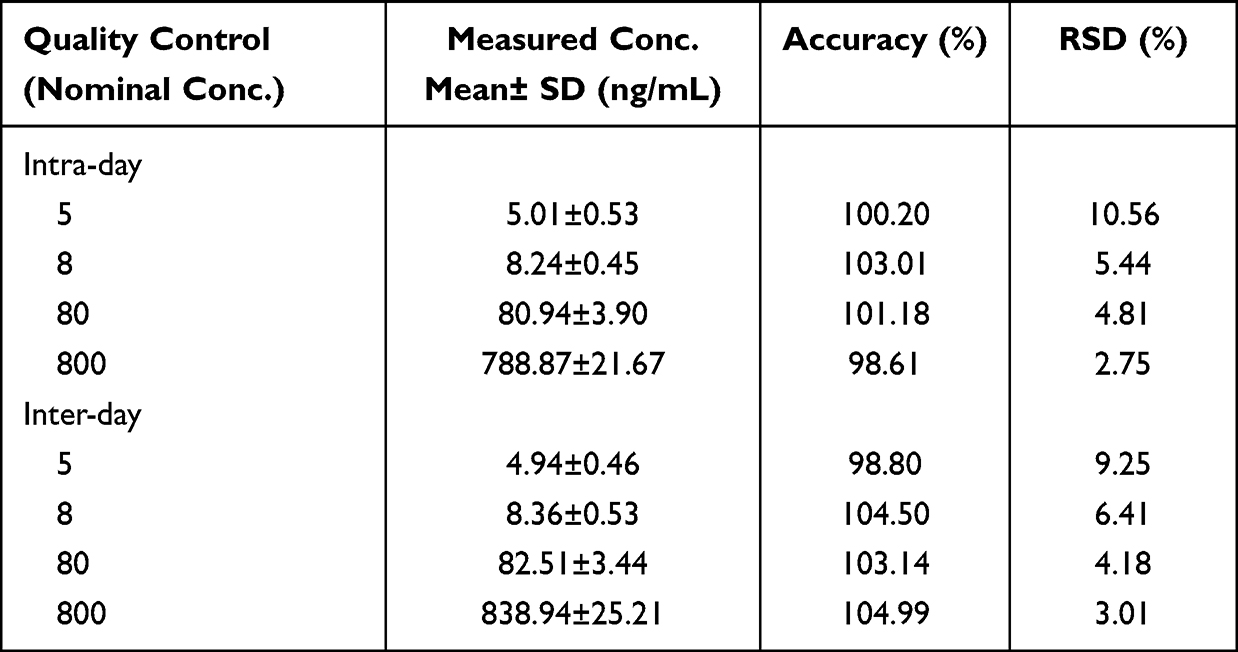 |
Table 1 Intra-Day and Inter-Day Precision and Accuracy for Erlotinib of Quality Control Samples (n=5) |
Matrix Effect and Recovery
Our results showed that the matrix effect (RSD%) at erlotinib concentration of LQC, MQC and HQC was 103.92% (8.40%), 99.26% (6.70%) and 103.15% (3.61%), respectively. Recovery for erlotinib was observed as 95.97%, 97.05% and 111.85%, respectively, at LQC, MQC and HQC levels.
Stability
The stability of erlotinib at various conditions were acceptable, and the RSD< 7.72%. The accuracy ranged from 87.56–112.17% (Table 2).
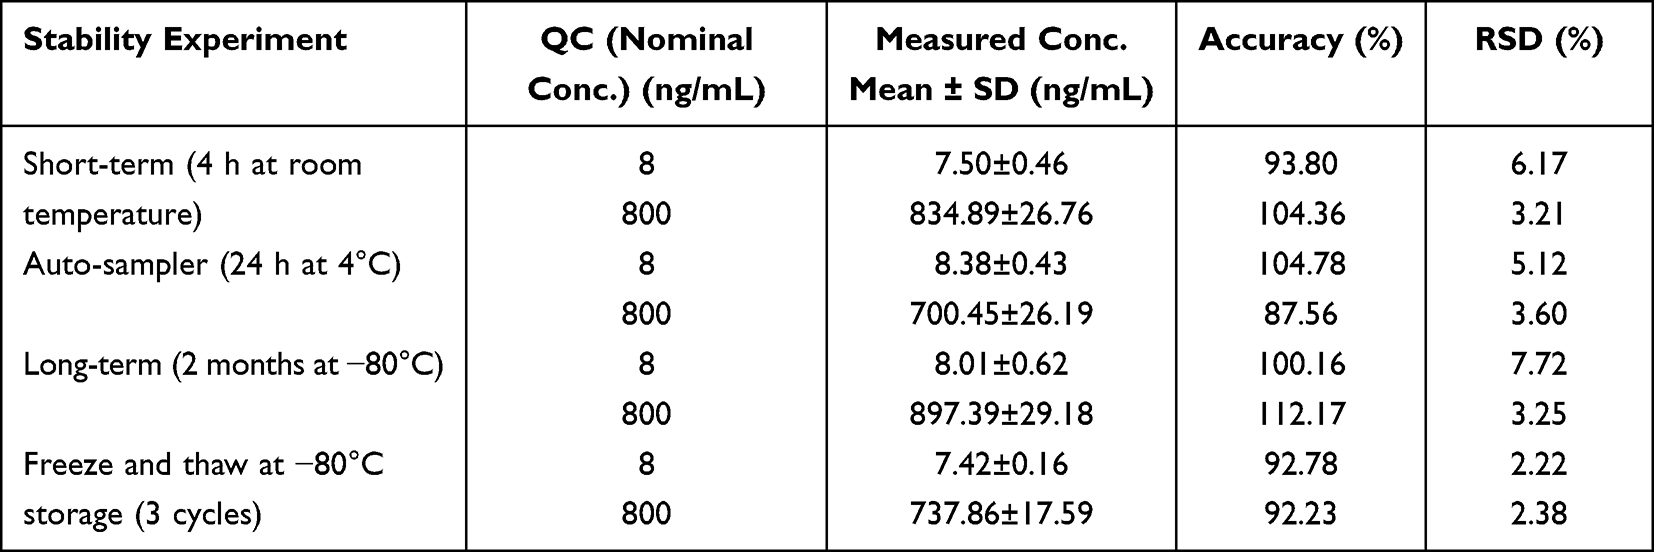 |
Table 2 Summary of Stability of Erlotinib in Rat Plasma (n=5) |
Dilution Study
The accuracy was 103.41% and 93.59% for 10-fold and 20-fold dilutions, respectively. And the RSD for precision were less than 6.19%.
Pharmacokinetics of Erlotinib When Co-Administrated with Single Dose Simvastatin or Itraconazole
The average plasma concentration of erlotinib after a single dose of simvastatin or itraconazole in the rats is shown in Figure 3. Table 3 summarizes the pharmacokinetic parameters of erlotinib for different groups (A-C).
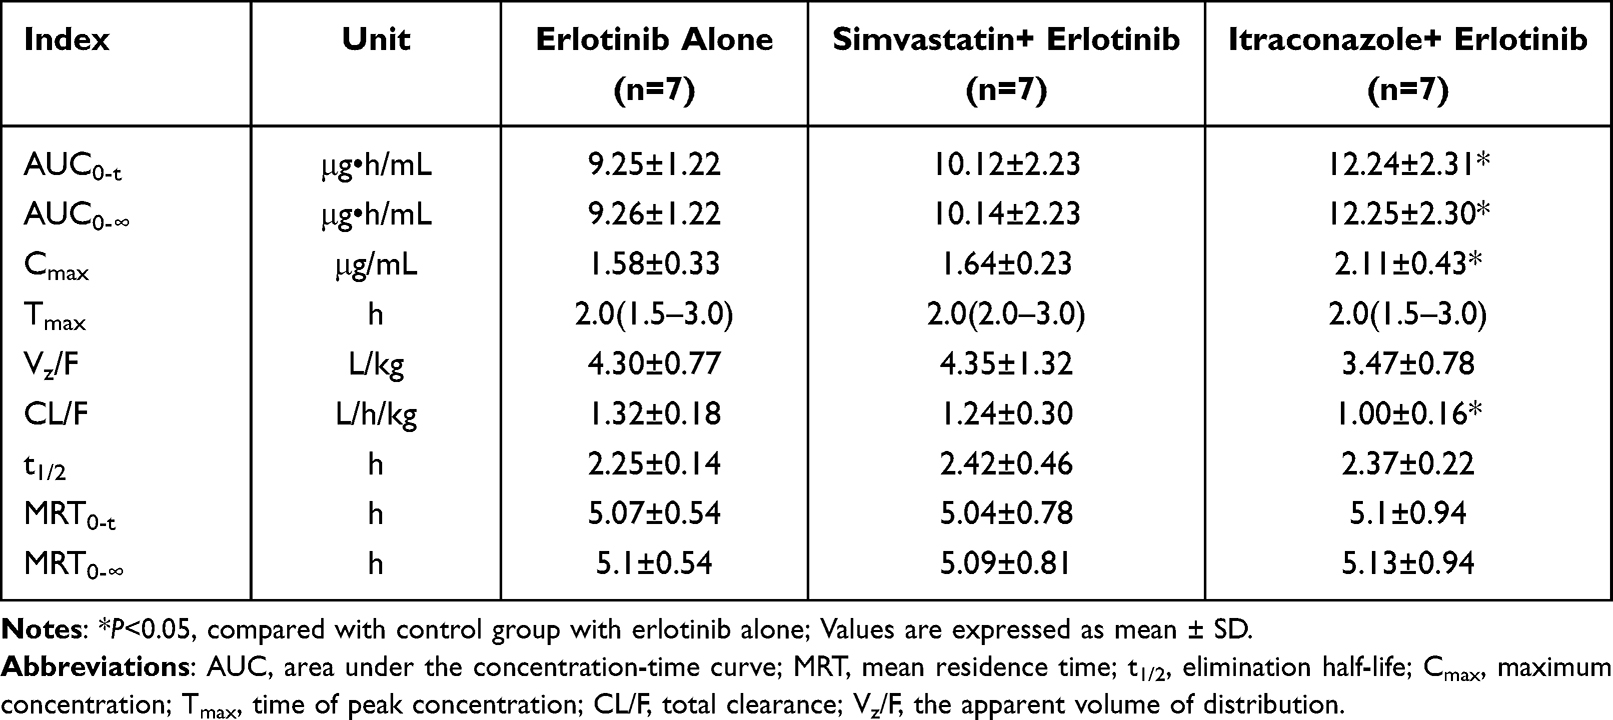 |
Table 3 Pharmacokinetic Parameters of Different Groups |
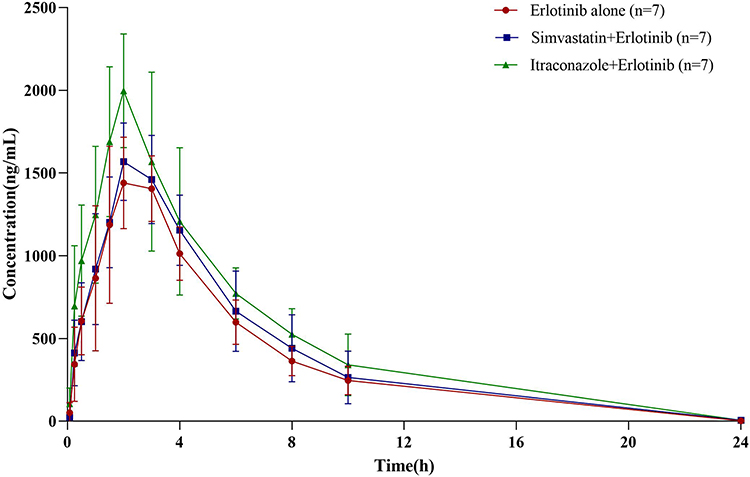 |
Figure 3 Plasma concentration-time profile of erlotinib in three groups (n=7), administration with erlotinibalone (circle), co-administration of erlotinib with simvastatin (square), and co-administration of erlotinib with itraconazole (triangle). |
Compared with the erlotinib alone group, the value of AUC0-t, AUC0-∞, Cmax, Vz/F and t1/2 in the simvastatin group were increased by approximately 9.41%, 9.50%, 3.80%, 1.16%, and 7.56%; CL/F was decreased by approximately 6.06%. There were no statistical differences among all pharmacokinetic parameters (P>0.05).
Compared with the erlotinib alone group, the values of AUC0-t, AUC0-∞, Cmax and t1/2 in the itraconazole group were increased by approximately 32.32%, 32.29%, 33.54% and 5.33%; Vz/F and CL/F were decreased by approximately 19.30% and 24.24%. AUC0-t, AUC0-∞, Cmax and CL/F were significantly higher or lower than in the erlotinib alone group (P<0.05), while there were no statistical differences among other pharmacokinetic parameters.
Discussion
In our study, based on a large number of plasma samples in drug–drug interaction or pharmacokinetic study, a quick and simple method for sample preparation was preferable. Although plasma protein precipitation may cause matrix effects during UPLC-MS/MS analysis, an appropriate gradient flow rate and retention time could overcome matrix effects. Meanwhile, methanol or methanol/aqueous solution showed a small amount of carryover, while pure acetonitrile solution depleted it. Thus, we chose acetonitrile as the sample solvent in this study. Finally, the method was validated for determining the plasma concentration of erlotinib in the rat.
Erlotinib is an EGFR-TKI which is approved as the first-line treatment of locally advanced or metastatic non-small-cell lung cancer.1 It is highly possible to be co-administered with other drugs in patients with advanced cancer requiring treatment for comorbidities. Adverse interactions between co-administration are one of the major causes of therapy failure and even drug toxicity. Therefore, it is significant to explore the potential DDI of erlotinib.
CYP450s have been considered as one of the major mechanisms affecting drug-drug interaction. In vitro studies with human microsomes and cDNA expressed human CYP enzymes have shown that erlotinib is metabolized primarily by CYP3A4 (70%), with a secondary contribution from CYP1A2.20 Calvert et al21 utilized midazolam as a CYP3A probe indicating that erlotinib does not significantly inhibit CYP3A-mediated metabolism in cancer patients, which is just a CYP3A4 substrate. Besides, Maher et al22 showed when tamoxifen (CYP3A inducer) and erlotinib were combined, the AUC of erlotinib was significantly reduced by 54% and the Cmax of tamoxifen was significantly increased by 46%, compared with its single administration. It suggests that erlotinib may be not only a substrate of CYP3A4 enzyme but also a moderate CYP inhibitor.
In previous studies, the impact of CYP3A4 inhibitors, inducers and known substrates on erlotinib exposure have been reported. Ketoconazole is a specific inhibitor of CYP3A4, and this inhibitory effect increased the AUC and Cmax of erlotinib with 86% and 102%, respectively.18 Co-administration of erlotinib with rifampicin (a prototypical inducer of CYP3A4) significantly reduced erlotinib AUC and Cmax.23 Furthermore, Maher et al24 suggested that green tea extract could result in a significant decrease in the bioavailability of erlotinib and Almomen et al25 found flavoured water significantly increased the AUC (200%) and Cmax (95%) of erlotinib. Clinical case reports suggested that risk factors related to erlotinib-induced gastrointestinal perforation were concomitant ciprofloxacin (a moderate CYP1A2 and CYP3A4 inhibitor) administration, which may result in erlotinib over-exposure.26 Therefore, study on the interaction between drugs co-administrated is necessary to avoid toxicity or treatment failure.
Simvastatin is an HMG-CoA reductase inhibitor that lowers low-intensity lipoprotein synthesis and is widely used in clinics. It is extensively metabolized by CYP3A4 in liver and also has an inhibitory effect on CYP3A4 enzymes. Simvastatin has been shown to significantly increase the exposure of apatinib in rats.27 Clinical cases have also been reported from the interaction between erlotinib and simvastatin leading to rhabdomyolysis; it is speculated that the main reason is both substrates of CYP3A4 and competitive inhibition leads to serious adverse events.28 This study investigated the effect of simvastatin on erlotinib exposure in rats. The results showed that compared with the erlotinib alone group, AUC0-t and AUC0-∞ of the erlotinib and simvastatin group increased by 9.41% and 9.50%, while no statistically significant difference was observed. The results suggest that there may be a lesser degree of competitive inhibition of erlotinib metabolism with simvastatin.
The antifungal agent itraconazole is primarily metabolized by the hepatic enzyme CYP3A4, which is both a potent inhibitor and a substrate of CYP3A4. The combination with erlotinib may cause the latter to accelerate metabolism, increase blood concentrations and the risk of drug toxicity. Studies showed that itraconazole could increase the exposure of gilteritinib by 2.2-fold in humans29 and 1.4-fold in rats.30 In addition, co-administration with itraconazole reduced the CL/F of apatinib by 40% and increased the AUC0-t by 75%.31 However, whether itraconazole would affect the exposure of erlotinib is unclear.
This study evaluated the effects of a CYP3A4 inhibitor, single dose itraconazole, on the pharmacokinetics of erlotinib. The results indicated a significant DDI between itraconazole and erlotinib. Co-administration of 15 mg/kg itraconazole with 12 mg/kg erlotinib significantly increased erlotinib Cmax by 33.5%, AUC by 32.3%, and decreased CL/F by 24.2% compared with erlotinib alone (P<0.05). Co-administration of itraconazole could affect the pharmacokinetics of erlotinib by improving the bioavailability, significantly increasing the plasma concentration and reducing the clearance of erlotinib. These results were generally consistent with the published literature,30–32 which indicated there were no meaningful pharmacokinetic DDIs between gilteritinib and itraconazole once daily for seven days. However, a single dose of itraconazole increased the gilteritinib systemic exposure in rats.30 In summary, this study suggests that itraconazole had a potential effect on the pharmacokinetics of erlotinib by inhibiting CYP3A4, which caused a significant increase of the AUC and Cmax of erlotinib in rats. This finding indicates that itraconazole dosing should be considered while combined with erlotinib for cancer patients.
Conclusion
A simple and reliable UPLC-MS/MS method was established to analyze the concentration of erlotinib in rat plasma. This study showed that itraconazole increased the exposure of erlotinib in rats, whereas simvastatin performed no significant effect on erlotinib exposure. Therefore, when itraconazole and erlotinib are co-administrated, we should pay attention to the possible DDI to reduce adverse reactions.
Acknowledgments
This work was supported by Key Projects of Hebei Provincial Natural Science Foundation (No. H2021206432), National Science and Technology Major Project for Major New Drugs Innovation and Development 2020 in China (No. 2020ZX09201006).
Disclosure
The authors report no conflicts of interest in this work.
References
1. Higgins B, Kolinsky K, Smith M, et al. Antitumor activity of erlotinib (OSI-774, Tarceva) alone or in combination in human non-small cell lung cancer tumor xenograft models. Anticancer Drugs. 2004;15(5):503–512. doi:10.1097/01.cad.0000127664.66472.60
2. Herbst RS, Johnson DH, Mininberg E, et al. Phase I/II trial evaluating the anti-vascular endothelial growth factor monoclonal antibody bevacizumab in combination with the HER-1/epidermal growth factor receptor tyrosine kinase inhibitor erlotinib for patients with recurrent non-small-cell lung cancer. J Clin Oncol. 2005;23(11):2544–2555. doi:10.1200/JCO.2005.02.477
3. Festuccia C, Gravina GL, Biordi L, et al. Effects of EGFR tyrosine kinase inhibitor erlotinib in prostate cancer cells in vitro. Prostate. 2009;69(14):1529–1537. doi:10.1002/pros.20995
4. Hidalgo M, Siu LL, Nemunaitis J, et al. Phase I and pharmacologic study of OSI-774, an epidermal growth factor receptor tyrosine kinase inhibitor, in patients with advanced solid malignancies. J Clin Oncol. 2001;19(13):3267–3279. doi:10.1200/JCO.2001.19.13.3267
5. Park H, Williams K, Trikalinos NA, et al. A phase I trial of temsirolimus and erlotinib in patients with refractory solid tumors. Cancer Chemother Pharmacol. 2021;87(3):337–347. doi:10.1007/s00280-020-04183-0
6. Xing L, Wu G, Wang L, et al. Erlotinib versus etoposide/cisplatin with radiation therapy in unresectable stage III epidermal growth factor receptor mutation-positive non-small cell lung cancer: a multicenter, randomized, open-label, Phase 2 trial. IntJ Radiat Oncol Biol Phys. 2021;109(5):1349–1358. doi:10.1016/j.ijrobp.2020.11.026
7. Tan L, Tran B, Tie J, et al. A Phase Ib/II trial of combined BRAF and EGFR Inhibition in BRAF V600E positive metastatic colorectal cancer and other cancers: the EVICT (Erlotinib and Vemurafenib In Combination Trial) Study. Clin Cancer Res. 2023;29:1017–1030.
8. Xie C, Jing Z, Luo H, et al. Chemoradiotherapy with extended nodal irradiation and/or erlotinib in locally advanced oesophageal squamous cell cancer: long-term update of a randomised Phase 3 trial. Br J Cancer. 2020;123(11):1616–1624. doi:10.1038/s41416-020-01054-6
9. Ling J, Johnson KA, Miao Z, et al. Metabolism and excretion of erlotinib, a small molecule inhibitor of epidermal growth factor receptor tyrosine kinase, in healthy male volunteers. Drug MetabDispos. 2006;34:420–426.
10. Butel-Simoes LE, Haw TJ, Williams T, et al. Established and emerging cancer therapies and cardiovascular system: focus on hypertension-mechanisms and mitigation. Hypertension. 2023;80(4):685–710. doi:10.1161/HYPERTENSIONAHA.122.17947
11. Joseph A, Joshua JM, Mathews SM. Chemotherapy-induced neutropenia among breast cancer patients in a tertiary care hospital: risk and consequences. J Oncol Pharm Pract. 2023;29(3):529–533. doi:10.1177/10781552221074004
12. Le LF, Puisset F, Chatelut E, et al. Considering the oral bioavailability of protein kinase inhibitors: essential in assessing the extent of drug-drug interaction and improving clinical practice. Clin Pharmacokinet. 2023;62(1):55–66. doi:10.1007/s40262-022-01200-8
13. Nelson RH. Hyperlipidemia as a risk factor for cardiovascular disease. Prim Care. 2013;40(1):195–211. doi:10.1016/j.pop.2012.11.003
14. Luzum JA, Theusch E, Taylor KD, et al. Individual and combined Associations of genetic variants in CYP3A4, CYP3A5, and SLCO1B1 with simvastatin and simvastatin acid plasma concentrations. J Cardiovasc Pharmacol. 2015;66(1):80–85. doi:10.1097/FJC.0000000000000246
15. Kontoyiannis DP, Patterson TF. Diagnosis and treatment of invasive fungal infections in the cancer patient: recent progress and ongoing questions. Clin Infect Dis. 2014;59(suppl_5):S356–9. doi:10.1093/cid/ciu591
16. FDA. Clinical drug interaction studies—cytochrome P450 enzyme- and transporter-mediated drug interactions guidance for industry. Available from: https://www.fda.gov/media/134581/download.
17. EM Agency. Guideline on the investigation of drug interactions. Available from: https://www.ema.europa.eu/en/documents/scientific-guideline/guideline-investigationdrug-interactions_en.pdf.
18. Li C, Fang Z, Wu Z, et al. Repurposed itraconazole for use in the treatment of malignancies as a promising therapeutic strategy. Biomed Pharmacother. 2022;154:113616. doi:10.1016/j.biopha.2022.113616
19. Center for Drug Evaluation and Research of the U.S. Department of health and human services food and drug administration, guidance for industry; Bioanalytical method validation; 2018. Available from: http://www.fda.gov/Drugs/GuidanceComplianceRegulatoryInformation/Guidances/ucm064964.htm.
20. Rakhit A, Pantze MP, Fettner S, et al. The effects of CYP3A4 inhibition on erlotinib pharmacokinetics: computer-based simulation (SimCYP) predicts in vivo metabolic inhibition. EurJ Clin Pharmacol. 2008;64(1):31–41. doi:10.1007/s00228-007-0396-z
21. Calvert H, Twelves C, Ranson M, et al. Effect of erlotinib on CYP3A activity, evaluated in vitro and by dual probes in patients with cancer. Anticancer Drugs. 2014;25(7):832–840. doi:10.1097/CAD.0000000000000099
22. Maher Hadir M, Alzoman Nourah Z, Shehata Shereen M. Simultaneous determination of erlotinib and tamoxifen in rat plasma using UPLC-MS/MS: application to pharmacokinetic interaction studies. J Chromatogr B Analyt Technol Biomed Life Sci. 2016;1028:100–110. doi:10.1016/j.jchromb.2016.05.033
23. Hamilton M, Wolf JL, Drolet DW, et al. The effect of rifampicin, a prototypical CYP3A4 inducer, on erlotinib pharmacokinetics in healthy subjects. Cancer ChemotherPharmacol. 2014;73:613–621.
24. Maher Hadir M, Alzoman Nourah Z, Shehata Shereen M, et al. UPLC-ESI-MS/MS study of the effect of green tea extract on the oral bioavailability of erlotinib and lapatinib in rats: potential risk of pharmacokinetic interaction. J Chromatogr B Analyt Technol Biomed Life Sci. 2017;1049–1050:30–40. doi:10.1016/j.jchromb.2017.02.029
25. Aliyah A, Maher Hadir M, Alzoman Nourah Z, et al. Flavoured water consumption alters pharmacokinetic parameters and increases exposure of erlotinib and gefitinib in a preclinical study using Wistar rats. PeerJ. 2020;8:e9881. doi:10.7717/peerj.9881
26. Gass-Jégu F, Gschwend A, Gairard-Dory A, et al. Gastrointestinal perforations in patients treated with erlotinib: a report of two cases with fatal outcome and literature review. Lung Cancer. 2016;99:76–78. doi:10.1016/j.lungcan.2016.06.012
27. Gao J, Ren H, Feng Z, et al. Effects of multidose simvastatin co-administration on pharmacokinetic profile of apatinib in rats by UPLC-MS/MS. Xenobiotica. 2020;50(9):1115–1120. doi:10.1080/00498254.2020.1740952
28. Veeraputhiran M, Sundermeyer M. Rhabdomyolysis resulting from pharmacologic interaction between erlotinib and simvastatin. Clin Lung Cancer. 2008;9(4):232–234. doi:10.3816/CLC.2008.n.036
29. James AJ, Smith CC, Litzow M, et al. Pharmacokinetic profile of gilteritinib: a novel FLT-3 tyrosine kinase inhibitor. ClinPharmacokinet. 2020;59(10):1273–1290. doi:10.1007/s40262-020-00888-w
30. Wang Q, Chen Z, Chen D, et al. An LC-MS/MS bioanalytical assay for the determination of gilteritinib in rat plasma and application to a drug-drug interaction study. Drug Des Devel Ther. 2020;14:2061–2067. doi:10.2147/DDDT.S243760
31. Liu X, Zhang Y, Chen Q, et al. Pharmacokinetic drug interactions of apatinib with rifampin and itraconazole. J Clin Pharmacol. 2018;58(3):347–356. doi:10.1002/jcph.1016
32. Garrison DA, Jin Y, Talebi Z, et al. Itraconazole-induced increases in gilteritinib exposure are mediated by CYP3A and OATP1B. Molecules. 2022;27(20):undefined. doi:10.3390/molecules27206815
 © 2023 The Author(s). This work is published and licensed by Dove Medical Press Limited. The full terms of this license are available at https://www.dovepress.com/terms.php and incorporate the Creative Commons Attribution - Non Commercial (unported, v3.0) License.
By accessing the work you hereby accept the Terms. Non-commercial uses of the work are permitted without any further permission from Dove Medical Press Limited, provided the work is properly attributed. For permission for commercial use of this work, please see paragraphs 4.2 and 5 of our Terms.
© 2023 The Author(s). This work is published and licensed by Dove Medical Press Limited. The full terms of this license are available at https://www.dovepress.com/terms.php and incorporate the Creative Commons Attribution - Non Commercial (unported, v3.0) License.
By accessing the work you hereby accept the Terms. Non-commercial uses of the work are permitted without any further permission from Dove Medical Press Limited, provided the work is properly attributed. For permission for commercial use of this work, please see paragraphs 4.2 and 5 of our Terms.