")
Back to Journals » International Journal of Chronic Obstructive Pulmonary Disease » Volume 12
A cross-sectional assessment of the burden of COPD symptoms in the US and Europe using the National Health and Wellness Survey
Authors Ding B , DiBonaventura M , Karlsson N, Bergström G, Holmgren U
Received 2 June 2016
Accepted for publication 20 September 2016
Published 7 February 2017 Volume 2017:12 Pages 529—539
DOI https://doi.org/10.2147/COPD.S114085
Checked for plagiarism Yes
Review by Single anonymous peer review
Peer reviewer comments 2
Editor who approved publication: Dr Richard Russell
Bo Ding,1 Marco DiBonaventura,2 Niklas Karlsson,1 Gina Bergström,1 Ulf Holmgren1
1AstraZeneca Gothenburg, Mölndal, Sweden; 2Kantar Health, New York, NY, USA
Introduction: Past research has suggested significant relationships between symptoms and health outcomes among patients with COPD. However, these studies have generally focused on a broad COPD sample and may have included those not receiving proper treatment. As a result, the aim of this study was to document the burden of COPD symptoms among those who are currently treated with the standard-of-care (SOC) medications in both the US and Western Europe.
Methods: Data from the 2013 US (N=75,000) and 2011 (N=57,512)/2013 (N=62,000) European (France, Germany, Italy, Spain, and UK; 5EU) National Health and Wellness Survey (NHWS) were used. The NHWS is a health survey administered to a demographically representative sample of the adult population in each country. A total of 1,666 and 2,006 patients with self-reported physician diagnosis of COPD in the 5EU and US, respectively, were being treated with the appropriate SOC (based on self-reported medication use) and were included in the analyses. Symptoms (eg, dyspnea, coughing, wheezing) were reported descriptively and summed to create a symptom score (with higher score indicating more frequent symptoms). The relationships between the symptom score and patient outcomes (eg, health status using the Short Form-36 version 2 [SF-36v2], work productivity and activity impairment [WPAI], and self-reported health care resource use) were explored using regression modeling.
Results: Nearly all patients (99.7% and 99.8% in the 5EU and US, respectively) reported experiencing symptoms and >80% reported experiencing at least one symptom “often”. Increasing symptom scores were associated with poorer health status (unstandardized beta [b] =-0.87 and -0.78 for mental component summary and physical component summary, respectively, in the US and b =-0.67 and -0.79 in the 5EU, respectively; all P<0.05). Increasing symptom scores were also associated with greater work impairment (b =0.09 and 0.06 for the US and 5EU, respectively), activity impairment (b =0.05 and 0.06, respectively), and health care resource utilization (eg, hospitalizations: b =0.05 and 0.06, respectively) (all P<0.05). Approximately 70% of patients reported some level of non-adherence. Greater non-adherence was significantly associated with more frequent symptoms, poorer health status, and greater work impairment and health care resource use (all P<0.05).
Conclusion: Patients with COPD who are using the appropriate SOC still experience symptoms, which have a significant effect on both humanistic and economic outcomes.
Keywords: COPD, symptoms, quality of life, work productivity, health care resource use, adherence
Introduction
COPD, a progressive respiratory condition, is among the leading causes of death in the West.1 COPD becomes more common with age2 and has been shown to have a substantial impact on health outcomes such as health status and health-related quality of life,3,4 health care resource use,5 and work productivity.5–7 Indeed, the total cost of COPD in the US alone is nearly 50 billion dollars annually.8 Although forced expiratory volume in 1 second (FEV1) has been a standard marker for physiological change in COPD, research has suggested only a modest association between FEV1 and a patient’s symptoms, which primarily include dyspnea, cough, and sputum production.9 As a result, understanding the symptom experience is an important part of proper COPD management as symptoms may relate more strongly to certain patient outcomes than standard clinical markers.9 Past research has suggested significant relationships between symptoms and health outcomes.10–13 For example, an Internet survey conducted by Partridge et al11 found that dyspnea was among the most common symptoms and adversely affected patients’ ability to perform their normal daily activities. However, these studies have generally focused on a broad COPD sample and may have included those not receiving proper treatment. As a result, the aim of this study was to examine the prevalence of symptoms and their association with health outcomes among patients receiving the appropriate standard of care (SOC) based on their modified Global Initiative for Chronic Obstructive Lung Disease (GOLD) 2014 group classification (“modified” due to lack of spirometry data).14
Methods
Data source
This study included data from the 2013 US National Health and Wellness Survey (NHWS) and the combined 2011 and 2013 5EU NHWS (including France, Germany, Italy, Spain, and UK; no 2012 5EU NHWS data were collected). Two 5EU surveys were used to maximize sample size and statistical power. The method for each region is described in more detail later.
In the US (N=75,000; response rate =13.53%), the NHWS is fielded separately in each of the first three quarters in each year (first quarter: January through March; second quarter: April through June; third quarter: July through September). Potential respondents for the NHWS were identified through the general panel of Lightspeed Research (LSR), a company which maintains various online respondent panels. All adults (aged 18 years and older) are eligible to join these respondent panels and do so by responding to advertisements in e-newsletters and online banner advertisements.15 Panel recruitment is not done purely by convenience, as an attempt to match the demographics of each country is made.16 Members of the panel receive periodic (no more than 12 per year) invitations to participate in a variety of online surveys (eg, consumer package goods, automotive, health, etc).
The NHWS uses these panels as its sample source but imposes a stratified random sample framework. Each year, data from the Current Population Survey of the US Census17 were used to identify the relative proportions of age, sex, and race/ethnicity groups in the US; these proportions were then mimicked during the recruiting of panel members to ensure that the final NHWS sample matched the demographic proportion of the US. Several peer-reviewed publications have previously compared demographic distributions and prevalence figures from the NHWS with other governmental sources.18–20 For example, Bolge et al18 found that the prevalence rates between the NHWS and the National Health Interview Survey were within 3% of one another for 10 of the 12 conditions assessed (exceptions were with high cholesterol and depression).
The 2011 5EU (N=57,512; response rate =19.69%) and 2013 5EU NHWS (N=62,000; response rate =15.95%) methods are largely the same as described for the US. Aside from slightly different response choices being used where required (eg, health insurance, household income, etc), the survey questions are identical to that of the US version. Respondents were recruited online using the same panel and in the same manner as the US NHWS. A stratified random sample is also used in the 5EU, but only age and sex are the strata of interest (race/ethnicity data were not collected). The source used for designing the sample frame was the International Database of the United States Census,21 which reports age by sex distributions of each country in the world. For each country, the age and sex distributions of the adult population were mimicked during recruitment. Written (electronic) consent was obtained from all study respondents. The protocols and surveys associated with the 2013 US NHWS, 2011 5EU NHWS, and 2013 5EU NHWS were all reviewed and approved by an independent institutional review board (Essex IRB, Lebanon, NJ; Protocol numbers: KH-NHWS-US13, KH-NHWS-EU11, and KH-NHWS-EU13, respectively).
Sample
Only patients who are using the appropriate SOC based on the modified GOLD 2014 guidelines were included in the analyses. The SOC depends upon the patient’s modified GOLD 2014 group classification,14 which was defined by a combination of symptoms (assessed using the modified Medical Research Council Dyspnea scale [mMRC]) and exacerbation history (Figure 1). Based on their modified GOLD 2014 group classification and self-reported medication use (Table 1), patients were further classified as whether or not they were using the appropriate SOC based on the modified GOLD 2014 guidelines.14 A total of 2,006 in the 5EU and 1,666 in the US met the criteria and were included in the analyses.
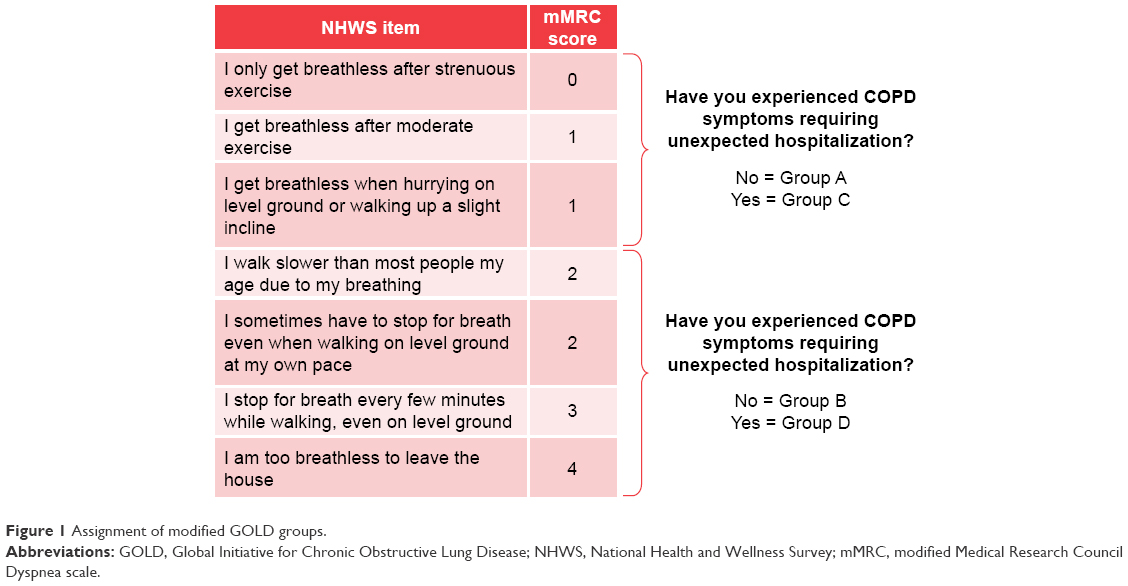 | Figure 1 Assignment of modified GOLD groups. |
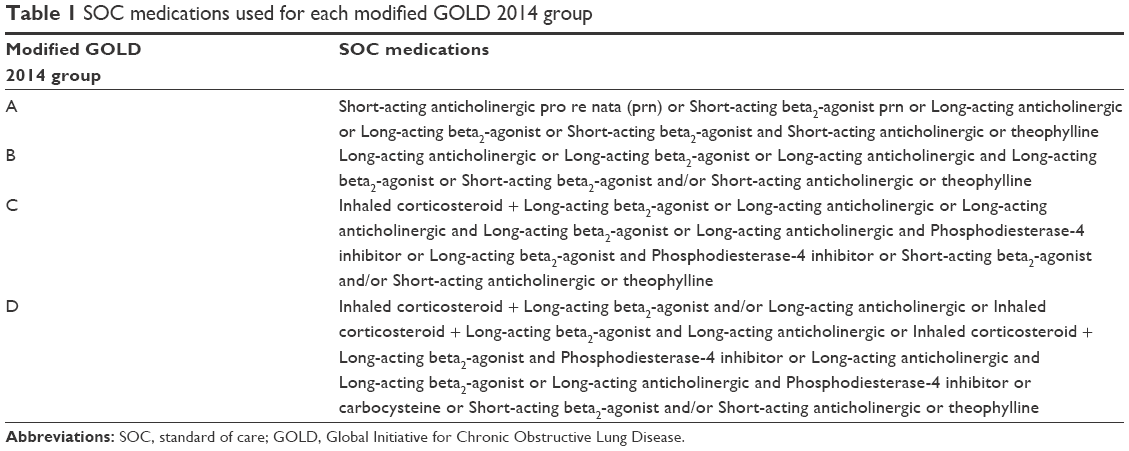 | Table 1 SOC medications used for each modified GOLD 2014 group |
Measures
Symptoms
For those who self-reported being diagnosed by a physician with COPD, emphysema, or chronic bronchitis, all patients reported the frequency (on a five-point Likert-type scale of “always”, “often”, “sometimes”, “rarely”, and “never”) of the following symptoms: dyspnea, fits of coughing, infection, mucous production, and wheezing.
Demographics
Demographic variables assessed in the NHWS included country (5EU only), sex, age, race/ethnicity (US only), marital status, employment, annual household income, education, and health insurance.
Health history
Health history variables included smoking habits, alcohol consumption, exercise, and body mass index (BMI) category (which was calculated based on self-reported height and weight). The Charlson comorbidity index (CCI), which represents a weighted sum of multiple self-reported comorbid conditions predictive of mortality, was also included.22 Individual comorbidities of particular relevance to COPD were also assessed separately outside the CCI. These included asthma, allergic rhinitis, cardiovascular disease (defined by having any one of the following: congestive heart failure, myocardial infarction, arrhythmia, atrial fibrillation, transient ischemia attack, or stroke), and depression.
Disease history
The following information on a patient’s COPD history was also included: number of years they have been diagnosed, presence of exacerbations, duration of exacerbations in the past 6 months, and main cause of COPD episodes. A self-reported adherence measure, the 8-item Morisky Medication Adherence Scale (MMAS-8),23 was asked of the NHWS 2013 respondents about their COPD medications specifically. The MMAS-8 contains eight items, which each represents a non-adherent behavior (eg, stopping medication when you feel worse; forgetting medication when traveling, etc). Patients are categorized into high adherence, medium adherence, or low adherence according to the established scoring algorithm.
Health outcomes
Health status was assessed using the Short Form-36 version 2 (SF-36v2) (in the US and the 2013 5EU data) and the Short Form-12 version 2 (SF-12v2) (in the 2011 5EU data).24,25 The physical component summary (PCS) and mental component summary (MCS) scores (range 0–100) were included along with health state utilities (range 0–1). Work productivity and activity impairment (WPAI) was assessed using the WPAI questionnaire (WPAI-GH) (range 0%–100%).26 Patients self-reported the number of traditional health care provider visits (eg, general internist, pulmonologist, gynecologist, psychologist, etc), the number of emergency room (ER) visits, and the number of times hospitalized in the past 6 months.
Statistical analysis
The distribution of COPD symptoms was reported descriptively, using frequencies, percentages, mean, and standard deviations (SDs). Differences between patients who reported experiencing at least one symptom “always” versus patients who did not report experiencing any symptom “always” were examined with respect to demographics, health history, and disease history variables using chi-square tests and one-way analysis of variance (ANOVA). The intent of this analysis was to identify variables that differ by symptom frequency in order to include them as covariates in the regression modeling described later.
A symptom score was then developed by summing the frequency ratings of each of the five symptoms assessed. This symptom score was then used as a primary predictor of health outcomes in a series of generalized linear models. The distribution and link function varied depending upon the outcome being assessed (normal and identity, respectively, for health status variables; negative binomial and log, respectively, for work productivity and health care resource use variables). Covariates including all variables were significantly different between symptom presence (eg, at least one symptom appearing “always”) and symptom absence groups in the abovementioned bivariate analysis at P<0.25 (age and sex were included as covariates regardless of significance).
Since the symptom experience may be a function of the degree to which patients are adherent to their medication, we also reported the level of self-reported medication use. Further, we also examined the relationship between non-adherence and health outcomes among these patients.
Results
A total of 2,006 patients in the 5EU and 1,666 patients in the US were included in the analyses (Table 2). Most patients were male (54.3% and 58.8% in the 5EU and US, respectively) with a mean age of 57.6 years (SD =13.2) in the 5EU and 62.0 years (SD =12.2) in the US. Nearly all patients (99.7% and 99.8% in the 5EU and US, respectively) reported at least some frequency (ie, not “none”) of at least one of the five symptoms assessed (Figures 2 and 3). Further, 83.5% and 85.6%, respectively, of patients reported experiencing at least one symptom “often”.
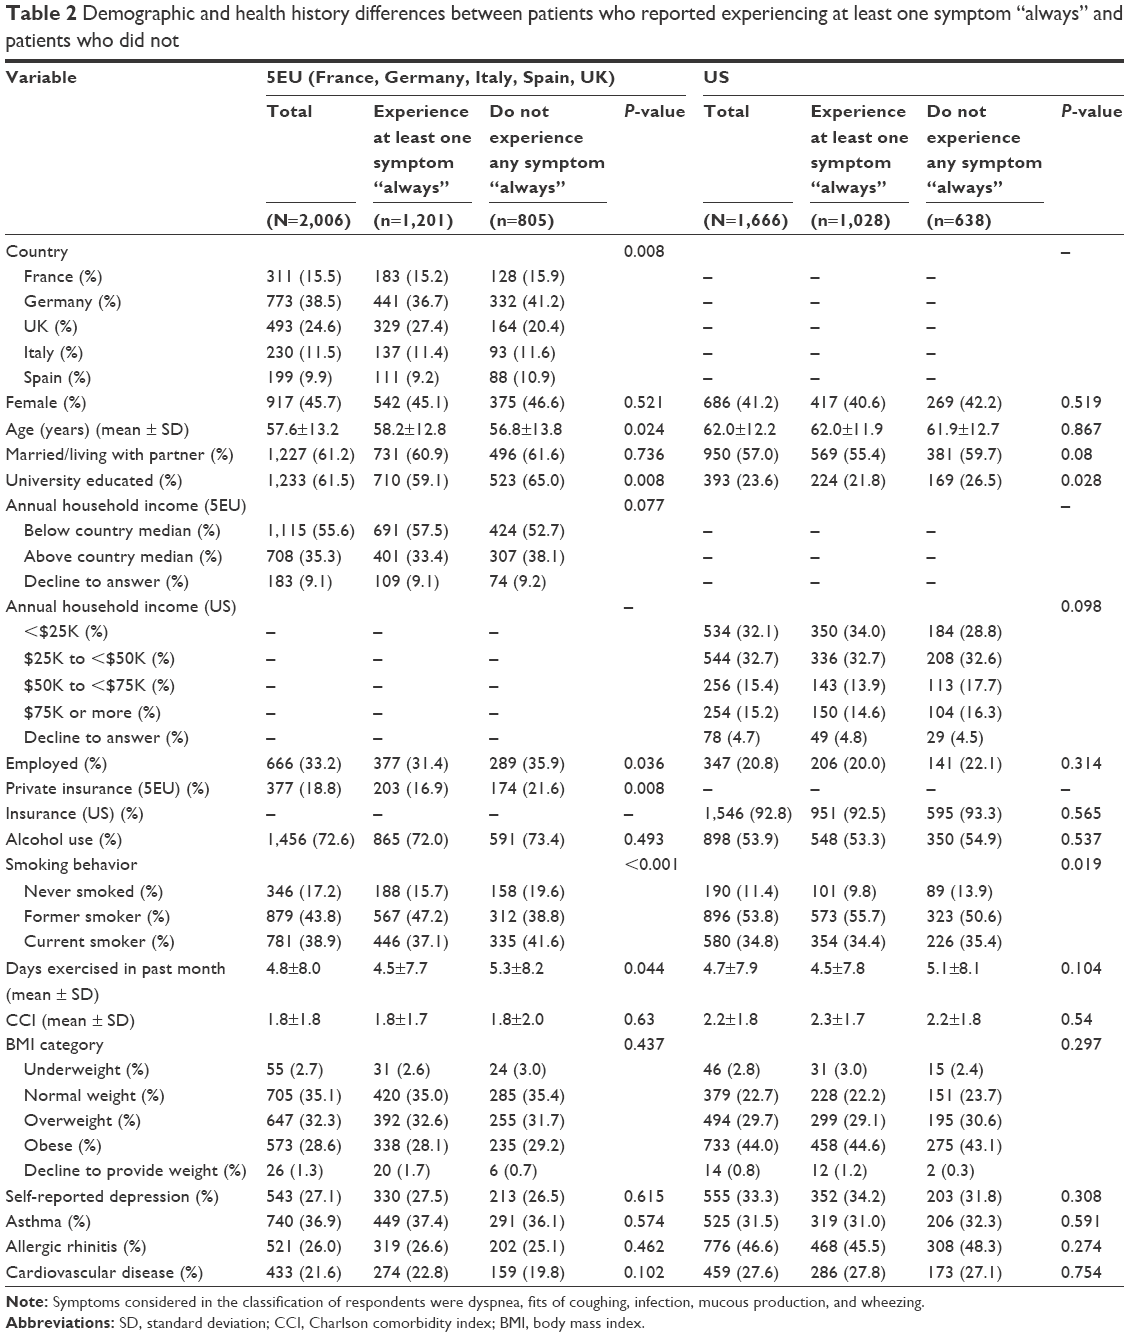 | Table 2 Demographic and health history differences between patients who reported experiencing at least one symptom “always” and patients who did not |
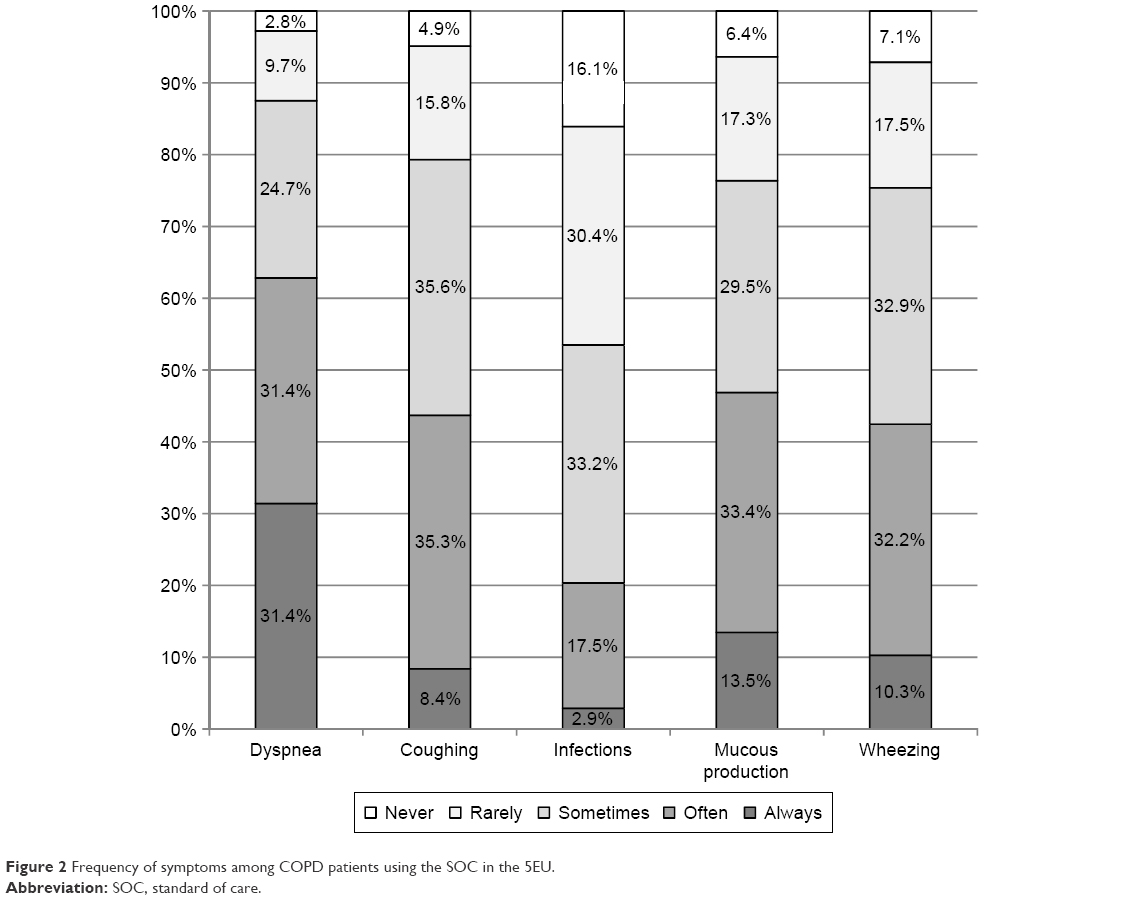 | Figure 2 Frequency of symptoms among COPD patients using the SOC in the 5EU. |
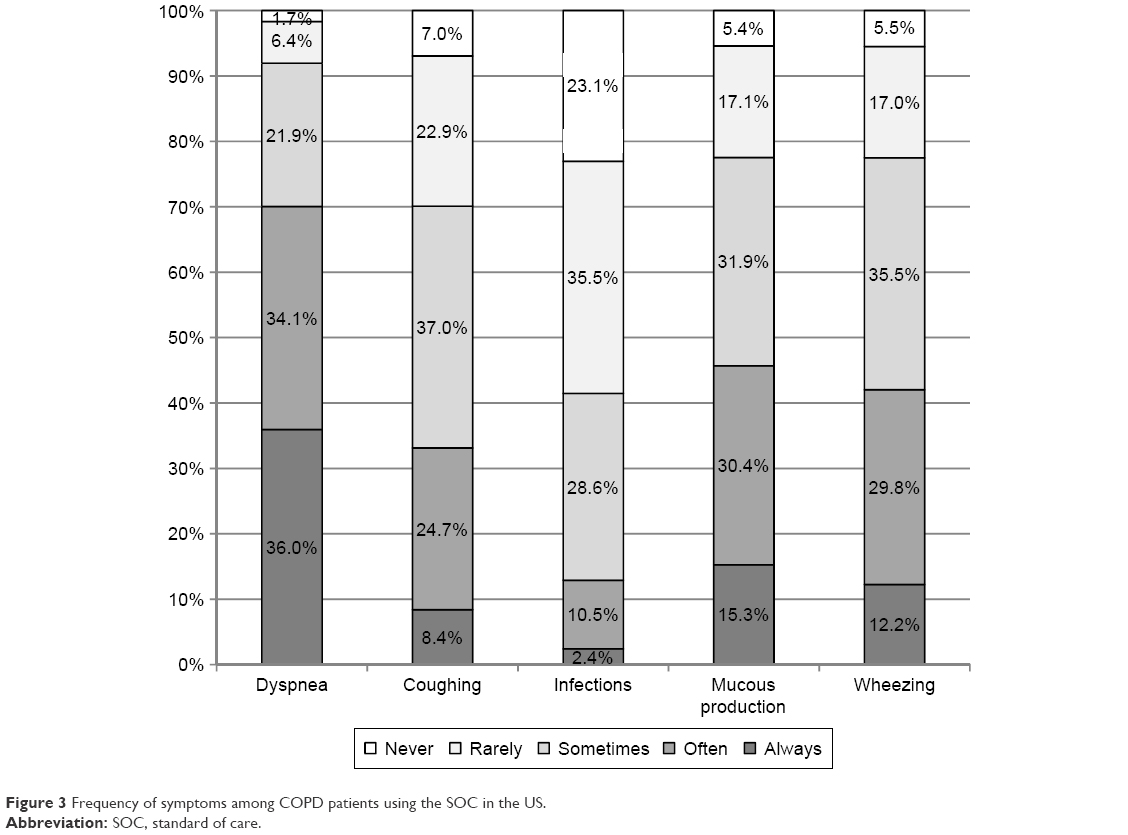 | Figure 3 Frequency of symptoms among COPD patients using the SOC in the US. |
Dyspnea was the most common symptom (62.8% and 70.0% reported experiencing it “always” or “often”). Coughing, wheezing, and mucous production were also common and generally similar in their frequency (~32%–47% reporting experiencing these symptoms “always” or “often”). Infections were the most infrequently reported symptom (only 20.3% and 12.9% reported experiencing them “always” or “often”). However, there were significant differences across modified GOLD 2014 groups with respect to symptom frequency in the 5EU. For all symptoms, patients in Group D reported the highest frequency (all P<0.05). In the case of coughing and wheezing, patients in Group B reported the second highest frequency. The differences across modified GOLD 2014 groups for the US mirrored the results found in 5EU (results not shown).
Differences between patients who experienced at least one symptom were always compared with all other patients with respect to demographics, health history, and disease history (Table 3). Patients in the 5EU with more frequent symptoms were significantly more likely to be in the UK, older, and a former smoker and significantly less likely to have a university education, be employed, and have private insurance (all P<0.05). Patients with more frequent symptoms also exercised fewer days per month (P<0.05). Patients with frequent symptoms in the US were significantly less likely to have a university education and were more likely to be a former smoker (both P<0.05).
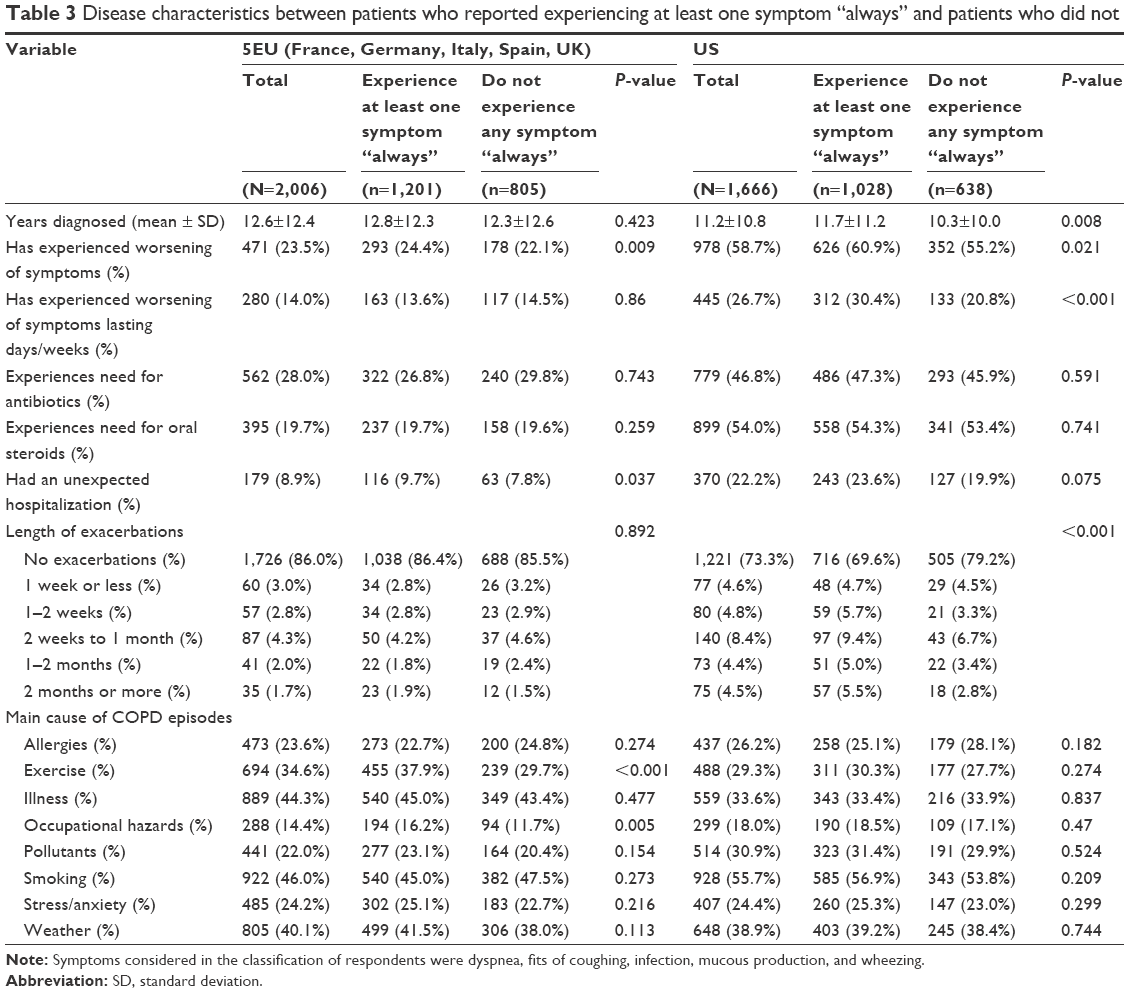 | Table 3 Disease characteristics between patients who reported experiencing at least one symptom “always” and patients who did not |
With respect to disease history, patients in the 5EU with more frequent symptoms were significantly more likely to have experienced a worsening of symptoms, an unexpected hospitalization, and attributed the causes of their COPD episodes to exercise and occupational hazards (all P<0.05; Table 3). Patients in the US with more frequent symptoms had been diagnosed longer and were more likely to have experienced a worsening of symptoms, worsening of symptoms that lasted days or more, and a longer length of exacerbations (all P<0.05).
Controlling for demographics and health history variables, the combined frequency of symptoms was significantly associated with reduced health status in both the 5EU and the US (Table 4). For every 1-unit increase (eg, “never” to “rarely”; “sometimes” to “often”) in any of the five assessed symptoms, an associated decrease of 0.67 (5EU) and 0.87 (US) points on MCS was observed. The effects on PCS were larger (0.79 and 0.78, respectively, decreases).
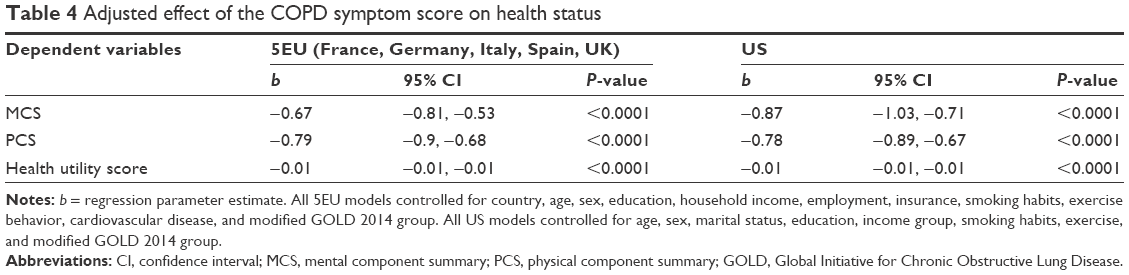 | Table 4 Adjusted effect of the COPD symptom score on health status |
Increased symptom frequency was also associated with increased rates of work-related impairment and health care resource use (Table 5). For every 1-unit increase, a 6% and 9% increase in overall work impairment was observed in the 5EU and US, respectively (both P<0.05). Additionally, for every 1-unit increase in symptom frequency, a 9% and 11%, respectively, increase was observed in the number of ER visits in the past 6 months, as well as a 6% and 5% increase observed in the number of hospitalizations (all P<0.05).
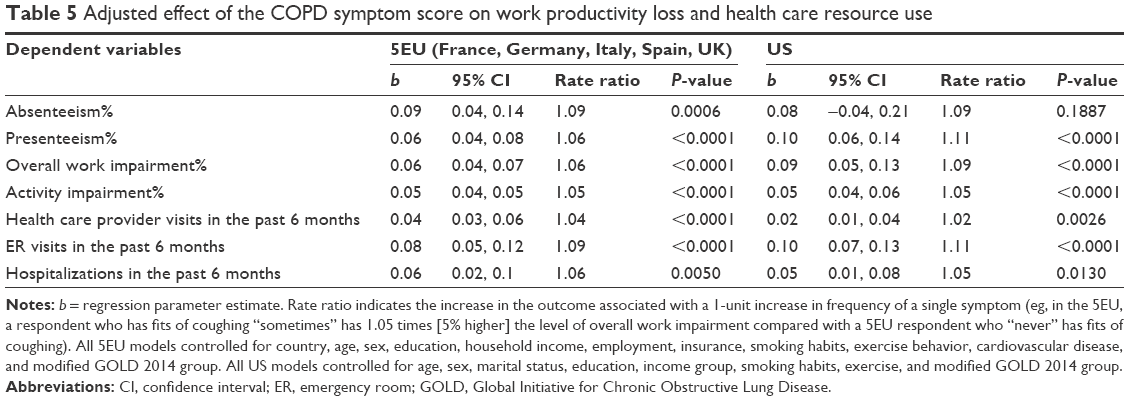 | Table 5 Adjusted effect of the COPD symptom score on work productivity loss and health care resource use |
The abovementioned results suggest that symptoms are frequently experienced among patients with COPD using the SOC; however, this could be a function of poor adherence. Although these patients are prescribed the appropriate SOC, they may not take the medication regularly. Indeed, as shown in Table 6, adherence was modest with over a fifth of patients categorized as having “low adherence”. For patients in 5EU, adherence was fairly consistent across the different GOLD groups, with the proportion of highly adherent patients ranging from 29.2% for Group A to 34.7% for Group D. For patients in the US, adherence was best among those in Group C (49.26% had high adherence) and worst among those in Group A (39.48% had high adherence) (both P<0.05). Non-adherence was also significantly associated with more frequent symptoms and poorer health outcomes. Patients in the 5EU with low adherence reported significantly more frequent symptoms and worse MCS and health utility scores compared with both patients with moderate and high levels of adherence (all P<0.05; Table 7). Patients with low adherence also reported more presenteeism (ie, health-related impairment experienced while at work), overall work impairment, activity impairment, and hospitalizations in the past 6 months relative to patients with high adherence (all P<0.05). Patients in the US with low adherence reported significantly more frequent symptoms, worse MCS, PCS, and health utility scores compared with patients with high levels of adherence (both P<0.05; Table 7). Similarly, differences between patients with high and low adherence were also observed with respect to absenteeism, overall work impairment, activity impairment, health care provider visits, ER visits, and hospitalizations (all P<0.05). Differences between patients with medium and low adherence were only observed with respect to overall work impairment and health care provider visits.
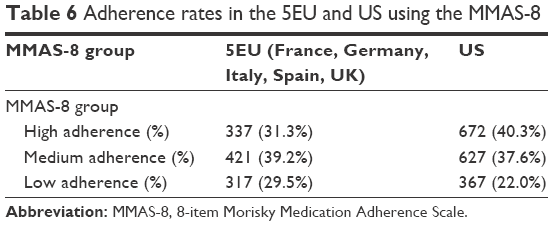 | Table 6 Adherence rates in the 5EU and US using the MMAS-8 |
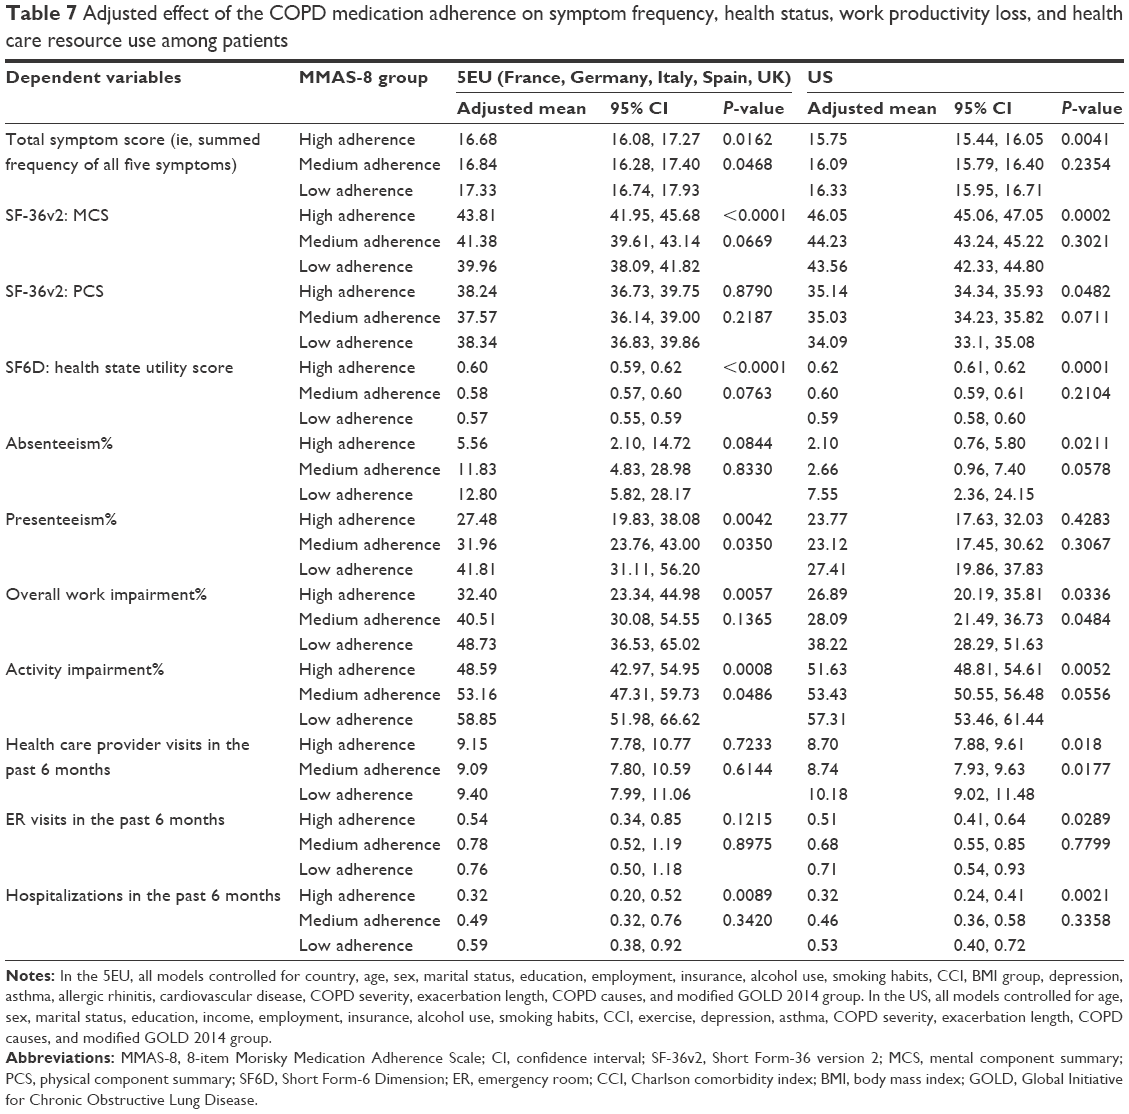 | Table 7 Adjusted effect of the COPD medication adherence on symptom frequency, health status, work productivity loss, and health care resource use among patients |
Discussion
Although prior research has uncovered a significant relationship between COPD symptoms and health outcomes,10–12 such studies have focused on the broad COPD population. This study focused on those who were being treated with the appropriate SOC based on their modified GOLD 2014 group. The results suggest that even with proper SOC treatment, patients are still reporting a number of symptoms, with dyspnea being the most common. This finding was consistent with prior literature, which has repeatedly demonstrated the high frequency of dyspnea among patients with COPD.11–13 Nearly all patients reported at least some frequency of symptoms, and >80% reported experiencing at least one symptom “often”.
Consistent with the work done in COPD more broadly,11–13 our study found that an increasing frequency of symptoms was associated with a significant decrement in mental and physical health status and health utilities in both the US and 5EU. Indeed, increasing the frequency of just one symptom from “rarely” to “always” would equate to a clinically meaningful change in all health status measures (ie, 3 points in MCS and PCS and 0.03 points in health utilities). Increasing frequency of symptoms was also significantly associated with increases in work impairment, daily activity limitations, and health care resource use. In general, increasing the frequency of just one symptom from “rarely” to “always” would equate to a 30% increase in impairment and health care resource use. These findings were similar across regions and highlight the tremendous impact the symptom experience can have on economic outcomes.
Although these findings suggest a substantial symptom burden among patients being appropriately treated, it is important to consider the role of adherence. Not all patients prescribed the SOC were using their medication appropriately, which was associated with the presence and frequency of their symptoms. Approximately 70% of patients reported at least some level of non-adherence, and ~20% of patients reported engaging in several non-adherent behaviors. Non-adherence was associated with significantly greater frequency of symptoms. These non-adherence rates are consistent with review papers that have cited that more than half of patients with COPD are not using their medications as prescribed.27 We found significant, albeit modest, associations between poor adherence and health outcomes. So, although adherence likely plays an important role for improving the symptom experience among patients treated with the SOC, it does not represent the only factor. Improved management of these patients may help to improve their health status, ability to improve work productivity, and reduce societal costs.
Limitations
There are several limitations of the study that should be noted. All data are patient reported and not clinically verified by patient medical records and thus could be associated with increased measurement error. Patients with definite COPD or of certain GOLD groups may be misclassified because of inaccurate patient reporting of diagnoses or treatment variables. For example, no FEV1 information was available, so our modified GOLD classification relied upon dyspnea and unexpected hospitalizations. Additionally, some self-reported measures may be less accurate than others. For example, the frequency of experiencing infection as a COPD symptom was asked. Physician-reported infection is likely more accurate than patient-reported infection. Patients may under or over report infection, which would then add noise to the model. Thus, the effect of symptoms (including infection) on health outcomes may be underestimated. It is also important to note that the data used for this study are a few years old (as old as 2011 in some cases for European respondents), and certain treatment approaches, such as dual bronchodilation or free triple combinations, may not have been common. The patient symptom experience may change as new treatment alternatives and combinations are incorporated into clinical practice. The data are also cross-sectional, which prevents drawing causal inferences between the various independent variables and health outcomes. Finally, although the NHWS is broadly representative of the 5EU and US population with respect to key demographic characteristics, there are other ways in which the NHWS sample overall (and specifically the COPD subsample receiving the appropriate SOC) may differ from the respective population. For example, the average age of the current sample was slightly lower than what has been observed in prior research of COPD patients (eg, 16% of the COPD population in the US is aged 65 years and older based on governmental data,28 yet 12% of our NHWS sample was aged 65 years and older). It is possible that elderly respondents in poorer health are underrepresented in the NHWS data. COPD patients with more severe disease symptoms and thus poorer health may also have less motivation to participate in an online survey and therefore may be underrepresented in NHWS. The low response rate of the surveys should also be considered; though given the online methodology, this low rate is likely due primarily to failure to contact respondents via email rather than respondent self-selection. Finally, >30% of patients with COPD in both the US and 5EU cohort had asthma, representing the broader COPD population and not the COPD population without the asthma–COPD overlap syndrome (ACOS). This threat to external validity may limit the extent to which the study results can be generalized.
Conclusion
Patients with COPD who are using the appropriate SOC based on their modified GOLD 2014 group still experience a number of symptoms, which has a significant effect on both humanistic and economic outcomes. Adherence among these patients is modest and contributes to poor outcomes, though does not entirely explain the symptom experience in this group. Unmet medical needs still exist among patients with COPD using the SOC in the US and 5EU.
Acknowledgments
This study was funded by AstraZeneca. MD’s current affiliation at the time of the submission is: Ipsos, New York, NY, USA. Part of the abstract of this paper was presented at the American Thoracic Society (ATS) 2016 International Conference in San Francisco, California, May 13–18, 2016, as an oral presentation with interim findings (http://www.atsjournals.org/doi/abs/10.1164/ajrccm-conference.2016.193.1_MeetingAbstracts.A6156).
Disclosure
BD, NK, GB, and UH are full-time employees of AstraZeneca. During the conduct of the study, MD was a full-time employee of Kantar Health, the organization that received funding from AstraZeneca. The authors report no other conflicts of interest in this work.
References
Punturieri A, Croxton TL, Weinman GG, Kiley JP. Chronic obstructive pulmonary disease: a view from the NHLBI. Am J Respir Crit Care Med. 2008;178(5):441–443. | ||
Yeo J, Karimova G, Bansal S. Co-morbidity in older patients with COPD – its impact on health service utilisation and quality of life, a community study. Age Ageing. 2006;35(1):33–37. | ||
Carrasco Garrido P, de Miguel Diez J, Rejas Gutierrez J, et al. Negative impact of chronic obstructive pulmonary disease on the health-related quality of life of patients. Results of the EPIDEPOC study. Health Qual Life Outcomes. 2006;4:31. | ||
Ståhl E, Lindberg A, Jansson SA, et al. Health-related quality of life is related to COPD disease severity. Health Qual Life Outcomes. 2005;3:56. | ||
Minkoff NB. Analysis of the current care model of the COPD patient: a health outcomes assessment and economic evaluation. J Manag Care Pharm. 2005;11(6 suppl A):S3–S7. [quiz S20–S22]. | ||
Sin DD, Stafinski T, Ng YC, Bell NR, Jacobs P. The impact of chronic obstructive pulmonary disease on work loss in the United States. Am J Respir Crit Care Med. 2002;165(5):704–707. | ||
Halpern MT, Polzin J, Higashi MK, Bakst A. The workplace impact of acute exacerbations of chronic bronchitis (AECB); A literature review. COPD. 2004;1(2):249–254. | ||
National Heart, Lung, and Blood Institute. Morbidity and Mortality: 2012 Chart Book on Cardiovascular, Lung and Blood Diseases. Bethesda, MD: National Institutes of Health; 2012. | ||
Jones PW, Agusti AG. Outcomes and markers in the assessment of chronic obstructive pulmonary disease. Eur Respir J. 2006;27(4):822–832. | ||
Srivastava K, Thakur D, Sharma S, Punekar YS. Systematic review of humanistic and economic burden of symptomatic chronic obstructive pulmonary disease. Pharmacoeconomics. 2015;33(5):467–488. | ||
Partridge MR, Karlsson N, Small IR. Patient insight into the impact of chronic obstructive pulmonary disease in the morning: an internet survey. Curr Med Res Opin. 2009;25(8):2043–2048. | ||
Roche N, Chavannes NH, Miravitlles M. COPD symptoms in the morning: impact, evaluation and management. Respir Res. 2013;14:112. | ||
Okutan O, Tas D, Demirer E, Kartaloglu Z. Evaluation of quality of life with the chronic obstructive pulmonary disease assessment test in chronic obstructive pulmonary disease and the effect of dyspnea on disease-specific quality of life in these patients. Yonsei Med J. 2013;54(5):1214–1219. | ||
Global Initiative for Chronic Obstruct Lung Disease. Pocket guide to COPD diagnosis, management, and prevention: a guide for health care professionals [Updated 2014]. Available from: http://www.farm.ucl.ac.be/Benin/2014/pharmacologie-speciale/6-systeme-respiratoire/GOLD_Pocket2014_Jan30.pdf. Accessed December 12, 2014. | ||
Lightspeed Online Research, Inc. Global Panels; 2011. Available from: http://www.lightspeedresearch.com/global-panels/. Accessed October 26, 2011. | ||
Lightspeed GMI. Lightspeed GMI Global Panel Book; 2015. Available from: http://www.lightspeedgmi.com/wp-content/uploads/2015/01/LightspeedGMI_PanelBook_2015_online.pdf. Accessed February 5, 2016. | ||
United States Census Bureau [webpage on the Internet]. Current Population Survey. Available from: http://thedataweb.rm.census.gov/ftp/cps_ftp.html. Accessed February 5, 2016. | ||
Bolge SC, Doan JF, Kannan H, Baran RW. Association of insomnia with quality of life, work productivity, and activity impairment. Qual Life Res. 2009;18(4):415–422. | ||
DiBonaventura MD, Wagner JS, Yuan Y, L’Italien G, Langley P, Ray Kim W. Humanistic and economic impacts of hepatitis C infection in the United States. J Med Econ. 2010;13(4):709–718. | ||
Finkelstein EA, Allaire BT, DiBonaventura MD, Burgess SM. Direct and indirect costs and potential cost savings of laparoscopic adjustable gastric banding among obese patients with diabetes. J Occup Environ Med. 2011;53(9):1025–1029. | ||
United States Census Bureau [database on the Internet]. International Data Base. Available from: https://www.census.gov/population/international/data/idb/informationGateway.php. Accessed December 19, 2014. | ||
Charlson ME, Pompei P, Ales KL, MacKenzie CR. A new method of classifying prognostic comorbidity in longitudinal studies: development and validation. J Chronic Dis. 1987;40(5):373–383. | ||
Morisky DE, Ang A, Krousel-Wood M, Ward H. Predictive validity of a medication adherence measure for hypertension control. J Clin Hypertens. 2008;10(5):348–354. | ||
Maruish ME, editor. User’s manual for the SF-36v2 Health Survey, 3rd ed. Lincoln: Quality Metric Incorporated; 2011. | ||
Ware JE, Kosinkski M, Keller SD. A 12-item Short-Form Health Survey: construction of scales and preliminary tests of reliability and validity. Med Care. 1996;34(3):220–233. | ||
Reilly MC, Zbrozek AS, Dukes EM. The validity and reproducibility of a work productivity and activity impairment instrument. Pharmacoeconomics. 1993;4(5):353–365. | ||
Bender BG. Nonadherence in chronic obstructive pulmonary disease patients: what do we know and what should we do next? Curr Opin Pulm Med. 2014;20(2):132–137. | ||
Ford ES, Croft JB, Mannino DM, Wheaton AG, Zhang X, Giles WH. COPD surveillance – United States, 1999–2011. Chest. 2013;144(1):284–305. |
 © 2017 The Author(s). This work is published and licensed by Dove Medical Press Limited. The full terms of this license are available at https://www.dovepress.com/terms.php and incorporate the Creative Commons Attribution - Non Commercial (unported, v3.0) License.
By accessing the work you hereby accept the Terms. Non-commercial uses of the work are permitted without any further permission from Dove Medical Press Limited, provided the work is properly attributed. For permission for commercial use of this work, please see paragraphs 4.2 and 5 of our Terms.
© 2017 The Author(s). This work is published and licensed by Dove Medical Press Limited. The full terms of this license are available at https://www.dovepress.com/terms.php and incorporate the Creative Commons Attribution - Non Commercial (unported, v3.0) License.
By accessing the work you hereby accept the Terms. Non-commercial uses of the work are permitted without any further permission from Dove Medical Press Limited, provided the work is properly attributed. For permission for commercial use of this work, please see paragraphs 4.2 and 5 of our Terms.