Back to Journals » Journal of Asthma and Allergy » Volume 15
A Cost-Effectiveness Analysis of a Community Health Worker Led Asthma Education Program in South Texas
Authors Naufal G, Naiser E ![]() , Patterson B, Baek J, Carrillo G
, Patterson B, Baek J, Carrillo G ![]()
Received 25 November 2021
Accepted for publication 8 April 2022
Published 4 May 2022 Volume 2022:15 Pages 547—556
DOI https://doi.org/10.2147/JAA.S351141
Checked for plagiarism Yes
Review by Single anonymous peer review
Peer reviewer comments 2
Editor who approved publication: Dr Luis Garcia-Marcos
Video abstract presented by Georges Naufal.
Views: 1048
Georges Naufal,1,2 Emily Naiser,1 Bethany Patterson,1 Juha Baek,2 Genny Carrillo3
1Public Policy Research Institute, Texas A&M University, College Station, TX, USA; 2Center for Outcomes Research, Houston Methodist, Houston, TX, USA; 3Department of Environmental and Occupational Health, Texas A&M University School of Public Health, College Station, TX, USA
Correspondence: Georges Naufal, Tel +1 9798451025, Fax +1 9798450249, Email [email protected]
Purpose: This paper examines the cost-effectiveness of an asthma-related education program.
Materials and Methods: Using a pre and post approach, the paper calculates first changes in cost due to variations in outcome (from baseline to follow-up). We also estimate cost-effectiveness ratios for each of the eight outcomes (numbers of asthma attacks, hospital, and ER visits, and physical and emotional health, and activity levels of both children and family members).
Results: The intervention saved the household around $36 per day. Cost-effectiveness ratios ranged between less than $2.2 for children and family members’ physical and emotional health, and activity levels to between $4.1 and $82.8 for asthma attacks and hospital visits. Cost-benefit results showed minimal benefit due to conservative estimates. We could not quantify the economic value of physical and emotional health improvement seen based on the measures.
Conclusion: Cost savings and ratios suggest that such a program could reduce health disparities due to improved knowledge, decreasing exposure to asthma triggers, enhancing health outcomes, and improving the quality of life of the children with asthma and their whole family.
Keywords: cost-effectiveness ratio, asthma home intervention, physical health of children, emotional health of children, activities of children
Introduction
Twenty-five million individuals, representing one out of thirteen people in the United States (US) have asthma. They face frequent physician visits, high emergency department use, and hospitalization stays.1 Children and adolescents are particularly affected. While children and adult populations have similar asthma diagnosis rates, they differ dramatically in the prevalence of asthma attacks and their healthcare use related to asthma. In 2019, children under 18 years old (44.3%) had a higher prevalence of asthma attacks than adults (40.4%). The rate of asthma-related Emergency room (ER) visits for those under 18 years old is three times higher than for adults, whereas the rate of inpatient hospital stays for children is 30% lower for children.1
The exact cause of asthma is unknown, but experts agree that genetics, comorbid conditions, development, and the environment are important factors linked to asthma and asthma attacks. Given the impact on quality of life alongside the gains of effective treatment and management, interventions to educate people with asthma are critical to improving health outcomes. Reducing contact with indoor environmental triggers, such as dust, cockroach allergen, pet allergens, mold, and tobacco smoke, among the pediatric asthma population is a particularly mutable trigger that is primed for intervention. Previous studies have shown that community health workers (CHWs) led home visits interventions, family education, and alleviating multiple environmental triggers are effective ways to enhance asthma-related health outcomes and physical and mental health.2,3
Identifying cost-effective interventions that can be used in this border region is particularly important as the burden of asthma is high there. Eighty-four percent of the population in the region is Hispanic. The median income is significantly lower in the region than in the state, with 1/3 of households making less than $25,000 annually.4 Hispanic and low-income families are more likely to be diagnosed with asthma; furthermore, systematic issues such as access to health insurance and providers also plague the area. Notably, asthma is a leading cause of hospitalizations for children who live along the Texas-Mexico border.5
To address this issue, the Texas A&M Health Science Center (TAMHSC) has partnered with community institutions in South Texas to improve the quality of life and health for those with asthma.6 In 2015, TAMHSC started the Asthma and Healthy Homes Program (AHHP) to provide asthma-related education to children and families, identify and ameliorate common household asthma triggers, and create an asthma action plan.
Economic evaluations, such as cost-effectiveness analyses, are valuable tools to justify policies and programs like the AHHP. Cost-effectiveness analyses for children with asthma and their families show varied results. Other published interventions (eg, school-based clinics, mobile health care, peer-led education, and hospital-based case management) described some cost-savings or cost-effectiveness when considering the program’s costs on medical savings, society costs, and other quality of life outcomes7–11 but those are not discussed here. Instead, we focus on the three most similar analyses to the AHHP intervention. Previous studies in Chicago,12 New York,13 and multiple locations across the United States14 combined education, home assessments with modifications, and case management or similar support for children with asthma to analyze their outcomes and cost-effectiveness. Results varied from no costs savings to saving hundreds and thousands of dollars.12–14 Across previous studies, programmatic differences abound in population, educator expertise, level of intervention, and time spent with family. Differences in data availability time and follow-up time drive how outcomes are measured. As a result, findings also vary greatly. Additional studies help generalize findings and further pinpoint what is effective in treating childhood asthma. This study adds to the literature by focusing on a CHW-led education and assessment intervention in a predominantly Hispanic community, components not discussed in previous research.
We conduct a cost-effectiveness analysis of the evidence-based AHHP performed in McAllen, Texas, between 2015 and 2020 to determine if the costs of implementing the program are worth the perceived benefits. This study uses two approaches: (1) compare the program’s costs with the presumed savings in healthcare use due to changes in asthma symptoms and (2) calculate cost-effectiveness ratios.
Materials and Methods
Study Setting
The AHHP serves Hispanic children and their families to address high asthma rates and increased hospitalizations in Hidalgo County, Texas, including urban and rural participants. Hidalgo County’s 2019 population is slightly less than 900,000, with more than 30% of the population under 18 years old.15 The research team recruited participants in elementary and middle schools in Hidalgo County. School nurses identified children between the ages of 4 and 18 and diagnosed with asthma by their physician. Later, they provided the research team with contact information for all eligible students. School nurses sent the consent form to parents with information about the study, and those who agreed signed it and returned it to them. A total of 349 children participated in this study from 2016 to 2019 after 45 participants withdrew. The Institutional Review Board of Texas A&M University reviewed and approved this study, the entity responsible for monitoring and approving all research involving human subjects to ensure their protection. All methods were performed following the relevant guidelines and regulations of Texas A&M University. The study complies with the Declaration of Helsinki.
Intervention
The program utilizes a curriculum accredited by the Texas Department of State Health Services, with two main components. First, the asthma section focuses on the signs and symptoms of asthma, management of the disease, identification of common triggers, the adequate use of asthma medications, actions to take in case of an asthma attack, and fundamental components of an asthma action plan. The healthy homes section then focuses on keeping a home dry, clean, ventilated, pest-free, safe, and contaminant-free to improve the indoor environment and decrease hazardous exposures within the home. CHWs are trained in the curriculum through a 4-hour workshop with case studies and pre-and post-tests. Parents with children diagnosed with asthma receive education in their homes delivered by CHWs, including a baseline visit and two additional visits at 3- and 6-months post-education. During these visits, CHWs provide in-depth information about asthma, other educational materials, an allergenic cover for the mattress and pillow, and a spacer. All households in the study were offered education on asthma and healthy homes. A few months later, a follow-up visit was conducted to collect data. During both visits, the team asked the guardian questions related to the health and medical care of the participating child (such as the number of times the child had wheezing, asthma attack, stayed overnight in the hospital, had to go to the ER, medicine use, etc.), school attendance, gym activities, child, and family activities. The average time between visits is 108 days, and all visits occurred between February 29, 2016, and September 2, 2019. The intervention occurred at the household level with one parent or guardian as the main survey taker.
Measures
Measured outcomes are extracted from the survey questionnaire conducted by the CHW during their home visit. The calculated cost estimates come from different sources and rely on several assumptions. The first three outcomes include the number of asthma attacks in hospital and ER visits. The number of asthma attacks is calculated per day based on answers to the following question: “how many times has your child had an asthma attack.” The number of hospital visits (stays) and ER visits are extracted from similar questions. The remaining five outcomes include the children and family’s physical/emotional health and activities. These measures are scale ratios out of 100 computed using the Children’s Health Survey for Asthma (CHSA). The closer the ratio to 100, the better the physical and mental health of children/family (and activities).
Outcome values guided cost estimates which are used to calculate the average cost per household pre- and post-intervention for the following categories: hospital stays, ER visits, travel time to ER, doctor visits, travel time to doctor, medication, missing school days, and missed workdays. In the household survey, the number of hospital stays, ER visits, doctor visits, days taking medication, missing school days, and missing work days reported by households are standardized across the first and second surveys to reflect the number of times per day. Travel time to an ER is converted from minutes to the percent of an hour. If the child regularly spends time in more than one household each week, the higher number of minutes between the two households is used. Data from the Texas Inpatient and Emergency Department Public Use Data Files (PUDF) are used to measure the average cost of an overnight hospital stay and ER visit. Only patients under 18 years of age with an admitting or principal diagnosis of asthma (ICD-10 codes starting with J45) in 2018 in Hidalgo County are used in the cost of a hospital stay and ER visit calculations. Data from the US Bureau of Labor Statistics (BLS) was used to calculate the cost incurred from a guardian missing a workday and a child missing a school day. In McAllen, Texas, the average per capita hourly wage for 2018 is $18.97 per hour, reflecting a $151.76 per eight-hour workday missed. To calculate the cost of missing school days, we assume that missing a school day is equivalent to having a guardian miss an eight-hour workday. From the BLS data, the average per capita hourly wage for 2018 in McAllen, Texas, also calculates the cost of traveling to the ER and doctor. The survey does not ask households the travel time to their doctor; we defined this cost of travel to their doctor as two times the cost of travel to an ER. The number of office-based physician charges and visits in 2018 of patients under 18 years of age from the Medical Expenditure Panel Survey (MEPS) is used to calculate the average cost of a doctor visit.
Cost-Effectiveness Analysis
This paper examines the costs related to the intervention in three distinct approaches. The first approach calculates the cost difference based on outcome changes from baseline to follow-up. We calculate the daily average pre-cost of utilization and compare it to the daily average post-cost. A simple t-test is performed to compare the means between daily average pre-cost and post-cost. In the second approach, we calculate cost-effectiveness ratios for eight different outcomes: the number of asthma attacks, hospital visits and ER visits, children’s physical health, activities of children, activities of the family, emotional health of children, and emotional health of the family. Typically, cost-effectiveness outcome calculations rely on quality-adjusted life years (QALY). In this case, the survey tool does not allow us to calculate QALYs, so the eight outcomes listed above were used to measure program effectiveness. In brief, cost-effectiveness ratios compare the difference in costs and outcomes of an intervention by calculating the incremental cost-effectiveness ratio (ICER). This can be conducted by using the following equation below:

Where Ci represents the costs of the program (the intervention), and C0 is the cost of the existing equilibrium (pre-program), which is assumed to be zero as there was no intervention. The implicit assumption here is that participating families had their routine and went about their daily activities, including actions that could lead to a flare-up in asthma episodes. E1 represents the outcome after the intervention and E0 is the outcome before the intervention or the default outcome from the households’ daily routine. Thus, the difference (E1-E0) measures the effectiveness of the intervention. ICER is best interpreted as the average cost associated with the number of households that reported a better outcome (ie, an increase in the physical health of children, activities of children/family, and emotional health of children/family and a decrease in the numbers of asthma attacks, hospital visits, and ER visits).
The third and final approach adds a cost-benefit analysis using the below formula to calculate the cost-benefit ratio:

For the present value of future benefits, we use the sum of the dollar saving amounts for each household from the intervention. This estimate comes directly from dollar amount changes in the number of asthma attacks, hospital visits, ER visits, and time estimates. However, the benefits do not estimate the present value of physical and emotional health improvements experienced by participants and their families. Hence the current value of future benefits will understate the actual benefits of the program. The sum of the present value of future cost is the per-household cost of the program.
Results
The data represents 349 households and is mostly complete, with the income question showing the lowest completion rate of 94.8% (331 households). Table 1 presents descriptive statistics, including both the baseline and follow-up values. The average age of the child is almost 9 years old; about 44% are female. The majority of the sample is Hispanic (more than 97%). The average age of children’s parents is less than 40 years for both father and mother. Almost 70% of the children are in married households. Survey takers are usually female (95%) and typically the child’s parent (also 95%). Slightly more than half of the sample (52%) earn less than $15,000 in annual income, which is the annual minimum wage in Texas. In sum, our sample is young, Hispanic, and relatively poor.
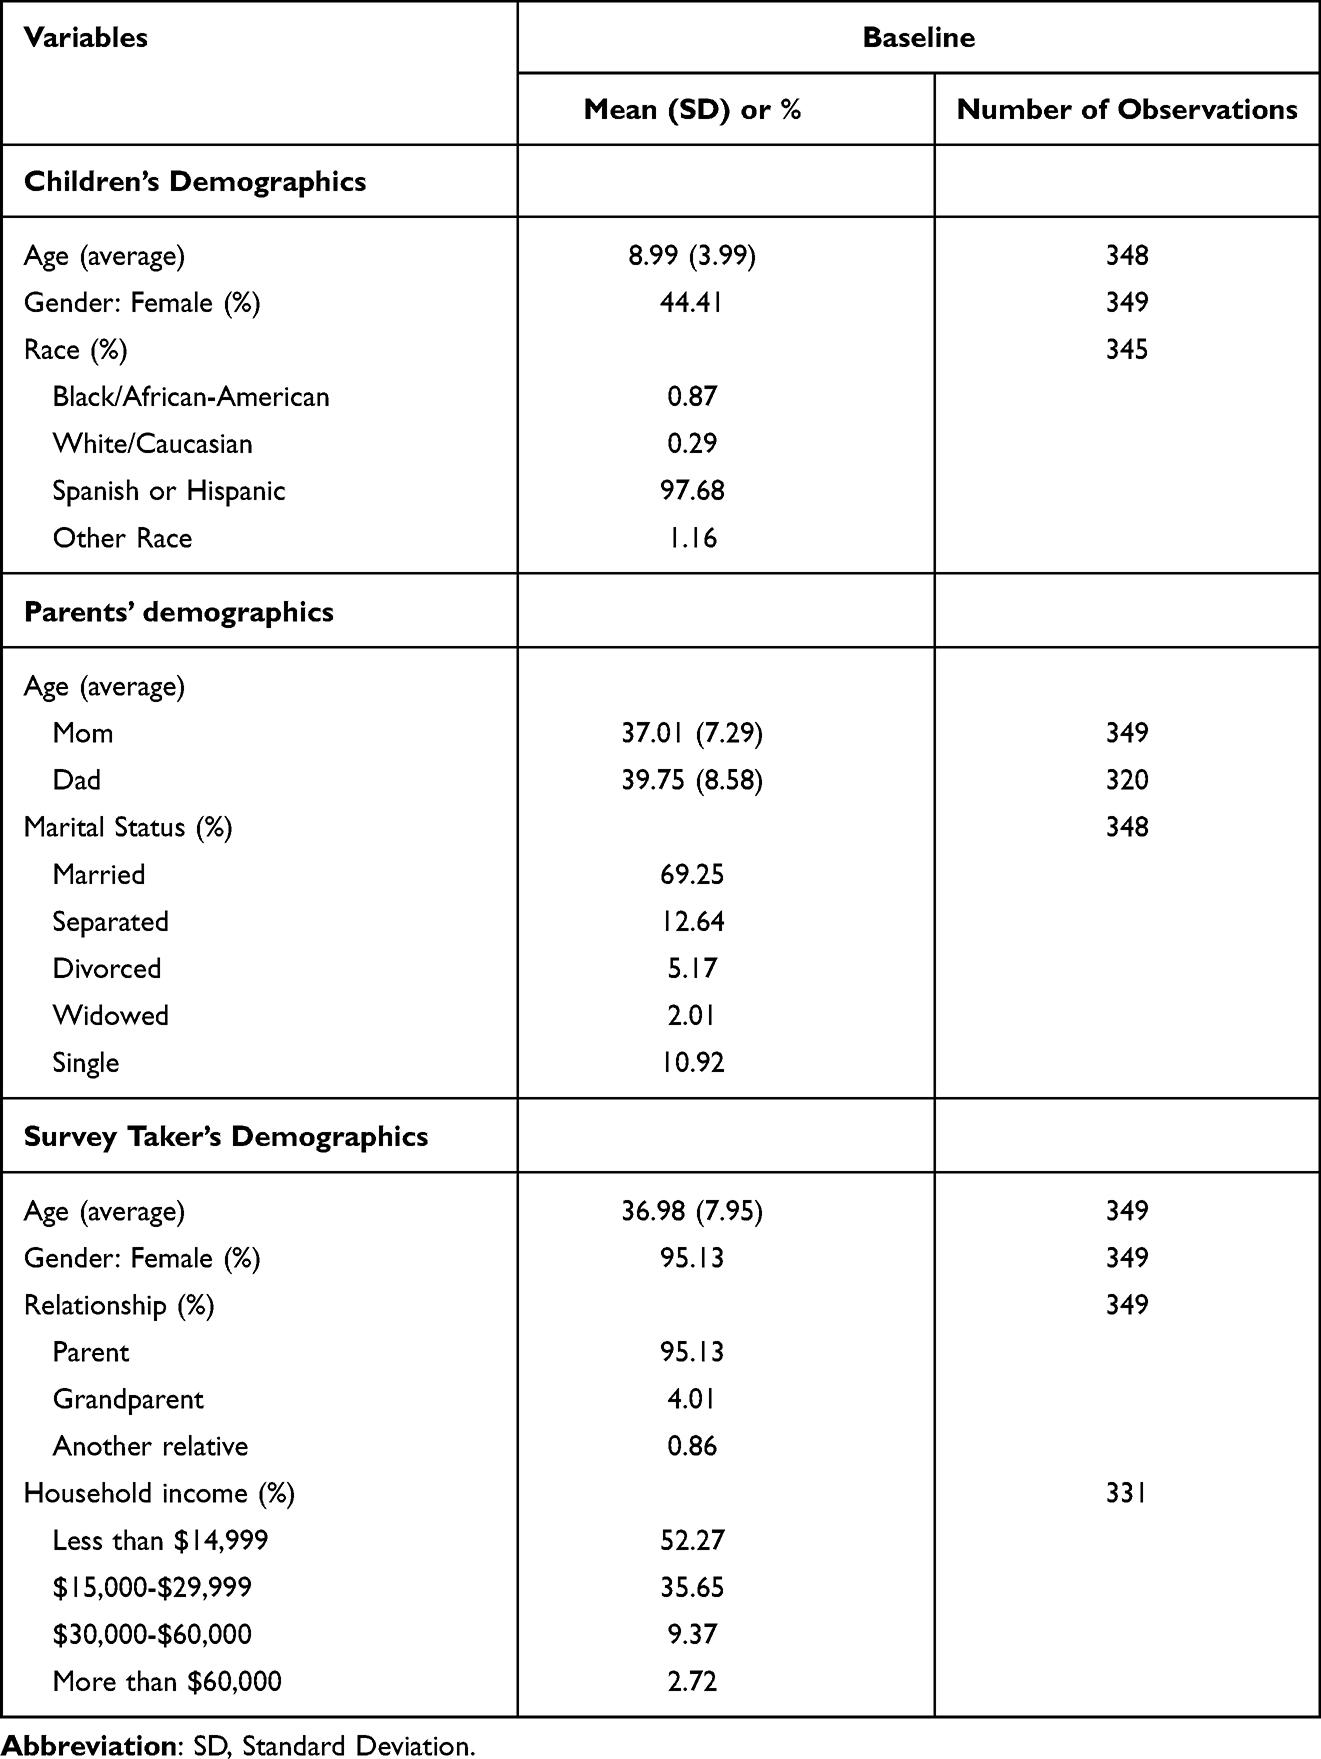 |
Table 1 Baseline Descriptive Statistics of Demographics for Children and Parents |
Table 2 summarizes the means at baseline and follow-up for eight outcome variables. The results show that the number of asthma attacks, hospital visits, and ER visits is rare in our sample, and the average values are between 0.001 and 0.032 at baseline. In the follow-up survey, those averages all decline, and the mean differences are statistically significant for the number of asthma attacks (p<0.001) and ER visits (p=0.016) but not for hospital visits.
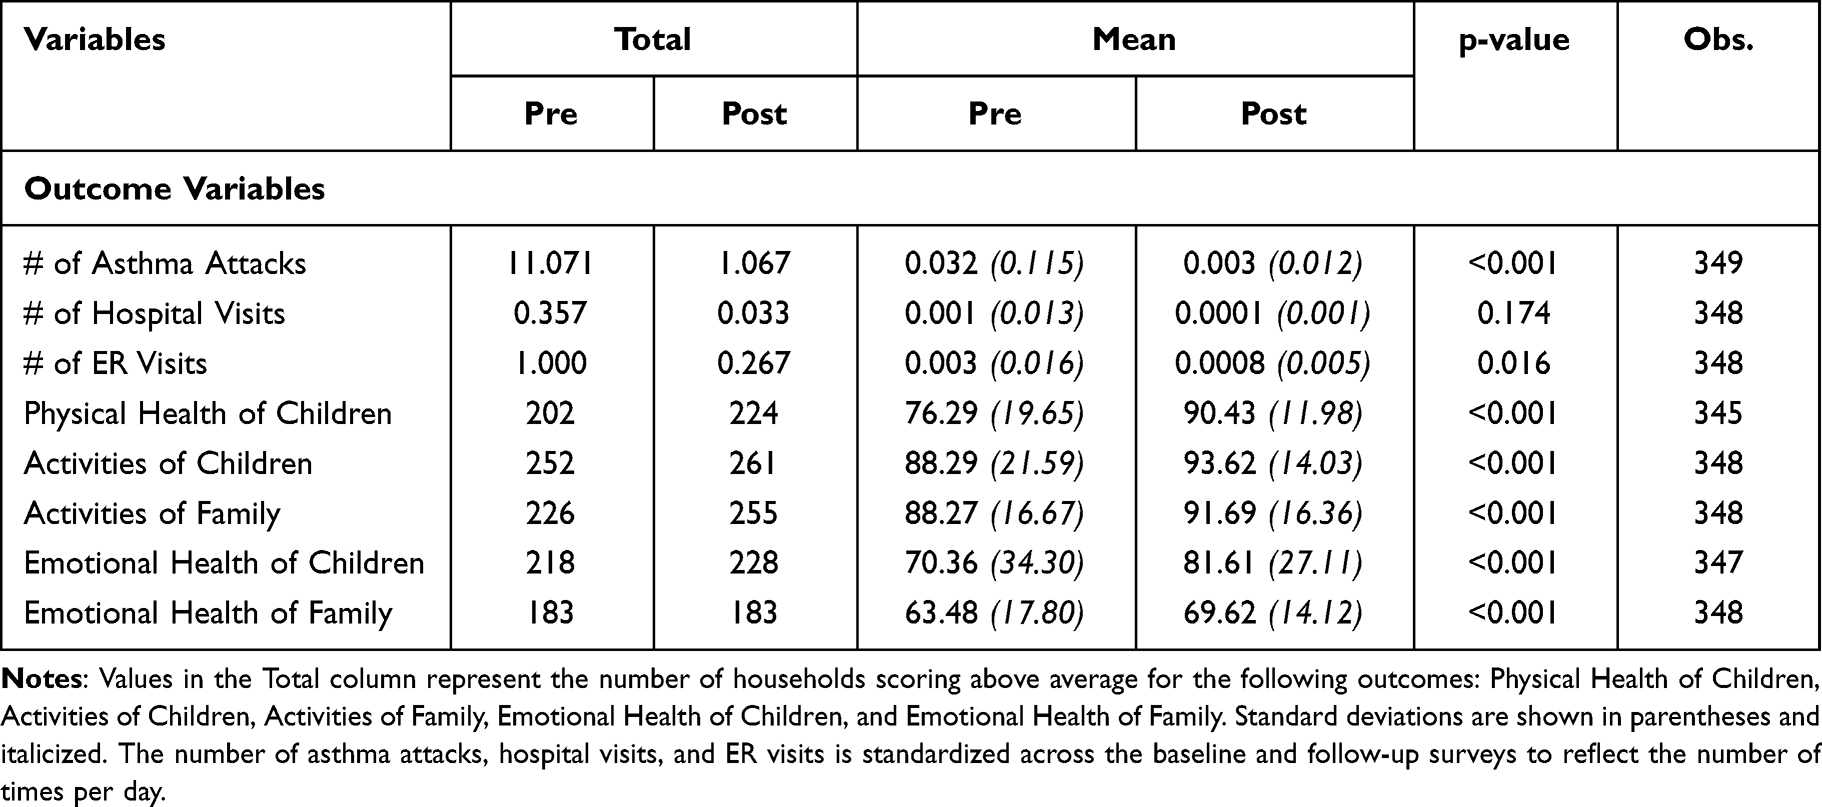 |
Table 2 Outcome Variables Between Baseline and Follow-Up |
We see significant improvements in some outcome variables. The mean score of children’s physical health is 76 out of 100 at baseline and significantly increases to 90 in the follow-up survey (p<0.001). The same finding is true for the emotional health of children (from 70 to 81) and families (from 63 to 69). The mean activities of the children/family scale also increased, but the increase is more modest, going from 88 (for children and family) at baseline to 93 (for children) and 91 (for family). All mean differences are statistically significant at the 1% level. Not surprisingly, the most significant improvement for the intervention occurred in the outcomes related to children. Remarkably, the intervention also improved the health and activities of the whole family.
Observations are assumed to be independent since survey responses are collected from different households for only one child per household. However, the normal distribution and homogeneous variance conditions are not met for classic parametric testing. A Welch’s t-test was performed and produced similar results to the basic t-test shown in Table 2. A Whitney-Mann-Wilcoxon (WMW) test was also run and showed the same significance levels for all outcome variables except the number of ER visits. Results of the WMW test are included in the supplemental materials (Supplemental Table 1).
The intervention costs are summarized in Table 3 below. The total program costs are $86,655.30, of which the majority ($74,359.00) goes to cover administrative expenses that mainly include CHWs’ salaries (accounting for about 85% of program costs). The remaining 15% covers materials costs, including printouts, notebooks, etc. The total program cost per household is slightly less than $250.
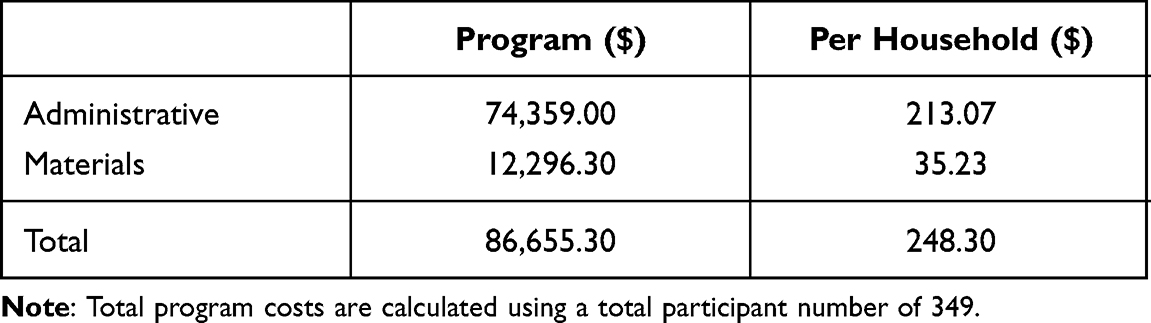 |
Table 3 Program Costs (in 2018 Dollars) |
Table 4 shows the results for the first approach of our study. The average cost per house per day before the intervention and post-intervention, along with cost difference and p-values, are shown by category.
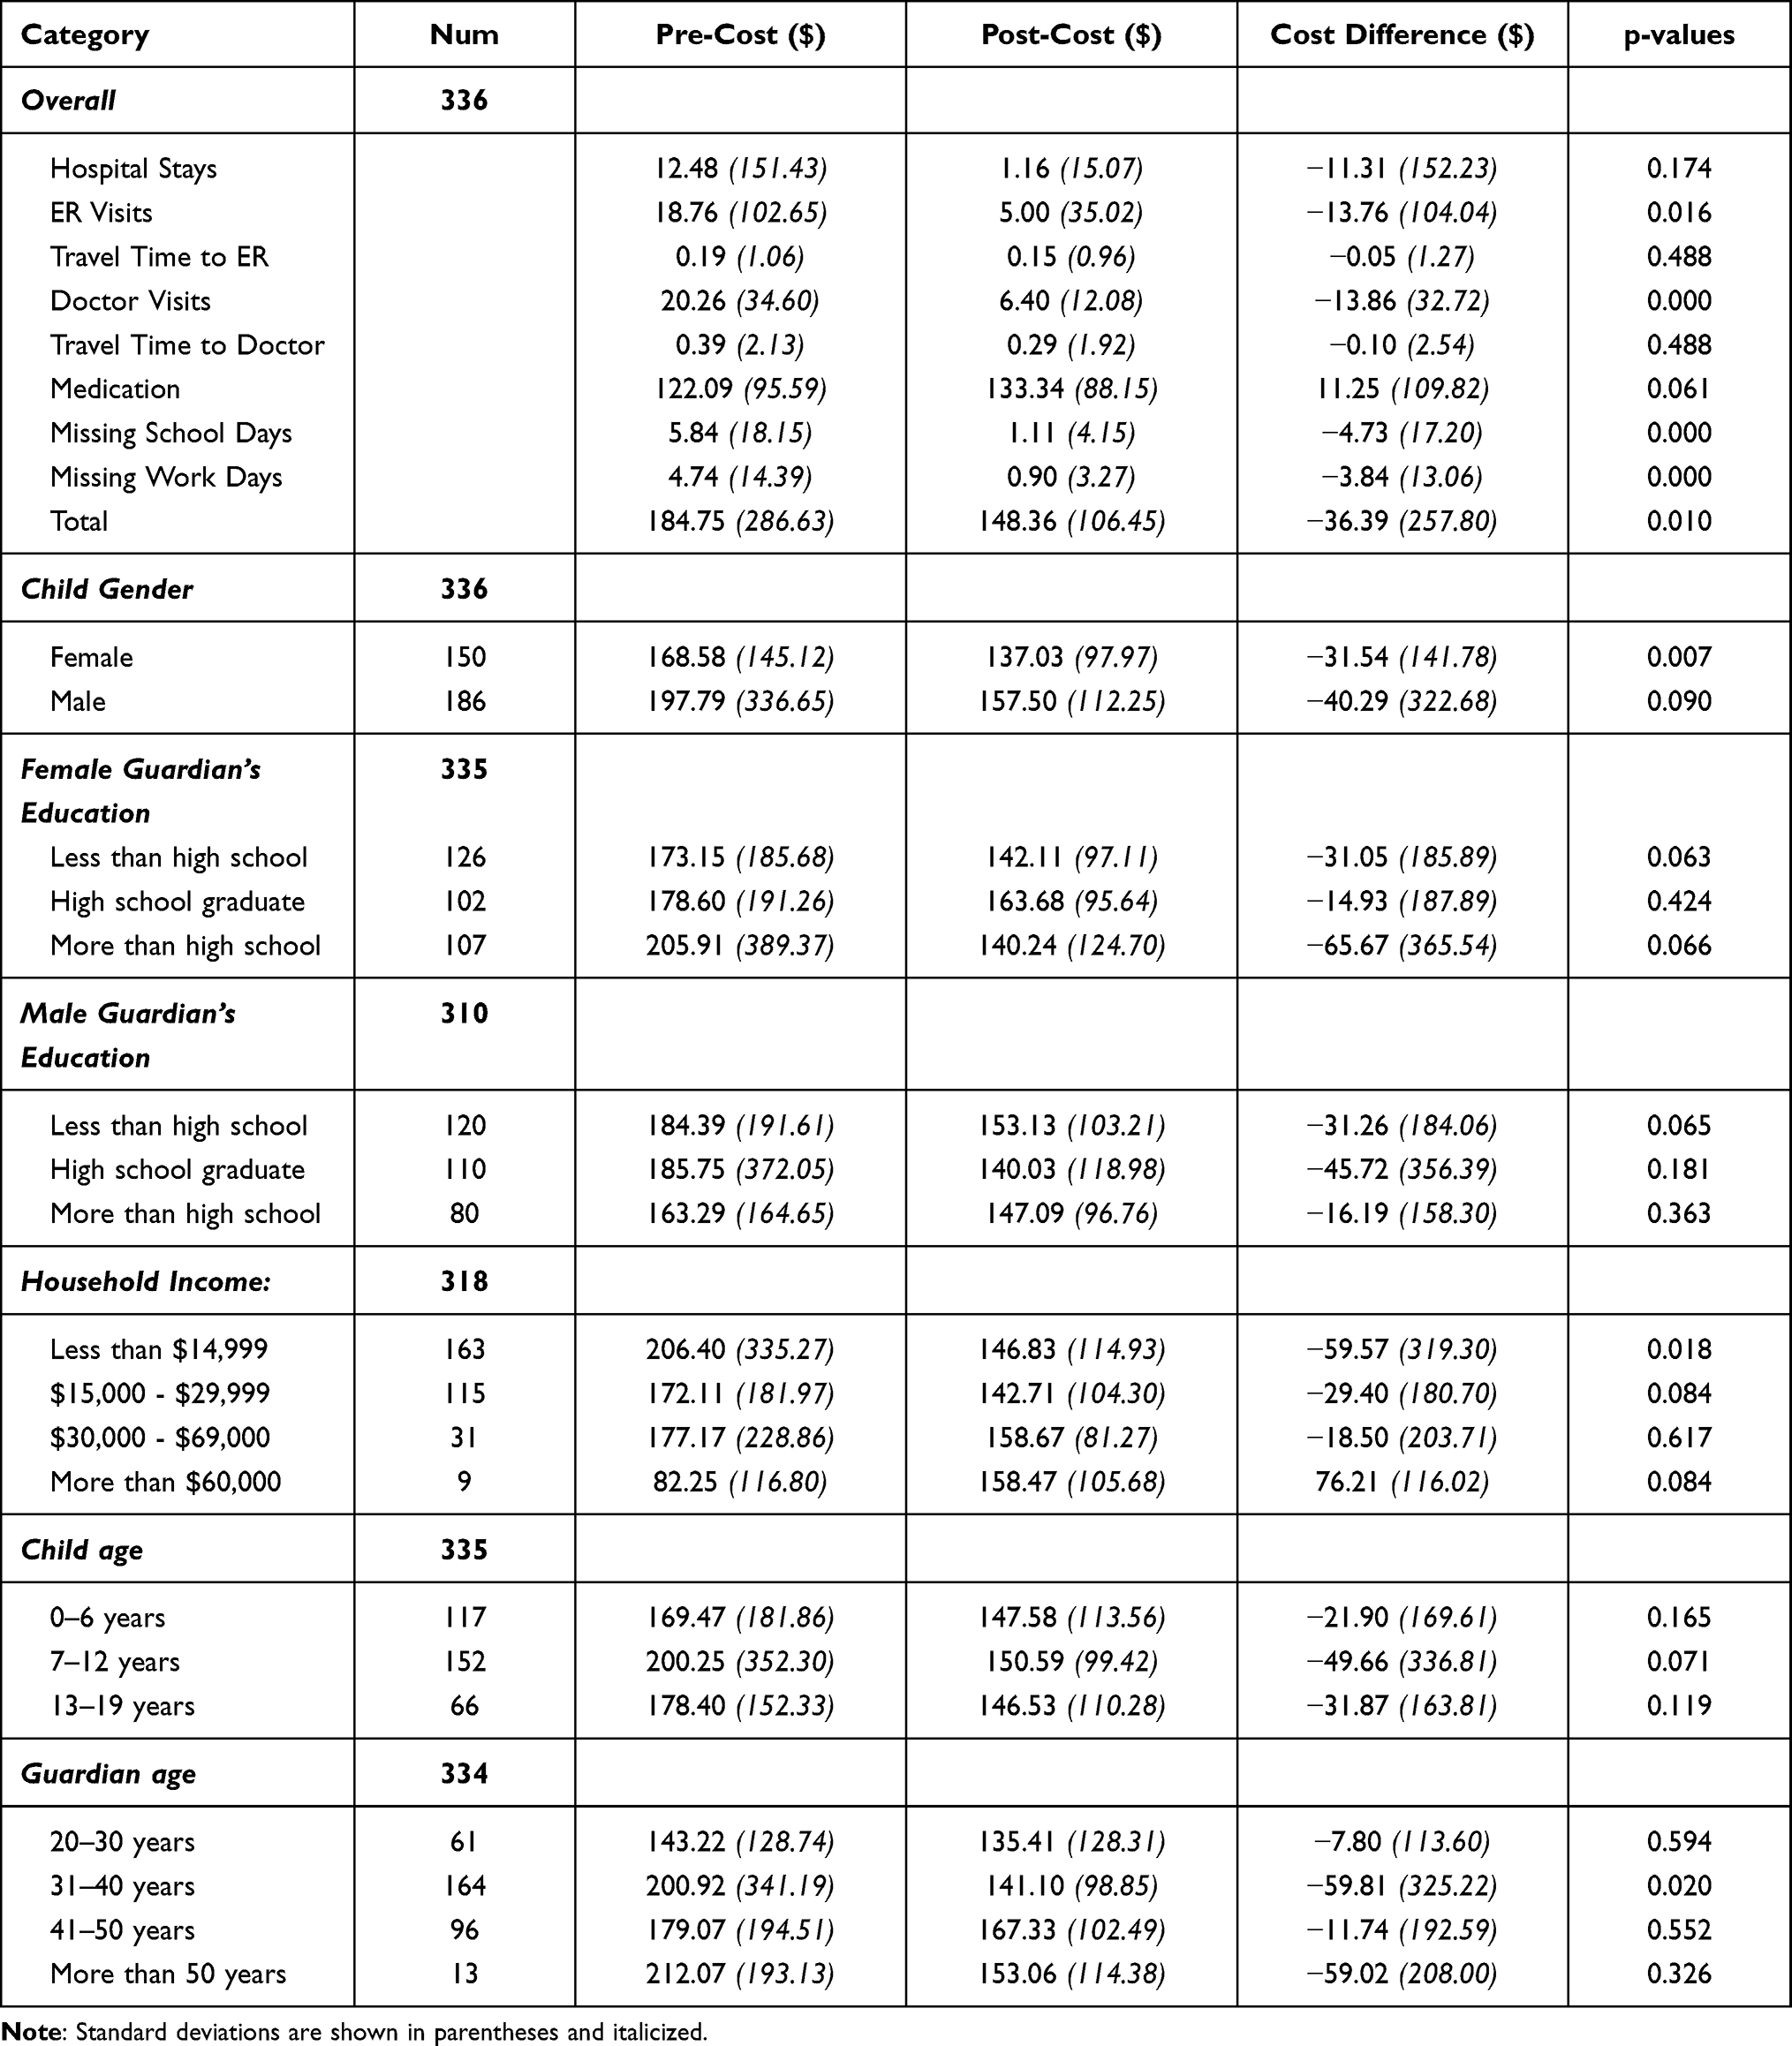 |
Table 4 Pre-Cost, Post-Cost, and Cost Differences by Category |
The difference between average pre-cost and post-cost per day is statistically significant at 1% for all except for hospital stays, travel time to ER/doctor, and medication. The hospital stays and travel time rarely occurs in our sample, so it is also not surprising that we do not capture statistically significant differences in the per-day cost averages. In total, the intervention has saved the household about $36 a day when we account for hospital stays, ER visits, travel time, medication, and missing work/school days due to asthma episodes. We also show the distribution of the cost-difference in pre- and post-analysis in the supplemental material (Supplemental Figure 1).
When examining the cost differences for specific subcategories (eg, gender, education, etc.), one needs to consider the smaller sample size when interpreting findings. Nevertheless, the results reveal that the intervention benefits boys more (about $9 difference) even though it is only statistically significant at 10%. The education effect is different by gender of the guardian, and households with an annual income of less than $15,000 seem to benefit the most from the intervention. The average cost per day does increase for households with the highest annual income bracket, but these findings need to be taken with caution due to the sample size of that group.
Table 5 summarizes the ICER ratios for each of the eight outcomes listed above to calculate cost-effectiveness ratios (the second approach). We find that 61 households reported a better outcome related to asthma attacks (ie, less asthma attacks) after the intervention. The cost-effectiveness ratio of $4.1 reveals that the average cost per asthma attack outcome improvement is about 4 dollars. Hence, Table 5 points out that the intervention’s most significant gain is centered around children’s physical health, with 265 households (76% of the total study sample) reporting a better outcome. The next most considerable improvement is noted in the family’s emotional health at 222. The cost-effectiveness ratios for the five physical/mental health and activities of children/family range between less than $1 ($0.9 for children’s physical health) and slightly more than $2 ($2.2 for children’s activities), suggesting a high return on investment. Hospital visits have the most negligible improvement at 3 households with a cost-effectiveness ratio of about 83 dollars. Hospital visits are rare in our sample, and they are also expensive.
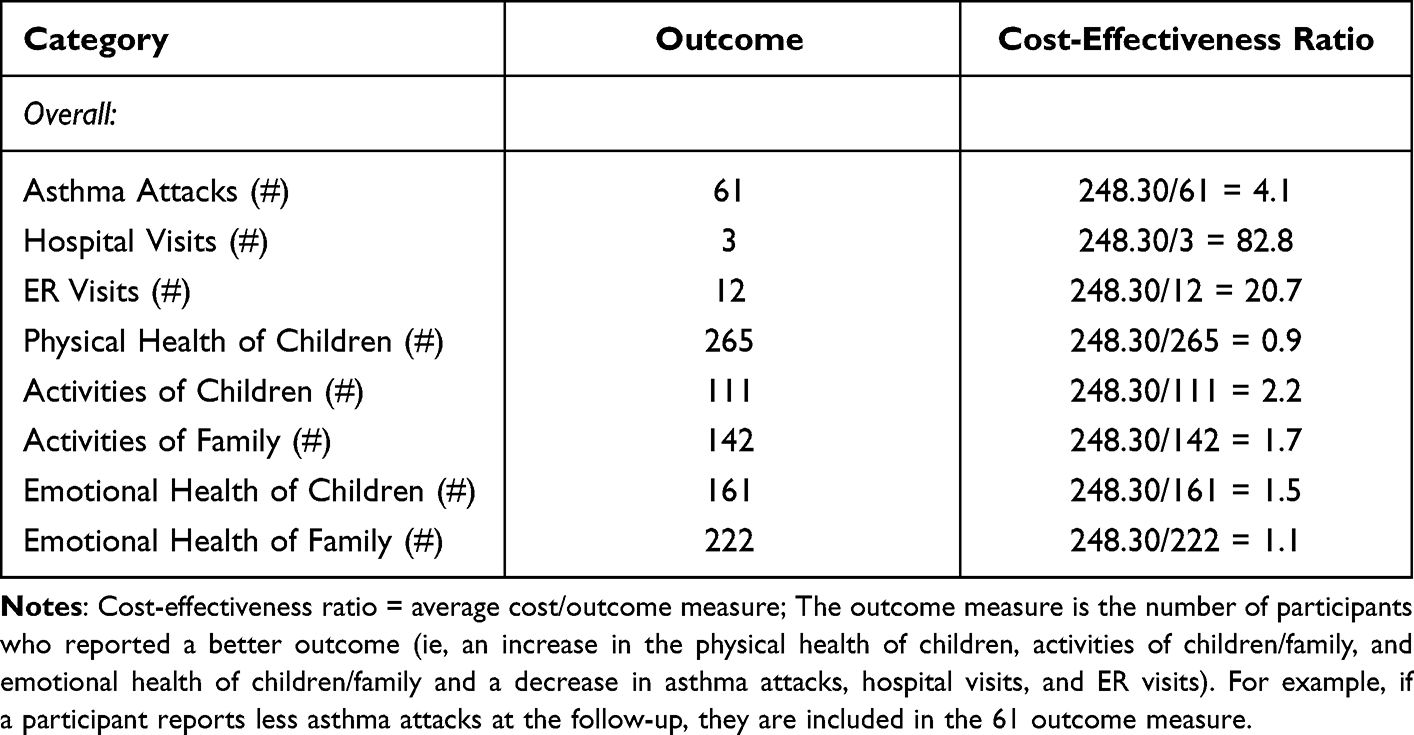 |
Table 5 Cost-Effectiveness Ratios Overall |
Supplemental Tables 2–7 (see Supplementary Material) calculate outcome improvements and cost-effectiveness ratios by different demographics: child’s gender and age, guardian’s age, gender, education level, and household-level income. The results show that improving males’ physical and emotional health is slightly more cost-effective ($0.5 difference) than females. However, gender does not impact the guardian’s level of education in terms of the cost-effectiveness ratio. It is most cost-effective to improve outcomes in households with less-educated guardians, and the intervention is most cost-effective for lower-income families. Further, children under 12 years old seem to benefit the most from the intervention, and finally, guardians aged between 31 and 40 show the most cost-effective ratios in the five outcomes. Those ratios are higher for guardians between 20 and 30 or above 40 years old.
The cost-benefit ratio is 0.15 and is shown in Table 6. The benefits are underestimated due to an inability to estimate the benefit value of the changes in physical and emotional health for the child and the family. Hence, the ratio mainly depends on the benefits from healthcare and ER use, which is also rarer while expensive. A majority of our sample had improvements in physical and mental health, but the impact of the benefit cannot be considered here.
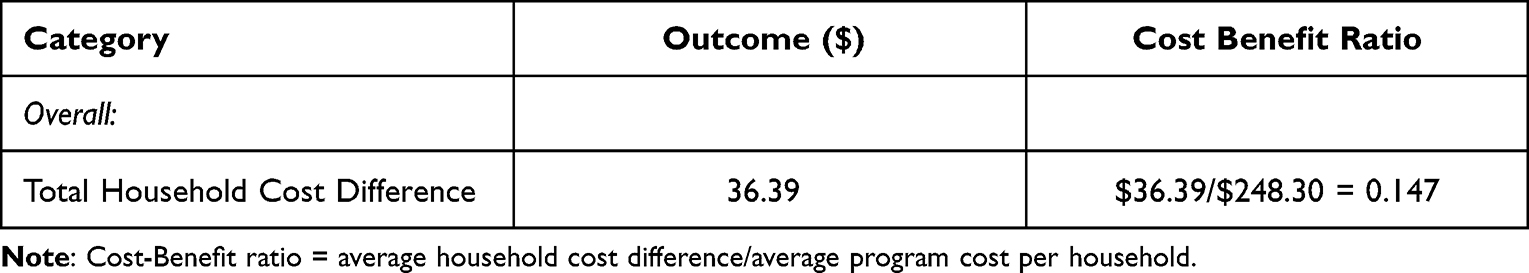 |
Table 6 Cost Benefit Ratio for Total Household Cost Difference Pre to Post |
Sensitivity analysis was conducted by varying assumptions on various costs, and the results are shown in supplemental materials (Supplemental Tables 8 and 9 and Supplemental Figure 2). Supplementary Table 8 presents the change in the cost-effectiveness ratios following a 20% change in the ages of the CHWs. Following a change in the wage of the CHWs, the outcome measure does not change, but instead, just the average cost per household varies between $271.5 (with a 20% increase in CHWs wages) and $225.1 (with a 20% decrease in CHWs wages). The percentage change in cost effectiveness ratios varies between an increase of 13% and a decrease of 10%. Supplemental Table 9 shows the same following a 20% change in the mileage traveled by CHWs to reach households. As expected, the impact is relatively small, and the cost-effectiveness ratios change by less than 5% in both directions. Finally, Supplemental Figure 2 presents a tornado graph reflecting the percentage change in the cost-benefit ratio following a 20% change in each cost category (missing workdays, missing school days, medication, travel time to doctor, doctor visits, travel time to ER, ER visits, and hospital stays). The supplemental figure suggests that Doctor visits affect the cost-benefit ratio the most, followed by ER visits, hospital stays, and medication. Missing school and workdays come next. Travel time to either the doctor or ER does not seem to affect the cost-benefit ratio.
Discussion
This study shows that an investment in an asthma program in a Hispanic community can significantly impact children and their families and generate cost savings for the household. The program costs just under $250 per household and reduces healthcare visits and improves health for children and their families.
Multiple studies agree on the benefits of combining home visits with education and environmental modifications. The question in recent years has been what factors of these programs are driving program costs and outcomes. Is it the number of home visits? The intensity of environmental modifications and education? Or the educational and experience level of the educator? And so forth.16,17 The question then becomes one of dosage - what level of support is needed, and what are the expected benefits at this level.
This study adds to that body of literature by offering another model for comparison, one that is tailored to the Hispanic community. The AHHP relies on two home visits from a CHW combined with minor home modifications and self-management and environmental education. With this model, we measure the cost of these outcomes in two different ways. The per-person program costs are on the lower end of the spectrum (even after adjusting for inflation) compared to other similarly aimed programs.16
When comparing the costs before and after the intervention, the average cost for all outcomes declined, except medication costs. Previous research has faced a similar contradiction.12 Karnick et al12 speculate that increased attention and education towards asthma generates increased medication adherence. Our results support this hypothesis. The differences in pre-and post-cost are also highest for the lowest-income households, indicating this intervention could potentially reduce health disparities by improving the outcomes in certain populations. Improving males’ physical and emotional health is slightly more cost-effective than females. Gender does not impact the guardian’s level of education in terms of the cost-effectiveness ratio. It is most cost-effective to improve outcomes in households with less-educated guardians. The intervention is also most cost-effective for lower-level income families. Children under 12 years old seem to benefit the most from the intervention.
In the second method, we look at the anticipated costs to improve each outcome of interest by comparing ICERs. The highest costs are in the rarest outcomes related to healthcare use. The average cost to see an improvement in ER visits is $21. Similarly, the average cost per hospital outcome improvement is $83. These numbers are small when compared to the actual costs of such healthcare visits.
Additionally, we consider the impact on the child and family’s activity level, physical health, and mental health. Here is where a large percentage of our sample improves. The ICERs range from $0.9 to $2.2. Unsurprisingly, the intervention had the most significant impact on the children themselves, but the impact on the family members should not be overlooked. Our findings indicate a small cost to improve important outcomes.
The cost-benefit approach found that the known benefits are limited. However, this is predominantly due to our inability to put a financial value on the physical and mental health improvements seen in the analysis. Few children had additional ER and healthcare visits during the follow-up period, and these outcomes are rare, yet the costs are known. A larger proportion of our children and households had improved physical and emotional health, where the value of the benefits is unknown. Our stated benefits, therefore, are underestimated. Further research needs to be done to determine the financial value of these benefits, offering additional justifications for this program and others like it.
This study expands the evidence and support for programs tailored to Hispanic communities. The AHHP presents a replicable model for other programs and policies aimed at improving asthma and considers its financial impact through a cost-effectiveness analysis. Our study offers comparison points for future research. Previous studies have considered symptom-free days, but ours utilizes broader outcome health measures focusing on child and family health. By understanding the costs related to the outcomes, future decision-makers and program planners are better equipped to design and implement programs.
One of the study’s main limitations is the lack of a control group. The program team identified group participants in elementary and middle schools in Hidalgo County, and every household received the intervention after an initial baseline home visit. Second, the surveys were self-reported, which might introduce measurement error and bias in the outcome measures. Third, the study collected data using the CHSA survey, which has been replaced since then due to the length and tiredness of participants when follow-up was performed, and the PedsQL is used in its place. The PedsQL is shorter and is also a validated instrument. A long and cumbersome survey tool can introduce further measurement errors. Fourth, the study was performed in a county close to the US-Mexico border, with a 98% Hispanic population, so our results may not generalize to other settings. Fifth, most participating children did not have medical insurance, so they waited for an asthma attack to occur to go to the closest ER. As such, we could not obtain their medical records to verify hospitalizations and ER visits. Lastly, the study relied on several assumptions to calculate cost measures. Ideally, survey data would be merged to actual hospital/doctor/ER visits, travel time, and school and work absence to accurately measure these events’ cost estimates.
Strengths in this study include adequate sample size quality of life outcome measures that showed improvement as established in our results—implementation in a population affected by asthma due to health and environmental disparities. Finally, the retention rate of the asthma education program is 90% of participants.
Conclusion
The asthma education program helped significantly low-income, minority Hispanic families in Hidalgo County, costing less than $250 per household, significantly improving the children’s physical and emotional health and their families. There was also an improvement in the activities of the whole family. The intervention saved the household approximately $36 a day, accounting for the hospital stay, ER visits, travel time, medication, and missing work/school due to asthma attacks. This intervention provides evidence-based education to children with asthma, including their families who live in disadvantaged minority communities. Such a program could reduce health disparities due to their improved knowledge, decreasing exposure to asthma triggers, enhancing their health outcomes, and improving the quality of life of the children with asthma and their whole family.
Acknowledgments
Thank you to Hyewon Ji, Monika Gonzalez Hermosillo Holtz, and Luis Ordonez for their research assistance.
Funding
This research is supported in part by the State of Texas's legislative action to establish and support the Healthy South Texas initiative. Funds were administred through Texas A&M University Health Science Center grant number 23-183000.
Disclosure
The authors report no conflicts of interest in this work.
References
1. Most Recent National Asthma Data. Centers for Disease Control and Prevention; 2021.
2. Karr C, Kieckhefer G. Community health workers and environmental interventions for children with asthma: a systematic review. J Asthma. 2009;46(6):564–576.
3. Baek J, Huang K, Conner L, Tapangan N, Xu X, Carrillo G. Effects of the home-based educational intervention on health outcomes among primarily Hispanic children with asthma: a quasi-experimental study. BMC Public Health. 2019;19(1):1–8.
4. Economy: the South Texas Region 2020 Regional Report. Comptroller.Texas.Gov.
5. Carrillo G, Perez-Patron MJ, Lucio RL, et al. The benefits and challenges of managing asthma in Hispanic families in South Texas: a mixed-methods study. Front Public Health. 2019;5:1–8. doi:10.3389/fpubh.2017.00150
6. Carrillo Zuniga G, Hernandez T, Kirk S, et al. Multi-institutional collaboration to develop asthma education for school settings in South Texas. Public Health Rep. 2011;126(1):139–144. doi:10.1177/003335491112600120
7. Bhaumik U, Norris K, Charron G, et al. A cost analysis for a community-based case management intervention program for pediatric asthma. J Asthma. 2013;50(3):310–317. doi:10.3109/02770903.2013.765447
8. Morphew T, Scott L, Li M, et al. Mobile health care operations and return on investment in predominantly underserved children with asthma: the Breathmobile Program. Popul Health Manag. 2013;16(4):261–270. doi:10.1089/pop.2012.0060
9. Nguyen KH, Boulay E, Peng J. Quality of life and cost-benefit analysis of a home environmental assessment program in Connecticut. J Asthma. 2011;48(2):147–155. doi:10.3109/02770903.2010.535881
10. Rhee H, Pesis-Katz I, Xing J. Cost benefits of a peer-led asthma self-management program for adolescents. J Asthma. 2012;49(6):606–613. doi:10.3109/02770903.2012.694540
11. Tai T, Bame SI. (2011). Cost-benefit analysis of a childhood asthma management through school-based clinic program. J Community Health. 2011;36(2):253–260. doi:10.1007/s10900-010-9305-y
12. Karnick P, Maregellos-Anast H, Seals G, Whitman S, Aljadeff G, Johnson D. The Pediatric Asthma Intervention: a comprehensive cost-effective approach to asthma management in a disadvantaged inner-city community. J Asthma. 2007;44(1):39–44. doi:10.1080/02770900601125391
13. Gomez M, Reddy AL, Dixon SL, Wilson J, Jacobs DE. A cost-benefit analysis of a state-funded health homes program for residents with asthma: findings from the New York state health neighborhoods program. J Public Health Manag Practice. 2017;23(2):229–238. doi:10.1097/PHH.0000000000000528
14. Kattan M, Stearns SC, Crain EF, et al. Cost-effectiveness of a home-based environmental intervention for inner-city children with asthma. J Allergy Clin Immunol. 2005;116(5):1058–1063. doi:10.1016/j.jaci.2005.07.032
15. Quick Facts: Hidalgo County, Texas. United States Census Bureau; 2021.
16. Nurmagambetov TA, Barnett SL, Jacob V, et al.; Task Force on Community Preventative Services. Economic value of home-based, multi-trigger, multicomponent interventions with an environmental focus for reducing asthma morbidity a community guide systematic review. Am J Prevent Med. 2011;41(2):S33–47. doi:10.1016/j.amepre.2011.05.011.
17. Crocker DD, Kinyota S, Dumitru GG, et al.; Task Force on Community Preventative Services. Effectiveness of Home-Based, Multi-Trigger, Multicomponent Interventions with an Environmental Focus for Reducing Asthma Morbidity. Am J Prevent Med. 2011;41(2):S5–S32. doi:10.1016/j.amepre.2011.05.012.
 © 2022 The Author(s). This work is published and licensed by Dove Medical Press Limited. The
full terms of this license are available at https://www.dovepress.com/terms
and incorporate the Creative Commons Attribution
- Non Commercial (unported, 3.0) License.
By accessing the work you hereby accept the Terms. Non-commercial uses of the work are permitted
without any further permission from Dove Medical Press Limited, provided the work is properly
attributed. For permission for commercial use of this work, please see paragraphs 4.2 and 5 of our Terms.
© 2022 The Author(s). This work is published and licensed by Dove Medical Press Limited. The
full terms of this license are available at https://www.dovepress.com/terms
and incorporate the Creative Commons Attribution
- Non Commercial (unported, 3.0) License.
By accessing the work you hereby accept the Terms. Non-commercial uses of the work are permitted
without any further permission from Dove Medical Press Limited, provided the work is properly
attributed. For permission for commercial use of this work, please see paragraphs 4.2 and 5 of our Terms.