Back to Journals » Diabetes, Metabolic Syndrome and Obesity » Volume 18
4′-Methoxyresveratrol Improves Hepatic Insulin Resistance Induced by a High-Fat-Diet via Anti-Oxidative-Stress Activity
Authors Zhang Z, Zhang X ![]() , Yang L
, Yang L ![]() , Nie Q
, Nie Q ![]() , Song G
, Song G
Received 28 April 2025
Accepted for publication 22 July 2025
Published 8 August 2025 Volume 2025:18 Pages 2739—2752
DOI https://doi.org/10.2147/DMSO.S535103
Checked for plagiarism Yes
Review by Single anonymous peer review
Peer reviewer comments 2
Editor who approved publication: Dr Halis Akturk
Zhimei Zhang,1 Xuemei Zhang,2 Liqun Yang,1 Qian Nie,3 Guangyao Song1
1Department of Endocrinology, Hebei General Hospital, Shijiazhuang, Hebei, 050000, People’s Republic of China; 2Section of Rheumatology and Immunology, Hebei General Hospital, Shijiazhuang, Hebei, 050000, People’s Republic of China; 3Physical Examination Center, Hebei General Hospital, Shijiazhuang, Hebei, 050000, People’s Republic of China
Correspondence: Guangyao Song, Hebei General Hospital, No. 348 West Heping Road, Xinhua Area, Shijiazhuang, Hebei, 050000, People’s Republic of China, Tel +86-13930119808, Email [email protected]
Background: Obesity and a high-fat diet (HFD) are key factors contributing to hepatic fat accumulation and type 2 diabetes mellitus (T2DM). Research indicates that oxidative stress induced by HFD mediates hepatic insulin resistance (HIR) through mechanisms such as promoting inflammation and lipid accumulation. Given that 4′-methoxyresveratrol (4-MR) exhibits remarkable anti-inflammatory and antioxidant activities, it is of great research significance to explore whether it can effectively counteract HFD-induced HIR by enhancing antioxidant stress.
Purpose: This study aimed to explore the effects of 4MR on liver oxidative damage and insulin sensitivity.
Methods: Mice were fed a HFD for 8 weeks, followed by an intraperitoneal glucose tolerance test to assess insulin resistance. The in-vivo experiments were divided into three groups, including the control group, the HFD group, and the HFD + 4MR group. After 6 weeks of 4MR treatment, blood and liver samples were analyzed for biochemical markers, lipid peroxidation, antioxidant capacity, and liver protein levels. Insulin-resistant HepG2 cells were treated with 4MR and evaluated for proliferation and toxicity.
Results: 4MR reduced fasting blood glucose and lipid levels, improved insulin sensitivity, and decreased liver malondialdehyde levels, while increasing catalase and antioxidant enzyme activities. In both mice and HepG2 cells, 4MR increased Sirt1, p-FOXO1, and CAT expression levels and decreased FOXO1 expression levels.
Conclusion: 4MR alleviated hepatic oxidative stress, enhanced insulin sensitivity, and reduced glucose levels.
Keywords: blood glucose, insulin resistanc, anti-oxidative stress, 4′-methoxyresveratrol, hepatic
Introduction
Industrialized countries are facing the problem of a remarkable increase in the incidence of type 2 diabetes mellitus (T2DM).1 Insulin resistance, which is the core pathological mechanism of T2DM, is influenced by multiple factors. Metabolic-associated fatty liver disease (MAFLD) is closely related to insulin resistance, and both are highly associated with obesity, especially visceral obesity.2 The core driving factors of obesity, a diet high in sugar and fat and insufficient physical activity, not only promote the expansion of adipose tissue but also cause the ectopic deposition of lipids in tissues such as the liver. As a key metabolic organ, the liver is highly sensitive to lipid accumulation.3 Abnormally accumulated lipid metabolites in hepatocytes can interfere with the insulin signaling pathway, which is a crucial mechanism for triggering HIR.4 Therefore, obesity driven by an unhealthy lifestyle and MAFLD form important pathological links connecting environmental factors, HIR, and T2DM.5 Although the exact mechanism of insulin resistance has not been fully clarified, oxidative stress has been identified as a key factor in its development.6–8 However, the causal relationship between them still needs to be determined.
Resveratrol is a polyphenol compound with various biological activities. 4′-Methoxyresveratrol (4MR) is a methylated derivative of resveratrol. It is similar to resveratrol and has anti-inflammatory, anti-oxidative-stress, cardiovascular-protective, and neuroprotective effects.9 Resveratrol derivatives include natural and synthetic compounds. Among the different resveratrol derivatives, the most studied are combstatin A4, pterostilbene, resveratrol glycoside, and paleidol.10 However, there are relatively few research reports on 4MR. Existing studies have shown that 4MR can inhibit the inflammatory response,11 but research on its antioxidant effect is not yet sufficient.
Oxidative stress occurs because of an imbalance between pro-oxidant and antioxidant factors. The condition is linked to a plethora of ailments,12 including insulin sensitivity impairment and excessive weight gain. Compounds with antioxidant properties, including antioxidant enzymes such as superoxide dismutase (SOD), glutathione peroxidase (GPX), and catalase (CAT), along with substances such as glutathione (GSH), serve as the primary lines of defense against oxidative damage.13 This study aims to evaluate the ability of 4MR to alleviate oxidative stress in a mouse model of insulin resistance induced by a HFD and a HepG2 insulin-resistant cell model induced by palmitic acid (PA), so as to explore the molecular mechanisms underlying its potential as a strategy for diabetes management.
Materials and Methods
Animals
Fifty male C57BL/6J mice, 36-week-old and weighing 22.0–25.0g, were purchased from Beijing Vital River Laboratory Animal Technology Co., Ltd. (Production License: SCXK (Jing) 2021-0006). The mice were randomly divided into 3 groups, with 6 mice in each group. The mice were accommodated within an animal containment system at the Clinical Research Center, Hebei General Hospital. The ambient temperature was maintained at 23–25°C, the relative humidity was approximately 60% and a 12-hour light/dark cycle was maintained. The animal experiments were approved by the Animal Ethics Board of Hebei General Hospital and the procedures adhered to the International Standards for Laboratory Animal Care (Protocol Number: 201915).
Animal Nutrition
The typical diet (D12450J) contained 20% protein, 70% carbohydrates, and 10% lipids, amounting to 3.85 kcal/g. In contrast, the HFD (D12492) comprised 20% protein, 20% carbohydrates, and 60% lipids, delivering 5.24 kcal/g. The dietary supplies were sourced from Beijing Huafukang Biotechnology Corporation (Beijing, China).
Creation of an Animal Model
After one week of dietary adaptation, a total of 20 C57BL/6J mice were randomly divided into two groups: a control group consisting of 10 mice and a HFD group also consisting of 10 mice. The weight of the mice and their food consumption were documented weekly. After 8 weeks of dietary intervention, the mice underwent a 12-hour fasting period prior to undergoing an intraperitoneal glucose tolerance test (IPGTT). Blood was drawn from the caudal vein at intervals of 0, 15, 30, 60, and 120 minutes post-fasting, and the glucose concentration was determined using an Accu-Chek Active meter (Roche, Basel, Switzerland).
4MR Treatment
To verify the therapeutic effect of 4MR, the mice were divided into the following three groups: Control, HFD, and HFD + 4MR, with 10 mice in each group. 4MR (Sigma, St Louis, MO, USA) was mixed with dimethyl sulfoxide (DMSO, Sigma) to a concentration of 30 mg/mL. This mixture was further diluted using 0.9% saline. A dosage of 50 mg/kg per day was used in our initial experiment, and this resulted in an improvement in insulin responsiveness. The HFD + 4MR group received a daily dose of 50 mg/kg 4MR via oral gavage, while the HFD and control cohorts were administered 0.1% DMSO in 0.9% saline through the same administration method for 6 weeks.
Blood and Organ Collection
After completing a 6-week course of 4MR treatment, the mice were fasted for 12 hours. They were then anesthetized via an intraperitoneal injection of 2% pentobarbital sodium (150 mg/kg), their eyes were removed, and venous blood was collected using conventional blood-collection vials. Liver tissue was immediately dissected and washed with physiological saline, and a specific portion (consistently taken from the identical lobule) was fixed in 4% paraformaldehyde. The remaining liver specimens were transferred into a cryovial, rapidly frozen in liquid nitrogen, and stored at −80°C. Blood samples were centrifuged at 5000 × g for 15 minutes, and the extracted serum was then preserved at −80°C.
Assessment of Hematological Parameters
Total cholesterol (TC), triglyceride (TG), high-density lipoprotein cholesterol (HDL-C), and low-density lipoprotein cholesterol (LDL-C) levels were determined using assay kits from the Nanjing Jiancheng Bioengineering Institute (Nanjing, China). Serum insulin concentrations were measured with a highly sensitive mouse enzyme-linked immunoassay kit (80-INSMSU-E01; ALPCO Diagnostics, Rockingham, NH, USA).
Determination of Lipid Oxidation and Antioxidant Activities in the Liver
Malondialdehyde (MDA) levels and SOD, GPX, and CAT activity in liver tissue were evaluated using specific assay kits supplied by the Nanjing Jiancheng Bioengineering Institute.
Hematoxylin-Eosin Staining Procedure
Liver tissue specimens were fixed in 4% paraformaldehyde within 24 hours of collection. They were then dehydrated through a standard ethanol gradient, cleared with xylene, embedded in paraffin wax, and cut into sequential 5-µm-thick sections. These sections were dewaxed and then immersed in hematoxylin for 5 minutes. Post-differentiation was performed in 70% hydrochloric acid in ethanol for 10 seconds, after which the sections were washed with distilled water. After eosin application, the sections were progressively dehydrated using ethanol and ultimately sealed with a synthetic resin. The stained sections were examined under a microscope and digital images were captured.
Oil Red O Staining
Tissue samples were frozen and subsequently cut into sections. The frozen sections were warmed to remove moisture and then fixed for 15 minutes in a suitable fixative solution. They were then washed with tap water, dried, and submerged in an Oil Red O staining solution for 8–10 minutes, shielded from light. A mild differentiation process was performed using 75% ethanol, followed by a rinse in distilled water. Hematoxylin staining was applied, and the sections were mounted onto slides. Finally, the stained tissue sections were examined microscopically, and images were captured.
Creation of an ex vivo Model of Insulin Resistance
HepG2 cells, which originated from a human hepatocellular carcinoma, were sourced from the Chinese National Cell Repository governed by the Clinical Medical Research Center of Hebei Provincial Hospital (Shijiazhuang, China). The cells were maintained in Eagle’s minimum essential medium (Hyclone, Logan, UT, USA), supplemented with 10% fetal bovine serum (Hyclone), 1% essential amino acids (Gibco, Long Island, NY, USA), and 1% streptomycin (Hyclone). The cells were cultured at 37°C in an environment with carbon dioxide. Upon reaching approximately 80% confluence, the cells were exposed to either serum-free standard medium (serving as the control) or medium with 0.25 mM PA, as previously described.14 The concentration of glucose within the medium was assessed at 0, 12, and 24 hours using the glucose oxidase analytical method.
Quantitative Reverse Transcription-Polymerase Chain Reaction
Total RNA was extracted using RNAsimple reagent (Tiangen Biotechnology, Beijing, China) and the RNA concentration was determined using a NanoDrop 2000 instrument (Fisher Scientific, Hamilton, NH, USA). The PrimeScript™ RT reagent set complemented with gDNA Eraser was used for reverse transcription. The synthesized cDNA was stored at −20°C. SYBR® Premix Ex Taq™ II (RR820A) was used for quantitative polymerase chain reaction (qPCR) with an Applied Biosystems 7500 thermal cycler. A dual-phase amplification regimen was performed with initial denaturation at 95°C for 30 seconds, followed by 40 cycles of denaturation at 95°C for 5 seconds and annealing/extension at 60°C for 31 seconds. Melting curve analysis was then conducted at temperatures from 60 to 95°C. For quantification, the expression levels of the gene of interest were standardized against β-actin mRNA levels using the 2–ΔΔCT technique15 (Table S1).
Western Blotting
Equivalent amounts of protein were separated by sodium dodecyl sulfate-polyacrylamide gel electrophoresis before being transferred onto polyvinylidene difluoride membranes (Merck Millipore, Burlington, MA, USA). The membranes were blocked with 5% non-fat milk for 120 minutes and then incubated with one of the following primary antibodies, diluted with blocking solution, at 4°C for an extended period: mouse anti-β-actin (1:1000; Servicebio, Wuhan, China), rabbit anti-Sirt1 (1:2000; Proteintech, Rosemont, IL, USA), rabbit anti-FOXO1 (1:1000; Proteintech), rabbit anti-phosphorylated FOXO (1:1000, Abcam, Cambridge, UK), rabbit anti-Mn-SOD (1:1000, from Servicebio), and rabbit anti-CAT (1:1000, Servicebio) antibodies. The membranes were then washed and incubated with a horseradish-peroxidase-conjugated goat anti-rabbit IgG secondary antibody (1:8000, Proteintech), for 50 minutes at ambient temperature. After washing three times, each for 10 minutes, the distinct protein bands were visualized using a gel documentation system. Protein concentrations were measured using densitometric analysis with ImageJ software (v1.5.2a; the National Institutes of Health, Bethesda, MD, USA). Normalization was achieved by incubation with an anti-β-actin antibody on the same membrane.
Statistical Analysis
The collected data were processed utilizing SPSS 26.0 software (IBM, Armonk, NY, USA), and the findings are presented as the mean ± standard deviation. The independent-samples Student’s t-test was applied for comparisons of normally distributed data between two groups. One-way analysis of variance was conducted, with Bonferroni correction or Tamhane’s test for pairwise comparisons, depending on the homogeneity or heterogeneity of variances, for the analysis of multiple groups. In cases where these conditions were not met, non-parametric tests were utilized. A P-value < 0.05 was deemed to indicate statistical significance. All experiments were conducted independently six times or more.
Results
Establishment of a Mouse Model of Insulin Resistance Induced by an HFD
The schematic diagram of the experimental procedures for mice in the control group and the HFD group is presented in Figure 1A. Following 8 weeks of HFD treatment, starting from the second week, mice exhibited a marked increase in body weight when compared with control mice (Figure 1B). No significant difference was observed in the mean daily caloric consumption between the two groups (Figure 1C). An IPGTT conducted after 8 weeks showed that the HFD-fed mice demonstrated significantly elevated blood glucose concentrations at the 0, 30, 60, and 120 minutes compared to those in the control mice (Figure 1D). Additionally, mice fed an HFD had a significantly larger area under the glucose concentration curve (Figure 1E), suggesting the successful induction of an insulin resistance model.
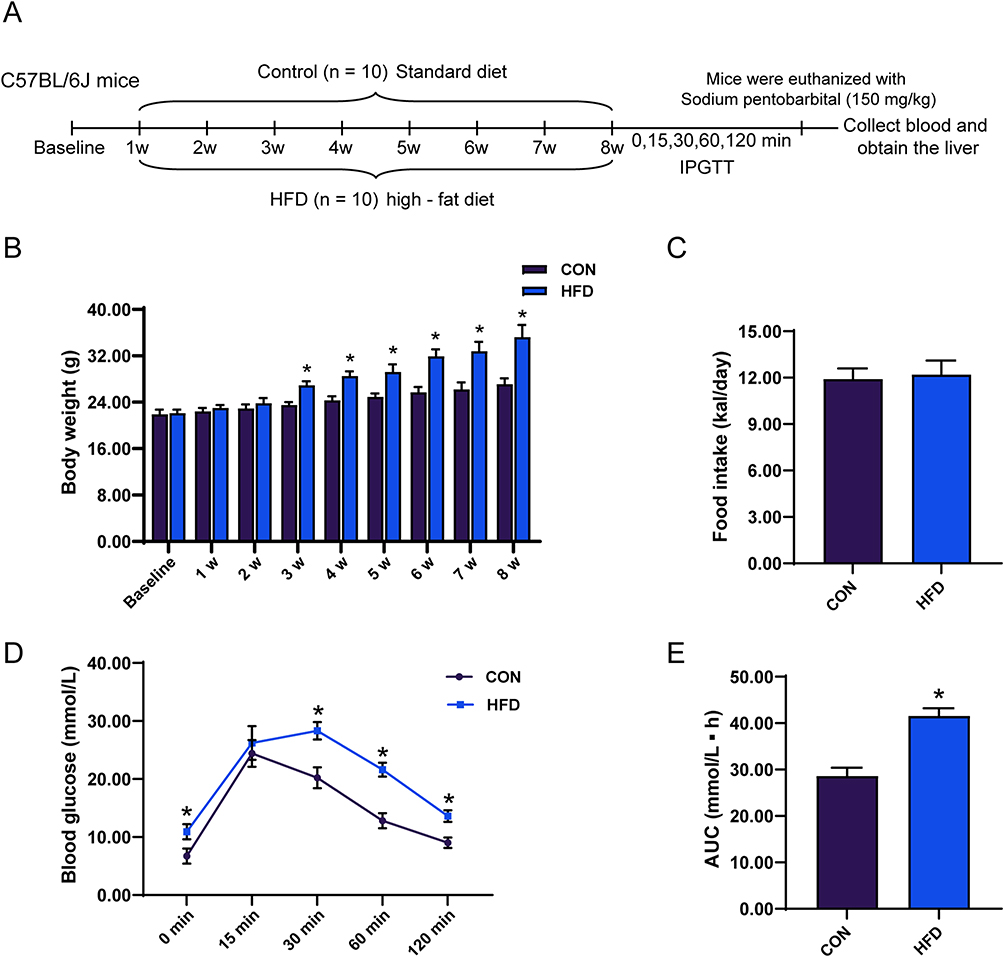 |
Figure 1 Analysis of C57BL/6J mice following an 8-week high-fat diet regimen, including body weight, food consumption, and outcomes of the IPGTT. (A) Experimental flow chart for the Control and HFD groups. (B) Distinct fluctuations in body mass (n = 10), (C) dietary consumption trends (n = 10), (D) plasma glucose levels measured at the specified times of 0, 15, 30, 60, and 120 minutes post-ingestion of glucose (n = 10), and (E) the cumulative area under the glucose response curve (n = 10). The reported findings represent the average values ± standard error of the mean (SEM). An analytical assessment was carried out using the Student’s t-test. *Indicates a P value below 0.05 when contrasted with the control cohort. Abbreviation: IPGTT, intraperitoneal glucose tolerance test. |
Effects of 4MR Administration on General Physiological Parameters
The flowchart for establishing the model of 4MR-treated HFD mice is shown in Figure 2A. Mice in the HFD group exhibited a marked increase in body weight when compared with those in the control group, and following 6 weeks of treatment, there was a notable reduction in the body weight of mice in the HFD + 4MR group (Figure 2B). No differences were observed in the daily consumption of food among the groups (Figure 2C).
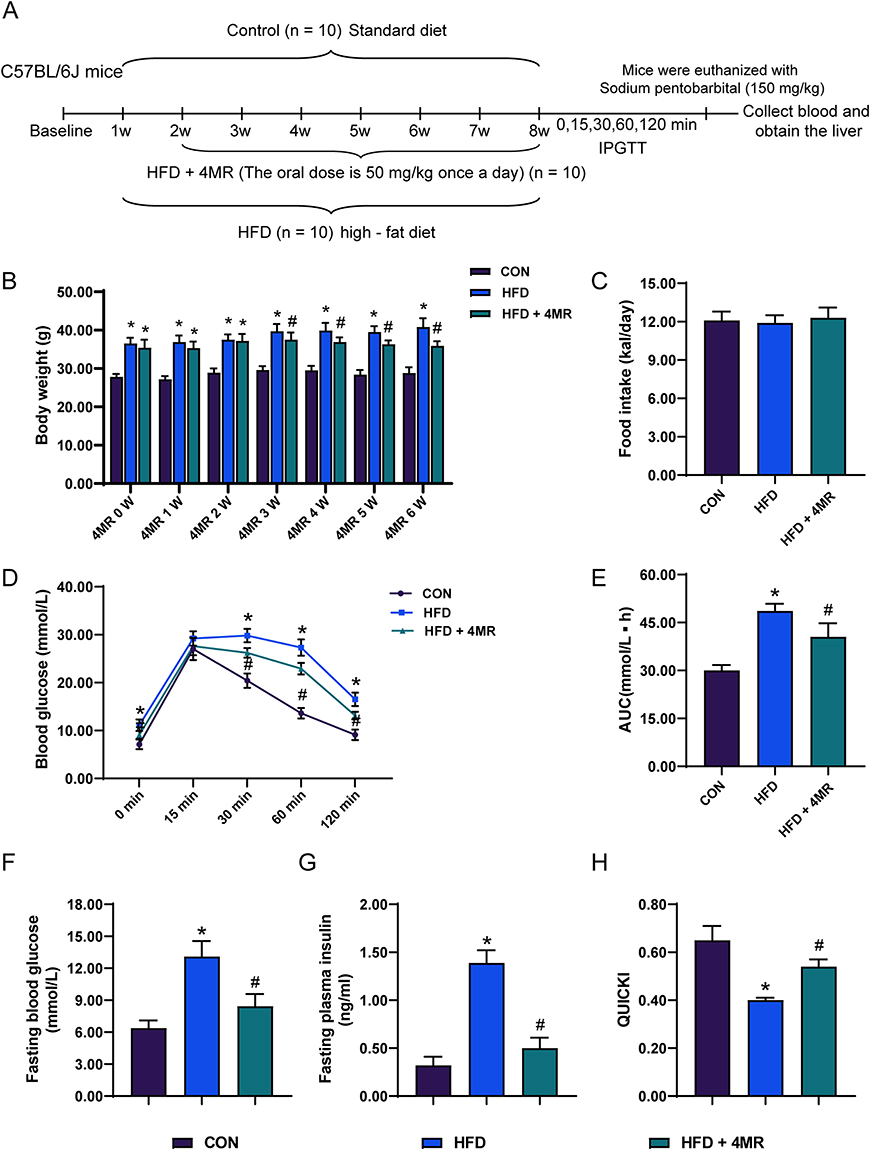 |
Figure 2 Body weight and food intake of C57BL/6J mice after 4MR treatment for 6 weeks. (A) Flowchart of Modeling HFD Mice Treated with 4MR. (B) Analysis of body mass across the control, high-fat dietary, and metformin-administered cohorts (n = 10). (C) Examination of dietary consumption among the trio of groups post 6-week 4′-methoxyresveratrol (4MR) treatment (n = 10). (D) Plasma glucose concentrations at 0, 15, 30, 60, and 120 minutes following abdominal glucose administration for the control (CON), high-fat diet (HFD), and HFD plus 4MR cohorts (n = 10). (E) Calculation of the glucose concentration curve area for the respective groups (n = 10). (F) Assessment of preprandial glucose levels in each of the three cohorts (n = 10). (G) Evaluation of fasting serum insulin concentrations within the three study groups (n = 10). (H) Examination of the quantitative insulin sensitivity assessment index (QUICKI) amongst various cohorts (n = 10). The findings are presented as mean values with the standard deviation in parentheses. Statistical analyses were conducted via single-factor analysis of variance (ANOVA), followed by Bonferroni or Tamhane post-hoc procedures for examining the differences among groups. A star (*) indicates a P-value less than 0.05 when contrasted with the Control cohort, and a pound symbol (#) indicates a P-value below 0.05 when compared to the High-Fat Diet (HFD) cohort. Abbreviations: HDL-C, high-density lipoprotein cholesterol; LDL-C, low-density lipoprotein cholesterol; TC, total cholesterol content; TG, triglyceride levels; FBG, fasting blood sugar levels; QUICKI, a quantitative assessment of insulin sensitivity. |
An IPGTT was conducted on mice in all groups after 6 weeks. The HFD group showed substantially elevated blood glucose concentrations at 0, 30, 60, and 120 minutes compared to those of the control group. However, after 4MR intervention, there was a considerable decrease in blood glucose concentrations at these same time points (Figure 2D). The area under the glucose curve was significantly increased in the HFD group relative to the control group; however, it reduced considerably in the HFD + 4MR group (Figure 2E). Compared with the control group, the HFD group demonstrated a pronounced increase in both fasting glucose and insulin concentrations, accompanied by a considerable decrease in the QUICKI index value. Following the administration of 4MR for 6 weeks, there was a notable decrease in these fasting biomarkers (High-Density Lipoprotein Cholesterol, Low-Density Lipoprotein Cholesterol, Total Cholesterol, Triglycerides) and a concurrent increase in the QUICKI index value (Figure 2F–H and Table S2). This suggested that 4MR intervention significantly improved insulin sensitivity in mice with insulin resistance.
Compared with mice in the control group, those in the HFD group exhibited a notable increase in serum TC, TG, and LDL-C concentrations. However, those in the HFD + 4MR group experienced a considerable decrease in TC and TG concentrations, coupled with a pronounced increase in HDL-C concentrations, as depicted in Figure 3A–D and detailed in Table S2.
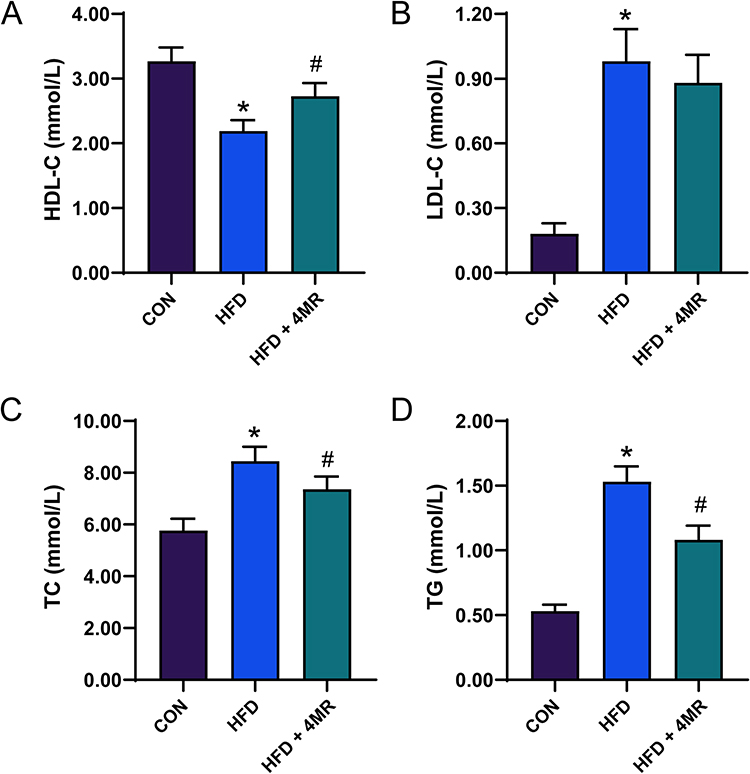 |
Figure 3 Blood lipid levels after 4MR intervention. (A) Levels of high-density lipoprotein cholesterol (n = 10), (B) Levels of low-density lipoprotein cholesterol (n = 10), (C) Total cholesterol levels (n = 10). (D) Concentrations of plasma triglycerides (n = 10). The presented data represent the mean values ± standard error. Statistical analyses were conducted via a single-factor analysis of variance (ANOVA) followed by Bonferroni or Tamhane post-hoc pairwise tests. A star (*) signifies P < 0.05 when contrasted with the control cohort, whereas a pound symbol (#) points to P < 0.05 in comparison to the cohort on a high-fat diet. |
4MR Treatment Reduced Fat Deposition
In the control group, the liver tissue structure was clear and complete, there were few lipid droplets, and no obvious steatosis was observed. However, in the HFD group, the liver structure was disordered, lipid droplets appeared as vacuoles within the cytoplasm of liver cells, and lipid droplets in the cell nuclei had squeezing edges. Fatty degeneration in liver tissue cells and lipid droplet vacuoles were significantly reduced in the HFD + 4MR group compared to the HFD group (Figure 4A).
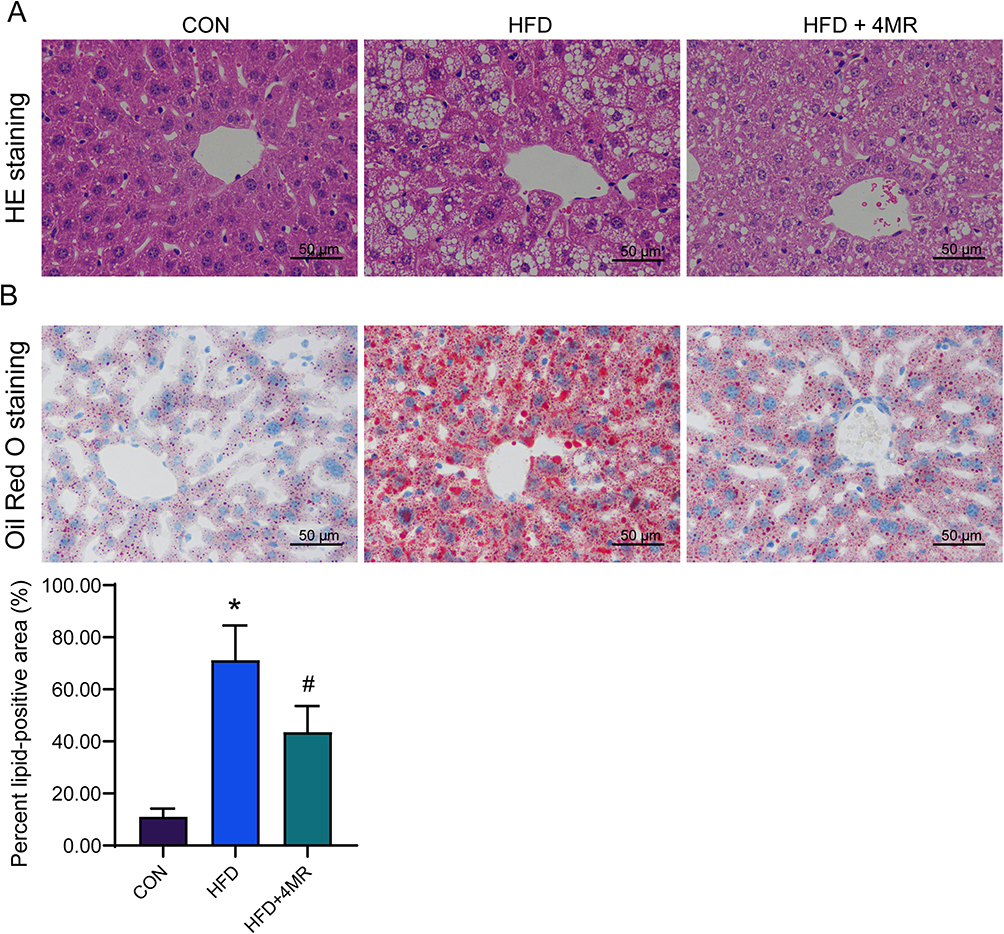 |
Figure 4 Hepatic lipid deposition after 4MR treatment. (A) Hematoxylin and eosin staining of liver tissue after 4MR intervention (n = 10, ×400, Scale bar: 50 μm). (B) Oil red O staining of liver tissue after 4MR intervention (n = 10, ×400, Scale bar: 50 μm). A star (*) signifies P < 0.05 when contrasted with the control cohort, whereas a pound symbol (#) points to P < 0.05 in comparison to the cohort on a high-fat diet. |
Cell nuclei in the control group appeared as a blue hue, accompanied by minimal presence of orange-red lipid droplets. In contrast, the HFD group exhibited a proliferation of orange-red lipid droplets. The HFD + 4MR group, however, demonstrated a notable reduction in the number of lipid droplets, with their quantity lying intermediate between those of the control and HFD groups (Figure 4B).
Hepatic Antioxidant System Parameters After 4MR Treatment
The concentration of MDA in the liver was elevated in the HFD group compared to the control group. Following the administration of 4MR for 4 weeks, a notable reduction in MDA concentration was observed in the HFD + 4MR group, when compared to the HFD group. The HFD group exhibited a significant decrease in SOD activity relative to the control cohort (P < 0.05), whereas SOD activity was significantly higher in the HFD + 4MR group than the HFD group (P < 0.05). A significant decrease in GPX activity was noted in the HFD group compared to the control group (P < 0.05), but 4MR treatment restored GPX activity (P < 0.05, vs the HFD group). CAT activity increased in the HFD group relative to the control group, but decreased in the HFD + 4MR group relative to the HFD group (Figure 5A–D).
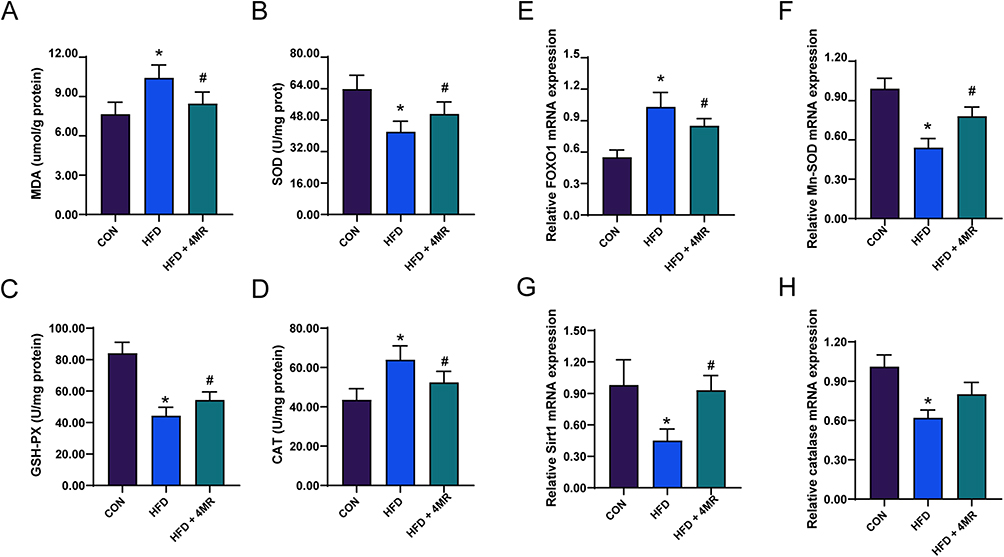 |
Figure 5 The influence of 4MR on parameters of the liver antioxidant system and antioxidant defense mechanisms. (A) Concentration of Malondialdehyde (MDA) (n = 10), (B) Functionality of Superoxide Dismutase (SOD) (n = 10), (C) Efficiency of Glutathione Peroxidase (GSH-PX) (n = 10), and (D) Activity level of Catalase (CAT). These metrics were assessed in hepatocellular extracts post-experimental conclusion (n = 10). (E) FOXO1 (n = 10), (F) manganese Superoxide Dismutase (n = 10), (G) Sirt1 (n = 10), and (H) catalase transcript quantities (n = 10). The presented figures denote the average ± standard deviation. Statistical evaluations were conducted using one-way ANOVA, supplemented by Bonferroni’s or Tamhane’s post-hoc comparison tests. *Indicates P < 0.05 when contrasted with the CON cohort, while #denotes P < 0.05 in comparison to the HFD cohort. |
Investigation of Expression Levels of Proteins and mRNAs Pertinent to Oxidative Stress Resistance in Mice
Reverse transcription-qPCR findings indicated a decrease in the mRNA expression levels of Mn-sod, Sirt1, and Cat within the HFD group relative to the control group. Conversely, the Foxo1 mRNA concentration showed an increase in the HFD group. In the HFD + 4MR group, there was a notable increase in the mRNA expression levels of Mn-sod, Sirt1, and Cat, whereas the Foxo1 mRNA expression levels decreased (Figure 5E–H). As for protein concentrations, there was a marked reduction in SIRT1, phosphorylated FOXO1 (p-FOXO1), Mn-SOD, and CAT levels in the HFD group compared with the control group, while FOXO1 protein levels showed a significant increase. In the HFD + 4MR group, FOXO1 protein levels decreased, whereas Sirt1, p-FOXO1, Mn-SOD, and CAT levels showed a significant increase, when compared to those in the HFD group (Figure 6A–F).
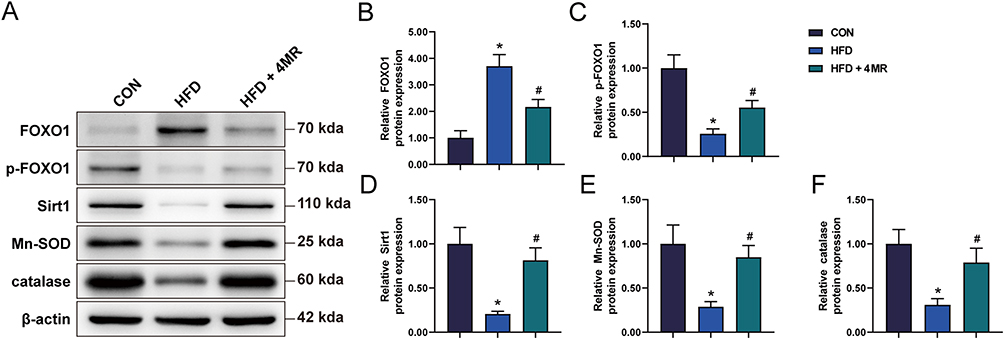 |
Figure 6 Analysis of protein markers associated with the antioxidant defense mechanism. (A) FOXO1 expression (n = 10), (B) phosphorylated FOXO1 levels (n = 10), (C) Sirt1 protein concentration (n = 10), (D) another representation of Sirt1 protein (n = 10), and (E) catalase protein concentrations (n = 10). The depicted data are the mean values accompanied by their standard deviations. Statistical evaluations were carried out using a single-factor ANOVA, succeeded by Bonferroni’s or Tamhane’s post-hoc analyses to assess multiple comparisons. A star (*) denotes a P-value less than 0.05 when compared to the CON cohort, whereas a pound sign (#) signifies a P-value below 0.05 in comparison with the HFD cohort. |
Development of a Cellular Model
A model of insulin resistance was created using HepG2 cells. The glucose concentration in the growth medium was assessed at intervals of 0, 8, 16, and 24 hours. During the initial 8 hours, there was no significant difference in glucose concentration between the control and PA-treated groups. However, by 16 and 24 hours, the PA-treated group exhibited a marked increase in glucose concentration compared to the control group, signifying the successful creation of an insulin-resistant cellular model (Figure 7A). Subsequently, HepG2 cells were subjected to varying dosages of 4MR treatment (5–40 μmol/L).16 As the concentration of 4MR increased, cell viability decreased. 4MR concentrations of 20 and 40 μmol/L significantly affected cell viability (Figure 7B). To observe the effect of 4MR on PA-treated cells, 5 and 10 μmol/L 4MR dosages were selected for further functional analysis.
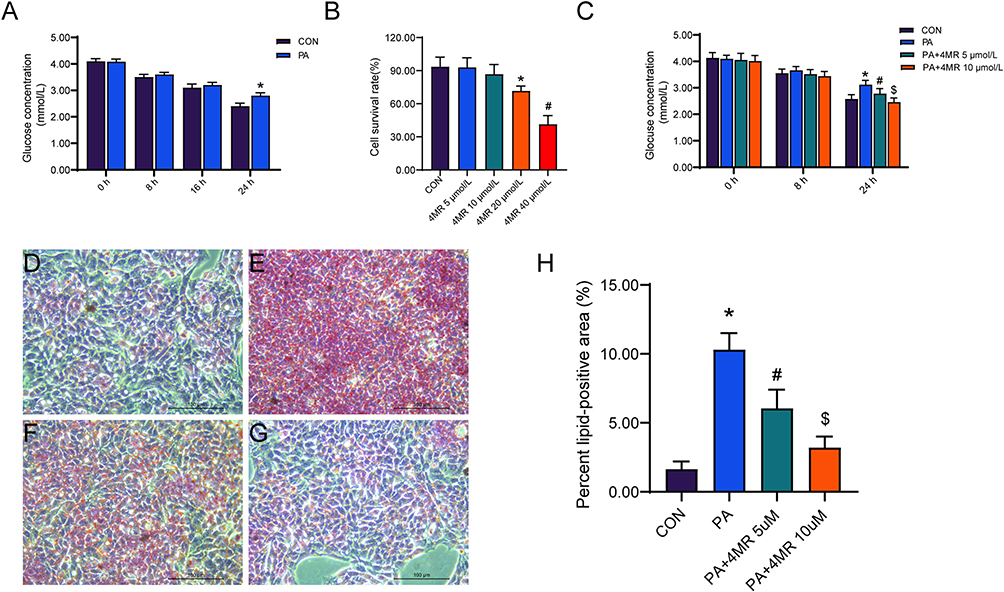 |
Figure 7 4MR alleviated PA-induced insulin resistance and lipid accumulation in the HepG2 cell line. (A) Glucose concentrations in the culture medium after the introduction of palmitic acid (PA) at 0, 8, 16, and 24-hour intervals are represented. The presented figures denote the mean values along with their standard deviation. Statistical evaluation was conducted using the application of the t-distribution test for students. A star (*) signifies a P-value that falls short of 0.05 in comparison to the control group without treatment (n = 6). (B) The effect on cellular viability following a 24-hour exposure to varied dosages of 4MR is presented (n = 6). A star (*) highlights a P-value lower than 0.05 in relation to the untreated control, whereas a pound sign (#) indicates a P-value beneath 0.05 when contrasted with the cohort exposed to 20 μmol/L of 4MR. (C) The levels of glucose in the culture medium following treatment with PA alone or in combination with 5 μmol/L or 10 μmol/L of 4MR at 0, 8, and 24 hours are displayed (n = 6). Following a 24-hour PA incubation, Oil Red O dye was utilized to visualize lipid droplets. (D) Control group imagery (400×, Scale bar: 100 μm), (E) PA-exposed group (400×, Scale bar: 100 μm), (F) PA in conjunction with 5μmol/L 4MR (400×, Scale bar: 100 μm), and (G) PA combined with 10 μmol/L 4MR (400×, Scale bar: 100 μm). (H) Statistical analysis of the percentage of Oil Red O lipid-positive cells (n = 6). An asterisk (*) highlights a P-value below 0.05 when contrasted with the control group, a pound symbol (#) points out a P-value less than 0.05 in distinction from the PA-only cohort, while a dollar symbol ($) marks a P-value beneath 0.05 indicating a discrepancy from the PA + 5 μm 4MR group. The presented figures represent the mean ± standard error, with statistical evaluations conducted via one-way ANOVA, followed by Bonferroni’s or Tamhane’s post-hoc analyses for pairwise comparisons. |
4MR Inhibited Lipopolysaccharide-Induced Oxidative Stress and Fat Accumulation in HepG2 Cells
Following the application of PA and either 5 or 10 μmol 4MR, the glucose levels across all four experimental groups exhibited negligible variation at both 0 and 8 hours. However, a notable increase in glucose concentration was observed in the PA-only group after 24 hours, when compared to the baseline concentration in the control group. Meanwhile, 24 hours after treatment with 5 or 10 μmol 4MR, the glucose concentration decreased significantly. Moreover, 10 μmol 4MR treatment resulted in a significantly greater decrease in glucose concentration than 5 μmol 4MR treatment (Figure 7C). The cytoplasm of control HepG2 cells exhibited a faint blue hue, with minimal presence of orange-red lipid droplets. In contrast, the PA-treated cells displayed an abundance of orange-red lipid droplets, indicating significant lipid accumulation and confirming the establishment of an insulin-resistant model. Following 4MR administration for 4 days, there was a notable reduction in the number of orange-red lipid droplets (Figure 7D–H). Western blotting analysis revealed a marked increase in FOXO1 expression levels in the PA group, in comparison to the control group, whereas p-FOXO1, SIRT1, Mn-SOD, and CAT levels showed a substantial decrease. Treatment with 10 μmol 4MR led to a decrease in FOXO1 expression levels and a concurrent increase in p-FOXO1, SIRT1, Mn-SOD, and CAT levels. Similarly, 5 μmol 4MR treatment decreased FOXO1 expression levels and increased the levels of p-FOXO1, SIRT1, Mn-SOD, and CAT. However, 10 μmol 4MR treatment induced a more pronounced decrease in FOXO1 expression levels when compared with the PA and 5 μmol 4MR treatments (Figure 8A–F).
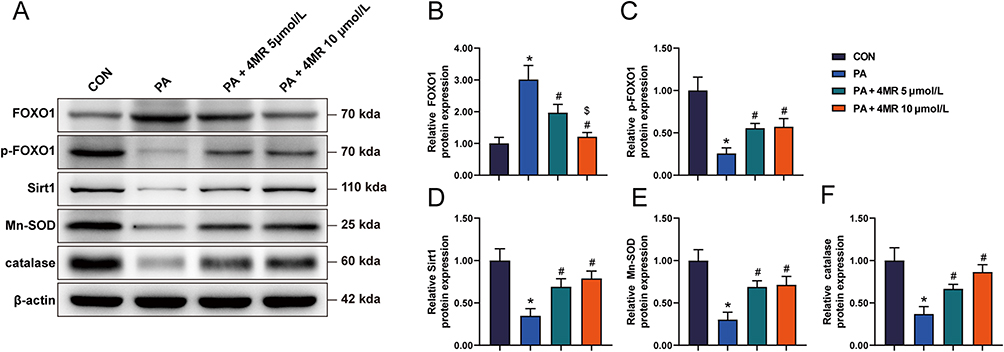 |
Figure 8 Variations in the expression of biomarkers linked to the antioxidant defense pathway within HepG2 cells. The protein levels indicative of oxidative stress response pathways were assessed post-exposure to varying dosages of 4MR. (A) Western blot outcomes for oxidative stress pathway biomarkers (n = 6), (B) FOXO1 protein levels (n = 6), (C) phosphorylated FOXO1 (n = 6), (D) Sirt1 protein expression (n = 6), (E) manganese superoxide dismutase (Mn-SOD) (n = 6), and (F) catalase activity (n = 6). The presented data are expressed as average figures accompanied by the standard deviation. Statistical evaluations were carried out via one-way ANOVA, succeeded by Bonferroni’s or Tamhane’s post-hoc procedures for pairwise comparisons. The asterisks (*) highlight P < 0.05 in comparison with the control cohort, the hashtags (#) point out P < 0.05 in relation to the PA-only cohort, and the dollar signs ($) mark P < 0.05 in contrast to the PA combined with 5 μmol/L 4MR cohort. |
Discussion
Trans-3,5,4′-trihydroxystilbene, commonly known as resveratrol, is a type of natural polyphenolic substance predominantly sourced from fruits such as red grapes and blueberries, as well as from peanuts and various other botanical sources.17 Despite its numerous advantageous biological properties, resveratrol has some limitations. When ingested by humans, it is absorbed, but it exhibits low plasma concentrations and limited distribution within tissues.18 One of the primary drawbacks associated with resveratrol is its poor bioavailability.19 There has been a recent surge in investigations of its chemical derivatives, which have been shown to have improved bioavailability and therapeutic efficacy.20 4MR, is a stilbenoid compound found in the families Dipterocarpaceae and Gnetaceae. It has the same biological activity as resveratrol, including anti-oxidative-stress activity. The study found that in the livers of mice in the HFD group, the level of MDA and the CAT increased, while the activities of SOD and GPX decreased. After 4MR intervention, the levels of MDA and CAT decreased, and the activities of SOD and GPX increased, indicating that 4MR improved hepatic oxidative stress.
To elucidate the mode of action by which 4MR influences oxidative stress markers via antioxidant signaling pathways, we conducted assessments of the expression of proteins pertinent to this pathway in both animal and cellular models. HepG2 cells were chosen as the model for this investigation because of two principal factors. First, HepG2 is a pioneering hepatic cell line that has been extensively employed in research. The cell line has a well-defined origin and consistent characteristics, making it a staple in research pertaining to oncology, liver inflammation, and metabolic disorders. Second, HepG2 cells are frequently used for research into insulin resistance and type T2DM.21,22 SIRT1 acts as an NADP+-dependent deacylase and is involved in a multitude of cellular functions. It serves as a guardian against oxidative stress in diverse pathologies.23 SIRT1 activation mitigates oxidative stress and mitochondrial abnormalities in human endothelial cells.24 FOXO1, a member of the forkhead box protein family, serves as a crucial molecule for SIRT1 interactions and is integral in various biological processes, such as managing oxidative stress responses and apoptosis.25 Previous research has demonstrated that SIRT1 regulates mammalian FOXO1 transcription factors via direct engagement or deacetylation mechanisms.26 By deacetylating and stimulating the FOXO1 transcription factor, SIRT1 aids in the transcription of enzymes with antioxidative properties, such as Mn-SOD, TBX, and CAT.27 Consequently, the SIRT1/FOXO1 pathway is integral to the regulation of oxidative stress. Resveratrol seems to play an important role in oxidative stress by regulating SIRT1.28 It is the strongest SIRT1 agonist reported to date.29 Compared with the control group, the relative expression level of FOXO1 protein increased in the PA group, while the relative expression levels of p-FOXO1, SIRT1, Mn-SOD, and CAT proteins decreased. The addition of 4MR could reverse the regulatory effect of the PA group on these proteins, and this effect was concentration-dependent.
This study is the first to systematically explore the role of 4MR in improving HIR induced by a HFD. It reveals a novel mechanism by which 4MR alleviates insulin resistance and reduces blood glucose levels through anti-oxidative stress. Although the findings of our study are noteworthy, it still has some limitations. Although we have confirmed that 4MR can regulate oxidative stress, it remains unknown which signaling pathways are affected by the specific regulatory means. The mechanism of action of 4MR in vivo is complex. The effect of 4MR surely does not rely on the regulation of a single target or a single signaling pathway; instead, it involves a complex regulatory network. Its specific mechanism of action needs to be verified through extensive experiments. In addition, the metabolism and bioavailability of 4MR in vivo are currently unclear, and there is a lack of data support from clinical studies, which restricts further research on it. Future research will focus on these issues.
Conclusions
This groundbreaking study has, for the first time, jointly demonstrated in both in-vivo and in-vitro experiments that 4MR can effectively alleviate the oxidative stress occurring under insulin-resistant conditions. This not only reveals a crucial new role of 4MR in metabolic regulation-directly intervening in the core pathological link (oxidative stress) of HIR, but also strongly suggests that 4MR or its analogues/derivatives have great potential to be developed into novel intervention strategies for improving insulin resistance and preventing or treating related metabolic diseases such as T2DM. Future research should delve into exploring its precise mechanism of action and accelerate its translation into clinical applications.
Abbreviations
4MR, 4′-Methoxyresveratrol; T2DM, Type 2 Diabetes Mellitus; MAFLD, Metabolic-associated Fatty Liver Disease; SOD, Superoxide Dismutase; GPX, Glutathione Peroxidase; CAT, Catalase; GSH, Glutathione; HFD, High-Fat Diet; IPGTT, Intraperitoneal Glucose Tolerance Test; HOMA-IR, Homeostasis Model Assessment of Insulin Resistance; QUICKI, Quantitative Insulin Sensitivity Check Index; PA, Palmitic Acid; SIRT1, Sirtuin 1; FOXO1, Forkhead box protein O1; p-FOXO1, Phosphorylated FOXO1; Mn-SOD, Manganese Superoxide Dismutase; MDA, Malondialdehyde; EMEM, Eagle’s minimum essential medium; FBS, Fetal bovine serum; DMSO, Dimethyl sulfoxide; PVDF, Polyvinylidene difluoride; H&E, Hematoxylin-Eosin; ORO, Oil Red O; RT-qPCR, Reverse Transcription Quantitative Real - Time Polymerase Chain Reaction; SDS-PAGE, Sodium Dodecyl Sulfate-Polyacrylamide Gel Electrophoresis.
Data Sharing Statement
The data sets used for this research are accessible from the principal investigator, provided a reasonable request is made.
Author Contributions
All authors made a significant contribution to the work reported, whether that is in the conception, study design, execution, acquisition of data, analysis and interpretation, or in all these areas; took part in drafting, revising or critically reviewing the article; gave final approval of the version to be published; have agreed on the journal to which the article has been submitted; and agree to be accountable for all aspects of the work.
Funding
This works was supported by the Hebei Province Science and Technology Commission’s Youth Science and Technology Initiative [grant number 20210308].
Disclosure
The authors declare that they have no competing interests to declare.
References
1. Ma CX, Ma XN, Guan CH, et al. Cardiovascular disease in type 2 diabetes mellitus: progress toward personalized management. Cardiovasc Diabetol. 2022;21:74. doi:10.1186/s12933-022-01516-6
2. Ahmed B, Sultana R, Greene MW. Adipose tissue and insulin resistance in obese. Biomed Pharmacother. 2021;137:111315. doi:10.1016/j.biopha.2021.111315
3. Suren Garg S, Kushwaha K, Dubey R, et al. Association between obesity, inflammation and insulin resistance: insights into signaling pathways and therapeutic interventions. Diabet Res Clin Pract. 2023;200:110691. doi:10.1016/j.diabres.2023.110691
4. Tian X, Chen S, Wang P, et al. Insulin resistance mediates obesity-related risk of cardiovascular disease: a prospective cohort study. Cardiovasc Diabetol. 2022;21:289. doi:10.1186/s12933-022-01729-9
5. Ye J. Mechanism of insulin resistance in obesity: a role of ATP. Front Med. 2021;15:372–382. doi:10.1007/s11684-021-0862-5
6. Chaudhuri R, Krycer JR, Fazakerley DJ, et al. The transcriptional response to oxidative stress is part of, but not sufficient for, insulin resistance in adipocytes. Sci Rep. 2018;8:1774. doi:10.1038/s41598-018-20104-x
7. Wang Z, Hou L, Huang L, et al. Exenatide improves liver mitochondrial dysfunction and insulin resistance by reducing oxidative stress in high fat diet-induced obese mice. Biochem Biophys Res Commun. 2017;486:116–123. doi:10.1016/j.bbrc.2017.03.010
8. Dimova R, Chakarova N, Grozeva G, et al. The relationship between glucose variability and insulin sensitivity and oxidative stress in subjects with prediabetes. Diabet Res Clin Pract. 2019;158:107911. doi:10.1016/j.diabres.2019.107911
9. Abbasi Oshaghi E, Goodarzi MT, Higgins V, et al. Role of resveratrol in the management of insulin resistance and related conditions: mechanism of action. Crit Rev Clin Lab Sci. 2017;54:267–293. doi:10.1080/10408363.2017.1343274
10. Keylor MH, Matsuura BS, Stephenson CR. Chemistry and biology of resveratrol-derived natural products. Chem Rev. 2015;115:8976–9027. doi:10.1021/cr500689b
11. Yu W, Tao M, Zhao Y, et al. 4′-Methoxyresveratrol alleviated AGE-induced inflammation via RAGE-mediated NF-κB and NLRP3 inflammasome pathway. Molecules. 2018;23:1447. doi:10.3390/molecules23061447
12. Das P, Biswas S, Mukherjee S, et al. Association of Oxidative Stress and Obesity with Insulin Resistance in Type 2 Diabetes Mellitus. Mymensingh Med J. 2016;25:148–152.
13. Maritim AC, Sanders RA, Watkins JB. Diabetes, oxidative stress, and antioxidants: a review. J Biochem Mol Toxicol. 2003;17:24–38. doi:10.1002/jbt.10058
14. Shu L, Zhao H, Huang W, et al. Resveratrol upregulates mmu-miR-363-3p via the PI3K-Akt pathway to improve insulin resistance induced by a high-fat diet in mice. Diabetes Metab Syndr Obes. 2020;13:391–403. doi:10.2147/dmso.S240956
15. Livak KJ, Schmittgen TD. Analysis of relative gene expression data using real-time quantitative PCR and the 2(-Delta Delta C(T)) Method. Methods. 2001;25:402–408. doi:10.1006/meth.2001.1262
16. Yao Y, Liu K, Zhao Y, et al. Pterostilbene and 4′-Methoxyresveratrol inhibited lipopolysaccharide-induced inflammatory response in RAW264.7 macrophages. Molecules. 2018;23:1148. doi:10.3390/molecules23051148
17. Ku CR, Lee HJ, Kim SK, et al. Resveratrol prevents streptozotocin-induced diabetes by inhibiting the apoptosis of pancreatic β-cell and the cleavage of poly (ADP-ribose) polymerase. Endocr J. 2012;59:103–109. doi:10.1507/endocrj.ej11-0194
18. Yang Y, Li C, Li H, et al. Differential sensitivities of bladder cancer cell lines to resveratol are unrelated to its metabolic profile. Oncotarget. 2017;8:40289–40304. doi:10.18632/oncotarget.15041
19. Bitterman JL, Chung JH. Metabolic effects of resveratrol: addressing the controversies. Cell Mol Life Sci. 2015;72:1473–1488. doi:10.1007/s00018-014-1808-8
20. Nawaz W, Zhou Z, Deng S, et al. Therapeutic versatility of resveratrol derivatives. Nutrients. 2017;9:1188. doi:10.3390/nu9111188
21. Jung TW, Lee KT, Lee MW, et al. SIRT1 attenuates palmitate-induced endoplasmic reticulum stress and insulin resistance in HepG2 cells via induction of oxygen-regulated protein 150. Biochem Biophys Res Commun. 2012;422:229–232. doi:10.1016/j.bbrc.2012.04.129
22. Zhao H, Zhang Y, Shu L, et al. Resveratrol reduces liver endoplasmic reticulum stress and improves insulin sensitivity in vivo and in vitro. Drug Des Devel Ther. 2019;13:1473–1485. doi:10.2147/dddt.S203833
23. Wang K, Tang Z, Wang J, et al. Retraction notice to “Polysaccharide from Angelica sinensis ameliorates high-fat diet and STZ-induced hepatic oxidative stress and inflammation in diabetic mice by activating Sirt1-AMPK pathway” [JNB 43 (2017) 88-97]. J Nutr Biochem. 2017;47:133. doi:10.1016/j.jnutbio.2017.07.007
24. Wang S, Wang J, Zhao A, et al. SIRT1 activation inhibits hyperglycemia-induced apoptosis by reducing oxidative stress and mitochondrial dysfunction in human endothelial cells. Mol Med Rep. 2017;16:3331–3338. doi:10.3892/mmr.2017.7027
25. Kim MK, Shin HM, Jung H, et al. Comparison of pancreatic beta cells and alpha cells under hyperglycemia: inverse coupling in pAkt-FoxO1. Diabet Res Clin Pract. 2017;131:1–11. doi:10.1016/j.diabres.2017.05.017
26. Li Z, He Q, Zhai X, et al. Foxo1-mediated inflammatory response after cerebral hemorrhage in rats. Neurosci Lett. 2016;629:131–136. doi:10.1016/j.neulet.2016.06.013
27. Akhondzadeh F, Astani A, Najjari R, et al. Resveratrol suppresses interleukin-6 expression through activation of sirtuin 1 in hypertrophied H9c2 cardiomyoblasts. J Cell Physiol. 2020;235:6969–6977. doi:10.1002/jcp.29592
28. Zhao H, Chen S, Gao K, et al. Resveratrol protects against spinal cord injury by activating autophagy and inhibiting apoptosis mediated by the SIRT1/AMPK signaling pathway. Neuroscience. 2017;348:241–251. doi:10.1016/j.neuroscience.2017.02.027
29. Jiang Z, Chen K, Cheng L, et al. Resveratrol and cancer treatment: updates. Ann N Y Acad Sci. 2017;1403:59–69. doi:10.1111/nyas.13466
 © 2025 The Author(s). This work is published and licensed by Dove Medical Press Limited. The
full terms of this license are available at https://www.dovepress.com/terms
and incorporate the Creative Commons Attribution
- Non Commercial (unported, 4.0) License.
By accessing the work you hereby accept the Terms. Non-commercial uses of the work are permitted
without any further permission from Dove Medical Press Limited, provided the work is properly
attributed. For permission for commercial use of this work, please see paragraphs 4.2 and 5 of our Terms.
© 2025 The Author(s). This work is published and licensed by Dove Medical Press Limited. The
full terms of this license are available at https://www.dovepress.com/terms
and incorporate the Creative Commons Attribution
- Non Commercial (unported, 4.0) License.
By accessing the work you hereby accept the Terms. Non-commercial uses of the work are permitted
without any further permission from Dove Medical Press Limited, provided the work is properly
attributed. For permission for commercial use of this work, please see paragraphs 4.2 and 5 of our Terms.