")
Back to Journals » Drug Design, Development and Therapy » Volume 17
16S rRNA and Metagenomics Combined with UPLC-Q/TOF-MS Metabolomics Analysis Reveals the Potential Mechanism of Radix Astragali Against Hyperuricemia in Mice
Authors Deng S, Cai K, Pei C, Zhang X, Xiao X, Chen Y, Chen Y, Liang R, Chen Y, Li P, Xie Z, Liao Q
Received 23 February 2023
Accepted for publication 29 April 2023
Published 6 May 2023 Volume 2023:17 Pages 1371—1386
DOI https://doi.org/10.2147/DDDT.S407983
Checked for plagiarism Yes
Review by Single anonymous peer review
Peer reviewer comments 2
Editor who approved publication: Dr Tuo Deng
Song Deng,1,* Kaiwei Cai,1,* Chaoying Pei,1 Xingyuan Zhang,1 Xiaoyi Xiao,1 Ye Chen,1 Ying Chen,1 Rongyao Liang,1 Yanlong Chen,1 Pei Li,1 Zhiyong Xie,2 Qiongfeng Liao1
1School of Pharmaceutical Sciences, Guangzhou University of Chinese Medicine, Guangzhou, People’s Republic of China; 2School of Pharmaceutical Sciences (Shenzhen), Sun Yat-sen University, Guangzhou, People’s Republic of China
*These authors contributed equally to this work
Correspondence: Qiongfeng Liao, School of Pharmaceutical Sciences, Guangzhou University of Chinese Medicine, Guangzhou, 510006, People’s Republic of China, Tel/Fax +86 02039358081, Email [email protected] Zhiyong Xie, School of Pharmaceutical Sciences (Shenzhen), Sun Yat-sen University, Guangzhou, 510006, People’s Republic of China, Tel/Fax +86 075523260207, Email [email protected]
Purpose: This study aimed to investigate the underlying treatment mechanism of Radix Astragali (RA) in hyperuricemia from the perspective of microbiota and metabolomics.
Methods: We used potassium oxyazinate (PO) to induce hyperuricemia mice, and we determined serum alanine aminotransferase/aspartate aminotransferase (ALT/AST), xanthine oxidase (XOD), creatinine (CRE), uric acid (UA), blood urea nitrogen (BUN) levels, liver XOD levels and assessed the kidney tissue histopathology. The therapeutic mechanism of RA in hyperuricemic mice was studied by 16S rRNA, metagenomic sequencing and metabolomics.
Results: Our research showed that RA has therapeutic effect in hyperuricemia mice, such as slow the weight loss, repair kidney damage, and downregulate serum UA, XOD, CRE, ALT/AST, BUN, and liver XOD levels. RA restored the disturbance structure of the microbiota in hyperuricemia mice by increasing the relative abundances of beneficial bacteria (Lactobacillaceae and Lactobacillus murine) but decreasing the relative abundances of pathogenic bacteria (Prevotellaceae, Rikenellaceae and Bacteroidaceae). Meanwhile, we found that RA directly regulated the metabolic pathway (such as linoleic acid metabolism and glycerophospholipid metabolism) and indirectly regulated bile acid metabolism by mediating microbiota to ameliorate metabolic disorders. Subsequently, there was a robust correlation between specific microbiota, metabolites and the disease index.
Conclusion: The ability of RA to protect mice against hyperuricemia is strongly linked to the microbiome-metabolite axis, which would provide evidence for RA as a medicine to prevent or treat hyperuricemia.
Keywords: Radix Astragali, hyperuricemia, microbiota, metabolism, bile acid
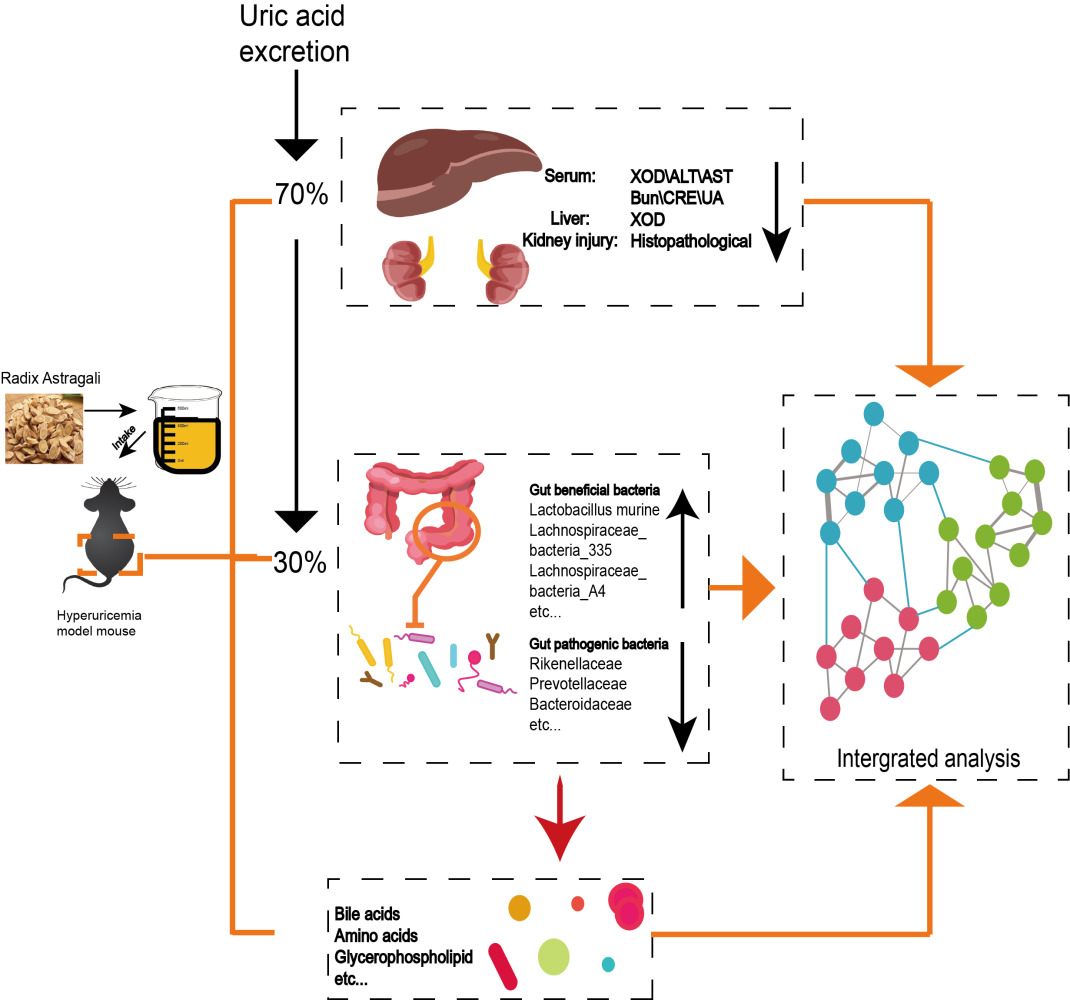
Graphical Abstract:
Introduction
Hyperuricemia is a disease caused by irregular purine metabolism, which is always accompanied by excessive production or abnormal excretion of uric acid (UA).1 Most notably, the overall incidence of hyperuricemia in China has been increasing over the past decade with the westernization of eating habits.2,3 However, there are blind spots and misunderstandings in its diagnosis, prevention and treatment.4 Obviously, there are several only UA-lowering medicines in the clinic, such as allopurinol (ALL) and benzbromarone.5 Unfortunately, these chemical drugs are not suitable for a long-term and effective therapeutic schedule due to the reported side effects,6 especially hepatorenal toxicity. Hence, it is necessary to seek a safer and more valid strategy to treat hyperuricemia.
Many scholars have proposed the concept of the gut-kidney axis. Indeed, evidence suggests that kidney diseases are inextricably linked to the gut and even the gut microbiome.7,8 Interestingly, UA, as the final product of purine metabolism in vivo, is generally produced and excreted in a dynamic balance, with 2/3 excreted by kidney and 1/3 decomposed through the intestine.9 More importantly, much evidence has shown that the intestinal microflora is involved in purine-to-UA metabolism.10 For example, the absorption of purine in intestinal cells can be lessened for utilization and consumption by Lactobacillus. In addition, XOD, an enzyme that can catalyze the generation of hypoxanthine to UA, induces Shiga toxigenic Escherichia coli to increase virulence.11,12 In conclusion, disorders of the gut microbiota play an important role in the occurrence and development of hyperuricemia. Hence, maintaining the homeostasis of intestinal flora and restoring the altered microbial metabolism might be a promising strategy for treating hyperuricemia.
Radix Astragali, the roots of Astragalus membranaceus Bge. var. mongholicus (Bge.). Hsiao is one of the most widely used medicinal and edible homologous Chinese herbs.13,14 Indeed, RA was used as an ingredient for soup, tea and other daily eatables for its health efficacy, especially in southern China. More excitingly, many studies have reported that RA can treat hyperuricemia.15,16 However, RA is composed mainly of flavonoids, saponins and polysaccharides, which are difficult to absorb directly in the digestive tract.17,18 Therefore, it is important to understand the mechanism of RA in improving hyperuricemia.
This study aimed to explore the mechanism of RA on hyperuricemia from the perspective of the microbiota and its metabolites. We first employed a hyperuricemia model induced by PO and detected the levels of UA, CRE, BUN, XOD, ALT/AST and HE staining to verify the treatment efficacy of RA. Then, the structural shifts of the gut microbiota in response to RA treatment were determined by 16S rRNA and metagenes sequencing technology. Especially, the predicted metabolic pathways by PICRUSt analysis were further verified by off-target metabolomic technology. In summary, this research provides a scientific basis for the development and application of RA as a medicinal and edible homologous Chinese herb to lower UA in the future.
Materials and Methods
Herbs and Chemicals
ALL was supplied by Sigma-Aldrich Co. Ltd. (St. Louis, MO, USA) and RA (Trade name: Astragalus Formula Granules) was produced by Tianjiang Pharmaceutical Co., Ltd. (batch number: 21081951) was purchased from Guangdong Provincial Hospital of Traditional Chinese Medicine. PO (purity ≥ 97%). RA solution was analyzed by ultra-performance liquid chromatography coupled to hybrid Quadrupole-Exactive Orbitrap mass spectrometry (UPLC-Q-Orbitrap HRMS) with an electrospray ionization interface. Chromatographic separations were performed by a Thermo Hypersil GOLD C18 (100 x 2.1 mm, 1.9 μm, USA). The mobile phase consisted of solvents A (0.1% formic acid-water) and B (methanol). The gradient program was optimized as follows: 0–2 min, 5% B; 2–8 min, 5–20% B; 8–20 min, 20–95% B; 20–25 min, 95–95% B; 25–25.1 min, 95–5% B; 25.1–30 min, 5–5% B. The flow rate was set at 0.3 mL/min. The injection volume of RA solution was 2 μL. The column temperatures were maintained at 40°C, respectively. The Spray voltage was 5 kV, and the capillary temperature was set at 320°C. Nitrogen was used as both the sheath gas (30 psi) and auxiliary gas (10 psi). In the Full MS scan range, MS spectra were scanned in the range of m/z 70–1050. Acquired MS/MS spectra and precursor m/z were used for identification in mzCloud and mzVault. The analysis of RA constitutes used UPLC-Q-Orbitrap HRMS as shown in Figure S1 and Table S1.
Animal Modeling and Treatment
C57BL/6J mice (male, 18~22 g) were purchased from Guangdong Provincial Medical Laboratory Animal Center with License No. SCXK (YUE) 2020-0051. Animals were raised under specific special pathogen-free (SPF) conditions. The temperature was kept at 20~25°C, the light and dark were alternated for 12 hours, the relative humidity was set at 60%~70%, and the sterile water and standard food were strictly maintained.
After 7 days of adaptive feeding, mice were randomly divided into 5 groups (n = 8), including the control group, the model group, the ALL group, and the low-dose RA (RA-L) and high-dose RA (RA-H) groups. Mice in the control group were intraperitoneally injected with 0.5% CMC-Na solvent (0.2 mL/10 g), while the others mice were intraperitoneally injected once with PO (300 mg/kg) dissolved in 0.5% CMC-Na (PO is a chemical uricase inhibitor, which can inhibit the uricase activity in mice, so that the uric acid in the animal cannot be decomposed, resulting in increased production of serum uric acid in the body, and finally the formation of hyperuricemia animal model). Then, mice in the RA low (RA-L) and high (RA-H) dose groups were administrated with RA (dissolved in double-distilled water, crude herb dose: 1.54 or 6.17 g/kg) orally while the ALL group were administrated with ALL (5 mg/kg) orally for the following 14 days. After the successful modeling and the preventive intervention, mice in the ALL, RA-L and RA-H groups implemented the corresponding interventions for 14 consecutive days. Throughout the process, the mice in the control and model groups were administered an equal volume of sterile water by gavage.
Sample Collection
Mice feces were collected after the last administration and stored at −80°C. After fasting for 16 hours, the body weight of all animals was recorded, and the mice were treated with CO2 inhalation anesthesia. Subsequently, the blood samples were collected and centrifuged (3000 rpm, 4°C) for 10 min. Then, the upper serum was extracted and stored at −80°C. The kidneys were weighted and partly fixed in the 4% paraformaldehyde solution. The contents of ileocecal tract of mice were collected on ice and stored at −80°C.
Biochemical Examination
The contents of UA, XOD, ALT/AST, CRE and BUN in serum and XOD in liver of mice in each group were determined according to the instructions of the kit, which were purchased from Nanjing Jiancheng Bioengineering Institute (Nanjing, China). Serum samples can be used directly for testing. Liver tissue samples need to be added with 9 times the volume of PBS at a ratio of weight (g): volume (mL)=1:9, ground, and centrifuged to obtain the supernatant for testing. During the test, a catalyst and chromogenic agents were added and incubated at 37°C for 20 minutes, measure the absorbance value at a wavelength of 530 nm, and finally calculate the XOD enzyme activity according to the formula.
Histopathological Analyses of Kidney
The kidneys of mice were taken out from 4% paraformaldehyde, cut into slices with a thickness of 4 μm~5 μm, stained with hematoxylin and eosin (HE). And the pathological changes of kidney tissue were observed under a light microscope (Olympus, Japan) at 200× and 400× magnifications.
16S rRNA Gene and Metagenomic Sequencing
Fresh fecal samples of the three groups of mice (the control, model, and RA-H groups) were collected for 16S rRNA gene (n = 6) and metagenomic sequencing (n = 3). The high throughput sequencing method and data processing were conducted as previously reported,19 the fecal samples of all groups were extracted using the EZNA® Soil DNA Kit (Omega Bio-tek, USA), and it should be noted that the RA group referred to the RA-H group. Subsequently, the variable region V3~V4 of the bacterial gene was amplified with primer pairs 338F (5’-ACTCCTACGGGAGGCAGCAG-3’) and 806R (5’-GGACTACHVGGGTWTCTAAT-3’) by an ABI GeneAmp® 9700 PCR thermocycler (ABI, CA, USA). The purified PCR products were constructed using the NEXTFLEX Rapid DNA-Seq Kit, and sequenced using the Miseq PE300 platform of Illumina (Shanghai Meiji Biomedical Technology Co., Ltd.). The purified amplicons were sequenced in equimolar quantities by paired-end sequencing according to the standard protocols by Majorbio Bio-Pharm Technology Co. Ltd. (Shanghai, China). All data analysis were performed by using the Majorbio platform at http://www.majorbio.com. The raw sequencing reads were uploaded to the NCBI Sequence Read Archive (SRA) database with the 16S rRNA accession number as PRJNA816671 and metagenomic accession number as PRJNA833146.
UPLC-Q/TOF-MS Analysis
The chromatographic resolution was successfully implemented on a Acquity HSS T3 column (100 mm×2.1 mm, 1.8 μm) by utilizing a mobile phase comprising of 0.1% (v/v) formic acid aqueous solution (A) and 0.1% (v/v) formic acid acetonitrile solution (B). The gradient elution procedure was conducted as shown below: 1% B at 0~2 min, 1%→15% B at 2~3.5 min, 15%→25% B at 3.5~7.5 min, 25%→35% B at 7.5~9 min, 35%→99% B at 9~11.5 min, 99% B at 11.5~17 min, 99%→1% B at 17~17.1 min, 1% B at 17.1~20.1 min. The column temperature was maintained at 40°C and the autosampler temperature was maintained at 4°C.
The HPLC system was coupled to a Xevo G2-S Q-TOF/MS (Waters) with a Q-Trap™ 4000 MS/MS system. Tandem mass spectrometer was manipulated under the positive and negative electrospray ionization (ESI) mode. The mass-to-charge ratio range of data acquisition was set at 50~1000 m/z. N2 was used as the drying gas, and the flow rate was 1.5 L/min. The temperature of N2 was 350°C. The capillary voltages of the positive and negative ion modes were set at 2500 V and 2000 V, respectively. And the ion source temperature was set at 120°C, the cone voltage was set at 40 V. The collision energy was set at 20 eV-50 eV. Moreover, in order to obtain the accurate mass of each compound, we used leucine-enkephalin (m/z 556.2771) as the locked mass solution. The UPLC-Q/TOF-MS conditions were applied to fecal samples in all groups, and the RA group was referred to as the RA-H group. All data were acquired and processed by the Waters MasslynxTM V4.1 software.
Statistical Analysis
The data were expressed as mean ± SEM (Standard error of mean), and all statistical analysis and graphing were performed using SPSS 26.0 (SPSS, Armonk, USA) and Graph Prism 8.0.2 (GraphPad, San Diego, USA). Differences among groups were determined using the one-way analysis of variance (ANOVA), and Tukey’s test was used for post hoc comparisons. P<0.05 was considered as significant difference. Spearman correlation coefficients between the UA-related indicators of the gut microbiome and metabolome were also determined.
Results
RA Lowered Serum UA and Improved Liver-Kidney Function of Hyperuricemia Mice
The mouse-experimental schedule is shown in Figure 1A. Compared with the control mice, the hyperuricemia mice lost weight, which was reversed to a certain extent after RA intervention (Figure 1B). HE pathological showed that compared with the controls, the model mice exhibited several characterized histologic alterations, including serious renal tubular lumen dilatation (the red circle shows the renal tubule in Figure 1C). Interestingly, RA-H rather than ALL notably reversed the above-mentioned situations in which the overall structure of the mouse kidney basically returned to normal. Although the improvement was not as significant as that of RA-H, the administration of RA-L also had a certain protective effect on kidney morphology (Figure 1C).
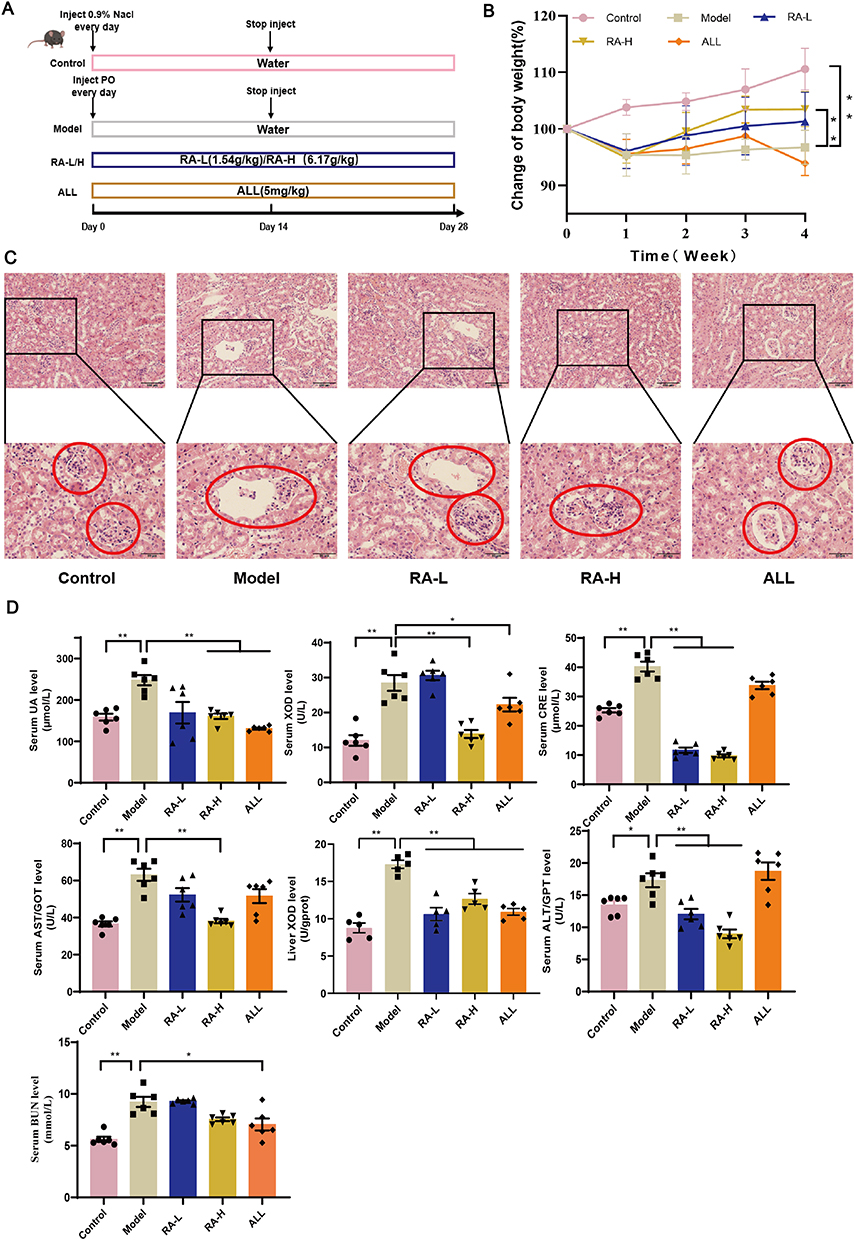 |
Figure 1 Effects of RA on serum UA level and liver-kidney function in hyperuricemia mice. (A) Schematic diagram of the mouse experimental design. (B) Change of body weight. (C) In a histopathological analysis of kidney tissues, the red circle shows the renal tubule (200× and 400×). (D) The contents of serum UA, ALT, AST, BUN, XOD, CRE and liver XOD. Data are shown as mean ± SEM. *P < 0.05, **P < 0.01. |
The kit results disclosed that compared with the control group, the level of serum UA in the model group was significantly increased, indicating that the hyperuricemia model was successfully established. As expected, the level of serum UA was decreased after RA-H administration, while RA-L treatment showed a weak trend. Meanwhile, the levels of other UA-related indicators such as serum XOD, liver XOD, serum CRE and serum BUN were considerably reduced following the intervention with RA-L and RA-H, which were not always obviously decreased in the ALL group. Surprisingly, treatment with RA-H rather than ALL had a distinct protective effect on the liver function of hyperuricemia mice, as evidenced by the decreased levels of AST and ALT (Figure 1D). In conclusion, RA ameliorated the symptoms caused by hyperuricemia in a dose-dependent manner.
RA Modified the Structure and Composition of Gut Microbiota in Hyperuricemia Mice
Accumulating evidence has indicated the pivotal role of gut dysbiosis in hyperuricemia. We thus performed 16S rRNA analysis to evaluate the potential influence of RA on the intestinal flora in hyperuricemia mice. The clustering diagram of PCoA showed that the cluster from the model group was far away from the controls, while the cluster tended to normal after the intervention of RA. The results suggested that the structure of the intestinal microbiota of hyperuricemia mice was remarkably changed by PO modeling, but was restored by RA (Figure 2A). Compared with the model group, the Shannon index (representative species diversity and richness) of the control and RA groups was significantly increased (Figure 2B). The microbe abundance analysis showed different microbial taxonomic signatures in fecal samples collected from three groups. At the phylum level, the relative abundance of Firmicutes was higher in controls and RA-treated mice, while that was lower in models. However, the relative abundance of Bacteroides in each group was opposite to that of Firmicutes (Figure 2C). Besides, the Bacteroidetes/Firmicutes (B/F) value of the untreated hyperuricemia mice was higher than that of the controls, while the value was significantly decreased by RA administration (Figure S2A). At the family level, the relative abundance of Lachnospiraceae and Lactobacillaceae was pointedly lower in the model group but higher in the control and RA groups (Figure S2B). At the genus level, compared with the control and RA groups, the relative abundance of norank_f_norank_o_Clostridia_UCG-014, Ileibacterium, Prevotellaceae_UCG-001 and Alistipes was richer in the model group (Figure 2D).
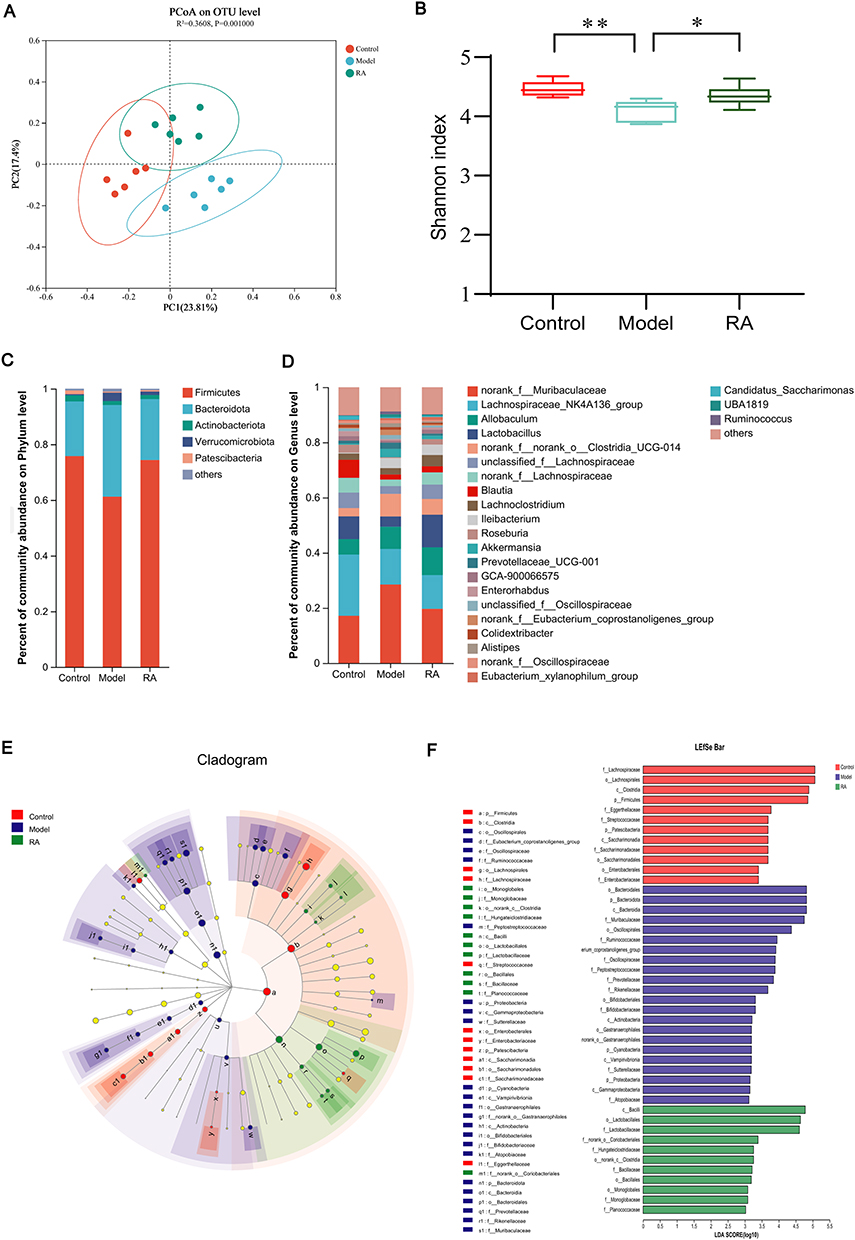 |
Figure 2 Effects of RA on gut microbiota structure and composition in hyperuricemia mice. (A) Weighted UniFrac-based PCoA of the fecal microbiota. (B) Shannon box plot. (C and D) Bacterial taxonomic profiling at the phylum and genus levels resulted from different groups. (E) Cladogram of the control, model, and RA groups. (F) LDA value distribution histogram (LDA>3). Data are shown as mean ± SEM. *P < 0.05, **P < 0.01. |
The LEfSe results indicated that Firmicutes were significantly enriched in the control group, Bacteroidota and Proteobacteria were significantly enriched in the model group, and Bacilli was significantly enriched in the RA group (Figure 2E). Moreover, linear discriminant analysis (LDA) estimated the magnitude of abundance of each species on the divergence. The LDA results showed that Oscillospiraceae, Peptostreptococcaceae and Eubacterium coprostanoligenes were expressed at a higher abundance in the model group (LDA>3.0), while Lactobacillaceae, Lachnoclostridium, Ileibacterium and Peptococcaceae were expressed at a higher abundance in the control and RA groups (LDA>3.0) (Figure 2F).
RA Regulated the Functions of the Gut Microbiome in Hyperuricemia Mice
Key microorganisms can regulate various functions, pathways and physiological processes in the body to improve the disease.20 As expected, the results of phylum- and genus-level analysis in the metagenome were consistent with those of 16S rRNA (Figures 3A and S3A). At the species level, compared with the model group, the relative abundances of Lachnospiraceae_bacterium_A4, Clostridiaceae_bacterium, unclassified_o_Clostridiales, Muribaculaceae_bacterium_Isolate-013_(NCI), unclassified_f_Lachnospiraceae, and Lactobacillus murine were significantly increased in the control and RA groups (Figure 3B). Corresponding to this result, the clustering diagram of PCoA showed that the cluster of the model group was far away from the controls, while the cluster tended to normal after the intervention of RA (Figure 3C).
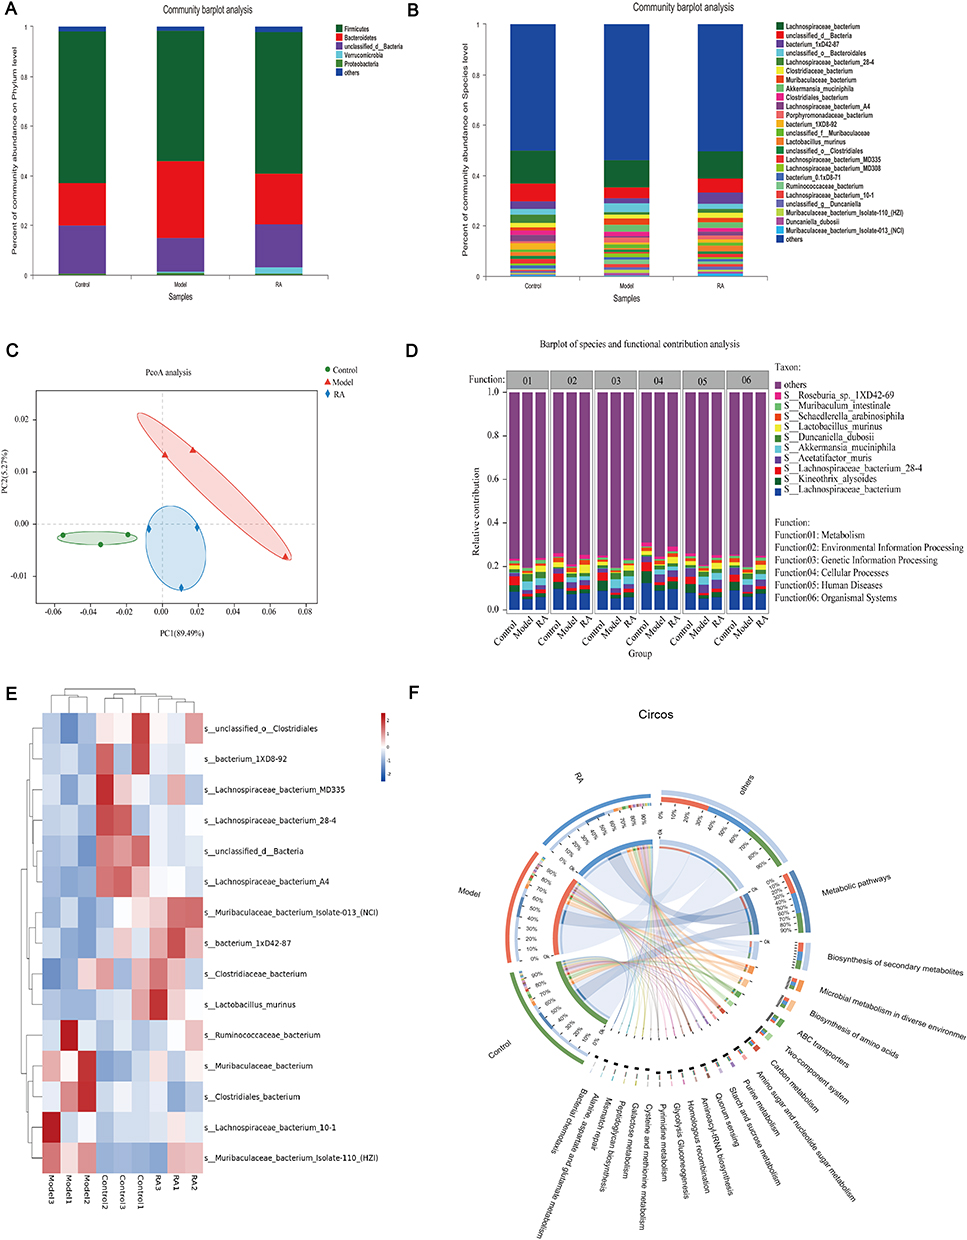 |
Figure 3 Metagenome revealed differential microbe functions after RA intervention in hyperuricemia mice. (A and B) Bacterial taxonomic profiling at the phylum and species levels of intestinal bacteria resulted from different groups. (C) PcoA analysis of each group. (D and F) Barplot and Circos of species and functional contribution analysis. (E) Cluster analysis of the top 25 strains altered by RA in hyperuricemia mice. |
More deeply, the functional contribution analysis showed that 6 kinds of functions were different among groups at the genus level, including metabolism, environmental information processing, genetic information processing, cellular processes, human diseases and organismal systems (Figure S3B). At the species level, compared with the model group, Lactobacillus_murinus, Acetatifactor_muris and Lachnospiraceae_bacterium made a greater contribution to the functions including metabolism, environmental information processing, genetic information processing, cellular processes, human diseases and organismal systems in the control and RA groups, while the contribution of Akkermansia_muciniphila was the opposite (Figure 3D).
To further explore the relationship between these bacteria and organism function, a correlation network was used to show that the main species involved were Lactobacillus murinus, Lachnospiraceae_bacterium and Muribaculaceae_bacterium. And they participate in dominant functions involved in regulation of endocrine and metabolic disease, amino acid metabolism, glycan biosynthesis and metabolism, metabolism of terpenoids and polyketides, metabolism of cofactors and vitamins, nucleotide metabolism, immune system, circulatory system, digestive system, cardiovascular disease, neurodegenerative disease, membrane transport, development and regeneration, etc. (Figure S3C).
Cluster analysis of the top 15 strains with different abundances showed that the control and RA groups were classified into one group, while the model group can be classified into another group (Figure 3E). The Circos sample and species function diagram can clearly describe the corresponding relationship between the abundance of samples and species function (Figure 3F). The results showed that the function of microbial regulation was primarily metabolic pathways (Figure 3F), which was consistent with the results presented above. PICRUSt analysis was performed to further elucidate the effect of altered microbes. The metabolism of differential microbes between the RA group and the model group was mostly enriched in lipid metabolism (such as glycerolipid metabolism) (Figure S4).
RA Restored Metabolic Disorders Caused by Hyperuricemia
In order to observe the changes in fecal metabolomics among the groups, the data were normalized and analyzed by multivariate statistical analysis. Fecal samples of each group were clearly separated by orthogonal partial least squares discrimination analysis (OPLS-DA) score maps (Figure 4A), indicating that there were significant differences in metabolites among the control, model and RA groups. Meanwhile, the results showed that the values of R2 and Q2 in the OPLS-DA model were close to or greater than 0.5 and were validated with a permutation test (n=200) (Figure S5A), indicating that the model was reasonable and stable. Furthermore, we used S-plot analysis based on the correlation coefficient loading plots to obtain the differential metabolites. The points displayed in the S-plot were all differential metabolites with VIP values>1 and P<0.05 (Figure S5B and C).
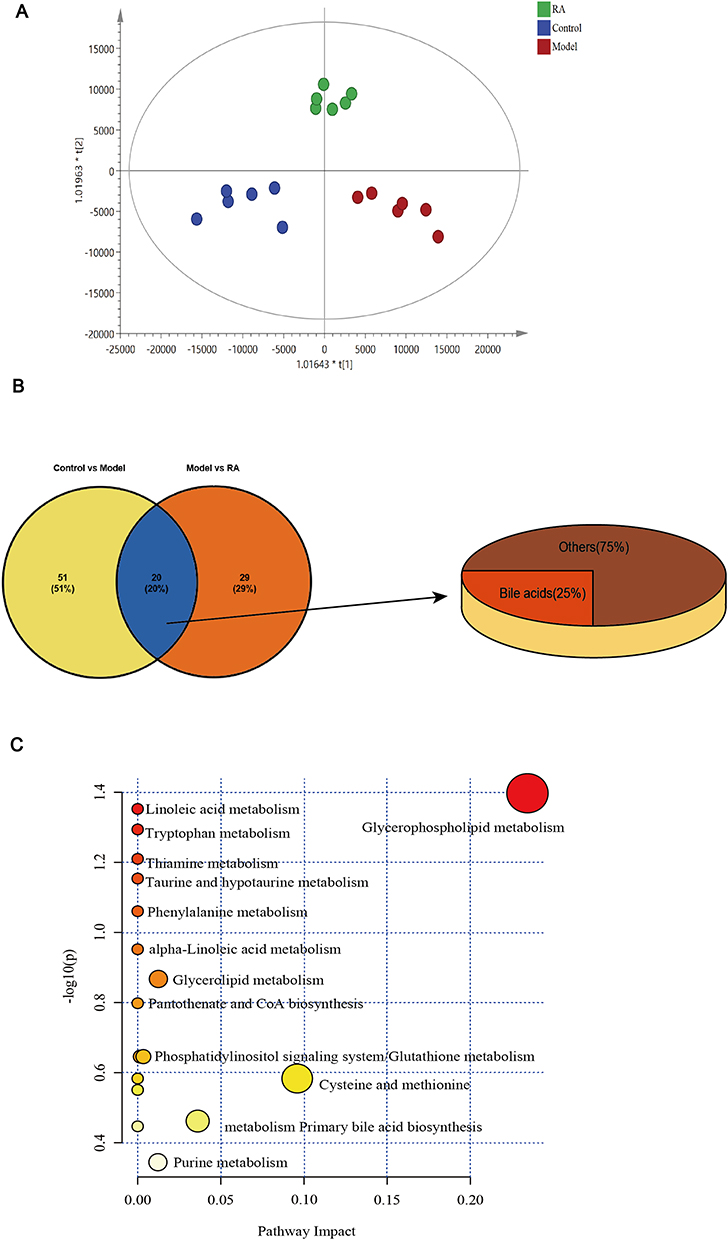 |
Figure 4 Effects of RA on metabolites in hyperuricemia mice. (A) OPLS-DA score plots of the UPLC-Q/TOF-MS spectra from feces. (B) The proportion of different metabolites in feces of mice in each group. (C) Analysis of metabolic pathways related to hyperuricemia (the ordinate represents the metabolite p-values, and the abscissa represents the pathway impact factor. The lower the p-values, the darker the red and the larger the circles, which represents a higher pathway impact factor, and redder and larger circles manifest that the pathway is obviously influenced). |
More specifically, we identified 20 differential metabolites in feces between the model versus control groups and model versus RA groups, of which 13 metabolites were increased but 7 metabolites were decreased in the model group compared with the controls (Table 1). Moreover, compared with the control group, these metabolites were altered in the feces of hyperuricemia mice and returned to normal after RA intervention. Interestingly, we found 5 bile acids (including primary bile acid and second primary bile acid) in these 20 metabolites (Figure 4B), of which 4 bile acids (chenodeoxycholic acid, sulfolithocholylglycine, 3α, 6β, 7β-trihydroxy-5β-cholanoic acid and nutriacholic acid) were decreased in the model group, and increased after RA intervention. Moreover, one bile acid (3α,7α-dihydroxycoprostanic acid) was increased in the model group, and decreased after RA intervention.
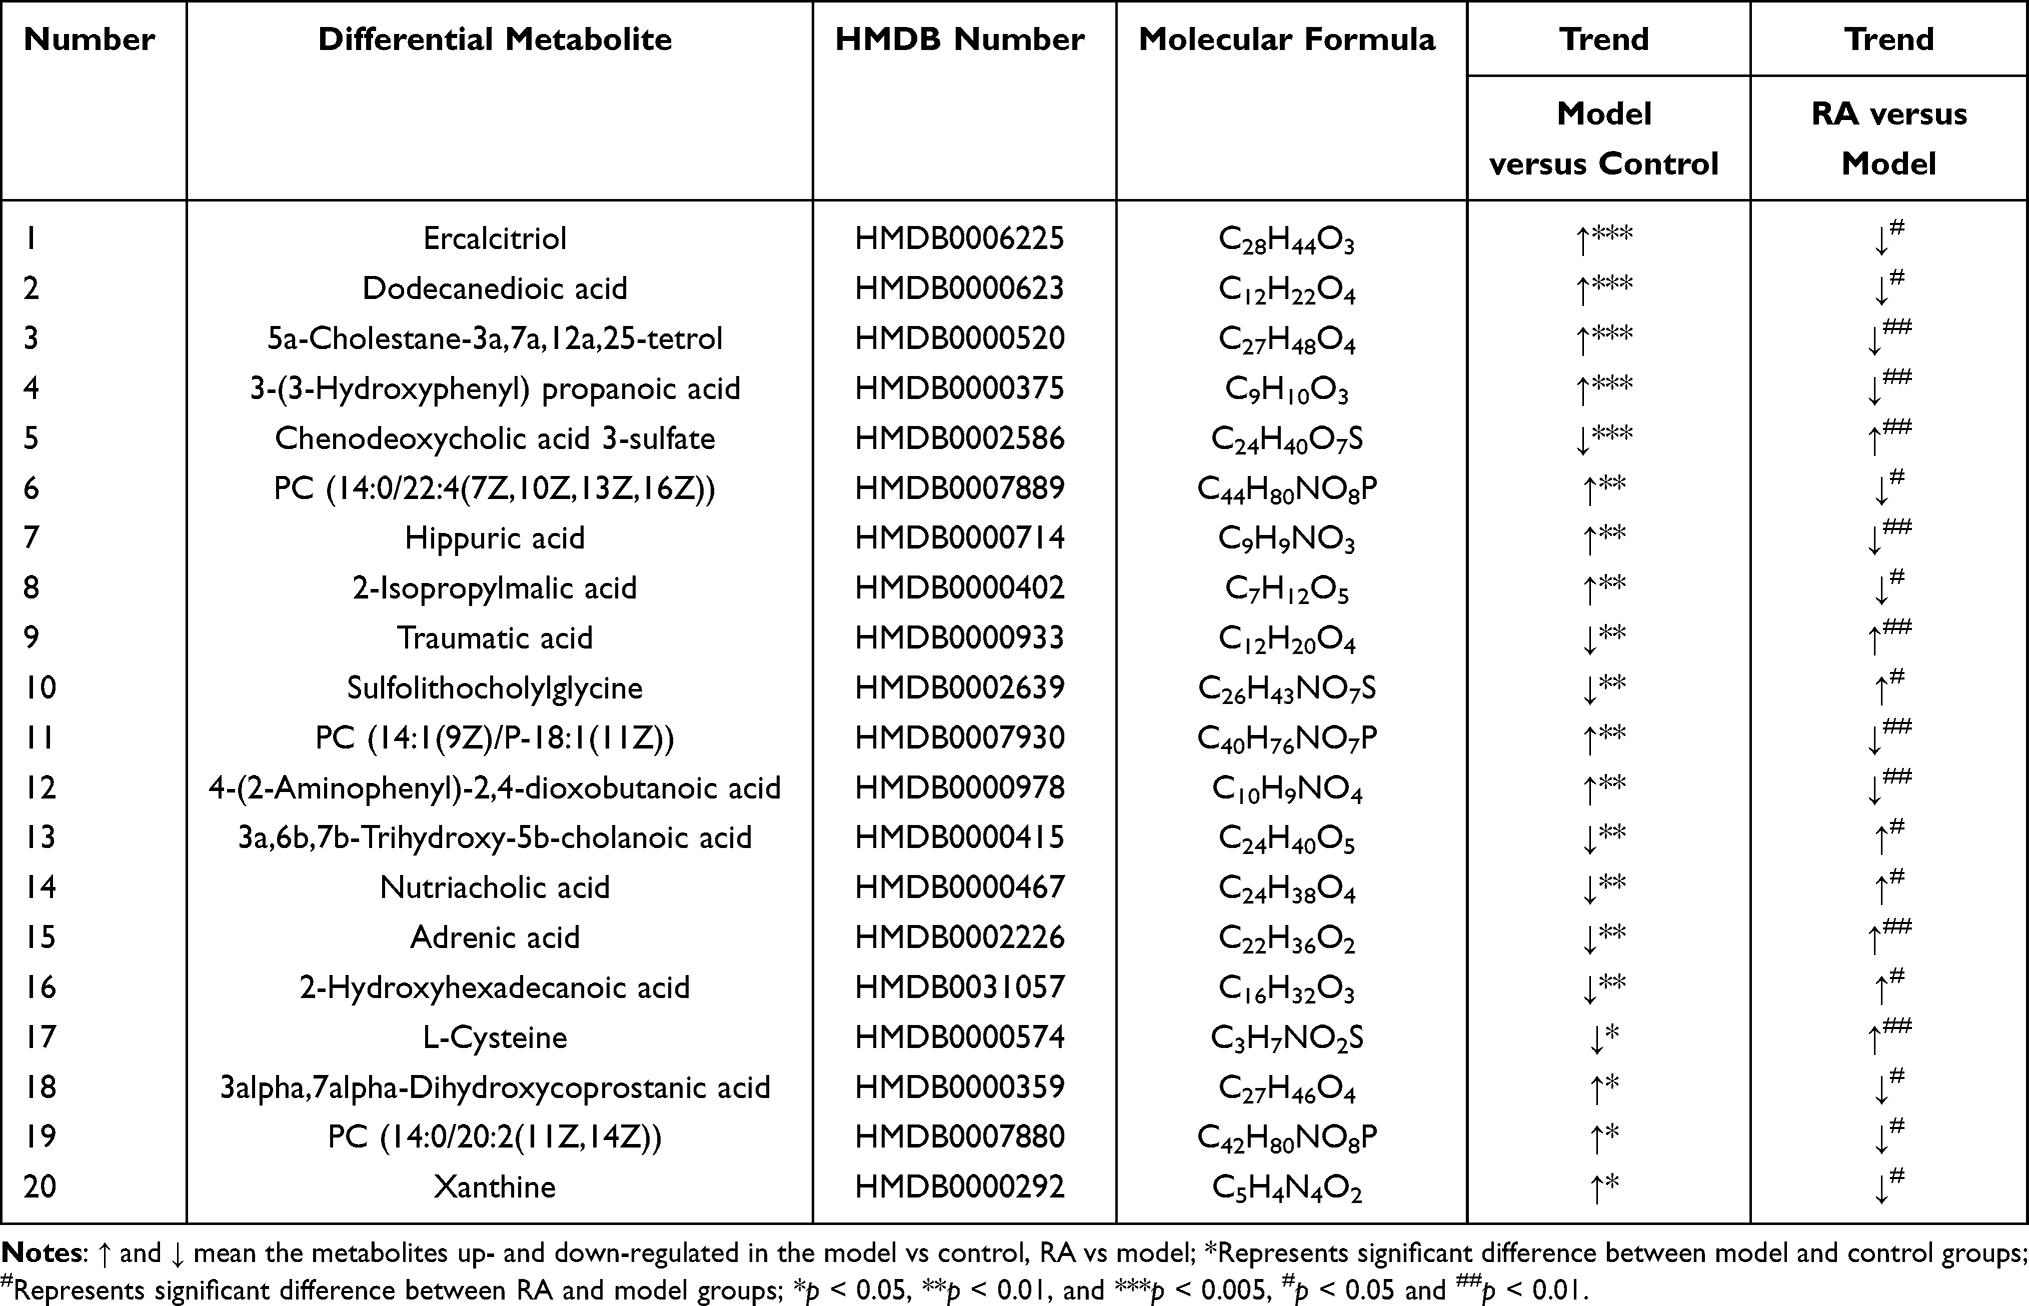 |
Table 1 Identified Different Metabolites Among Groups in Feces |
Then, the data of potential markers were used to obtain the differential metabolic pathways. The bubble charts indicated that RA administration resulted in the regulation of lipid metabolism pathways in feces (such as glycerophospholipid metabolism, linoleic acid metabolism and other fatty acid-related metabolism pathways), bile acid metabolism pathway (metabolism primary bile acid biosynthesis) and key amino acid metabolism pathways (e.g., tryptophan metabolism, taurine and hypotaurine metabolism, phenylalanine metabolism, cysteine and methionine metabolism) (Figure 4C). The production of bile acids in the intestine is usually related to the intestinal flora, so we believe that RA not only directly regulates the metabolic pathway (such as linoleic acid metabolism), but also indirectly regulates the microbiota to regulate the bile acid metabolism to ameliorate metabolic disorder in hyperuricemia mice.
Crosstalk Among Gut Microbiome-Metabolome-Hyperuricemia Axis
Furthermore, we investigated the connections between the UA-related indicators, metabolites and intestinal flora in a heatmap by the Spearman correlation coefficient. The result showed that metabolites regulated by RA were positively or negatively associated with species that were restored by RA (Figure 5A). Moreover, all the metabolites and most of intestinal flora were significantly related to hyperuricemia (Figure 5B and C). It could be inferred that the hyperuricemia-ameliorated effects of RA were robustly associated with the discriminative gut microorganisms and fecal metabolites.
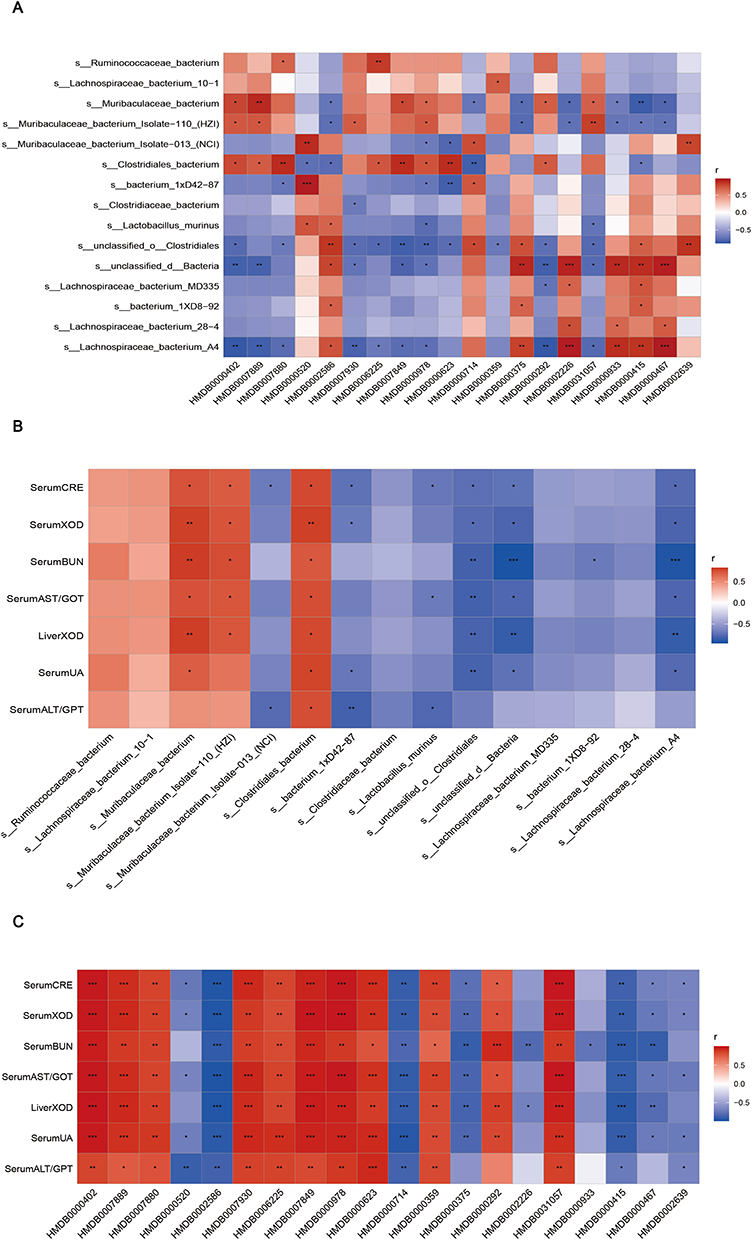 |
Figure 5 Correlation analysis. (A) Spearman correlation between gut microbiota (species level) and metabolic factors. (B) Spearman correlation between gut microbiota (species level) and UA-related indicators. (C) Spearman correlation between metabolic factors and UA-related indicators. *p < 0.05, **p < 0.01, and ***p < 0.005. |
Taken together, RA could repair liver and kidney damage, reduces uric acid levels, and reshape the structure of intestine flora in hyperuricemia mice, especially increasing the abundance of beneficial bacteria and decrease the abundance of pathogenic bacteria. Moreover, RA could accelerate lipid metabolism and amino acid metabolism, and promote the production of bile acid. In the end, the correlation network of the gut microbiome-metabolome-hyperuricemia axis presented the overall correlativity during RA treatment, RA attenuated hyperuricemia by crosstalk between the gut microbiota and concomitant host cometabolites.
Discussion
In clinical practice, the first-line drugs typically used for hyperuricemia are associated with severe liver and kidney damage, thereby limiting their safe application.6 Fortunately, RA is a natural medicinal and edible Chinese medicine with a long history of application in the treatment of metabolic disorders.21,22 More importantly, contemporary pharmacological investigations have indicated that RA can be used to lower UA. However, whether the gut microbiota plays a crucial role in the mechanism of RA in hyperuricemia remains to be elucidated. As expected, the present study confirmed that RA-treated mice exhibited considerable improvement, such as reduced serum levels of UA, CRE and BUN and improved kidney injury. Excitingly, we found that RA can protect the kidneys by inhibiting the activity of XOD, an enzyme that converts purines to UA. In line with the data in the former part, the appropriate decrease in excessive XOD levels attenuated oxidative stress in renal tubular epithelial cells, alleviated tubular damage and restored renal function.23 Ingeniously, the decrease in the ALT/AST index indicated that RA even ameliorated the liver damage caused by the modeling agent PO. In summary, we found that RA has the effect of treating hyperuricemia.
The 16S rRNA sequencing showed that the richness and diversity of the gut microbiota in untreated hyperuricemia mice were decreased, while these effects were reversed by RA administration. Hyperuricemia leads to disorders of the intestinal flora, but RA can regulate the structure of the intestinal flora to lower UA.24 More specifically, given that the relative abundance of Firmicutes and Bacteroidetes dominated the microecology,25 we speculated that RA might treat hyperuricemia by upregulating the abundance of beneficial bacteria in Firmicutes (Lactobacillus, Lachnospiraceae, Ileibacterium and Peptococcaceae) and downregulating pathogenic bacteria in Bacteroidetes (Prevotellaceae, Rikenellaceae and Bacteroidaceae). Moreover, Lactobacillus and Lachnospiraceae were reported to be able to protect the intestinal mucosal barrier and against the inflammatory response by increasing acetate content.26,27 Ileibacterium and Peptococcaceae have been reported to be positively correlated with metabolic diseases.28,29 Next, at the species level, in line with our heatmap of correlation observation, the relative abundances of Lactobacillus murine, Lachnospiraceae_bacterium_MD335 and Lachnospiraceae_bacterium_A4 were increased after RA intervention compared with untreated mice. In addition, the correlation analysis suggested that murine Lactobacillus was involved in inhibiting XOD activity in serum and improving liver and kidney functions. Murine Lactobacillus has been reported to be able to improve immunity to prevent late-onset sepsis and reduce diabetes and obesity.30,31 In addition, the literature reported the negative correlation of Lachnospiraceae_bacterium with metabolic diseases, including type 2 diabetes and obesity.32–34 Meanwhile, Lachnospiraceae_bacterium and Lachnospiraceae bacterium 28_4 were previously reported to be enriched in healthy controls compared to hyperuricemia groups, and the authors implied that the treatment effect of the bacteria may be related to its protection of the intestinal barrier.35 Moreover, Lachnospiraceae_bacterium_A4 has been reported to be the key bacterial species in obesity-resistant mice.36 Indeed, evidence suggests that XOD is likely to be an intermediate factor in the gut-kidney axis.37 Overall, we determined that RA can increase the abundance of beneficial bacteria and decrease the abundance of pathogenic bacteria in hyperuricemia mice.
We used off-target metabolomics techniques to confirm the predicted metabolic pathways. The results indicated that RA ameliorated hyperuricemia by regulating metabolic disturbances. In the gut, bile acids are involved in lipid transport and can affect the condition of the body by modulating the gut microbiota.38 RA upregulated the level of chenodeoxycholic acid 3-sulfate, sulfolithocholylglycine, 3a,6b,7b-Trihydroxy-5b-cholanoic acid and nutriacholic acid. Coincidentally, evidence has shown that chenodeoxycholic acid reduces liver damage by regulating inflammation.39 We speculated that RA protected liver tissue in hyperuricemia mice, possibly by regulating the abundance of chenodeoxycholic acid 3-sulfate. As bile acids promote the absorption of lipids and their metabolic intermediates (eg, glycerophospholipids and linoleic acid), we then turned our attention to lipid metabolism. Some scholars reported previously that disorders of glycerophospholipid metabolism can be a marker of hyperuricemia,40,41 which were improved by RA in the present study. Glycerophospholipids can be hydrolyzed by phospholipid enzymes such as phospholipase A (2) (PLA2) in vivo and UA can induce the activity of PLA2.42 Phosphatidylcholine (PC) participates in the circulation by PLA2.43 In particular, we found that the content of PC (14:0/22:4 (7Z, 10Z, 13Z, 16Z)) and PC (14:1(9Z)/P-18:1(11Z)) was elevated in hyperuricemia mice but was downregulated after RA intervention. This result was consistent with previous research showing that the levels of PC were negatively related in patients with hyperuricemia, and the authors believed that the substances could be used as indicators for patient detection.44 In our research, the level of hippuric acid in hyperuricemia was deduced by RA but increased L-cysteine. A previous study investigated whether hippuric acid was regarded as the target metabolite in hyperuricemia patients and whether L-cysteine was involved in the construction of peptides that inhibit XOD activity from inhibiting UA production.45,46 We speculated that abnormal metabolism of glycerophospholipids, bile acids and amino acids could provide new insights into the mechanism of RA in the treatment of hyperuricemia.
Conclusion
This study indicates that RA has a therapeutic effect on hyperuricemia mice, which is mostly attributed to the modulation of gut microbiota and metabolism. Our finding reveals a novel biochemical mechanism of RA against hyperuricemia, which has a certain indication on the dietary structure of people with hyperuricemia.
Abbreviations
RA, Radix Astragali; PO, potassium oxonate; UA, uric acid; ALL, allopurinol; CRE, creatinine; BUN, blood urea nitrogen; XOD, xanthine oxidase; ALT/AST, Alanine aminotransferase/Aspartate aminotransferase; ANOVA, analysis of variance; UPLC-Q/TOF-MS(ESI-), high performance liquid chromatography-electrospray quadrupole-time of flight tandem mass spectrometry (negative ion mode); VIP, variable importance in projection; LDA, Linear discriminant analysis; Lefse, LDA effect size; PCoA, principal co-ordinates analysis; OPLS-DA, orthogonal partial least squares discrimination analysis; F/B, Firmicutes/Bacteroidetes; SCFAs, short-chain fatty acids; PLA2, phospholipase A(2); PLA2, phospholipase A (2); LysoPC, lysophosphatidylcholine.
Ethics Approval and Informed Consent
The study was supervised and approved by the Animal Ethics Committee of Guangzhou University of Chinese Medicine and conformed to the National Institutes of Health guidelines on the ethical use of animals (Approval No. ZYD-2021-104).
Acknowledgments
This work was supported by the National Natural Science Foundation of China (No. 82174104, 82074142, 22204029), the Joint Funds of the National Natural Science Foundation of China (No. U1903211) and the China Postdoctoral Science Foundation (No. 2021M700957).
Disclosure
The authors report no conflicts of interest in this work.
References
1. Liote F. Hyperuricemia and gout. Curr Rheumatol Rep. 2003;5(3):227–234. doi:10.1007/s11926-003-0072-y
2. Dehlin M, Jacobsson L, Roddy E. Global epidemiology of gout: prevalence, incidence, treatment patterns and risk factors. Nat Rev Rheumatol. 2020;16(7):380–390. doi:10.1038/s41584-020-0441-1
3. Liu R, Han C, Wu D, et al. Prevalence of hyperuricemia and gout in Mainland China from 2000 to 2014: a systematic review and meta-analysis. Biomed Res Int. 2015;2015:762820. doi:10.1155/2015/762820
4. Skoczynska M, Chowaniec M, Szymczak A, Langner-Hetmanczuk A, Maciazek-Chyra B, Wiland P. Pathophysiology of hyperuricemia and its clinical significance - a narrative review. Reumatologia. 2020;58(5):312–323. doi:10.5114/reum.2020.100140
5. Suzuki S, Yoshihisa A, Yokokawa T, et al. Comparison between febuxostat and allopurinol uric acid-lowering therapy in patients with chronic heart failure and hyperuricemia: a multicenter randomized controlled trial. J Int Med Res. 2021;49(12):3000605211062770. doi:10.1177/03000605211062770
6. Zhang S, Xie Q, Xie S, et al. The association between urate-lowering therapies and treatment-related adverse events, liver damage, and major adverse cardiovascular events (MACE): a network meta-analysis of randomized trials. Pharmacotherapy. 2021;41(9):781–791. doi:10.1002/phar.2609
7. Yang T, Richards EM, Pepine CJ, Raizada MK. The gut microbiota and the brain-gut-kidney axis in hypertension and chronic kidney disease. Nat Rev Nephrol. 2018;14(7):442–456. doi:10.1038/s41581-018-0018-2
8. Zhao H, Chen X, Zhang L, et al. Lacticaseibacillus rhamnosus Fmb14 prevents purine induced hyperuricemia and alleviate renal fibrosis through gut-kidney axis. Pharmacol Res. 2022;182:106350. doi:10.1016/j.phrs.2022.106350
9. Sorensen LB, Levinson DJ. Origin and extrarenal elimination of uric acid in man. Nephron. 1975;14(1):7–20. doi:10.1159/000180432
10. El Husseini N, Kaskar O, Goldstein LB. Chronic kidney disease and stroke. Adv Chronic Kidney Dis. 2014;21(6):500–508. doi:10.1053/j.ackd.2014.09.001
11. Crane JK. Role of host xanthine oxidase in infection due to enteropathogenic and Shiga-toxigenic Escherichia coli. Gut Microbes. 2013;4(5):388–391. doi:10.4161/gmic.25584
12. Crane JK, Naeher TM, Broome JE, Boedeker EC, McCormick BA. Role of host xanthine oxidase in infection due to enteropathogenic and Shiga-toxigenic Escherichia coli. Infect Immun. 2013;81(4):1129–1139. doi:10.1128/IAI.01124-12
13. Zheng Y, Ren W, Zhang L, Zhang Y, Liu D, Liu Y. A Review of the Pharmacological Action of Astragalus Polysaccharide. Front Pharmacol. 2020;11:349. doi:10.3389/fphar.2020.00349
14. Zhou X, Sun X, Gong X, et al. Astragaloside IV from Astragalus membranaceus ameliorates renal interstitial fibrosis by inhibiting inflammation via TLR4/NF-small ka, CyrillicB in vivo and in vitro. Int Immunopharmacol. 2017;42:18–24. doi:10.1016/j.intimp.2016.11.006
15. Wang R, Lin F, Ye C, et al. Multi-omics analysis reveals therapeutic effects of Bacillus subtilis-fermented Astragalus membranaceus in hyperuricemia via modulation of gut microbiota. Food Chem. 2023;399:133993. doi:10.1016/j.foodchem.2022.133993
16. Zhang W, Cui Y, Zhang J. Multi metabolomics-based analysis of application of Astragalus membranaceus in the treatment of hyperuricemia. Front Pharmacol. 2022;13:948939. doi:10.3389/fphar.2022.948939
17. Du Y, Wan H, Huang P, Yang J, He Y. A critical review of Astragalus polysaccharides: from therapeutic mechanisms to pharmaceutics. Biomed Pharmacother. 2022;147:112654. doi:10.1016/j.biopha.2022.112654
18. Khan MT, Choudhary MI, Atta R, et al. Tyrosinase inhibition studies of cycloartane and cucurbitane glycosides and their structure-activity relationships. Bioorg Med Chem. 2006;14(17):6085–6088. doi:10.1016/j.bmc.2006.05.002
19. Wang MX, Lin L, Chen YD, et al. Evodiamine has therapeutic efficacy in ulcerative colitis by increasing Lactobacillus acidophilus levels and acetate production. Pharmacol Res. 2020;159:104978. doi:10.1016/j.phrs.2020.104978
20. Wu J, Wang K, Wang X, Pang Y, Jiang C. The role of the gut microbiome and its metabolites in metabolic diseases. Protein Cell. 2021;12(5):360–373. doi:10.1007/s13238-020-00814-7
21. Gao K, Yang R, Zhang J, et al. Effects of Qijian mixture on type 2 diabetes assessed by metabonomics, gut microbiota and network pharmacology. Pharmacol Res. 2018;130:93–109. doi:10.1016/j.phrs.2018.01.011
22. Han C, Jiang YH, Li W, Liu Y, Qi ZQ. Study on the antihypertensive mechanism of astragalus membranaceus and salvia miltiorrhiza based on intestinal flora-host metabolism. Evid Based Complement Alternat Med. 2019;2019:5418796. doi:10.1155/2019/5418796
23. Jiang S, Song D, Zhao H, et al. Bioactivity and component analysis of water extract of sophora japonica against hyperuricemia by inhibiting xanthine oxidase activity. Foods. 2022;11(23):3772. doi:10.3390/foods11233772
24. Wang J, Chen Y, Zhong H, et al. The gut microbiota as a target to control hyperuricemia pathogenesis: potential mechanisms and therapeutic strategies. Crit Rev Food Sci Nutr. 2022;62(14):3979–3989. doi:10.1080/10408398.2021.1874287
25. Keyu R, Chunming Y, Yanchun J, Bin C, Liangzhou W. Analysis of intestinal flora in patients with hyperuricemia in Qindao District. J Chin Physician. 2014;12:1649–1651.
26. Markowiak-Kopec P, Slizewska K. The effect of probiotics on the production of short-chain fatty acids by human intestinal microbiome. Nutrients. 2020;12(4):1107. doi:10.3390/nu12041107
27. Sheng S, Chen J, Zhang Y, et al. Structural and functional alterations of gut microbiota in males with hyperuricemia and high levels of liver enzymes. Front Med. 2021;8:779994. doi:10.3389/fmed.2021.779994
28. Gu C, Zhou Z, Yu Z, et al. The microbiota and it’s correlation with metabolites in the gut of mice with nonalcoholic fatty liver disease. Front Cell Infect Microbiol. 2022;12:870785. doi:10.3389/fcimb.2022.870785
29. Soares E, Soares AC, Trindade PL, et al. Jaboticaba (Myrciaria jaboticaba) powder consumption improves the metabolic profile and regulates gut microbiome composition in high-fat diet-fed mice. Biomed Pharmacother. 2021;144:112314. doi:10.1016/j.biopha.2021.112314
30. Rodrigues RR, Gurung M, Li Z, et al. Transkingdom interactions between Lactobacilli and hepatic mitochondria attenuate western diet-induced diabetes. Nat Commun. 2021;12(1):101. doi:10.1038/s41467-020-20313-x
31. Singer JR, Blosser EG, Zindl CL, et al. Preventing dysbiosis of the neonatal mouse intestinal microbiome protects against late-onset sepsis. Nat Med. 2019;25(11):1772–1782. doi:10.1038/s41591-019-0640-y
32. Daniel H, Gholami AM, Berry D, et al. High-fat diet alters gut microbiota physiology in mice. ISME J. 2014;8(2):295–308. doi:10.1038/ismej.2013.155
33. Kameyama K, Itoh K. Intestinal colonization by a Lachnospiraceae bacterium contributes to the development of diabetes in obese mice. Microbes Environ. 2014;29(4):427–430. doi:10.1264/jsme2.ME14054
34. Zeng H, Ishaq SL, Zhao FQ, Wright AG. Colonic inflammation accompanies an increase of beta-catenin signaling and Lachnospiraceae/Streptococcaceae bacteria in the hind gut of high-fat diet-fed mice. J Nutr Biochem. 2016;35:30–36. doi:10.1016/j.jnutbio.2016.05.015
35. Lee Y, Werlinger P, Suh JW, Cheng J. Potential probiotic lacticaseibacillus paracasei MJM60396 prevents hyperuricemia in a multiple way by absorbing purine, suppressing xanthine oxidase and regulating urate excretion in mice. Microorganisms. 2022;10(5):851. doi:10.3390/microorganisms10050851
36. Hongbin Z, Wei S, Jing W, et al. Correlation of gut microbiota with susceptibility to high-fat diet-induced obesity in mice: a metagenomic study. J Third Mil Med Univ. 2017;39:773–780.
37. Liu ZQ, Sun X, Liu ZB, Zhang T, Zhang LL, Wu CJ. Phytochemicals in traditional Chinese medicine can treat gout by regulating intestinal flora through inactivating NLRP3 and inhibiting XOD activity. J Pharm Pharmacol. 2022;74(7):919–929. doi:10.1093/jpp/rgac024
38. Wu T, Wang G, Xiong Z, et al. Probiotics interact with lipids metabolism and affect gut health. Front Nutr. 2022;9:917043. doi:10.3389/fnut.2022.917043
39. Lee D, Park JS, Kim D, Hong HS. Substance P hinders bile acid-induced hepatocellular injury by modulating oxidative stress and inflammation. Antioxidants. 2022;11(5). doi:10.3390/antiox11050920
40. Qin N, Jiang Y, Shi W, et al. High-throughput untargeted serum metabolomics analysis of hyperuricemia patients by UPLC-Q-TOF/MS. Evid Based Complement Alternat Med. 2021;2021:5524772. doi:10.1155/2021/5524772
41. You L, Zheng F, Su C, et al. Metabolome-wide association study of serum exogenous chemical residues in a cohort with 5 major chronic diseases. Environ Int. 2022;158:106919. doi:10.1016/j.envint.2021.106919
42. Lai CL, Xing JP, Liu XH, et al. Relationships of inflammatory factors and risk factors with different target organ damage in essential hypertension patients. Chin Med J. 2017;130(11):1296–1302. doi:10.4103/0366-6999.206343
43. Law SH, Chan ML, Marathe GK, Parveen F, Chen CH, Ke LY. An updated review of lysophosphatidylcholine metabolism in human diseases. Int J Mol Sci. 2019;20(5):1149. doi:10.3390/ijms20051149
44. Akhigbe RE, Hamed MA, Odetayo AF, Akhigbe TM, Ajayi AF, Ajibogun FAH. Omega-3 fatty acid rescues ischaemia/perfusion-induced testicular and sperm damage via modulation of lactate transport and xanthine oxidase/uric acid signaling. Biomed Pharmacother. 2021;142:111975. doi:10.1016/j.biopha.2021.111975
45. Jang IT, Hyun SH, Shin JW, Lee YH, Ji JH, Lee JS. Characterization of an anti-gout xanthine oxidase inhibitor from Pleurotus ostreatus. Mycobiology. 2014;42(3):296–300. doi:10.5941/MYCO.2014.42.3.296
46. Liu Y, Yu P, Sun X, Di D. Metabolite target analysis of human urine combined with pattern recognition techniques for the study of symptomatic gout. Mol Biosyst. 2012;8(11):2956–2963. doi:10.1039/c2mb25227a
 © 2023 The Author(s). This work is published and licensed by Dove Medical Press Limited. The full terms of this license are available at https://www.dovepress.com/terms.php and incorporate the Creative Commons Attribution - Non Commercial (unported, v3.0) License.
By accessing the work you hereby accept the Terms. Non-commercial uses of the work are permitted without any further permission from Dove Medical Press Limited, provided the work is properly attributed. For permission for commercial use of this work, please see paragraphs 4.2 and 5 of our Terms.
© 2023 The Author(s). This work is published and licensed by Dove Medical Press Limited. The full terms of this license are available at https://www.dovepress.com/terms.php and incorporate the Creative Commons Attribution - Non Commercial (unported, v3.0) License.
By accessing the work you hereby accept the Terms. Non-commercial uses of the work are permitted without any further permission from Dove Medical Press Limited, provided the work is properly attributed. For permission for commercial use of this work, please see paragraphs 4.2 and 5 of our Terms.