")
Back to Journals » International Journal of Nanomedicine » Volume 11
1,3-Bis(2-chloroethyl)-1-nitrosourea-loaded bovine serum albumin nanoparticles with dual magnetic resonance–fluorescence imaging for tracking of chemotherapeutic agents
Authors Wei K, Lin F, Huang C, Ma CM, Chen J, Feng L, Yang H
Received 26 May 2016
Accepted for publication 12 July 2016
Published 23 August 2016 Volume 2016:11 Pages 4065—4075
DOI https://doi.org/10.2147/IJN.S113589
Checked for plagiarism Yes
Review by Single anonymous peer review
Peer reviewer comments 2
Editor who approved publication: Professor Lei Yang
Kuo-Chen Wei,1 Feng-Wei Lin,2 Chiung-Yin Huang,1 Chen-Chi M Ma,3 Ju-Yu Chen,1 Li-Ying Feng,1 Hung-Wei Yang2
1Department of Neurosurgery, Chang Gung Memorial Hospital, School of Medicine, Chang Gung University, Taoyuan, 2Institute of Medical Science and Technology, National Sun Yat-sen University, Kaohsiung, 3Department of Chemical Engineering, National Tsing Hua University, Hsinchu, Taiwan, Republic of China
Abstract: To date, knowing how to identify the location of chemotherapeutic agents in the human body after injection is still a challenge. Therefore, it is urgent to develop a drug delivery system with molecular imaging tracking ability to accurately understand the distribution, location, and concentration of a drug in living organisms. In this study, we developed bovine serum albumin (BSA)-based nanoparticles (NPs) with dual magnetic resonance (MR) and fluorescence imaging modalities (fluorescein isothiocyanate [FITC]-BSA-Gd/1,3-bis(2-chloroethyl)-1-nitrosourea [BCNU] NPs) to deliver BCNU for inhibition of brain tumor cells (MBR 261-2). These BSA-based NPs are water dispersible, stable, and biocompatible as confirmed by XTT cell viability assay. In vitro phantoms and in vivo MR and fluorescence imaging experiments show that the developed FITC-BSA-Gd/BCNU NPs enable dual MR and fluorescence imaging for monitoring cellular uptake and distribution in tumors. The T1 relaxivity (R1) of FITC-BSA-Gd/BCNU NPs was 3.25 mM-1 s-1, which was similar to that of the commercial T1 contrast agent (R1 =3.36 mM-1 s-1). The results indicate that this multifunctional drug delivery system has potential bioimaging tracking of chemotherapeutic agents ability in vitro and in vivo for cancer therapy.
Keywords: drug tracking, fluorescence imaging, MR imaging, BSA nanoparticles, cancer therapy
Introduction
The most common type of malignant brain tumor is malignant glioma, which comprises >50% of patients with glioblastoma multiforme.1 The current standard treatments of glioblastoma multiforme patients are surgery, radiotherapy, and chemotherapy, with an average patient survival of 6–24 months posttreatment.2 The chemotherapeutic agents carmustine (1,3-bis(2-chloroethyl)-1-nitrosourea [BCNU]) and temozolomide have been used for the clinical treatment of malignant brain tumors. However, their efficiency is severely limited by systemic cytotoxic effects3 and lack of sufficient penetration through the blood–brain barrier and/or blood–brain tumor barrier,4,5 which in turn blocks delivery of >98% of central nervous system drugs to the brain.6 Recently, a new technique using focused ultrasound in the presence of microbubbles was used to locally, noninvasively, and temporarily open the blood–brain barrier for enhancing the local concentration of therapeutic agents in the brain.7–9
Other limitations of BCNU and temozolomide include their poor solubility, systemic toxicity, and short half-life in the human body. To date, many approaches have been proposed to improve the therapeutic effects of BCNU and enhance its stability, including polymeric nanoparticles (NPs), polymer biochips, magnetic NPs, graphene oxide, and liposomes,10–14 but their safety and biocompatible issues still remain unclear. Albumin is the most abundant protein with a molecular weight of 66.5 kDa in plasma (35–50 g/L human serum), which is stable in a wide pH range (pH 4–9), biocompatible, biodegradable, nontoxic, and nonimmunogenic. In addition, it can be heated at 60°C for up to 10 hours without any deleterious effects; these abovementioned advantages make albumin an ideal candidate for drug delivery (ie, human serum albumin or bovine serum albumin [BSA]).15 In tumor-bearing subjects, NPs can accumulate passively through the enhanced permeability and retention effect into tumors due to the abnormal physiology and anatomy of tumors.16 In addition, tumors tend to trap plasma proteins and utilize their degradation products for proliferation, which means that the albumin-based NPs are easily trapped by cancer cells by the 60 kDa glycoprotein receptor binding.17,18
Recently, NP-based contrast agents have attracted extraordinary attention for functional and molecular imaging investigations.19,20 It has been reported that multimolecular imaging modalities provide complementary information for concurrent imaging applications and hence have become an attractive area of investigation (ie, magnetic resonance [MR]/fluorescence imaging, photoinduced electron transfer/fluorescence, MR/ultrasound imaging, and photoinduced electron transfer/CT).21–25 Among the many imaging techniques, MR imaging has been accredited to be one of the most powerful and noninvasive diagnostic devices for humans. However, obtaining detailed biological information on a subcellular level is difficult owing to limited resolution and low sensitivity of MR imaging. Therefore, MR imaging should be combined with other imaging probes for synergistic enhancement of its respective components.
In this study, the BCNU-encapsulated fluorescein isothiocyanate-BSA (FITC-BSA) NPs were prepared by desolvation–denaturation method and conjugated with diethylenetriaminepentaacetic acid gadolinium(III) dihydrogen salt hydrate (DTPA-Gd) to form dual-modality nanomedicine (FITC-BSA-Gd/BCNU NPs). The cellular uptake of FITC-BSA-Gd/BCNU NPs was determined by fluorescence microscopy in MBR 261-2 brain tumor cells, and their in vivo distribution was also monitored by MR imaging in the brain tumor tissue. Finally, antitumor efficacy studies of FITC-BSA-Gd/BCNU NPs were conducted in vitro.
Materials and methods
Chemicals
BSA, FITC-BSA, ethanol, ethylenediamine, 1-ethyl-3-(3-dimethylaminopropyl) carbodiimide hydrochloride (EDC), N-hydroxysulfosuccinimide sodium salt (sulfo-NHS), DTPA-Gd, 2-(N-morpholino)ethanesulfonic acid hydrate (MES), carmustine (BCNU), and XTT sodium salt were purchased from Sigma-Aldrich Co. (St Louis, MO, USA). MBR 261-2 human brain tumor cells were obtained from the laboratory of Dr Kuo-Chen Wei, Chang Gung Memorial Hospital (Taiwan) and were maintained in Dulbecco’s Modified Eagle’s Medium (DMEM) supplemented with 10% fetal bovine serum, which was purchased from Biological Industries (Cromwell, CT, USA). DMEM, gentamicin, penicillin, streptomycin, and Hank’s balanced salt solution were purchased from Thermo Fisher Scientific (Waltham, MA, USA). Deionized (DI) water was used in all experiments.
Synthesis of BCNU-encapsulated BSA NPs labeled with dual contrast agents
The synthesis of protein NPs by desolvation method was done based on a previous report with minor modifications.26 Briefly, 20 mg of BSA and 1 mg of FITC-BSA were dissolved in 2 mL of sodium chloride solution (10 mM) and stirred for 1 hour. Different concentrations of BCNU were added to the above solution and incubated for another 2 hours before the synthesis of the NPs. Then, ethanol was added dropwise into the BSA solution under magnetic stirring (500 rpm) at room temperature till the solution became turbid (the particle size depends on the turbidity). To stabilize BSA NPs, the turbid solution was stirred continuously for 30 minutes without further addition of ethanol. After that, the as-prepared BSA NPs were denatured at 70°C for 30 minutes to form FITC-BSA/BCNU NPs. The particles were then centrifuged and washed with distilled water and then suspended in phosphate-buffered saline (PBS) at pH 7.4, which resembles the physiological conditions in the body.
To calculate the concentrations of BCNU loaded in the FITC-BSA NPs, supernatant samples were analyzed by high-performance liquid chromatography (HPLC) on a SUPELCOSIL™ LC-18 column (4.6×250 mm) using an L-2130 pump and an L-2400 UV-detector (Hitachi L-2000; Hitachi Ltd., Tokyo, Japan). The mobile phase was a 40:60 (v/v) mixture of DI water and methanol with a flow rate of 2 mL/min; data were measured at 270 nm. We also used Fourier transform infrared spectroscopy (FTIR; BRUKER T-27, Bruker Optik GmbH, Ettlingen, Germany) to identify whether BCNU was indeed encapsulated in BSA NPs.
In order to conjugate the MR imaging contrast agent on the surface of FITC-BSA/BCNU NPs, the DTPA-Gd has to be modified with ethylenediamine first to form amine-terminated DTPA-Gd. Briefly, 0.2 mL activation solution (24 mg of EDC and 27 mg of sulfo-NHS in 2 mL of 0.5 M MES buffer [pH 6.3]) was mixed with 0.2 mL of DTPA-Gd (5 mg/mL) at 25°C and reacted for 60 minutes in the dark to allow the formation of amide bonds between activated carboxyl groups. The activated DTPA-Gd was reacted with ethylenediamine at 25°C for 3 hours in the dark to form amine-terminated DTPA-Gd.
A 0.2 mL of activation solution (EDC/sulfo-NHS) was mixed with 0.2 mL of FITC-BSA/BCNU NPs (3 mg/mL) at 25°C and reacted for 30 minutes in the dark to activate the carboxylic groups of FITC-BSA/BCNU. Activated FITC-BSA/BCNU was washed three times with 0.1 M of MES buffer, resuspended in 0.2 mL of 0.1 M of MES buffer, and then mixed with 0.05 mL of amine-functionalized DTPA-Gd (2 mg/mL) at 4°C by vortexing for 12 hours. The product was then separated from the solution, washed with DI water, and centrifuged at 8,217× g for 20 minutes to remove both MES buffer and unbound amine-terminated DTPA-Gd and finally dispersed in DI water to obtain FITC-BSA-Gd/BCNU. The concentration of unbound DTPA-Gd was quantified using MR phantoms compared with the DTPA-Gd standard curve. The product was then lyophilized and stored at −20°C for further use.
In vitro drug release
Five milliliters of FITC-BSA/BCNU or FTIC-BSA-Gd/BCNU samples were placed in dialysis bags and then put in a beaker containing 5 mL of PBS (pH 7.4) at 37°C. Drug release was assumed to start as soon as the dialysis bags were placed into the beaker. The release beaker was constantly stirred, and the dialysis bags were taken out at various time points and the supernatant was drawn out for characterization. The concentrations of BCNU released from FITC-BSA/BCNU or FTIC-BSA-Gd/BCNU into PBS in the beaker were quantified using HPLC.
Fluorescence phantoms of FITC-BSA-Gd/BCNU NPs
Fluorescence images were taken by dropping different concentrations of FITC-BSA-Gd/BCNU NP solution on the plastic plate. Scanning was performed using fluorescent microscopy (SZX7; Olympus Corporation, Tokyo, Japan), and the fluorescence intensity was analyzed using ImageJ software.
MR phantoms of FITC-BSA-Gd/BCNU NPs
For in vitro measurements, pure DTPA-Gd and FITC-BSA-Gd/BCNU were diluted to different concentrations of DTPA-Gd containing physiological saline. Circular wells (inner diameter =5 mm) were filled with 200 μL of contrast agent sample or physiological saline as control and were placed in the MR scanner (Clinscan, 7T; Bruker Optik GmbH). Spin–lattice relaxivity maps were calculated from two T1-weighted images with different flip angles (gradient recalled echo sequence, repetition time (TR)/echo time (TE) =2.3 ms/0.76 ms, slide thickness =0.8 mm, matrix =132×192, and flip angle =5°/20°). The correlation between R1 (=1/T1) mapping and DTPA-Gd concentration was determined.
Cellular uptake
The cellular internalization of FITC-BSA-Gd NPs by cancer cells was evaluated by fluorescent microscopy. For the cellular uptake studies, MBR 261-2 cells were seeded at a density of 10,000 cells per well (ie, 150 μL of a suspension of 6.67×10⁴ cells/mL) in a 96-well plate. After 24 hours of cell attachment, the wells were carefully washed with PBS followed by the addition of 100 μg/mL of FITC-BSA-Gd NPs for 8 hours. Next, the cells were washed twice with PBS (pH=7.4) to remove the residual FITC-BSA-Gd NPs and fixed with fresh ice ethanol for 5 minutes at room temperature. Cells were washed three times with Hank’s balanced salt solution and then their nuclei were stained using Hoechst. The distribution of FITC-BSA-Gd on cells was analyzed by inverted fluorescent microscopy (Eclipse Ti-S; Nikon Instruments, Melville, NY, USA).
DNA interstrand crosslinking
To confirm the cytotoxic effects of BSA-Gd/BCNU, an ethidium bromide fluorescence assay was used to measure the level of DNA interstrand crosslinking in MBR 261-2 cells according to our previous report.27 The cells were exposed to different concentrations (5–80 μg/mL) of BSA-Gd/BCNU and incubated for 12 hours or 36 hours. After incubation, ~1×10⁶ cells were collected by centrifugation at 1,509× g for 8 minutes at 8°C and resuspended in PBS. A total of 40 mL of the cell suspension was incubated for 15 minutes at 4°C with 200 μL of lysis buffer. After lysis, the cell pellets were separated by centrifugation at 4,193× g for 6 minutes, and the suspension was incubated with 25 μL of heparin (500 IU/mL) for another 20 minutes at 37°C, followed by the addition of 1 mL of ethidium bromide solution. The mixture was heated for 5 minutes at 100°C to denature the DNA and then cooled in an ice bath for 6 minutes for renaturation. Fluorescence was measured with excitation and emission wavelengths of 525 nm and 580 nm, respectively. The percentage of DNA interstrand crosslinking (C) was calculated using the following equation:
|
|

where fb and fa are the fluorescence before and after heat denaturation for treated (t) and untreated (u) cells, respectively.
In vivo MR-fluorescence imaging
For MR imaging, a 7 T MR scanner and a four-channel surface coil were used. The mouse was placed in an acrylic holder, positioned in the center of the magnet, and anesthetized with isoflurane gas (1%–2%) at 50–70 breaths per minute during the entire MR imaging procedure. The distribution of FITC-BSA-Gd/BCNU was investigated after injection; the animals were relocated into the MR imaging scanning room for imaging after 10 minutes of injection. Contrast-enhanced T1-weighted images with different flip angles were acquired to calculate spin–lattice relaxivity maps by transferring two images with different flip angles (gradient recalled echo sequence, TR/TE =2.3 ms/0.76 ms, slice thickness =0.8 mm, slice number =14, matrix =132×192, and flip angle =5°/20°).
In vitro cytotoxicity assay
MBR 261-2 cells were cultured in DMEM supplemented with 2.2 mg/mL sodium carbonate, 10% fetal bovine serum, 50 μg/mL gentamicin, 50 μg/mL penicillin, and 50 μg/mL streptomycin at 37°C and 5% CO2. Approximately 10,000 cells (ie, 150 μL of a suspension of 6.67×10⁴ cells/mL) were placed in each well of a 96-well culture plate and incubated in a humidified chamber at 37°C and 5% CO2 for 24 hours. Different concentrations of BSA-Gd/BCNU (50 μL each) were added to the medium, and incubation was continued for 12 hours or 36 hours. Before counting, the culture medium was removed, and the cells were incubated in 120 μL of XTT solution for 2 hours. Subsequently, 100 μL of XTT solution was removed from each well and transferred to a 96-well counting dish. The cytotoxicity toward MBR 261-2 cells in vitro was evaluated by measuring the optical density at 490 nm using an enzyme-linked immunosorbent assay reader.
Animal study
All animal experiments were approved by the Institutional Animal Care and Use Committee of Chang Gung University and performed in accordance with their guidelines. Mice were raised in a room with a thermostat at 26°C. C57BL/6 mice weighing ~25–30 g (5–6 weeks old) were tested to confirm the efficacy of the proposed approach. Hypodermic brain tumors were induced in another 24 mice. Briefly, cultured MBR 261-2 tumor cells (2×10⁶ cells per mouse) were injected over a 2-minute period into the hypoderm using a syringe, and needle withdrawal was carried out over another period of 0.5 minute.
Experiments were performed with three groups of mice (n=5). Control mice received no further treatment after tumor cell injection and growth. The second group received a single dose of FITC-BSA-Gd NPs (20 mg/kg) via local tumor injection while the tumor volume grew to ~200 mm3. The third group received a single dose of FITC-BSA-Gd/BCNU NPs (20 mg/kg containing ~5.5 mg of BCNU) via local tumor injection while the tumor volume grew to ~200 mm3. For ethical reasons, animals were euthanized when the volume of the tumor reached 3 cm3, which was defined as survival time. The tumor volume was calculated as: tumor volume (V) = length × width × width/2.
Results and discussion
Preparation and characterization of BCNU-encapsulated BSA NPs
In this study, we used the dissolvent method to prepare the self-assembling fluorescent BSA NPs (FITC-BSA NPs) by mixing BSA and FITC-BSA with smooth surfaces, good dispersion, and uniform size distribution (Figure 1A). The mean diameter measured using Zetasizer (NanoParticle SZ-100Z, Horiba Instruments, Kyoto, Japan) was 211.7±3.8 nm, which was slightly greater than that measured using a scanning electron microscope (194.8±5.3 nm), indicating that FITC-BSA NPs were highly stable with no aggregation in aqueous media (Figure 1B). This is because the diameters of NPs obtained using Zetasizer reflected the hydrodynamic diameters of NPs swollen in aqueous solution, whereas those observed using scanning electron microscope were the diameters of dried NPs. After encapsulation of BCNU, the mean diameter increased to 246.1±4.5 nm but the zeta potential did not significantly change (−63.5±1.2 mV to −66.5±2.5 mV), indicating that most of the BCNU was entrapped in FITC-BSA NPs not adsorbed on the surface, because the negatively charged BCNU adsorbed on the surface would significantly increase the potential. Next, the amine-terminated DTPA-Gd was then conjugated on the surface of FITC-BSA/BCNU by carbodiimide-catalyzed amide formation to form FITC-BSA-Gd/BCNU (287.1±5.1 nm) with the function of dual MR-fluorescence imaging tracking; the maximum conjugation of DTPA-Gd on the NPs was calculated to be 0.47±0.6 μg of DTPA-Gd/μg NPs.
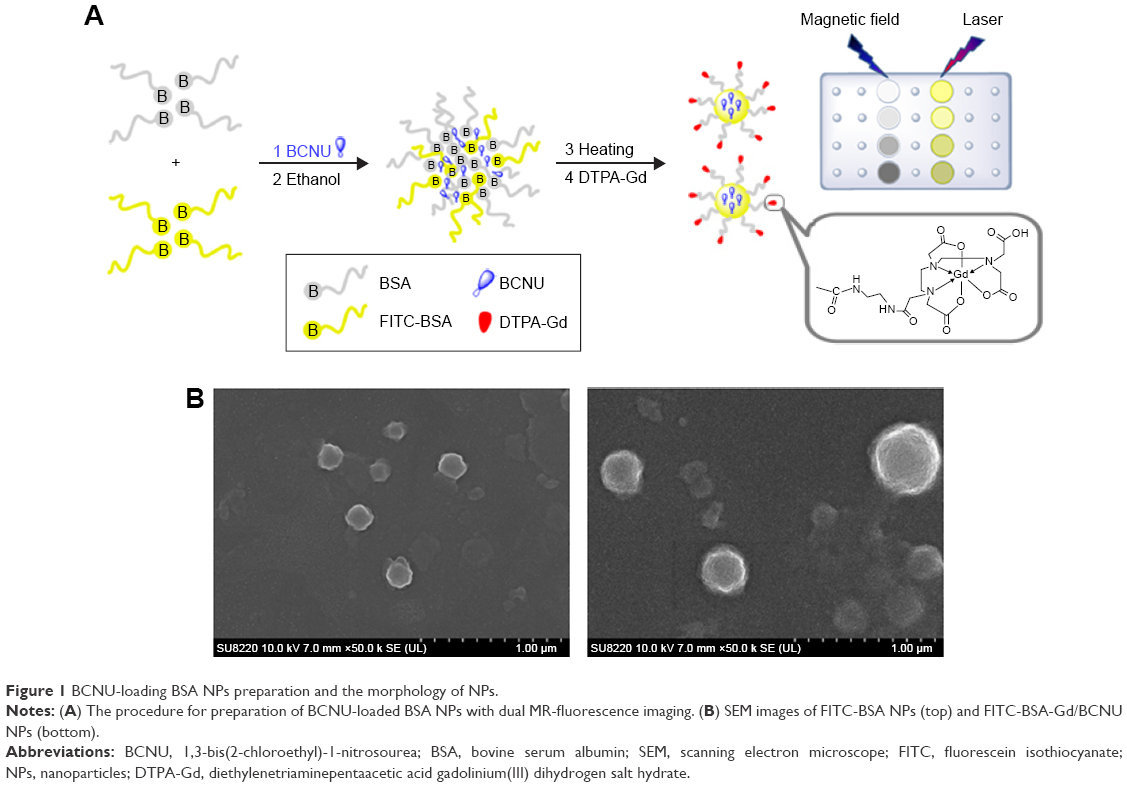 | Figure 1 BCNU-loading BSA NPs preparation and the morphology of NPs. |
FTIR was used to confirm whether BCNU was indeed entrapped in BSA NPs (Figure 2A). The characteristic bands present in BSA NPs are amide I at 1,655 cm−1, amide II band at 1,539 cm−1, and amide III region at 1,240 cm−1.28 The spectrum for BSA/BCNU NPs displayed additional peaks corresponding to the ν of C=O (1,726 cm−1), ν of C–N from C–C–N (1,168 cm−1), ν of N–N (1,089 cm−1), ν of N=O (1,494 cm−1) from N–NO, and ν of C–Cl (662 cm−1) from C–C–Cl.23 The X-ray photoelectron spectroscopy also confirmed the results of FTIR analysis. The BSA NP sample showed C1s, N1s, and O1s peaks at 284 eV, 400 eV, and 532 eV, respectively. After encapsulation of BCNU, a peak at 198 eV (Cl2p) for BSA/BCNU NPs appeared and the signal of N1s was also stronger than that of BSA NPs. Overall, these data indicated that BCNU was indeed entrapped in BSA NPs (Figure 2B).
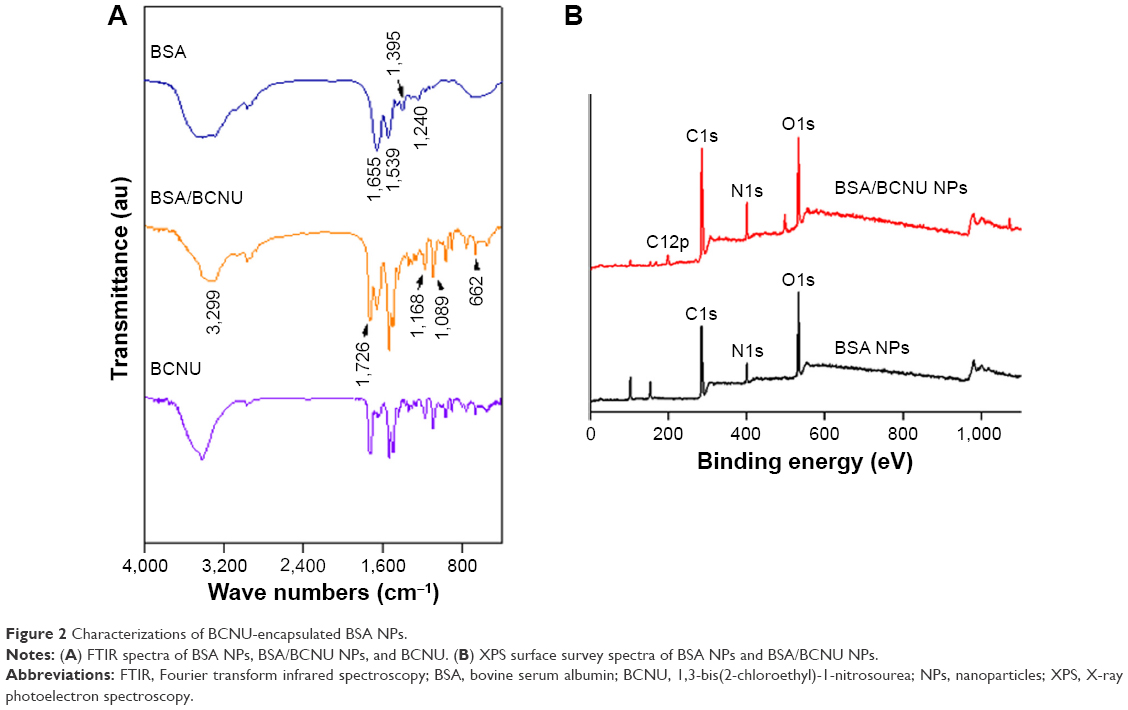 | Figure 2 Characterizations of BCNU-encapsulated BSA NPs. |
Drug encapsulation studies
BCNU must be encapsulated in FITC-BSA-Gd NPs as much as possible in order to prevent waste and to reduce the cost of manufacturing, and also provide an effective therapeutic dose. Various concentrations of BCNU entrapped in BSA NPs were taken and synthesis was done using the desolvation–denaturation method. The supernatant after centrifugation was analyzed using HPLC to determine the amount of free BCNU and then to calculate the encapsulated amount, encapsulating efficiency (EE), and loading efficiency (LE; Figure 3A). The amount of BCNU entrapped in FITC-BSA NPs increased as the weight ratio of BCNU to BSA (BSA/FITC-BSA) increased, reaching a maximum concentration of 2.67±0.07 mg when the ratio was 0.4, but the EE decreased to 0.67±0.02 (67%±2%) from 0.95±0.01 (95%±1%). However, the LE reached the highest value (0.27±0.01; 27%±1%) at this ratio, which was a little higher than the value previously reported by Sadeghi et al29 (~20%). But the LE in our system could not be further enhanced as a part of BCNU attached to BSA molecules was separated because BCNU is soluble in ethanol, resulting in a relatively low LE. Nevertheless, the concentration of entrapped BCNU has been sufficient for the growth inhibition of cancer cells. In addition, BCNU was entrapped in FITC-BSA NPs that could reduce its hydrolysis rate according to our previous study.30 This prevents hydrolysis of 2-chloroethanediazonium ions from BCNU before it enters cancer cells, thus preserving its ability to crosslink DNA.
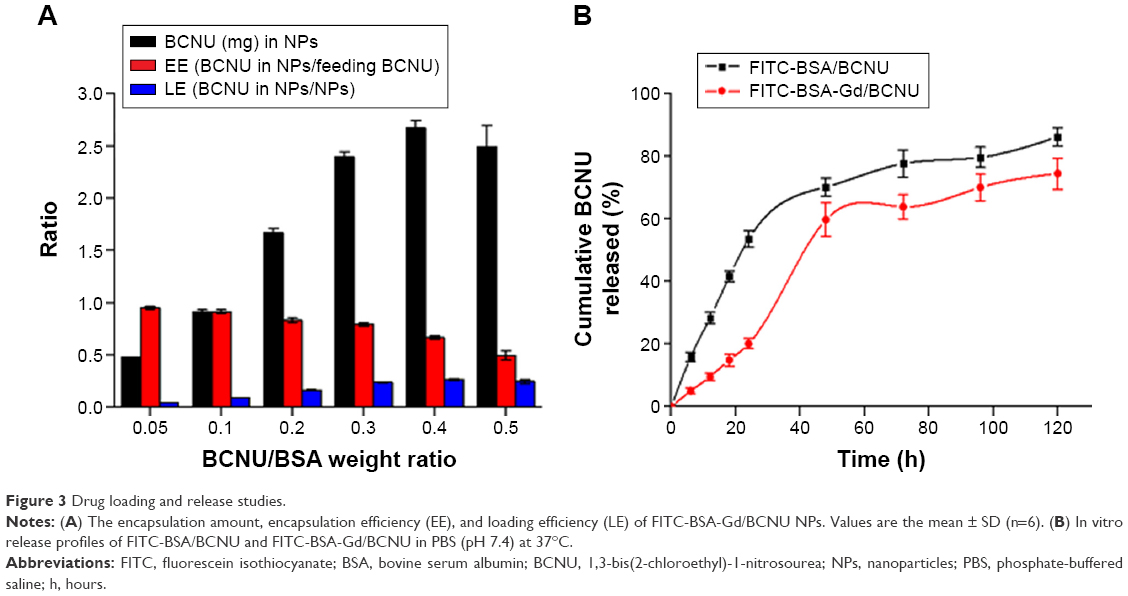 | Figure 3 Drug loading and release studies. |
In vitro drug release
The in vitro drug release profiles of FITC-BSA/BCNU and FITC-BSA-Gd/BCNU over 120 hours are shown in Figure 3B. The mechanism of drug release from BSA NPs was found to be due to diffusion and erosion in the acid environment in the tumor tissues.31 We found that ~53.6%±2.6% of BCNU was rapidly released from FITC-BSA/BCNU during the first 24 hours of incubation at pH 7.4. In the following 24 hours, cumulative release reached 70.2%±2.9%, which could fight continually against cancer cells. Only ~16.03% of BCNU was further released after another 72 hours of incubation. However, BCNU released from FITC-BSA-Gd/BCNU NPs was only 20.1%±1.6%, which was significantly lower than that released from FITC-BSA/BCNU NPs (53.6%±2.6%) at first 24 hours of incubation. This decrease in BCNU release may be due to the fact that conjugation of DTPA-Gd on the NP surface may cause a crosslinking effect between the BSA molecules, resulting in the reduction of erosion and biodegradation of FITC-BSA-Gd/BCNU NPs. The release rate of 50% of BCNU from FITC-BSA-Gd/BCNU NPs was ~41.2 hours, which was much slower than that from FITC-BSA/BCNU NPs (21.8 hours). An accelerated release was observed in the following 24 hours, increasing to 59.8%±5.4% from 20.1%±1.6%, and there was a slow increase in release of BCNU after 72 hours to 74.5%±4.9%. These results indicated that this system could be potentially used for the controlled release chemotherapy by appropriate surface modification.
Properties of dual MR-fluorescence imaging
Each bioimaging technology has its own unique strengths and limitations; thus, the use of a combination of different imaging technologies is emerging and expected to offer more comprehensive diagnostic information on disease progression. Therefore, we developed dual MR-fluorescence imaging drug delivery system for real-time tracking of chemotherapeutic agents. The in vitro phantoms showed that the FITC-BSA-Gd/BCNU exhibited homogenate fluorescence patterns and high correlation ratio (r2=0.988), with the fluorescence intensity being dependent on its concentration (Figure 4A and B). We also validated the T1-weighted contrast ability; the relaxivity of FITC-BSA-Gd/BCNU NPs in aqueous media scanner was examined using 7 T MR. Both the commercial T1 MR contrast agent (DTPA-Gd) and FITC-BSA-Gd/BCNU NPs displayed signal enhancement on the T1-weighted images in a concentration-dependent manner (Figure 4C and D). The R1 of FITC-BSA-Gd/BCNU was determined to be 3.25 mM−1 s−1 using a 7 T MR scanner and exhibited an obvious trend of T1-positive contrast with the increase in DTPA-Gd (Figure 4E), while there was a similar T1-positive contrast compared with commercial DTPA-Gd (3.36 mM−1 s−1; Figure 4F); both have a high correlation ratio (r2=0.984 for DTPA-Gd; r2=0.979 for FITC-BSA-Gd/BCNU NPs). Next, we also investigated the MR T1 contrast ability of FITC-BSA-Gd/BCNU in animal brain. For in vivo MR imaging, FITC-BSA-Gd/BCNU was dispersed in PBS and then locally injected into the brain. The T1-weighted MR images were acquired before and after injection. At 10-minute posttreatment with FITC-BSA-Gd/BCNU (Figure 5A), a significant contrast enhancement at the injection area was observed, indicating that FITC-BSA-Gd/BCNU can enhance T1 relaxation in deep tissues to exhibit a brightened imaging compared with pretreatment (Figure 5B). These results indicated that FITC-BSA-Gd/BCNU could generate sufficiently strong T1-weighted MR imaging contrast enhancement for tracking of chemotherapeutic agents in vivo.
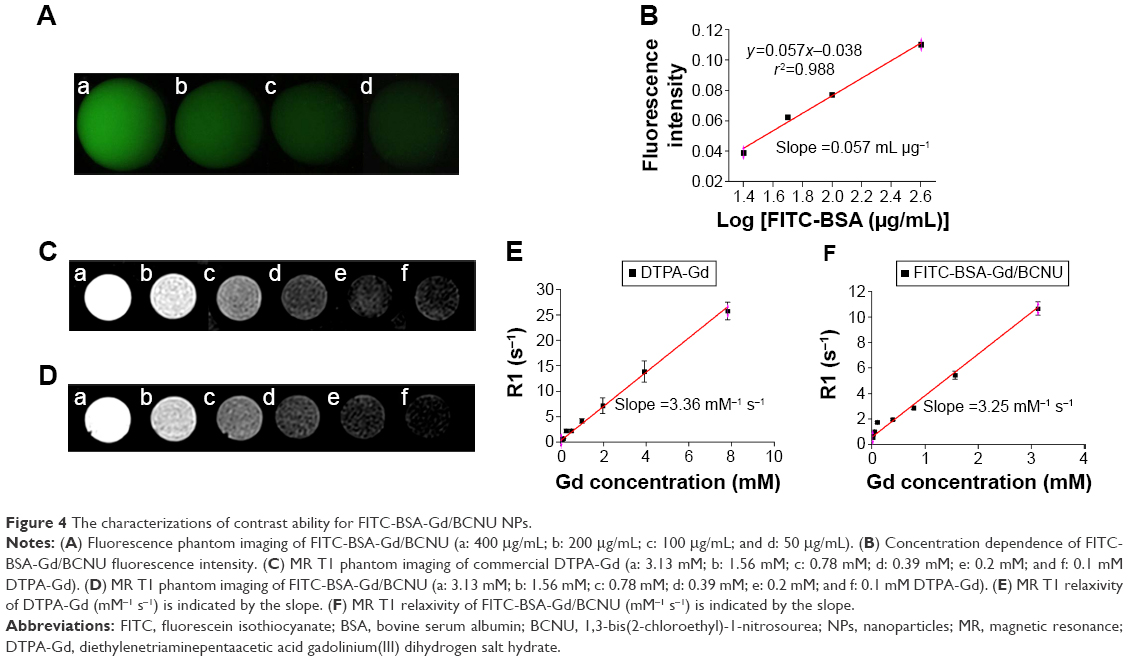 | Figure 4 The characterizations of contrast ability for FITC-BSA-Gd/BCNU NPs. |
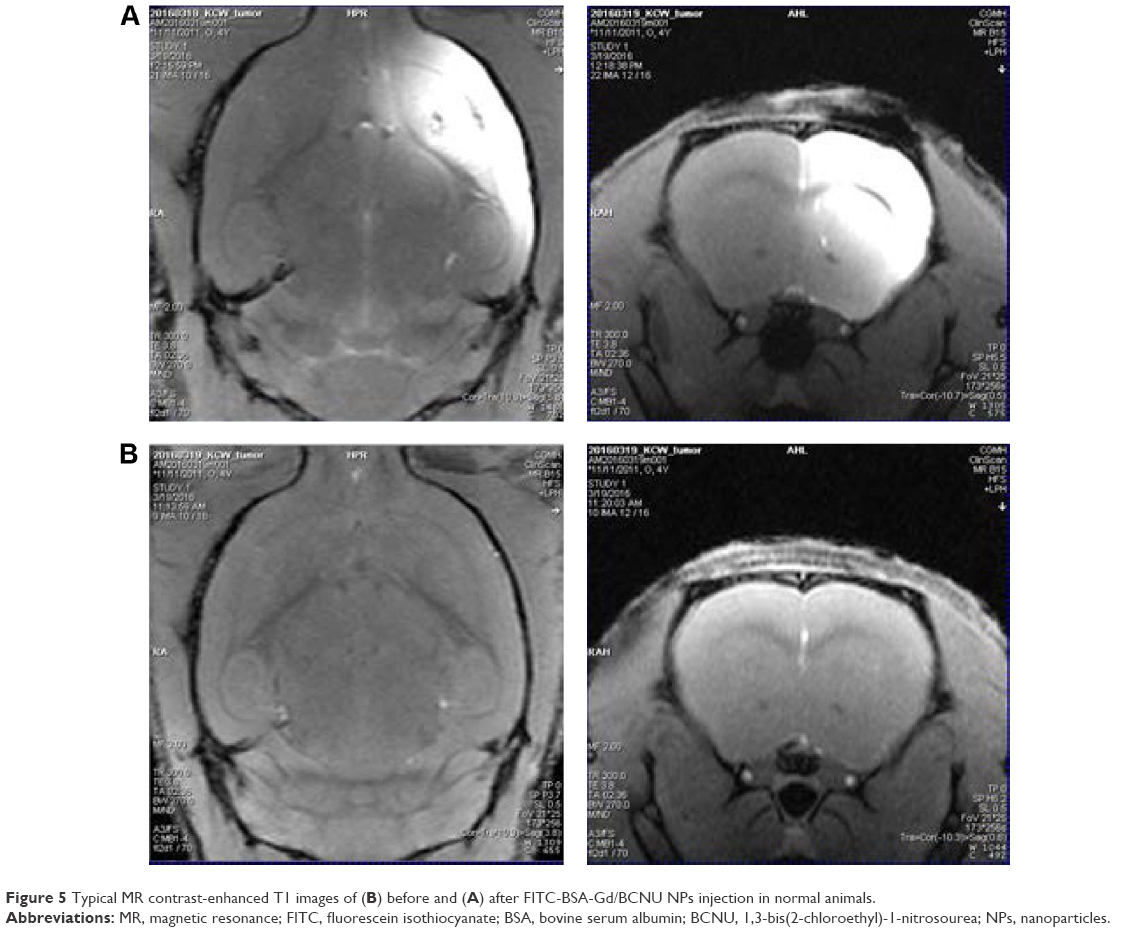 | Figure 5 Typical MR contrast-enhanced T1 images of (B) before and (A) after FITC-BSA-Gd/BCNU NPs injection in normal animals. |
Cellular uptake and in vitro cytotoxicity studies
To confirm whether FITC-BSA-Gd NPs could efficiently enter MBR 261-2 cells for enhancing the accumulated concentration inside cells, fluorescent microscopy was used to track the location and distribution of FITC-BSA-Gd NPs. The location of FITC-BSA-Gd NPs in MBR 261-2 cells was shown by green fluorescence, and the nuclei were stained in blue using Hoechst (Figure 6A). The green fluorescence was observed in close proximity to the nuclei and filled the cytoplasm, which confirmed that FITC-BSA-Gd NPs were indeed inside the cells and not simply adsorbed to the outer surface.
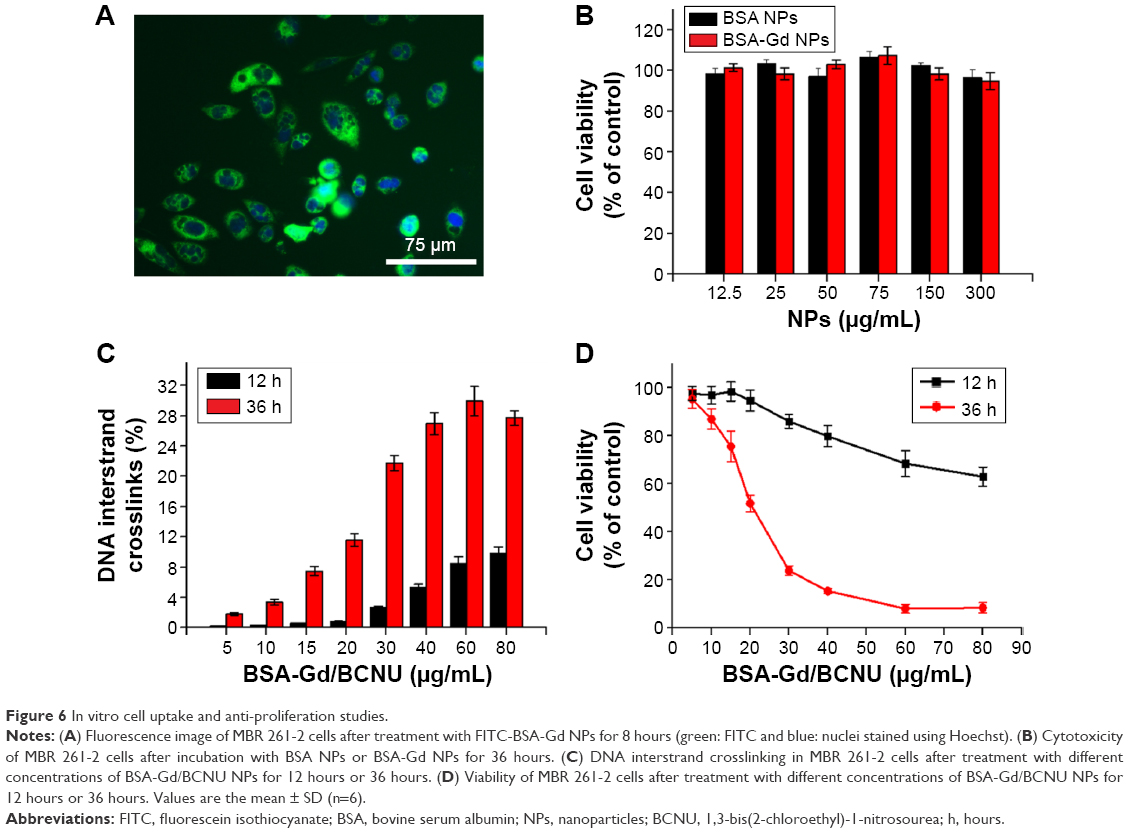 | Figure 6 In vitro cell uptake and anti-proliferation studies. |
MBR 261-2 cells were exposed to BSA NPs or BSA-Gd NPs at 12.5 μg/mL, 25 μg/mL, 50 μg/mL, 75 μg/mL, 150 μg/mL, and 300 μg/mL for 36 hours. Cell viability was not significantly affected, whereas the concentration increased to 300 μg/mL (Figure 6B). No significant difference was found between BSA NPs and BSA-Gd NPs, indicating that the surface of BSA NPs modified with DTPA-Gd would not induce toxicity toward cells and that BSA-Gd NPs were biocompatible and nontoxic.
Cytotoxicity is related to the level of DNA interstrand crosslinking, and DNA interstrand crosslinking is related to the activity of BCNU. Briefly, the 2-chloroethanediazonium ion binds to guanine residues of one DNA strand at the O6-position, producing a monoadduct.32 The occurrence of interstrand crosslinking was only 9.8%±0.8% after treatment with 80 μg/mL of BSA-Gd/BCNU NPs for 12 hours but increased to approximately three-fold to 29.9%±1.9% after 36 hours of incubation with only 60 μg/mL of BSA-Gd/BCNU NPs (Figure 6C), indicating that the degradation or swelling level was not enough to release sufficient BCNU for the induction of high level of DNA interstrand crosslinking in short incubation time. BCNU release was further increased with incubation time, which confirmed the results of in vitro drug release.
We then investigated the in vitro anticancer ability of BSA-Gd/BCNU NPs. The cytotoxicities of BSA-Gd/BCNU NPs to MBR 261-2 cells were derived by the XTT assay method compared with control (without treatment). BSA-Gd NPs were proved to be nontoxic as mentioned earlier; however, BSA-Gd/BCNU NPs were toxic to MBR 261-2 cells in a dose- and time-dependent manner. After 12 hours of incubation with 80 μg/mL of BSA-Gd/BCNU, the inhibition was only 37.1%±3.9%; perhaps only 9.5%±1.2% of BCNU was released from BSA-Gd/BCNU NPs and induced only 9.8%±0.8% of DNA interstrand crosslinking at this time. The IC50 (ie, the concentration required for 50% inhibition of cellular growth) value of BSA-Gd/BCNU NPs significantly decreased to 20.9 μg/mL upon treatment with BSA-Gd/BCNU NPs for 36 hours, because more BCNU was released (39.3%) and the level of DNA interstrand crosslinking also increased to 27.7%±0.9% (treatment with 80 μg/mL of BSA-Gd/BCNU; Figure 6D), which also confirmed the results of in vitro drug release and DNA interstrand crosslinking studies.
In vivo antiproliferation efficiency
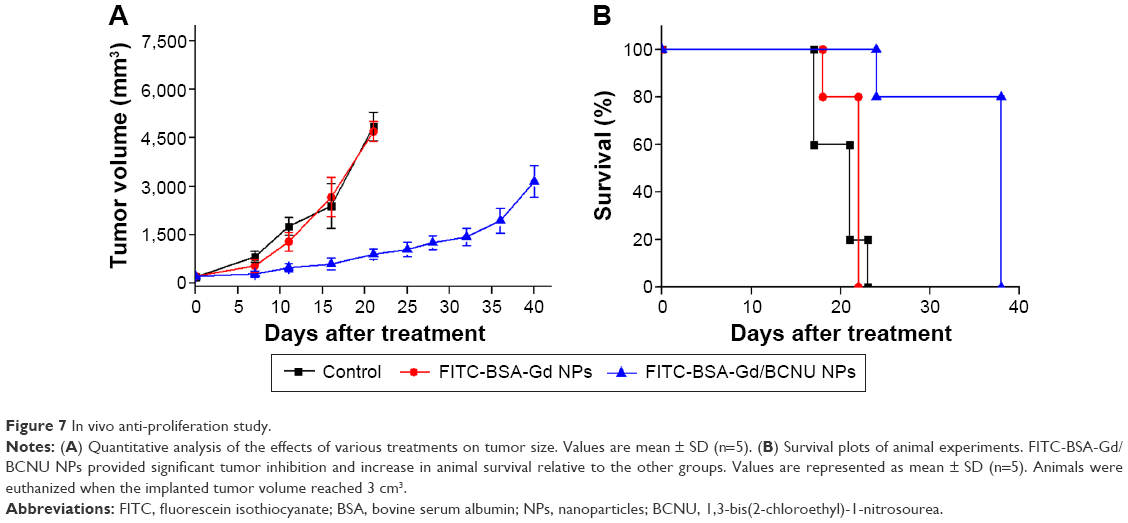
Treatment efficacy using FITC-BSA-Gd/BCNU NPs was evaluated compared with control (without any treatment) and FITC-BSA-Gd NP groups in mice with hypodermic tumors induced by the injection of MBR 261-2 tumor cells. Over a 40-day period, the tumor growth was inhibited exhibiting a slow increase in tumor volume till day 36 and then rapidly grew to ~3,150.5±496.3 mm3 from the initial tumor volume (219.7±20.8 mm3) when the mice received just one single dose of FITC-BSA-Gd/BCNU NPs (effective BCNU dose of 5.5 mg/kg). Most likely, the mice received only one single dose of FITC-BSA-Gd/BCNU NPs that did not have sufficient BCNU to maintain the inhibition of tumor growth. We believe that the efficiency of tumor inhibition would be better if the mice received two injections of FITC-BSA-Gd/BCNU NPs. Conversely, the tumor volumes increased to 4,697.4±307.8 mm3 and 4,859.6±437.8 mm3 in the mice that received FITC-BSA-Gd NPs and in the control groups, respectively, within 21 days (Figure 7A). The median animal survival time for the mice that received FITC-BSA-Gd/BCNU NP treatment increased to 38 days from 21 days (control group) and 22 days (FITC-BSA-Gd NPs; Figure 7B). Our results revealed that FITC-BSA-Gd/BCNU NPs could be a powerful agent for real-time tracking of chemotherapeutic agents in vitro and in vivo that also exhibited effective tumor inhibition.
 | Figure 7 In vivo anti-proliferation study. |
Conclusion
We have demonstrated BCNU-encapsulated BSA NPs with dual MR-fluorescence imaging (FITC-BSA-Gd/BCNU) for real-time tracking of chemotherapeutic agents in the body or tumor. The BSA-based NPs prepared using the desolvation–denaturation method were water dispersible, stable, and nontoxic. The LE could be increased to 27%, and the release rate also could be controlled with appropriate surface modification. Our imaging data clearly indicate that FITC-BSA-Gd/BCNU NPs have good fluorescence properties and a high T1 relaxivity (R1) value of 3.25 mM−1 s−1, which is similar to that of the commercial T1 contrast agent (R1 =3.36 mM−1 s−1), and the high-contrast ability was also confirmed with in vivo brain imaging. The in vitro studies revealed that FITC-BSA-Gd/BCNU NPs were biocompatible and showed noticeable cytotoxicity to MBR 261-2 cells with low IC50 value, providing a versatile platform for efficient chemotherapy with dual mode self-confirmed bioimaging. Furthermore, the in vivo antitumor efficiency and the concerning possible protein immunogenicity of this drug delivery platform would be investigated to ensure its potential in clinical application.
Acknowledgments
We thank the Ministry of Science and Technology and Chang Gung Memorial Hospital, Taiwan (Republic of China), for the financial assistance provided (MOST103-2320-B-110-004-MY2, CMRPG3D0493, and CIRPG3D0052). We would also like to thank Doctor Po-Hung Hsu for the assistance of MR imaging analysis and Chang Gung Memorial Hospital Microscopy Core Laboratory.
Disclosure
The authors report no conflicts of interest in this work.
References
Wen PY, Kesari S, Engl N. Malignant gliomas in adults. N Engl J Med. 2008;359:492–507. | ||
Gloeckler Ries LA, Reichman ME, Lewis DR, Hankey BF, Edwards BK. Cancer survival and incidence from the surveillance, epidemiology, and end results (SEER) program. Oncologist. 2003;8:541–552. | ||
Rhines LD, Sampath P, Dolan ME, Tyler BM, Brem H, Weingart J. O6-benzylguanine potentiates the antitumor effect of locally delivered carmustine against an intracranial rat glioma. Cancer Res. 2000;60:6307–6310. | ||
Lucienne JJ. The targeted delivery of cancer drugs across the blood-brain barrier: chemical modifications of drugs or drug-nanoparticles? Drug Discov Today. 2008;13(23–24):1099–1106. | ||
Andersen C, Taagehøj JF, Mühler A, Rehling M. Approximation of arterial input curve data in MRI estimation of cerebral blood-tumor-barrier leakage: comparison between Gd-DTPA and 99mTc-DTPA input curves. Magn Reson Imaging. 1996;14(3):235–241. | ||
Black KL, Ningaraj NS. Modulation of brain tumor capillaries for enhanced drug delivery selectively to brain tumor. Cancer Control. 2004;11(3):165–173. | ||
Hynynen K, McDannold N, Sheikov NA, et al. Local and reversible blood–brain barrier disruption by noninvasive focused ultrasound at frequencies suitable for trans-skull sonications. Neuroimage. 2005;24:12–20. | ||
Liu HL, Hua MY, Yang HW, et al. Magnetic resonance monitoring of focused ultrasound/magnetic nanoparticle targeting delivery of therapeutic agents to the brain. Proc Natl Acad Sci U S A. 2010;107(34):15205–15210. | ||
Fan CH, Ting CY, Lin HJ, et al. SPIO-conjugated, doxorubicin-loaded microbubbles for concurrent MRI and focused-ultrasound enhanced brain-tumor drug delivery. Biomaterials. 2013;34(14):3706–3715. | ||
Chae GS, Lee JS, Kim SH, et al. Enhancement of the stability of BCNU using self-emulsifying drug delivery systems (SEDDS) and in vitro antitumor activity of self-emulsified BCNU-loaded PLGA wafer. Int J Pharm. 2005;301(1–2):6–14. | ||
Yang HW, Huang CY, Lin CW, et al. Gadolinium-functionalized nanographene oxide for combined drug and microRNA delivery and magnetic resonance imaging. Biomaterials. 2014;35(24):6534–6542. | ||
Kim GY, Tyler BM, Tupper MM, et al. Resorbable polymer microchips releasing BCNU inhibit tumor growth in the rat 9L flank model. J Control Release. 2007;123(2):172–178. | ||
Zhong Z, Wan Y, Shi S, Han J, Zhang Z, Sun X. Materials innovation for co-delivery of diverse therapeutic cargos. Pharm Res. 2012;29(1):145–157. | ||
Yang HW, Lu YJ, Lin KJ, et al. EGRF conjugated PEGylated nanographene oxide for targeted chemotherapy and photothermal therapy. Biomaterials. 2013;34(29):7204–7214. | ||
Temming K, Meyer DL, Zabinski R, et al. Improved efficacy alpha(v)beta(6)-targeted albumin conjugates by conjugation of a novel auristatin derivative. Mol Pharm. 2007;4:686–694. | ||
Iyer AK, Khaled G, Fang J, Maeda H. Exploiting the enhanced permeability and retention effect for tumor targeting. Drug Discov. 2006;11:812–818. | ||
Battogtokh G, Kang JH, Ko YT. Long-circulating self-assembled cholesteryl albumin nanoparticles enhance tumor accumlation of hydrophobic acticancer drug. Eur J Pharm Biopharm. 2015;96:96–105. | ||
Felix K. Albumin as a drug carrier: design of prodrugs, drug conjugates and nanoparticles. J Control Release. 2008;132(3):171–183. | ||
Bartling SH, Budjan J, Aviv H, et al. First multimodal embolization particles visible on X-ray/computed tomography and magnetic resonance imaging. Invest Radiol. 2011;46(3):178–186. | ||
Hagit A, Soenke B, Johannes B, Shlomo M. Synthesis and characterization of dual modality (CT/MRI) core-shell microparticles for embolization purposes. Biomacromolecules. 2010;11:1600–1607. | ||
Olson ES, Jiang T, Aguilera TA, et al. Activatable cell penetrating peptides linked to nanoparticles as dual probes for in vivo fluorescence and MR imaging of proteases. Proc Natl Acad Sci U S A. 2010;107(9):4311–4316. | ||
Cai W, Chen K, Li ZB, Gambhir SS, Chen X. Dual-function probe for PET and near-infrared fluorescence imaging of tumor vasculature. Nucl Med. 2007;48:1862–1870. | ||
Liu Z, Lammers T, Ehling J, et al. Iron oxide nanoparticle-containing microbubble composites as contrast agents for MR and ultrasound dual-modality imaging. Biomaterials. 2011;32(26):6155–6163. | ||
Antoch G, Kuehl H, Kanja J, et al. Dual-modality PET/CT scanning with negative oral contrast agent to avoid artifacts: introduction and evaluation. Radiology. 2004;230(3):879–885. | ||
Zhang M, Yilmaz T, Boztas AO, et al. A multifunctional nanoparticulate theranostic system with simultaneous chemotherapeutic, photothermal therapeutic, and MRI contrast capabilities. RSC Adv. 2016;6:27798–27806. | ||
Ji S, Xu J, Zhang B, et al. RGD-conjugated albumin nanoparticles as a novel delivery vehicle in pancreatic cancer therapy. Cancer Biol Ther. 2012;13(4):206–215. | ||
Yang HW, Hua MY, Liu HL, et al. Self-protecting core-shell magnetic nanoparticles for targeted, traceable, long half-life delivery of BCNU to gliomas. Biomaterials. 2011;32(27):6523–6532. | ||
Sripriyalakshmi S, Anjali CH, George Priya Doss C, et al. BSA nanoparticle loaded atorvastatin calcium – a new facet for an old drug. PLoS One. 2014;9:e86317. | ||
Sadeghi R, Moosavi-Movahedi AA, Emam-jomeh Z, et al. The effect of different desolvating agents on BSA nanoparticle properties and encapsulation of curcumin. J Nanopart Res. 2014;16:2565. | ||
Hua MY, Liu HL, Yang HW, et al. The effectiveness of a magnetic nanoparticle-based delivery system for BCNU in the treatment of gliomas. Biomaterials. 2011;32(2):516–527. | ||
Kapoor DN, Manvi FV, Doijad RC, Dhawan S. Prednisolone-loaded albumin nanospheres: in vitro and in vivo evaluation studies. PDA J Pharm Sci Technol. 2008;62:111–124. | ||
Chen FX, Bodell WJ, Liang G, et al. Reaction of N-(2-chloroethyl)-N-nitrosoureas with DNA: effect of buffers on DNA adduction, cross-linking, and cytotoxicity. Chem Res Toxicol. 1996;9:208–214. |
 © 2016 The Author(s). This work is published and licensed by Dove Medical Press Limited. The full terms of this license are available at https://www.dovepress.com/terms.php and incorporate the Creative Commons Attribution - Non Commercial (unported, v3.0) License.
By accessing the work you hereby accept the Terms. Non-commercial uses of the work are permitted without any further permission from Dove Medical Press Limited, provided the work is properly attributed. For permission for commercial use of this work, please see paragraphs 4.2 and 5 of our Terms.
© 2016 The Author(s). This work is published and licensed by Dove Medical Press Limited. The full terms of this license are available at https://www.dovepress.com/terms.php and incorporate the Creative Commons Attribution - Non Commercial (unported, v3.0) License.
By accessing the work you hereby accept the Terms. Non-commercial uses of the work are permitted without any further permission from Dove Medical Press Limited, provided the work is properly attributed. For permission for commercial use of this work, please see paragraphs 4.2 and 5 of our Terms.