Back to Journals » Journal of Inflammation Research » Volume 18
α-Methyl-Tryptophan Inhibits SLC6A14 Expression and Exhibits Immunomodulatory Effects in Crohn’s Disease
Authors Su Y, Li J, Chen Y, Bao J, Lei Z, Ma M, Zhang W, Liu Q, Xu B, Hu T, Hu Y ![]()
Received 19 September 2024
Accepted for publication 19 January 2025
Published 24 January 2025 Volume 2025:18 Pages 1127—1145
DOI https://doi.org/10.2147/JIR.S495855
Checked for plagiarism Yes
Review by Single anonymous peer review
Peer reviewer comments 2
Editor who approved publication: Dr Adam Bachstetter
YongCheng Su,1,* Jiangquan Li,1,* Yijia Chen,2,* Jiachen Bao,2 Ziyu Lei,1 Miaomiao Ma,1 Wenqing Zhang,1 Qian Liu,3 Beibei Xu,4 Tianhui Hu,1,3 Yiqun Hu2
1Xiamen Key Laboratory for Tumor Metastasis, Cancer Research Center, School of Medicine, Xiamen University, Xiamen, Fujian, 361102, People’s Republic of China; 2Department of Gastroenterology, The National Key Clinical Specialty, Zhongshan Hospital of Xiamen University, School of Medicine, Xiamen University, Xiamen, Fujian, 361004, People’s Republic of China; 3Integrated Chinese and Western Medicine Institute for Children Health & Drug Innovation, Jiangxi University of Chinese Medicine, Nanchang, Jiangxi, 330004, People’s Republic of China; 4Institute of Synthetic Biology, Shenzhen Institute of Advanced Technology, Chinese Academy of Sciences, Shenzhen, Guangdong, 518055, People’s Republic of China
*These authors contributed equally to this work
Correspondence: Tianhui Hu, Xiamen Key Laboratory for Tumor Metastasis, Cancer Research Center, School of Medicine, Xiamen University, Xiamen, Fujian, 361102, People’s Republic of China, Email [email protected] Yiqun Hu, Department of Gastroenterology, The National Key Clinical Specialty, Zhongshan Hospital of Xiamen University, School of Medicine, Xiamen University, Xiamen, Fujian, 361004, People’s Republic of China, Email [email protected]
Introduction: Crohn’s disease (CD) is a chronic inflammatory condition of the intestines with a rising global incidence. Traditional diagnostic and therapeutic methods have limitations, necessitating the exploration of more effective strategies.
Methods: In this study, we employed the Gene Expression Omnibus database to identify genes that are differentially expressed in CD. RT-PCR and immunohistochemical analysis were used to SLC6A14 RNA and protein expression in the colons of CD mice and CD tissues from patients. The mouse model of CD was induced by dextran sodium sulfate (DSS). Infiltrating immune cells in mouse model were screened by flow cytometry.
Results: We discovered that SLC6A14 is significantly overexpressed in CD samples, and its expression is positively correlated with the degree of infiltration by CD4+ and CD8+ T cells. The elevated levels of SLC6A14 RNA and protein were confirmed in clinical CD tissues. The SLC6A14 inhibitor α-methyl-tryptophan (α-MT) significantly decreased the expression of SLC6A14 RNA and protein in the colons of CD mice. The α-MT treatment group also exhibited reduced levels of cytokines involved in T cell differentiation (IFN-γ and TNF-α) and the expression of immune cell surface markers CXCR-3 and LAG-3. Flow cytometry analysis revealed a significant increase in the infiltration of CD4+ and CD8+ T cells in the DSS-treated group compared to the control group. Conversely, the α-MT treatment group showed a significant reduction in CD4+ and CD8+ T cell infiltration and the restoration of intestinal parameters in CD mice. These findings underscore the role of SLC6A14 in regulating intestinal immune cell infiltration during CD progression.
Discussion: Our findings suggest that SLC6A14 could serve as a potential diagnostic biomarker and therapeutic target for CD. Furthermore, α-MT offers a novel approach for the clinical diagnosis and treatment of CD by targeting SLC6A14 for therapeutic intervention.
Keywords: Crohn’s disease, immunosuppressant, α-MT
Graphical Abstract:

Introduction
Crohn’s Disease (CD) manifests as a pervasive, chronic inflammatory condition of the intestinal tract with a widespread global prevalence.1,2 However, due to its complex pathogenesis, research on CD diagnosis and treatment has progressed slowly.3 The current diagnostic and prognostic score was developed on the basis that colonoscopy is the “gold standard” for diagnosing CD.4,5 However, this procedure is invasive with potential adverse outcomes, including recurrent inflammation6 and increased risk of intestinal perforation.7 Given their high specificity, relatively low invasiveness, and rapid detection, biomarkers can supplement traditional diagnostics and therapeutics to improve disease diagnosis and outcomes.8–11
CD has a highly complex and multifaceted etiology that includes chronic overactivation of the immune response to bacterial antigens in the intestinal lumen.12 Considering the immune-based pathology of CD, previous studies reported that evaluating the relationships between immune-based biomarkers and the degree of intestinal inflammation is important for the early monitoring, diagnosis, and prevention of colon cancer in CD.2,13–16 Tissue inflammatory responses are important in the pathology of CD.12,17,18 Using single-cell sequencing data, Zhang et al19 determined that interferon (IFN)-γ is associated with inflammatory bowel disease and highly correlated with disease susceptibility. As an immune factor, the concentration of IFN-γ is influenced by the relative abundance of regulatory T cells (Tregs),20 CD8+ T cells,21 and CD4+ T cells,22 corresponding to the degree of intestinal inflammatory lesions.
CD is an inflammatory disease caused by an interplay among genetics, immunity, microorganisms, and environmental factors.5,23,24 Current research on CD biomarkers has focused predominantly on intestinal resident microorganisms that are commonly involved in microbial–intestinal interactions and microbial components, such as bacterial cell wall polysaccharides,9,25 with a lesser focus on biomarkers related to the intestinal immune pathway. Immune-related genes, including nucleotide-binding oligomerization (NOD)2,13,14 casein kinase 2 alpha 1 (CK2A),15 CXC motif chemokine ligand 8 (CXCL8),16 and leucine-rich repeat-containing G protein-coupled receptor 5 (LGR5),26 participate in interleukin (IL)-1, IL-6, and IL-8 regulation by affecting intestinal immunity.27 IL-17,16 other cellular inflammatory factors, and immune cell dysfunction26 regulate CD pathology. Moreover, microRNAs (miRNAs) participate in immune regulation. For example, miR-149-3p affects helper T cell differentiation through PHD finger-like domain-containing protein 5A (PHF5A) and its downstream effects, aggravating the intestinal immune response to microorganisms contributing to CD development.28
Considering the pivotal role of the immune microenvironment in CD pathogenesis, previous studies found that treatment agents targeting the NOD2/muramyl dipeptide,10,13,14 SRY-box transcription factor/claudin 8,11 Janus kinase (JAK)–signal transducer and activator of transcription (STAT),29 and other pathways exhibit efficacy in clinical practice. These agents include upadacitinib,30,31 anti-tumor necrosis factor (TNF)α agents,32 guselkumab,33 infliximab, and risankizumab,31 which reduce intestinal immune inflammation primarily by controlling T cell differentiation. Therefore, identifying the immune genes related to CD pathology is important. In addition, the importance of the melanocortin system as a potential pathomechanism in chronic gastrointestinal inflammation (GI) is becoming increasingly evident. This system has been shown to counteract chronic GI inflammation such as CD and to intervene in the complex cytokine imbalances in the intestinal microenvironment induced by chronic inflammatory injury.34
SLC6A14, part of the solute carrier transporter protein family, which is found to be upregulated in various colonic diseases, including ulcerative colitis (UC).35 Mechanistic studies have identified SLC6A14 as a novel regulator of ferroptosis, which promotes the progression of UC through the C/EBPβ-PAK6-ERK signaling axis. However, the role of SLC6A14 in CD remains to be elucidated. Further research is needed to understand the potential implications of SLC6A14 in CD, which could open up new avenues for therapeutic intervention.
In this study, we aimed to identify biomarkers for CD that can enhance clinical management and patient outcomes by using relevant data sourced from various databases, clinical specimens, and animal models.
Materials and Methods
CD Tissue Collection
Twenty pairs of CD and adjacent normal tissue were prospectively gathered from the Xiamen University Affiliated Zhongshan Hospital between January and December 2023. All CD samples were verified via pathological examination. This study was conducted in accordance with the Declaration of Helsinki and was approved by the Institutional Review Board at Zhongshan Hospital, affiliated with Xiamen University.
Data Sources
Patterns of gene expression associated with CD tissues were assessed based on microarray datasets available in the Gene Expression Omnibus (GEO) database: GSE10616, incorporating 32 CD tissue samples and 9 samples from healthy controls; GSE36807, comprising 13 CD tissue samples and 7 healthy control samples; GSE16879, featuring 73 CD tissue samples analyzed before and after infliximab treatment; GSE95095, including 48 CD tissues and 12 healthy controls; GSE16879, comprising 73 CD tissues and 12 healthy controls; and GSE102133, featuring 65 CD tissues and 12 healthy controls.
Identification and Visualization of Key Genes of CD
Differentially expressed genes (DEGs) were identified using the “limma” package in the R programming environment; the raw data were subjected to log transformation after undergoing quantile normalization. DEGs were classified based on meeting the set criteria of an absolute log fold change (|logFC|) > 1 and adjusted p < 0.05. To visually represent the DEGs, heat maps and volcano plots were generated using the R package, offering a detailed and clear depiction of the variations in gene expression.
Screening of Key Genes Based on LASSO and SVM–RFE Algorithms
To screen genes associated with survival, the DEGs were subjected to univariate regression analysis. Characteristic genes were screened using the Least Absolute Shrinkage and Selection Operator (LASSO)36 and support vector machine (SVM)–recursive feature elimination (RFE) machine learning methods.37 The diagnostic value for CD was evaluated by employing the e1071 package.38 The genes selected via the dual analytical methods of LASSO and SVM–RFE were subsequently amalgamated to form a consolidated dataset for further analysis.
Weighted Gene Co-Expression Network Analysis (WGCNA)
Core modules associated with CD were identified through a WGCNA based on the expression profiles of the combined dataset. According to the principle of a scale free network, soft thresholds (power = 20, R2 = 0.84) were selected to construct a scale free co expression network in turn, and the adjacency matrix was converted into a topological overlap matrix. Then, cluster analysis was performed to identify gene modules, with a minimum number of 60 genes per module, and a total of three similar gene modules were identified; The core genes in the module were filtered by setting the gene significance(GS) > 0.5, and the module membership (MM) > 0.8. A dendrogram was constructed using hierarchical clustering to calculate the correlation between the module’s characteristic genes and the disease phenotype; The “PickSoftThreshold” function was used to determine the soft thresholding power. Co expression networks were constructed using co expression analysis.
Gene Function Enrichment Analysis
The R package clusterProfiler39 was utilized to conduct function enrichment analyses for the DEGs with a significance level set at p < 0.05. The statistically significant enrichment results were determined according to the established criteria.
Immune Infiltration Analysis
The simple sample Gene Set Enrichment Analysis (ssGSEA) function in the R package “GSVA” was used for analysis.40 The ssGSEA score was used to quantify the extent of immune cell infiltration within each sample. Genes serving as markers for immune cells were obtained from a previously published study41 that focused on 28 common immune cell types. The variances in immune cell infiltration were determined using the CIBERSORT deconvolution algorithm available at https://cibersortx.stanford.edu/.
Mouse Model of CD
To model CD in mice, dextran sodium sulfate (DSS; MP Biomedicals, Santa Ana, CA, USA) was administered as a 1% aqueous solution in sterile water. To encourage the mice to drink more, 0.5% glucose was added to the DSS solution. C57 wild-type mice, approximately 6 weeks old, were used for modeling, with ≥ 5 mice per group: control, DSS treatment only, α-methyl-tryptophan (α-MT) treatment, and DSS+α-MT treatment. The mice were subjected to 1 week of feeding with the DSS solution, followed by 1 week of feeding with sterile water. The cycle was repeated thrice. Weight change, degree of feces molding, perianal bleeding, and activity level were recorded throughout the modeling period to generate weight change and Crohn’s disease activity index (CDAI) score curves. At the end of the first cycle, the mice were treated with α-MT (5 mg/kg; dissolved in double-distilled water and administered by gavage). DSS administration was maintained during the treatment period. The mice were euthanized after 3 cycles.
RT-PCR
Reverse transcription-polymerase chain reaction (RT-PCR) was carried out using SYBR Master Mix (YEASEN Biotech, Shanghai, China) with GAPDH as the reference standard. The RT-PCR primers are detailed in Table S1.
Histology and IHC
Fresh pathological samples were collected from six confirmed patients with CD diagnosed at the Xiamen University Affiliated Zhongshan Hospital during the study period. Immunohistochemistry (IHC) staining was performed as previously reported.42 The results of IHC for SLC6A14 were assessed by merging the areas and intensity of staining. The range of intensity scores varied from 0 to 9, with 0 representing the absence of expression and 9 representing strong expression.
Intestinal tissue samples from mice and patients with CD were fixed with 4% paraformaldehyde, dehydrated, embedded, and sectioned. We used an automatic hematoxylin/eosin staining machine (DP260; Roche, Basel, Switzerland) to stain mouse intestinal tissue. The primary antibodies used for IHC staining were Proteintech SLC6A14 (18,388-1-AP; 1:100; Rosemont, IL, USA) for mouse tissues and Affinity SLC6A14 (DF9924; 1:200; San Francisco, CA, USA) for human tissues. The paraffin sections were dehydrated and subjected to antigen retrieval and blocking. The sections were then incubated with primary antibodies overnight at 4 °C. Following rinsing, the cells were incubated with the secondary antibodies at ambient temperature. After washing, a freshly prepared DAB chromogenic solution was applied to the sections. Slides were subsequently rinsed, counterstained with hematoxylin, subjected to differentiation, dehydrated, and mounted.
Flow Cytometry
To assess the therapeutic effects of α-MT, mouse colon segments were ground in 100 μL filtered sterilized phosphate-buffered saline (PBS) on a 200-mesh sterile filter using the piston base of a sterile syringe at room temperature until no obvious connective tissue remained. The suspension was transferred to a clean flow cytometer sample tube, and the single-cell mixture was rinsed with sterile PBS. The cleaning method involved two rounds of centrifuging the cell suspension at 4 °C and 1000 rpm for 4 min, discarding the supernatant, and adding filtered sterile PBS to resuspend the pellet. The specified amount of flow cytometry antibodies was mixed in filtered sterile PBS, added to each sample, and subsequently allowed to incubate at a low temperature within a dark environment. The antibodies included PE anti-mouse CD3 (cat#103308; 1:100; BioLegend, San Diego, CA, USA), FITC anti-mouse CD45 (cat#103107; 1:100; BioLegend), PerCP/Cvanine5.5 anti-mouse CD8a (cat#100734; 1:100; BioLegend), and APC anti-mouse CD4 (cat#100412; 1:100; BioLegend). The antibodies were then washed, recovered, and tested. A CytoflexS flow cytometer was used; the fluorescence channels were BrilliantViolet421, PE, FITC, and PerCP/Cvanine5.5. Forward- and side-scattered light were applied to remove cell debris and a CD3–CD45 gate was set to capture the immune cells. The proportions of CD4+ and CD8+ T cells in the intestinal infiltration were quantified using FlowJo v10.8.1 (FlowJo, Ashland, OR, USA).
Statistical Analysis
Datasets are collected from the GEO database. The quantiles function from the preprocessCore package in R is used to standardize the data. We consistently apply a log2 transformation to all data. We apply the removeBatchEffect function from R’s limma package to address batch effects across different batches within the same dataset and platform. Box plots are used to evaluate the normalization of data during preprocessing; The assessment of data batch effects is done by comparing PCA plots before and after removing batches. Pearson or Spearman correlation coefficients were used to perform correlation analyses. The Pearson method was applied when the data were continuous and normally distributed, while the Spearman method was utilized for data that did not meet these criteria. Receiver operating characteristic (ROC) curves were utilized to evaluate the diagnostic value. The results of three independent experiments were included in each analysis. And the data (mean ± SD) were examined using GraphPad Prism (version 8.0.2). For normally distributed data, differences between two groups were assessed using the Student’s t-test, whereas those among three or more groups were assessed using analysis of variance. For non-normally distributed data, the Wilcoxon rank-sum test was used for comparisons between two groups, whereas the Kruskal–Wallis test was employed for comparisons involving more than two groups. Significance was set at p < 0.05.
The graphical abstract of this study is shown in Graphical Abstract.
Results
DEG Screening
Gene expression data in CD tissues were sourced from microarray datasets available on the GEO database (Figure 1a). The ComBat function (sva R package) was used to correct batch effects in two distinct datasets (GSE10616 and GSE36807) by adjusting the expression values (Figure 1b and c). We identified 106 DEGs meeting the criteria |logFC| >1 and adjusted p < 0.05, of which 91 were upregulated, and 15 were downregulated (Figure 1d). The heat map in Figure 1e shows the significant DEGs, comprising 32 with augmented expression (indicated in yellow) and 8 with diminished expression (highlighted in blue).
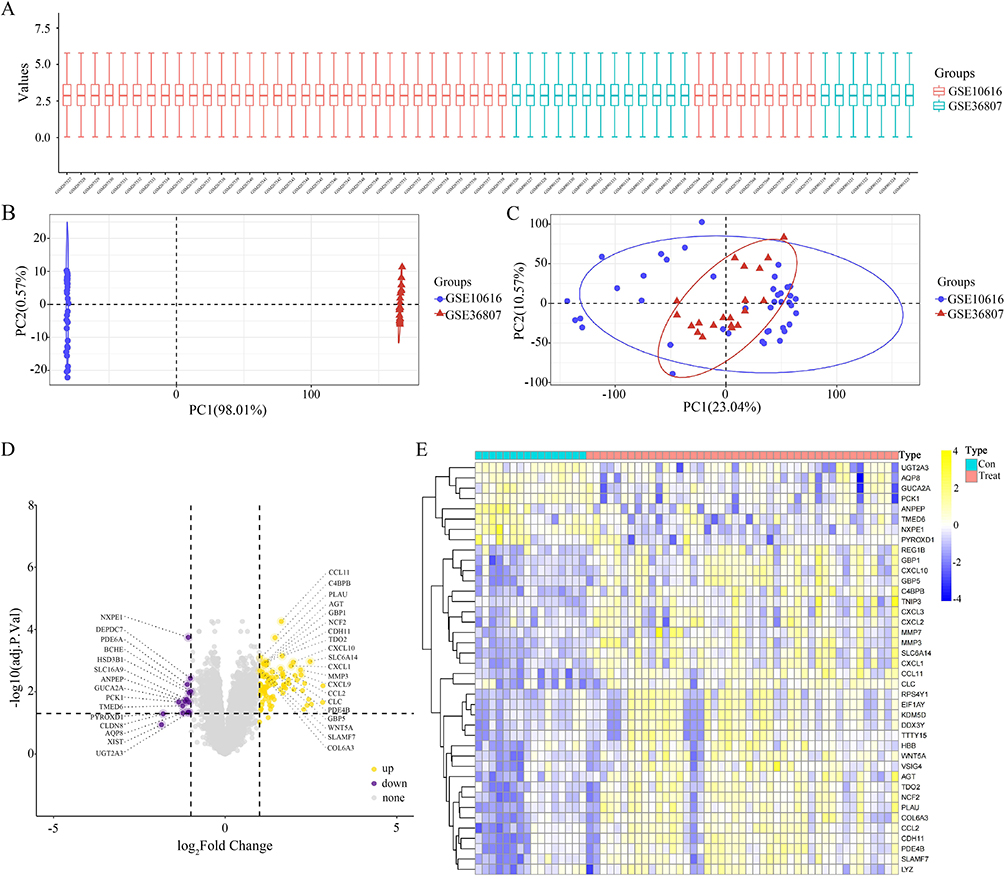 |
Figure 1 Differentially expressed genes (DEGs) obtained from the Gene Expression Omnibus (GEO) database. (A–C) Dataset of patients with Crohn’s disease (CD) in the GEO database for correcting batch effects. (D) A total of 106 DEGs, including 91 upregulated and 15 downregulated genes, were identified in the GSE10616 and GSE36807 datasets based on the criteria of |logFC| > 1 and adjusted p < 0.05. (E) Heat map showed significant DEGs (“con” = normal tissue, “treat” = CD tissue), including 32 upregulated (yellow) and 8 downregulated (blue) genes. |
GO and KEGG Pathway Enrichment Analyses of CD-Related Genes
Gene Ontology (GO) and Kyoto Encyclopedia of Genes and Genomes (KEGG) analyses were conducted to determine the functional implications of the delineated genes associated with CD. The KEGG analysis revealed that the DEGs exhibited significant enrichment in various inflammatory pathways, including the IL-17 pathway, chemokine signaling pathways, interactions between cytokines and their receptors, and NOD-like receptor signaling pathway (Figure 2a and b). This result emphasizes the pivotal role of these molecular pathways in regulating inflammatory responses, underscoring their potential as targets for therapy or markers for diagnosis (Figure 2a and b). Similarly, GO pathway analysis identified that the signature genes primarily influenced immune regulation, including the humoral immune response, leukocyte chemotaxis, response to chemokines, cell chemotaxis, and cellular response to chemokines (Figure 2c and d).
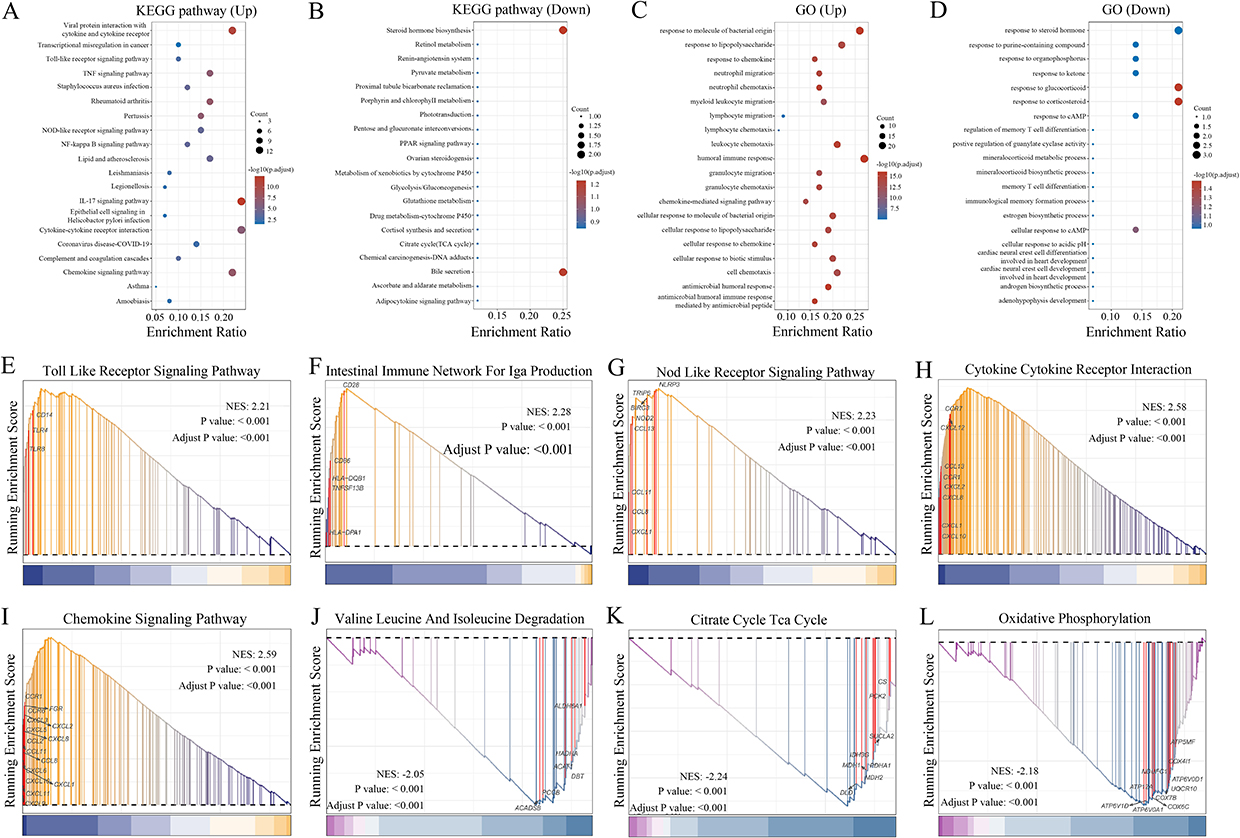 |
Figure 2 Functional enrichment analysis of DEGs. (A and B) Kyoto Encyclopedia of Genes and Genomes (KEGG) enrichment analysis results revealed that the DEGs were most significantly enriched in inflammatory pathways, including the interleukin (IL)-17 signaling pathway, chemokine signaling pathway, cytokine-cytokine receptor interaction, and nucleotide-binding oligomerization (NOD)-like receptor signaling pathway. (C and D) Gene Ontology (GO) pathway analysis results demonstrated that the signature genes primarily influenced immune regulation. (E–L) Gene Set Enrichment Analysis (GSEA) of DEGs in CD. |
GSEA yielded similar enrichment results in the Toll-like receptor signaling pathway (Figure 2e), intestinal immune network for immunoglobulin A production pathway (Figure 2f), NOD-like receptor signaling pathway (Figure 2g), cytokine receptor interaction (Figure 2h), chemokine signaling pathway (Figure 2i), valine, leucine, and isoleucine degradation (Figure 2j), citrate cycle (Figure 2k), and oxidative phosphorylation (Figure 2l). Additionally, several immune-related pathways showed significantly higher activity, including TNF-α signaling via NFκB, IL6–JAK–STAT3 signaling, the IFN-α response, GSE10325 B cell vs myeloid DN cells, IFN-γ response, GSE10325-CD4+ T cells vs B cells UP, and GSE10325-CD4+ T cell vs myeloid DN cells (Table S2). The upregulated pathways, including IL-17, chemokine, and NOD-like receptor signaling, further demonstrated the involvement of inflammatory processes in CD pathogenesis (Table S3). These pathways are important in immune regulation, cytokine production, chemotaxis, and cellular migration. Moreover, the enrichment of pathways associated with the humoral immune response, IFN response, and TNF-α signaling further implicates dysregulated immune function in CD pathology.
Identification of Genes Most Associated with CD
Using the differential limma algorithm, we identified 106 DEGs in 45 CD and 16 non-CD tissues. To further investigate regulatory genes in CD, we utilized the SVM–RFE and LASSO algorithms individually. Twelve genes were identified via LASSO analysis (Figure 3a), and eight CD-associated genes were identified using the SVM–RFE algorithm (Figure 3b). By identifying the intersection between CD-associated genes derived from LASSO regression and the SVM–RFE algorithm, we confirmed the significance of eight crucial genes: CCL11, C4BPB, SLC6A14, CCL8, SPINK4, ADGRG7, NXPE1, and BCHE (Figure 3c). ROC analyses were conducted to evaluate the diagnostic performance of the eight implicated genes, revealing that CCL11 (area under the curve (AUC) = 0.915), C4BPB (AUC = 0.9), SLC6A14 (AUC = 0.881), CCL8 (AUC = 0.818), SPINK4 (AUC = 0.805), and NXPE1 (AUC = 0.889) exhibited significant diagnostic potential (Figure S1a-h).
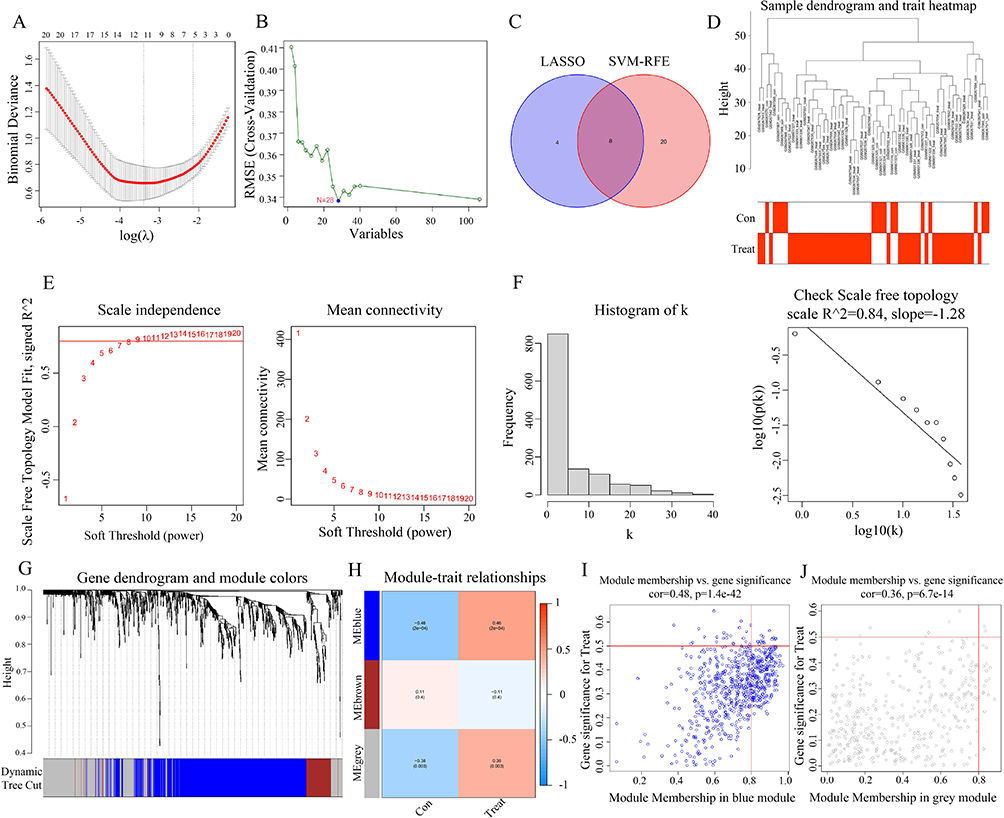 |
Figure 3 DEGs were screened and weighted correlation network analysis (WGCNA) soft threshold was determined using the Least Absolute Shrinkage and Selection Operator (LASSO)/support vector machine (SVM)–recursive feature elimination (RFE) algorithm. (A) In total, 12 key genes were confirmed through LASSO analysis. (B) Using SVM–RFE, 28 key regulatory genes were identified. (C) Venn diagram showed 8 key genes by taking the intersection of CD-related genes obtained from LASSO and SVM–RFE. (D) Sample hierarchical cluster analysis results showed good clustering among the samples, with no significant outliers. (E and F) The PickSoftThreshold function was used to determine the soft threshold capability. (G and H) Cluster analysis identified three similar gene modules, with a minimum number of 60 genes per module. (I and J) Scatter plot showed a strong correlation between gene significance (GS) and module membership (MM) in the “blue” and “grey” modules (Cor = 0.48, p = 1.4 × 10−42, and Cor = 0.36, p = 6.7 × 10⁻¹⁴, respectively). |
We then performed a weighted correlation network analysis (WGCNA) based on the expression profiles of the combined dataset to identify core modules associated with CD. The samples exhibited strong clustering in the hierarchical cluster analysis without any noticeable outliers (Figure 3d). To establish the soft thresholding power in line with the scale-free network principle, the “PickSoftThreshold” function was employed. To achieve the network’s scale-free topology, the soft threshold was adjusted to 20, resulting in an R2 value of 0.84 and a notably high average connectivity. A scale-free co-expression network was created using soft thresholds (R2 = 0.84, power = 20). By converting the adjacency matrix, a topological overlap matrix was established (Figure 3e and f). Cluster analysis was conducted to detect gene clusters, each containing at least 60 genes; 3 corresponding gene clusters were found (Figure 3g and h). The blue module showed the highest correlation, with a maximum correlation value of 0.46 and a p-value of 2 × 10⁻⁴, followed by the gray module (R2 = 0.38 and p = 0.003; Figure 3h). The scattered data plot (Figure 3i and j) demonstrated a robust relationship between gene significance (GS) and module membership (MM) in the “blue” and “gray” segments (Cor = 0.48, p = 1.4 × 10−42, and Cor = 0.36, p = 6.7 × 10⁻¹⁴, respectively).
In addition, 1124 genes within these two modules were deemed significant, meriting subsequent in-depth analysis. Genes in blue (CARD6, CCL2, CDH11, CHST15, COL6A3, DRAM1, F2R, FGR, IKBIP, NCF2, PDE4B, RAB31, SLAMF7, STAP2, TDO2, and THEMIS2) and gray modules (CXCL1, MMP3, and SLC6A14) were identified as the most relevant genes associated with CD.
Figure 4a shows that the crucial gene in CD was SLC6A14, as indicated by the overlap of genes revealed by the LASSO and SVM algorithms. Analysis of differential expression indicated that CD tissues exhibited a notable increase in SLC6A14 expression in contrast to normal tissues (Figure 4b). ROC curve analysis identified SLC6A14 as a diagnostic indicator in patients with CD (AUC = 0.881, Figure 4c). The same results were observed in external validation datasets (GSE95095, GSE16879, and GSE102133), with significantly elevated expression of SLC6A14 in patients (Figure 4d–f) and AUCs of 0.773, 0.998, and 0.949, respectively (Figure 4g–i). Specifically, the GSE16879 dataset offered a comparative analysis of pre- and post-treatment conditions with the first administration of infliximab. Subsequent analysis revealed a notable downregulation of SLC6A14 expression following the infliximab intervention for CD within the confines of the GSE16879 dataset (Figure 4j). This decrease suggests that SLC6A14 holds considerable potential as an indicative biomarker for forecasting the therapeutic response in CD (AUC = 0.70; Figure 4k).
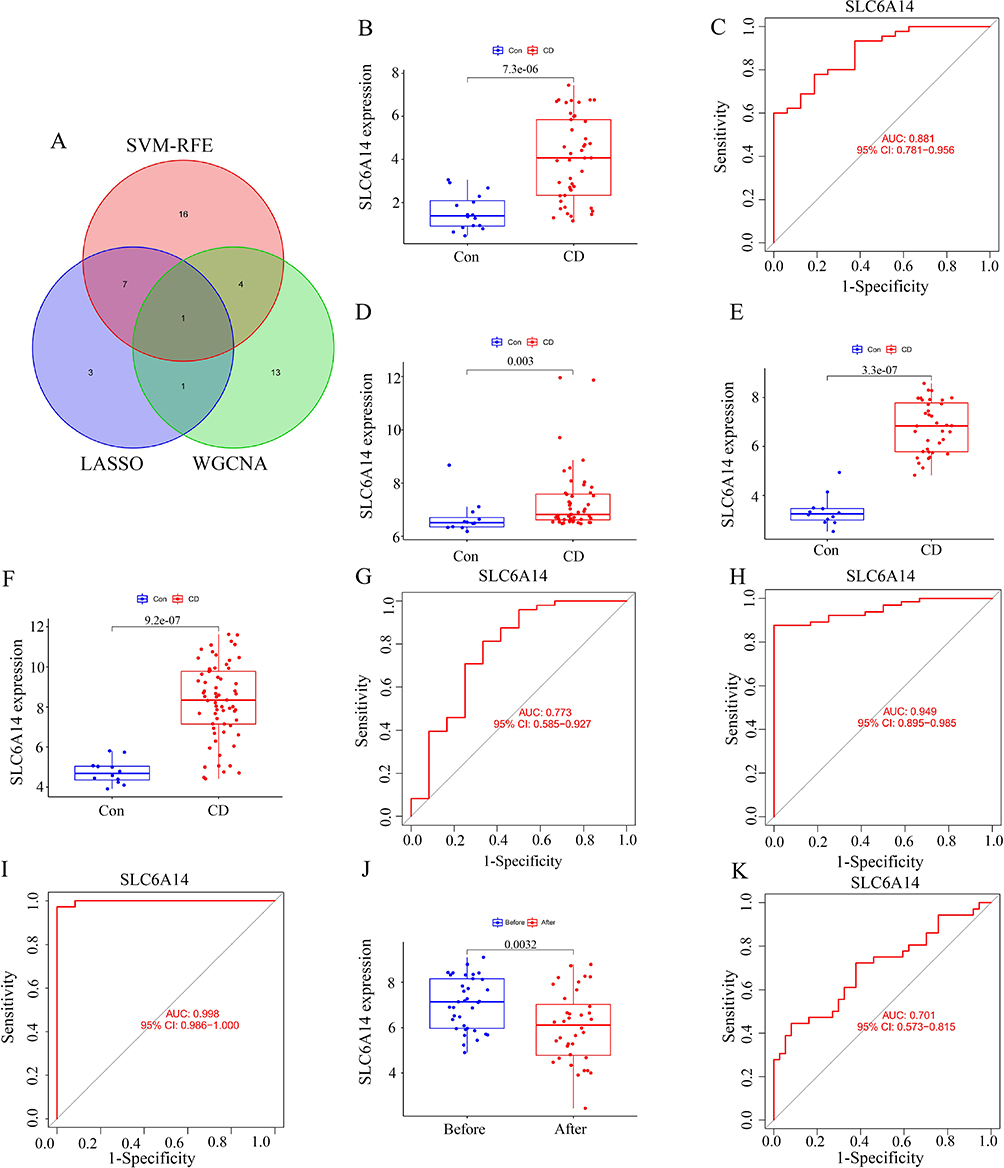 |
Figure 4 Screening of SLC6A14 and diagnostic ability of SLC6A14 in samples from patients with CD. (A) Venn diagram of the key regulatory genes (including SLC6A14) of CD screened by LASSO, SVM–RFE, and WGCNA. (B) Differential expression analysis showed that SLC6A14 expression was significantly upregulated in CD tissues compared with normal tissues. (C) Receiver operating characteristic (ROC) curve analysis further showed that SLC6A14 can be used as a key diagnostic indicator in patients with CD (AUC=0.881). (D-F) GSE95095, GSE16879 and GSE102133 showed that the expression of SLC6A14 significantly increased in patients with CD. (G-I) The ROC curves in the GSE95095, GSE16879, and GSE102133 datasets were 0.773, 0.998, and 0.949, respectively. (J) GSE16879 showed that the expression of SLC6A14 significantly decreased in patients with CD after infliximab treatment. (K) ROC curve in GSE16879 was 0.701. |
Our assessment of SLC6A14 mRNA expression in 15 pairs of CD and healthy tissue samples aligned with prior findings. SLC6A14 mRNA levels significantly increased in CD tissues (Figure 5a and b). IHC analysis yielded similar results, showing significantly elevated SLC6A14 protein levels in CD tissues, suggesting that SLC6A14 could be a key diagnostic indicator for patients with CD (Figure 5c).
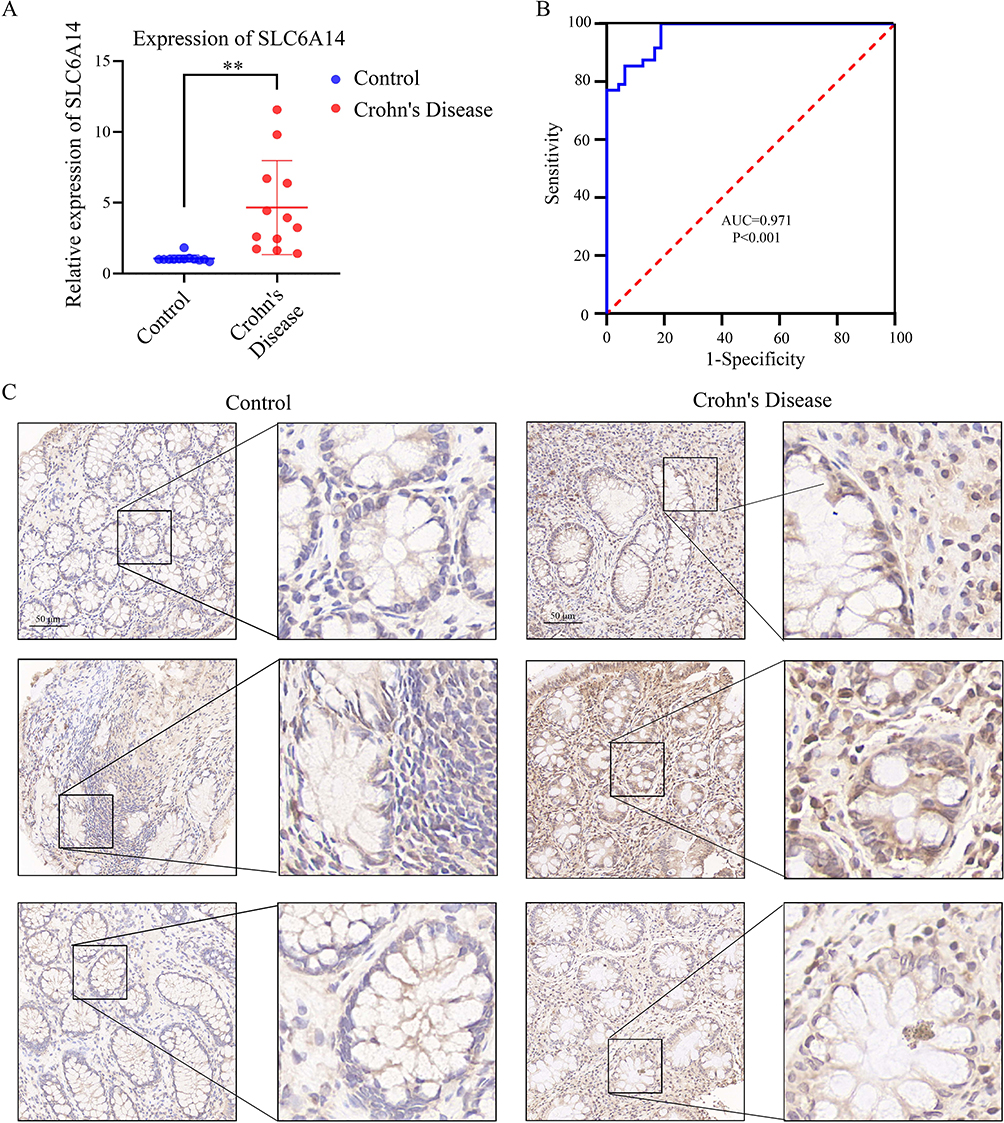 |
Figure 5 Expression of SLC6A14 in clinical samples. (A and B) The relative expression levels of SLC6A14 in 15 pairs of CD and normal tissue samples. (C) Immunohistochemistry (IHC) analysis yielded similar results, showing significantly elevated protein expression levels of SLC6A14 in CD tissues, suggesting that SLC6A14 could be a key diagnostic indicator for CD patients. **, p<0.01. |
Immune Cell Infiltration/Functions and Their Association with SLC6A14
Additional ssGSEA uncovered variances in the levels of immune cell infiltration among individuals with CD compared with those in the control group; the distribution of the 28 different immune cell types is presented in Figure 6a. Disparities observed in individuals with CD included a significantly increased count of immune cells, eg, activated CD4+ T cells, CD8+ T cells, and dendritic cells, suggesting these cells were crucial in CD progression (Figure 6b). Correlation analysis revealed positive correlations between SLC6A14 and most immune cell types (Figure 6c and Table S4).
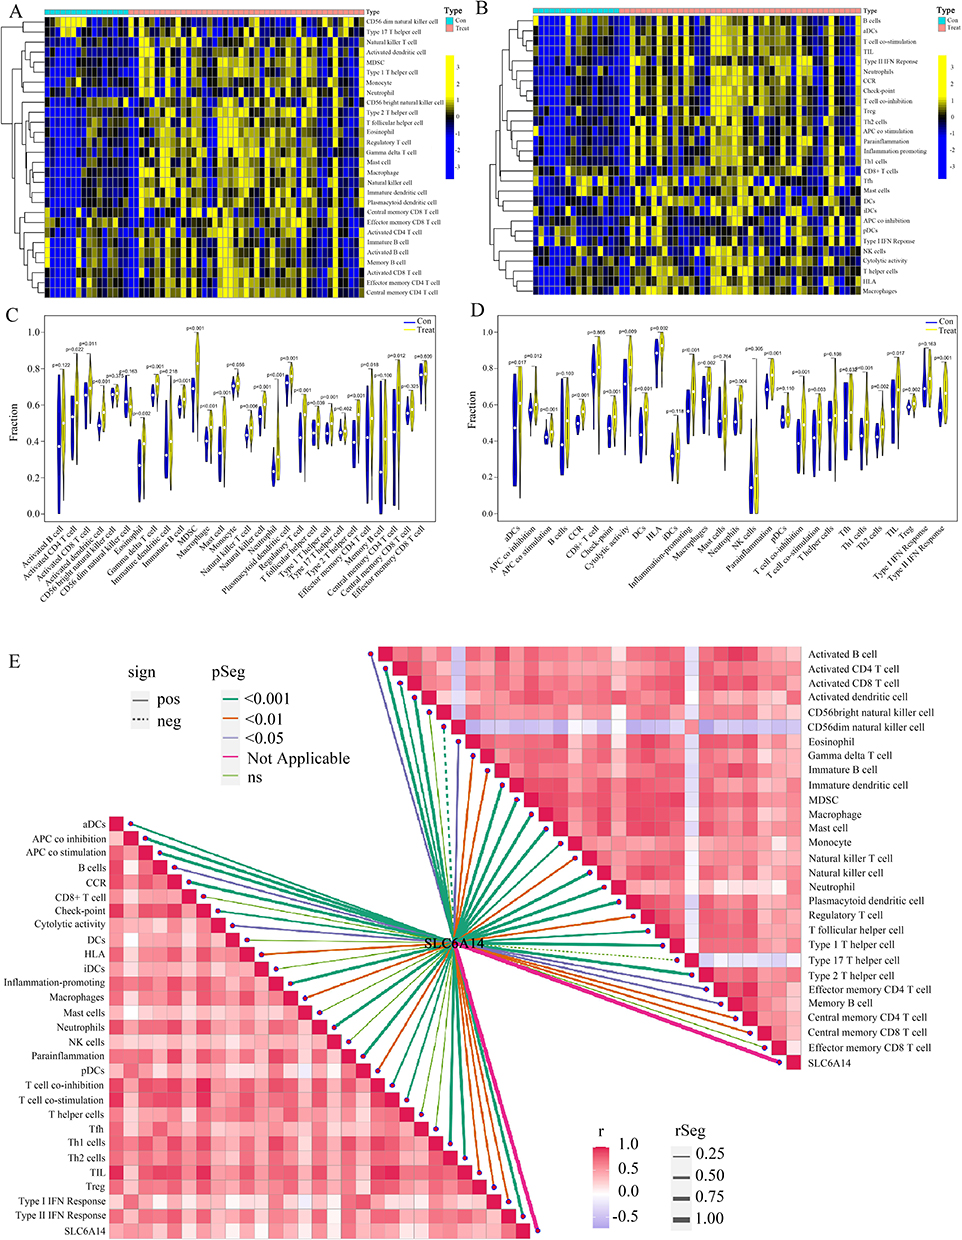 |
Figure 6 Analysis of intestinal immune cell infiltration in patients with CD and correlation analysis between SLC6A14 and immune cell infiltration. (A and B) Distribution of immune cell types in CD patients and normal controls. (C) Differences in immune cell infiltration between CD patient samples and normal samples (D) Differences in immune function between CD patient samples and normal samples. (E) Correlation analysis showed that SLC6A14 positively correlated with most immune cell types and immune-related pathways. |
We further analyzed the variances in immune function (Figure 6d). Immune function scores were significantly greater in patients with CD than in those without. Differential analysis revealed increased activity in immune pathways, including CCR, checkpoints, HLA, promotion of inflammation, T cell co-inhibition, APC co-inhibition, T cell co-stimulation, cytolytic activity, APC co-stimulation, type II IFN response, and TIL in CD tissues (Figure 6e), highlighting their roles in immune-related pathways in CD pathology. Correlation analysis further revealed significant positive correlations between SLC6A14 and APC co-inhibition, APC co-stimulation, CCR, checkpoints, cytolytic activity, HLA, promotion of inflammation, T cell co-inhibition, T cell co-stimulation, TIL, and type II IFN response (Figure 6e and Table S5). These findings suggest the cellular molecular mechanisms through which SLC6A14 may regulate CD progression.
The deconvolution algorithm CIBERSORT was employed to assess the variances in levels of immune infiltration among individuals with CD and control specimens (Figure S2a). The levels of γδ T cells, M0 macrophages, and M1 macrophages showed a notable increase in CD specimens, pointing to their significant involvement in CD development. The correlation between SLC6A14 and M0/M1, γδ T cells, and Tfh cells is shown in Figure S2b–f. These results confirm the significant effect of SLC6A14 on the intestinal immune environment during CD pathogenesis and suggest that it is a clinical diagnostic marker for CD.
Effects of SLC6A14 Inhibitors in Animal Models
Single-gene indicators of CD showed favorable treatment trends. For example, blocking the small molecule receptor gw130 in the STAT pathway exerted a significant therapeutic effect on CD. Therefore, we hypothesized that inhibitors specifically blocking the effects of SLC6A14 would also have positive effects on treating CD. Based on existing literature,22,43 we identified α-MT, a SLC6A14 inhibitor, as a potential therapeutic drug for CD. α-MT binds specifically to SLC6A14 and has shown good results in treating colon and liver cancers.
We used 1% DSS aqueous solution as an inducer of inflammatory bowel disease to model CD in mice. During the modeling process, changes in mouse body weight and CDAI scores were recorded as indicators of CD modeling success (Figure 7a). Upon completion of the modeling process, the mice were euthanized, and the length of the colon segments was measured (Figure 7b). The weight changes in the mice and the CDAI score based on mouse weight and perianal bleeding in the stool and blood are shown in Figure 7c and d. The eosin and hematoxylin staining showed that the morphology of the intestinal glands was more complete in the α-MT-treated group than in the DSS group (Figure 7e). IHC results indicated that in the DSS-induced group, the expression of SLC6A14 was significantly upregulated; after treatment with α-MT, SLC6A14 abundance was downregulated, comparable to the control group. The IHC results were corroborated by the RT-PCR results (Figure 7f). These findings underscore that α-MT distinctly attenuates SLC6A14 expression within the colonic segments of mice afflicted by CD, exerting a beneficial therapeutic impact.
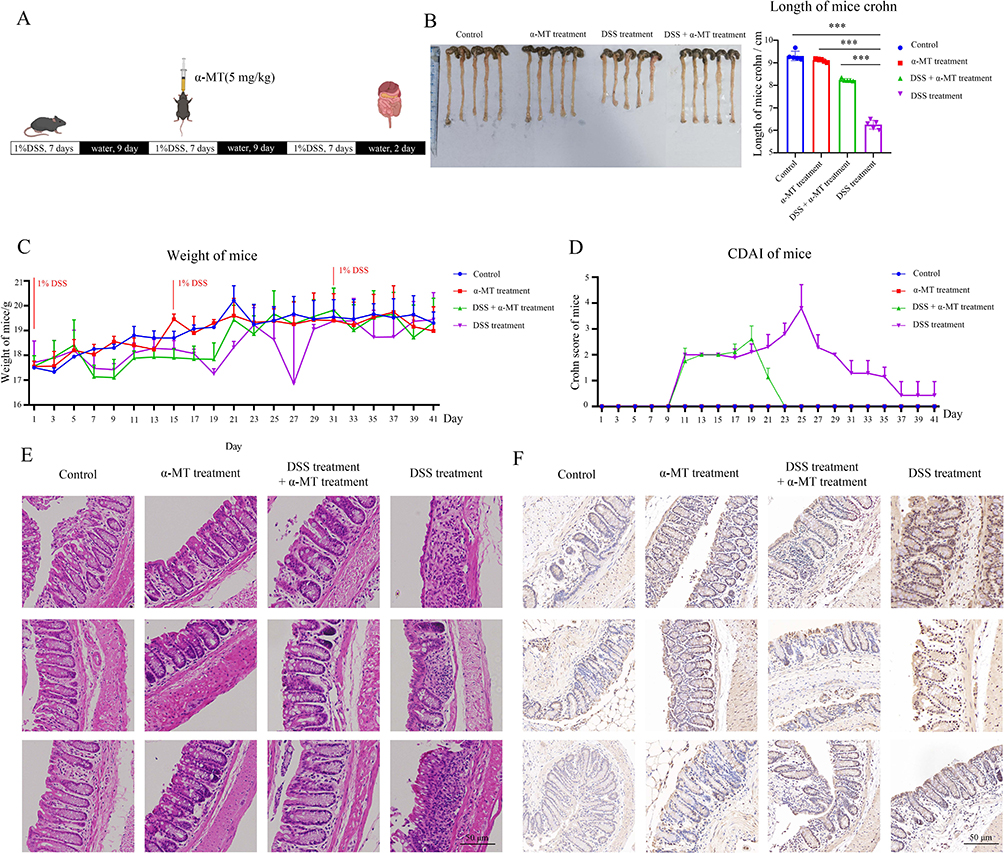 |
Figure 7 In the dextran sodium sulfate (DSS)-induced mouse model of CD, α-methyl-tryptophan (α-MT) ameliorated disease progression. (A) Flow chart of DSS-induced CD in mice. (B) Mouse colon length measurement. The length was measured from the lower edge of the cecum to the anus. (C) Variation in mouse body weight. (D) Crohn’s disease activity index (CDAI) in mice. The CDAI score was determined by integrating the mouse’s weight changes, the extent of rectal bleeding, and the consistency of feces. (E) Hematoxylin and eosin staining of the mouse colon segment, focusing on the glandular integrity of the intestines. (F) Mouse colon IHC results to characterize the expression of SLC6A14. ***, p<0.001. |
Effect of SLC6A14 on Immune Infiltration in Lesions of Mice with CD
One characteristic of CD is the exacerbation of local inflammation. A more significant feature is the increased infiltration of immune cells, including macrophages,12 CD4+ T cells,22 and CD8+ T cells.21 Using the refined methodologies of LASSO/SVM to discern DEGs, our exploration within immune-related databases revealed a positive association between the degree of infiltration of CD4+ and CD8+ T cells and SLC6A14 expression. This suggests that SLC6A14 may contribute to CD development by altering CD4+ and CD8+ T cell infiltration in the intestinal lesions of patients with CD.
RT-PCR results indicated significantly elevated levels of cytokines, such as IFN-γ and TNF-α, which influence T cell differentiation, compared with the control group. Additionally, the immune cell surface markers CXCR-3 and LAG-3 were upregulated. Meanwhile, α-MT treatment markedly decreased the expression of these genes. This implies that the CD mice treated with α-MT exhibited decreased SLC6A14 expression, impeding chemokine metabolism processes (Figure 8a–f).
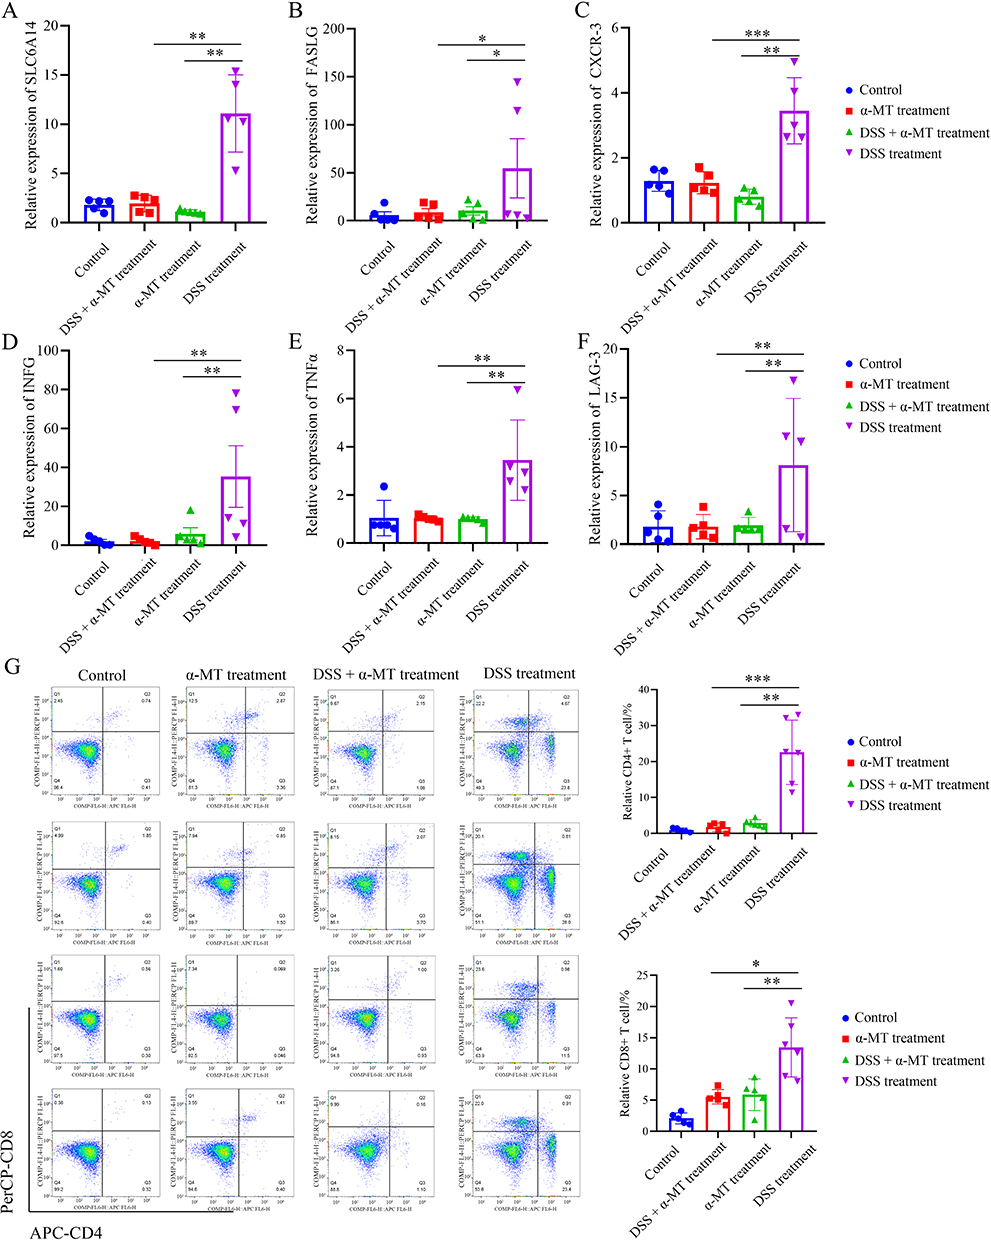 |
Figure 8 Correlation between SLC6A14 and the degree of immune cell infiltration in CD mice. (A) The expression of SLC6A14 showed an upward trend in the CD mouse colon segment (p < 0.05). (B–F) The expression of CD4+ and CD8+ T cell-related markers, including FASLG (B), CXCL3 (C), INFG (D), TNFα (E), and Lag-3 (F), was significantly upregulated in the mice with CD (p < 0.05). (G) Flow cytometry was used to detect immune cell infiltration in the intestines of mice. Compared with the CD model group, the intestinal immune infiltration of α-MT-treated mice was significantly improved, and the infiltration ratio of CD4+ and CD8+ T cell cells was significantly reduced (p < 0.05). *, p<0.05; **, p<0.01; ***, p<0.001. |
Flow cytometry analyses revealed a significantly higher degree of intestinal CD4+ and CD8+ T cell infiltration in the DSS treatment group than that in the control group. Conversely, compared with the DSS treatment group, the proportion of infiltrating CD4+ and CD8+ T cells in the CD mice subjected to α-MT treatment was notably reduced (Figure 8g). These findings suggest an augmented synthesis of inflammatory factors promoting immune cell infiltration and abundance in the intestines of mice with CD, exacerbating the degree of intestinal immune cell infiltration. Inhibiting the expression of SLC6A14 reduced CD4+ and CD8+ T cell infiltration in the intestines of mice with CD, thereby suppressing CD progression. This highlights SLC6A14 as a potentially crucial therapeutic target for CD.
Discussion
In this study, we used relevant data from databases, clinical samples, and animal models, which revealed high SLC6A14 expression in CD. The elevated expression levels of SLC6A14 were positively correlated with the extent of immune cell infiltration. Targeted inhibition of SLC6A14 expression through α-MT alleviated the infiltration of intestinal immune cells, thereby controlling the progression of CD. These findings support the need to analyze the immune regulatory mechanism of CD for developing treatment options.
Using the CD dataset in the GEO database16,44 and KEGG pathway analysis,45 we found that, unlike normal tissues, the DEGs in CD tissues were enriched mainly in immune infiltration–related pathways, corroborating the insights gleaned from published research.19,46 An intersection of the LASSO method and SVM algorithm with the CD regulatory genes obtained by WGCNA yielded the differential gene SLC6A14. We discovered that SLC6A14 is significantly overexpressed in CD samples, and its expression is positively correlated with the degree of infiltration by CD4+ and CD8+ T cells, which has great potential as a marker for the diagnosis and prognosis of CD. Moreover, the elevated levels of SLC6A14 RNA and protein were confirmed in clinical CD tissues and animal models of CD.
SLC6A14 belongs to the solute-carrier transporter superfamily. Members of this family are widely involved in the maintenance of immune homeostasis47 and participate in ferroptosis by regulating T cell amino acid metabolism48 and the C/EBPβ–PAK6 pathway,35 as well as affecting the immune response. Our study revealed that SLC6A14 exhibited high levels of expression in both clinical specimens and animal models of CD. Therefore, we hypothesized that SLC6A14 regulates CD by affecting the proliferation and differentiation of intestinal immune T cells. Studies on SLC6A14 and its family members have shown that this family of genes promotes the proliferation of Tregs.48,49 Evaluation of the immune correlation of SLC6A14 in CD using the ssGSEA algorithm revealed a positive association between increased SLC6A14 expression and the extent of CD4+ and CD8+ T cell infiltration. In our research, there is a significantly higher degree of intestinal CD4+ and CD8+ T cell infiltration in the CD model mice, which indicated that SLC6A14 could serve as an indicator of CD4+ and CD8+ T cell infiltration in the lesion tissue of animal models with CD. Conversely, the proportion of infiltrating CD4+ and CD8+ T cells in the CD mice subjected to α-MT treatment was notably reduced. These findings suggest an augmented synthesis of inflammatory factors promoting immune cell infiltration and abundance in the intestines of mice with CD, exacerbating the degree of intestinal immune cell infiltration. Inhibiting the expression of SLC6A14 reduced CD4+ and CD8+ T cell infiltration in the intestines of mice with CD, thereby suppressing CD progression. This highlights SLC6A14 as a potentially crucial therapeutic target for CD. The findings from the external validation set also revealed a markedly positive association between SLC6A14 expression and the presence of CD4+ and CD8+ T cells. The expression levels of SLC6A14 in the intestine mirror the infiltration rates of intestinal CD4+ and CD8+ T cells, suggesting that SLC6A14 can effectively reduce the severity of CD.
The mode of action of CD immune-related inhibitors in treating CD is by inhibiting interleukins, integrins, and TNF-α.32 Common drugs include upadacitinib,30,31 risankizumab,31 guselkumab,33 infliximab, vedolizumab (Entyvio), adalimumab (Humira), pexelizumab (Cimzia), ustekinumab (Stelara), risankizumab, azathioprine, methotrexate, anti-inflammatory 5-aminosalicylic acid formulations, and prednisone.32 However, patients with CD may develop tolerance to single immunosuppressant therapy, resulting in poor therapeutic efficacy.50 Therefore, new immunosuppressive pathways and combined immunotherapy strategies need to be explored for the effective treatment of patients with CD. The SLC6A14-targeting inhibitor α-MT inhibits cell proliferation by blocking the mTOR pathway, promoting local thrombus formation under sonodynamic forces, and eliminating diseased tissue.43,51 Combined with the high SLC6A14 expression in CD tissues and its confirmed strong association with both CD4+ and CD8+ T cells found in our database analysis, we hypothesized that α-MT inhibits the proliferation of intestinal immune cells by inhibiting SLC6A14 expression.
Our animal experiments showed that the immune function of the intestinal tract of mice treated with α-MT was significantly restored, and the percentages of both CD4+ and CD8+ T cells decreased significantly. These findings indicate that SLC6A14-related inhibitors can be combined with sonodynamic blood supply occlusion therapy and inhibit the inflammatory response in the intestine, thereby eliminating CD tissue simultaneously. This offers new possibilities for the minimally invasive treatment of CD.
Conclusion
Controlling SLC6A14 expression inhibits the intestinal immune activity of DSS-induced CD in mice to an appreciable extent, providing a new avenue for clinically diagnosing and treating CD. Nevertheless, this study is not without its limitations. For instance, the quantity of clinical specimens was not sufficient, which could have potentially limited the robustness of the conclusions drawn, and the algorithm screening could have been further optimized. Addressing these limitations will be a major focus of our subsequent research.
Abbreviations
α-MT, α-methyl-tryptophan; AUC, area under the curve; CD, Crohn’s disease; CDAI, Crohn’s disease activity index; CK2A, casein kinase 2 alpha 1; CXCL8, CXC motif chemokine ligand 8; DEGs, differentially expressed genes; DSS, dextran sodium sulfate; GEO, Gene Expression Omnibus; GO, Gene Ontology; GS, gene significance; GSEA, Gene Set Enrichment Analysis; IFN, interferon; IHC, immunohistochemistry; IL, interleukin; JAK, Janus kinase; KEGG, Kyoto Encyclopedia of Genes and Genomes; LASSO, Least Absolute Shrinkage and Selection Operator; LGR5, leucine-rich repeat-containing G protein-coupled receptor 5; miRNAs, microRNAs; MM, module membership; NOD, nucleotide-binding oligomerization; PBS, phosphate-buffered saline; PHF5A, PHD finger-like domain-containing protein 5A; RFE, recursive feature elimination; ROC, receiver operating characteristic; RT-PCR, reverse transcription-polymerase chain reaction; ssGSEA, simple sample GSEA; STAT, signal transducer and activator of transcription; SVM, support vector machine; TNF, tumor necrosis factor; Tregs, regulatory T cells; WGCNA, weighted correlation network analysis.
Data Sharing Statement
The data that support the findings of this study are available from the corresponding author upon reasonable request.
Ethics Approval and Informed Consent
The guidelines of the National Institutes of Health (NIH) for the care and use of laboratory animals were applied on all animal experiments of this study. The animal study protocol was approved by the Institutional Review Board at Zhongshan Hospital, affiliated with Xiamen University. This study was conducted in accordance with the Declaration of Helsinki. The samples were collected with the approval of the ethical committee of the Affiliated Zhongshan Hospital of Xiamen University after written informed consent had been obtained from each patient.
Author Contributions
All authors made a significant contribution to the work reported, whether that is in the conception, study design, execution, acquisition of data, analysis and interpretation, or in all these areas; took part in drafting, revising or critically reviewing the article; gave final approval of the version to be published; have agreed on the journal to which the article has been submitted; and agree to be accountable for all aspects of the work.
Funding
This work was supported by grants from the National Natural Science Foundation of China (82204424), Natural Foundation of Fujian Province (2021R1001003, 2022R1001002, and 2023J011593), and Xiamen Science and Technology Project (3502Z20227306, 3502Z20227157, and 3502Z20214ZD1044).
Disclosure
The authors declare no conflicts of interest.
References
1. Ng SC, Shi HY, Hamidi N, et al. Worldwide incidence and prevalence of inflammatory bowel disease in the 21st century: a systematic review of population-based studies. Lancet. 2017;390(10114):2769–2778. doi:10.1016/S0140-6736(17)32448-0
2. Torres J, Mehandru S, Colombel JF, Peyrin-Biroulet L. Crohn’s disease. Lancet. 2017;389(10080):1741–1755. doi:10.1016/s0140-6736(16)31711-1
3. Frolkis AD, Dykeman J, Negrón ME, et al. Risk of surgery for inflammatory bowel diseases has decreased over time: a systematic review and meta-analysis of population-based studies. Gastroenterology. 2013;145(5):996–1006. doi:10.1053/j.gastro.2013.07.041
4. Gionchetti P, Dignass A, Danese S, et al. 3rd European evidence-based consensus on the diagnosis and management of Crohn’s disease 2016: part 2: surgical management and special situations. J Crohns Colitis. 2017;11(2):135–149. doi:10.1093/ecco-jcc/jjw169
5. Baumgart DC, Sandborn WJ. Crohn’s disease - ScienceDirect. Lancet. 2012;380(9853):1590–1605. doi:10.1016/S0140-6736(12)60026-9
6. Rutgeerts P, Geboes K, Vantrappen G, Beyls J, Kerremans R, Hiele M. Predictability of the postoperative course of Crohn’s disease. Gastroenterology. 1990;99(4):956–963. doi:10.1016/0016-5085(90)90613-6
7. Buisson A, Gonzalez F, Poullenot F, et al. Comparative acceptability and perceived clinical utility of monitoring tools: a nationwide survey of patients with inflammatory bowel disease. Inflamm Bowel Dis. 2017;23(8):1425–1433. doi:10.1097/mib.0000000000001140
8. Plevy S. A molecular connection hints at how a genetic risk factor drives Crohn’s disease. Nature. 2021;593(7858):201–203. doi:10.1038/d41586-021-00979-z
9. Shen Z, Luo W, Tan B, et al. Roseburia intestinalis stimulates TLR5-dependent intestinal immunity against Crohn’s disease. EBioMedicine. 2022;85:104285. doi:10.1016/j.ebiom.2022.104285
10. Sidiq T, Yoshihama S, Downs I, Kobayashi KS. Nod2: a critical regulator of ileal microbiota and Crohn’s disease. Front Immunol. 2016;7:367. doi:10.3389/fimmu.2016.00367
11. Zhuang X, Chen B, Huang S, et al. Hypermethylation of miR-145 promoter-mediated SOX9-CLDN8 pathway regulates intestinal mucosal barrier in Crohn’s disease. EBioMedicine. 2022;76:103846. doi:10.1016/j.ebiom.2022.103846
12. Petagna L, Antonelli A, Ganini C, et al. Pathophysiology of Crohn’s disease inflammation and recurrence. Biol Direct. 2020;15(1):23. doi:10.1186/s13062-020-00280-5
13. Cuthbert AP, Fisher SA, Mirza MM, et al. The contribution of NOD2 gene mutations to the risk and site of disease in inflammatory bowel disease. Gastroenterology. 2002;122(4):867–874. doi:10.1053/gast.2002.32415
14. Stafford CA, Gassauer AM, de Oliveira Mann CC, et al. Phosphorylation of muramyl peptides by NAGK is required for NOD2 activation. Nature. 2022;609(7927):590–596. doi:10.1038/s41586-022-05125-x
15. Yang W, Gibson SA, Yan Z, et al. Protein kinase 2 (CK2) controls CD4(+) T cell effector function in the pathogenesis of colitis. Mucosal Immunol. 2020;13(5):788–798. doi:10.1038/s41385-020-0258-x
16. Chen H, Chen C, Yuan X, et al. Identification of immune cell landscape and construction of a novel diagnostic nomogram for Crohn’s disease. Front Genet. 2020;11:423. doi:10.3389/fgene.2020.00423
17. Yu B, Yin YX, Tang YP, et al. Diagnostic and predictive value of immune-related genes in Crohn’s disease. Front Immunol. 2021;12:643036. doi:10.3389/fimmu.2021.643036
18. Shivaji UN, Evans M, Critchlow T, et al. Chronic inflammation and other changes are significant components of clinically fibrotic strictures in Crohn’s disease: a histological study of resected strictures clinically characterized as noninflamed. Eur J Gastroenterol Hepatol. 2020;32(11):1432–1439. doi:10.1097/meg.0000000000001796
19. Zhang D, Li Y, Du C, et al. Evidence of pyroptosis and ferroptosis extensively involved in autoimmune diseases at the single-cell transcriptome level. J Transl Med. 2022;20(1):363. doi:10.1186/s12967-022-03566-6
20. Neurath MF. Current and emerging therapeutic targets for IBD. Nat Rev Gastroenterol Hepatol. 2017;14(5):269–278. doi:10.1038/nrgastro.2016.208
21. Globig AM, Mayer LS, Heeg M, et al. Exhaustion of CD39-expressing CD8(+) T cells in Crohn’s disease is linked to clinical outcome. Gastroenterology. 2022;163(4):965–981.e31. doi:10.1053/j.gastro.2022.06.045
22. Pedersen TK, Brown EM, Plichta DR, et al. The CD4(+) T cell response to a commensal-derived epitope transitions from a tolerant to an inflammatory state in Crohn’s disease. Immunity. 2022;55(10):1909–1923.e6. doi:10.1016/j.immuni.2022.08.016
23. Rieder F, Zimmermann EM, Remzi FH, Sandborn WJ. Crohn’s disease complicated by strictures: a systematic review. Gut. 2013;62(7):1072–1084. doi:10.1136/gutjnl-2012-304353
24. Franke A, McGovern DP, Barrett JC, et al. Genome-wide meta-analysis increases to 71 the number of confirmed Crohn’s disease susceptibility loci. Nat Genet. 2010;42(12):1118–1125. doi:10.1038/ng.717
25. Wang C, Segal LN, Hu J, et al. Microbial risk score for capturing microbial characteristics, integrating multi-omics data, and predicting disease risk. Microbiome. 2022;10(1):121. doi:10.1186/s40168-022-01310-2
26. Khaloian S, Rath E, Hammoudi N, et al. Mitochondrial impairment drives intestinal stem cell transition into dysfunctional Paneth cells predicting Crohn’s disease recurrence. Gut. 2020;69(11):1939–1951. doi:10.1136/gutjnl-2019-319514
27. Malik TA. Inflammatory bowel disease: historical perspective, epidemiology, and risk factors. Surg Clin North Am. 2015;95(6):1105–22,v. doi:10.1016/j.suc.2015.07.006
28. Cao Y, Wang Z, Yan Y, et al. Enterotoxigenic Bacteroides fragilis promotes intestinal inflammation and malignancy by inhibiting exosome-packaged miR-149-3p. Gastroenterology. 2021;161(5):1552–1566.e12. doi:10.1053/j.gastro.2021.08.003
29. Zikherman J, Weiss A. Unraveling the functional implications of GWAS: how T cell protein tyrosine phosphatase drives autoimmune disease. J Clin Invest. 2011;121(12):4618–4621. doi:10.1172/jci60001
30. Sandborn WJ, Feagan BG, Loftus EV, et al. Efficacy and safety of upadacitinib in a randomized trial of patients with Crohn’s disease. Gastroenterology. 2020;158(8):2123–2138.e8. doi:10.1053/j.gastro.2020.01.047
31. Barberio B, Gracie DJ, Black CJ, Ford AC. Efficacy of biological therapies and small molecules in induction and maintenance of remission in luminal Crohn’s disease: systematic review and network meta-analysis. Gut. 2022;72(2):264–274. doi:10.1136/gutjnl-2022-328052
32. Frei R, Fournier N, Zeitz J, et al. Early initiation of Anti-TNF is associated with favourable long-term outcome in Crohn’s disease: 10-Year-follow-up data from the Swiss IBD cohort study. J Crohns Colitis. 2019;13(10):1292–1301. doi:10.1093/ecco-jcc/jjz057
33. Sandborn WJ, D’Haens GR, Reinisch W, et al. Guselkumab for the treatment of Crohn’s disease: induction results from the Phase 2 GALAXI-1 study. Gastroenterology. 2022;162(6):1650–1664.e8. doi:10.1053/j.gastro.2022.01.047
34. Gravina AG, Pellegrino R, Durante T, et al. The melanocortin system in inflammatory bowel diseases: insights into its mechanisms and therapeutic potentials. Cells. 2023;12(14):1889. doi:10.3390/cells12141889
35. Chen Y, Yan W, Chen Y, et al. SLC6A14 facilitates epithelial cell ferroptosis via the C/EBPβ-PAK6 axis in ulcerative colitis. Cell mol Life Sci. 2022;79(11):563. doi:10.1007/s00018-022-04594-7
36. Friedman J, Hastie T, Tibshirani R. Regularization paths for generalized linear models via coordinate descent. J Stat Softw. 2010;33(1):1–22. doi:10.18637/jss.v033.i01
37. Guyon I, Weston J, Barnhill S, Vapnik V. Gene selection for cancer classification using support vector machines. Machine Learning. 2002;46(1):389–422. doi:10.1023/A:1012487302797
38. Meyer D, Dimitriadou E, Hornik K, Weingessel A, Leisch F. Misc functions of the department of statistics, probability theory group (Formerly: E1071), TU Wien [R package e1071 version 1.7-4]. 2020:e1071.
39. Yu G, Wang LG, Han Y, He QY. clusterProfiler: an R package for comparing biological themes among gene clusters. Omics. 2012;16(5):284–287. doi:10.1089/omi.2011.0118
40. Hänzelmann S, Castelo R, Guinney J. GSVA: gene set variation analysis for microarray and RNA-seq data. BMC Bioinf. 2013;14(1):7. doi:10.1186/1471-2105-14-7
41. Charoentong P, Finotello F, Angelova M, et al. Pan-cancer immunogenomic analyses reveal genotype-immunophenotype relationships and predictors of response to checkpoint blockade. Cell Rep. 2017;18(1):248–262. doi:10.1016/j.celrep.2016.12.019
42. Yu Y, Brouillette MJ, Seol D, Zheng H, Buckwalter JA, Martin JA. Use of recombinant human stromal cell-derived factor 1α-loaded fibrin/hyaluronic acid hydrogel networks to achieve functional repair of full-thickness bovine articular cartilage via homing of chondrogenic progenitor cells. Arthritis Rheumatol. 2015;67(5):1274–1285. doi:10.1002/art.39049
43. Zhou L, Feng W, Mao Y, Chen Y, Zhang X. Nanoengineered sonosensitive platelets for synergistically augmented sonodynamic tumor therapy by glutamine deprivation and cascading thrombosis. Bioact Mater. 2023;24:26–36. doi:10.1016/j.bioactmat.2022.11.020
44. Edgar R, Domrachev M, Lash AE. Gene Expression Omnibus: NCBI gene expression and hybridization array data repository. Nucleic Acids Res. 2002;30(1):207–210. doi:10.1093/nar/30.1.207
45. Low END, Mokhtar NM, Wong Z, Raja Ali RA. Colonic mucosal transcriptomic changes in patients with long-duration ulcerative colitis revealed colitis-associated cancer pathways. J Crohns Colitis. 2019;13(6):755–763. doi:10.1093/ecco-jcc/jjz002
46. Martin JC, Chang C, Boschetti G, et al. Single-cell analysis of Crohn’s disease lesions identifies a pathogenic cellular module associated with resistance to Anti-TNF therapy. Cell. 2019;178(6):1493–1508.e20. doi:10.1016/j.cell.2019.08.008
47. Song W, Li D, Tao L, Luo Q, Chen L. Solute carrier transporters: the metabolic gatekeepers of immune cells. Acta Pharm Sin B. 2020;10(1):61–78. doi:10.1016/j.apsb.2019.12.006
48. Wang W, Zou W. Amino acids and their transporters in T cell immunity and cancer therapy. Mol Cell. 2020;80(3):384–395. doi:10.1016/j.molcel.2020.09.006
49. Procaccini C, Garavelli S, Carbone F, et al. Signals of pseudo-starvation unveil the amino acid transporter SLC7A11 as key determinant in the control of Treg cell proliferative potential. Immunity. 2021;54(7):1543–1560.e6. doi:10.1016/j.immuni.2021.04.014
50. Nayar S, Morrison JK, Giri M, et al. A myeloid-stromal niche and gp130 rescue in NOD2-driven Crohn’s disease. Nature. 2021;593(7858):275–281. doi:10.1038/s41586-021-03484-5
51. Karunakaran S, Ramachandran S, Coothankandaswamy V, et al. SLC6A14 (ATB0,+) protein, a highly concentrative and broad specific amino acid transporter, is a novel and effective drug target for treatment of estrogen receptor-positive breast cancer. J Biol Chem. 2011;286(36):31830–31838. doi:10.1074/jbc.M111.229518
 © 2025 The Author(s). This work is published and licensed by Dove Medical Press Limited. The
full terms of this license are available at https://www.dovepress.com/terms
and incorporate the Creative Commons Attribution
- Non Commercial (unported, 3.0) License.
By accessing the work you hereby accept the Terms. Non-commercial uses of the work are permitted
without any further permission from Dove Medical Press Limited, provided the work is properly
attributed. For permission for commercial use of this work, please see paragraphs 4.2 and 5 of our Terms.
© 2025 The Author(s). This work is published and licensed by Dove Medical Press Limited. The
full terms of this license are available at https://www.dovepress.com/terms
and incorporate the Creative Commons Attribution
- Non Commercial (unported, 3.0) License.
By accessing the work you hereby accept the Terms. Non-commercial uses of the work are permitted
without any further permission from Dove Medical Press Limited, provided the work is properly
attributed. For permission for commercial use of this work, please see paragraphs 4.2 and 5 of our Terms.