")
Back to Journals » Pharmacogenomics and Personalized Medicine » Volume 14
Wuzhi Capsule Dosage Affects Tacrolimus Elimination in Adult Kidney Transplant Recipients, as Determined by a Population Pharmacokinetics Analysis
Authors Chen L, Yang Y, Wang X, Wang C , Lin W, Jiao Z, Wang Z
Received 26 May 2021
Accepted for publication 6 August 2021
Published 3 September 2021 Volume 2021:14 Pages 1093—1106
DOI https://doi.org/10.2147/PGPM.S321997
Checked for plagiarism Yes
Review by Single anonymous peer review
Peer reviewer comments 2
Editor who approved publication: Dr Martin H Bluth
Lizhi Chen,1,* Yunyun Yang,1,2,* Xuebin Wang,1,* Chenyu Wang,2 Weiwei Lin,3 Zheng Jiao,2,4 Zhuo Wang1
1Department of Pharmacy, Shanghai Changhai Hospital, Naval Medical University, Shanghai, 200433, People’s Republic of China; 2Department of Pharmacy, Shanghai Chest Hospital, Shanghai Jiao Tong University, Shanghai, 200030, People’s Republic of China; 3Department of Pharmacology, The First Affiliated Hospital, Fujian Medical University, Fuzhou, People’s Republic of China; 4Department of Pharmacy, Huashan Hospital, Fudan University, Shanghai, 200040, People’s Republic of China
*These authors contributed equally to this work
Correspondence: Zheng Jiao
Department of Pharmacy, Shanghai Chest Hospital, Shanghai Jiao Tong University, 241 Huaihai West Road, Shanghai, 200030, People’s Republic of China
Tel +86 21 2220 0000 ext 3021
Email [email protected]
Zhuo Wang
Department of Pharmacy, Shanghai Changhai Hospital, Naval Medical University, 168 Changhai Road, Shanghai, 200433, People’s Republic of China
Tel/Fax +86-21-31162299
Email [email protected]
Purpose: In this study, we aimed to establish a tacrolimus population pharmacokinetic model and better understand the drug-drug interaction between Wuzhi capsule and tacrolimus in Chinese renal transplant recipients.
Patients and Methods: We performed a population pharmacokinetic analysis using a non-linear mixed-effects model to determine the suitable Wuzhi capsule dose in combination with tacrolimus. Data on 1378 tacrolimus steady-state concentrations were obtained from 142 patients who received kidney transplant in Changhai Hospital and Huashan Hospital. Demographic characteristics, laboratory tests, genetic polymorphisms, and co-medications were evaluated.
Results: The one-compartment model best described data. Our final model identified creatinine clearance rate, hematocrit, Wuzhi capsule dose, CYP3A5*3 genetic polymorphisms, and tacrolimus daily dose as significant covariates for tacrolimus clearance, with the value of 14.4 L h− 1, and the between-subject variability (BSV) was 25.4%. The Wuzhi capsule showed a dose-dependent effect on tacrolimus pharmacokinetics, demonstrating a stronger inhibitory effect than inductive effect.
Conclusion: Our model can accurately describe population pharmacokinetics of tacrolimus when combined with different doses of Wuzhi capsule. Additionally, this model can be used for individualizing tacrolimus dose following kidney transplantation.
Keywords: renal transplantation, inhibitory effect, one-compartment model, CYP3A5
Introduction
Tacrolimus (FK506) is an efficacious immunosuppressive drug used following solid organ transplant;1 however, it has a narrow therapeutic range and large between-patient variability. The bioavailability of tacrolimus is low and highly variable (range 4–89%) owing to its poor solubility and extensive first-pass effect.2 Therapeutic drug monitoring (TDM) is implemented to individualize the dosage of tacrolimus based on the trough concentration (C0) and to reduce the risks of toxicity and rejection risk.3 In general, pharmacokinetic parameters reach a steady state approximately 3 d following therapy initiation. Therefore, early identification of factors that can affect pharmacokinetic biomarkers can facilitate the adjustment of tacrolimus dosage. A population pharmacokinetic (popPK) modeling using the Bayesian estimation is commonly used to quantitatively assess the dependency between a covariate and a pharmacokinetic parameter for identifying inter- and intra-individual variabilities in the estimated pharmacokinetic parameter and the relevant covariate.4
Currently, there are numerous popPK models,5–9 which have been developed to characterize the pharmacokinetics of tacrolimus in adults after kidney transplant. Several factors have been identified to affect tacrolimus pharmacokinetics, including demographic characteristics; CYP3A5, CYP3A4, and ABCB1 genotypes; hematocrit; post-operative days; tacrolimus daily dose; and drug–drug interactions. The tacrolimus doses recommended by the Food and Drug Administration (FDA) are according to patient age, type of transplanted organ, post-transplant day, and immunosuppressive therapy regimens.10 Tacrolimus is metabolized in the liver by cytochrome CYP3A isoenzymes and excreted primarily through faces (approximately 93%). The CYP3A5*3 allele affects tacrolimus pharmacokinetics in organ transplant recipients, and thus dose adjustment based on the CYP3A5 genotypes is necessary.11,12 The guidelines from Clinical Pharmacogenetics Implementation Consortium (CPIS) have summarized and emphasized the effect of CYP3A5 genotype variants on inter-individual variabilities in tacrolimus pharmacokinetics.13 In addition, tacrolimus is a substrate of the transporter p-glycoprotein (P-gp), which is also known as ATP-binding cassette subfamily B member 1 (ABCB1); however, the effect of ABCB1 in the pharmacokinetics of tacrolimus remains controversial.14,15 Drug–drug interaction is another important factor that affects tacrolimus disposition. PopPK studies have identified the effect of prednisolone and calcium channel blockers on tacrolimus pharmacokinetics.16–18
Wuzhi capsule, a traditional Chinese medicine (registration number in China: Z10983013), is often prescribed to alleviate the hepatotoxicity of tacrolimus in China.19–21 Wuzhi capsule has been reported to increase tacrolimus exposure, leading to further dose reduction of approximately 50% or more.22,23 Pharmacokinetic studies24,25 have showed that co-treatment with Wuzhi capsule can reduce the clearance rate, peak concentration, and peak time delay of tacrolimus. In addition, considering that tacrolimus has a narrow therapeutic range, it is important to acquire the target trough concentration.3 Studies have also shown that long-term pre-treatment with Wuzhi capsule could induce CYP3A and CYP2C expression;26,27 hence, determining the dose-effect relationship between Wuzhi capsule and tacrolimus pharmacokinetics and the possible underlying mechanism of action is important.
For this purpose, in this study, we aimed to (i) elucidate the effects of Wuzhi capsule on tacrolimus pharmacokinetics by establishing a population pharmacokinetic model of tacrolimus based on data from transplant recipients in two centers, namely Changhai and Huashan Hospitals, and (ii) determine the drug-drug interaction between Wuzhi capsule and tacrolimus pharmacokinetics and identify the possible action mechanisms.
Materials and Methods
Data
We obtained whole blood trough concentrations (C0, n = 758) of 90 renal transplant patients at the Organ Transplantation Department of Changhai Hospital, Navy Medical University (Shanghai, China) from March 2016 to September 2016. Blood trough concentration data of 52 adult renal recipients (C0, n = 620) were also obtained from Huashan Hospital (Shanghai, China) from May 2009 to December 2013.8
All patients were followed-up until post-operative day 90, and the average number of blood concentrations per subject was 37. The exclusion criteria included missing required information, dialysis treatment, acute rejection, second transplantation, and switching of immunosuppressive agents. The study was approved by the Ethics Committee of Changhai Hospital (number: CHEC2017-219) and Huashan Hospital (number: 2011–183). All participants, from both centers, provided written informed consent, and the study was conducted in accordance with the Declaration of Istanbul (2018).
Immunosuppressive Regime
Patients in both centers received a triple immunosuppressive regimen containing tacrolimus, mycophenolate acid (MPA), and corticosteroids.
Changhai Hospital: The initial dosage of tacrolimus was 0.05–1.0 mg·kg−1·d−1 and then adjusted according to C0 (10–15 ng·mL−1 in the first post-operative month, 8–10 ng·mL−1 between 1 and 3 months, and 5–8 ng·mL−1 thereafter) to ensure clinical efficacy. The range of MPA dosage was 0.25–1.0 g·d−1. Intravenous methylprednisolone was administered at a dose of 500 mg on the operation day and at 20–40 mg daily within 1 week. Intravenous methylprednisolone was then switched to oral prednisone at 10–20 mg·d−1 on days 7–14, which was tapered to 0–10 mg·d−1 during the first 3 months. Wuzhi capsule was administered as appropriate: 709 cases, Wuzhi capsule was co-administered with tacrolimus; 39 cases, 11.25 mg once a day; 498 cases, 11.25 mg twice daily; 21 cases, 11.25mg three times a day, 135 cases, 22.5 mg twice a day; and 16 cases, 22.5 mg three times a day. Only 49 cases did not receive Wuzhi capsule.
Huashan Hospital: The initial dosage of tacrolimus was 0.1–0.15 mg·kg−1·d−1, and the doses were adjusted according to C0: 8–10 ng·mL−1 in the first months after surgery, 6–8 ng·mL−1 between 1 and 3 months, and 3–7 ng·mL−1 thereafter. MPA was orally administered at 0.5 g twice a day for individuals with a body weight (WT) of <50 kg and 0.75 g twice a day for those with a WT of ≥50 kg, with a dosage range of 0.25–1.0 g·d−1. Intravenous methylprednisolone 500 mg was administered for 3 d after surgery, and then switched to prednisolone 80 mg on day 4. The prednisolone dose was subsequently reduced by 5–15 mg·d−1 within a month, and then tapered to 10 mg·d−1 during the first 3 months. No patient was administered Wuzhi capsule.
Sample Collection and Bioanalytical Assay
In Changhai Hospital, Chemiluminescence microparticle immunoassay (CMIA) was performed using an Architect I 1000 system (Abbott Laboratories, Abbott Park, IL, USA) to determine tacrolimus blood concentration. The lower limit of quantitation (LOD) was 1.5 ng·mL−1 and the calibration range was between 2.0 and 30 ng·mL−1.28 In Huashan Hospital, enzyme multiplied immunoassay technique (EMIT) was used with a SYVA Viva-Emit 2000 kit (Siemens Healthcare Diagnostics Inc., Germany). The calibration range was 2.0–30 ng·mL−1 and LOD was 2 ng·mL−1.29 There were systematic biases between CMIA and EMIT. Thus, to correct these biases, the data from Huashan Hospital were converted to their corresponding equivalents in terms of the reported bioassays using the following formula:28
CMIA=0.93*EMIT+0.36.
Genotyping
Blood samples from Changhai Hospital and Huashan Hospital were delivered to Shanghai Yunzhou Biotechnology Co., Ltd. (Shanghai, China) and Huashan Huada Biotechnology Co., Ltd. (Shanghai, China), respectively, for DNA extraction, PCR analysis, and subsequent DNA sequencing. Four single-nucleotide polymorphisms, including CYP3A5*3 (rs776746), ABCB1Exon12 (C1236T, rs1128503), ABCB1Exon21 (G2677A(T), rs2032582), and ABCB1Exon26 (C3435T, rs1045642), were genotyped. Pearson’s x2 test was conducted to assess the deviation in the frequencies of CYP3A5 and ABCB1 genotypes from the Hardy–Weinberg equilibrium.
Population Pharmacokinetic Modeling
We collected demographic and covariate information from patients’ medical records system and TDM database. Non-linear mixed-effects modeling software was used to conduct this PopPK analysis (NONMEM®, version 7.4; ICON Development Solutions, Ellicott City, MD, USA). The NONMEM data file was created using R (version 3.5.1; www.r-project.org). The final base popPK model was selected after comparison of diagnostic plots, objective function value and Akaike information criterion.
Base Model Development
The popPK of tacrolimus was analyzed using a one-compartment (1-CMT) model with the first-order absorption and elimination with parameters depending on total clearance (CL/F) and volume of distribution (Vd/F). As only the trough concentration was obtained and because there was no sampling in the absorption phase, between-subject variability (BSV) of Ka need not be included in the analysis. The Ka was fixed at 3.09 h−1 with no BSV based on the findings of a previous study,6 which used the same population with a similar Ka value in the NONMEN analysis.
We used an exponential model for all parameters for BSV. The equation (Eq) was as follows (except for Ka):
Pi = TV (P) × exp (ηi) (Eq 1)
where Pi represents the ith subject’s pharmacokinetic parameter. TV (P) indicates the typical value of the population parameter, and ηi is the symmetrically distributed BSV and zero-mean random variable with a square deviation of ωi2.
Residual unexplained variability (RUV) was determined using an additive model, a proportional model, and a combination of proportional and additive models (Eqs. 2–4):
F = IPRED + ε1 (Eq 2)
F = IPRED × exp (ε1) (Eq 3)
F = IPRED × exp (ε1) + ε2 (Eq 4)
where F represents the value of observation, IPRED is the prediction value of individual, and εn is the symmetrically distributed variables with variance terms, which were partially estimated using the population model-fitting process.
Covariate Analysis
We estimated the potential covariates in pharmacokinetic parameters, which included weight, height, aspartate aminotransferase level, total serum bilirubin level, hematocrit, creatinine clearance rate, tacrolimus daily dose, postoperative time, and concomitant medications as continuous covariates. CYP3A5 and ABCB1 genes, co-therapy with Wuzhi capsule at cumulative doses for 48 h, and co-therapy with corticosteroids at cumulative doses for 24 h as categorical covariates. Only co-medications that constituted >10% of all patients were tested.
We normalized the continuous covariates to the population median values; taking the creatinine clearance rate as an example, the continuous covariates were tested using linear equations (Eqs. 5–6) and power (Eq. 7) as shown below:

where, Pi represents the ith subject’s pharmacokinetic parameter, the typical value for the parameter is TV (P), COVi means the ith individual’s covariate value, COVmedian is the population median value, and θcov is the coefficient of the covariate effect, which was estimated.
Categorical variables, such as sex, were investigated using a scale model.
Pi=TV(P), if sex=female
where θ represents the degree of influence of a covariate on the parameters.
We used a stepwise forward inclusion and backward elimination strategy. A decrease in the objective value (OFV) of at least 10.83 (P < 0.001, df = 1) was set as a criterion for inclusion of a covariate in the model in the forward inclusion analysis stage. An increase in OFV of at least 10.83 (P < 0.001, df = 1) was set as a criterion for retaining parameters for backward elimination. We excluded covariates with an unexplainable pharmacological or biological basis, or a parameter effect of <10%. The covariates in the model should improve precision of the parameter estimation and goodness-of-fit plots and reduce the BSV and RUV. Finally, the shrinkage extent of the final model was evaluated.
Model Validation
Goodness-of-fit plots, which included the observed concentrations (DV), were plotted against population prediction concentration (PRED) and individual prediction concentration (IPRED), and conditional weighted residuals (CWRES) versus PRED and time after dose were also used to evaluate the fitness of the final model. In addition, we also used bootstrap, prediction-corrected visual predictive checks (pc-VPCs), and normalized prediction distribution errors (NPDEs) to evaluate the performance of the final model.
We used non-parametric bootstrap to assess the robustness of the final model. A total of 2000 bootstraps were performed using NONMEM program. The 2.5th to 97.5th percentiles and the medians of the parameters after bootstrap with successful convergence compared with the final model parameter estimates were obtained using NONMEM®.
Shrinkage was assessed for the between-subject random effects (η) and the residual random effect (ε) of the final model. Shrinkage quantifies the quality of information in the dataset to estimate individual parameter estimates. Empirical Bayes estimates should be interpreted with caution when substantial η- or ε-shrinkage >30%.
For pc-VPCs, the final model was simulated 1000 times to produce the expected concentrations in NONMEM. Profiles for concentration-time of the 10th, 50th, and 90th percentiles of the simulated data were generated and combined with the observed data to produce the expected concentrations.
NPDEs were also investigated. Each observation in the original data was simulated 5000 times using the final model parameters with the simulation-based diagnostic. The NPDE results were statistically summarized and displayed graphically using the NPDE add-on package in R.30
The NPDE results were summarized graphically using quantile-quantile (Q-Q) plot, histogram scatter plot versus time, and PRED. If the NPDE conformed normal distribution with a mean value of zero and a variance of one, then the predictive performance is considered satisfied.
Simulation of Tacrolimus Dosing Strategies with Different Dosages of Wuzhi Capsules
Monte Carlo simulations were performed to estimate the parameters using the final population pharmacokinetic model. The aim was to find the dosing regimen of Wuzhi capsules that can achieve the target C0 (10–15 ng·mL−1) after 7 days of multiple oral doses in subjects with different CYP3A5 genotypes. In the simulations, the individual daily dose of tacrolimus was 4, 6, and 8 mg; the 48-h Wuzhi capsule dose was <45 mg, = 45 mg, and >45 mg; the subjects were CYP3A5 expressers and non-expressers. We performed 1000 simulations using the initial database and C0 was calculated for each simulation.
Results
Study Population
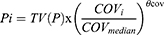
A total of 142 kidney recipients were enrolled in this study, and 1378 trough blood tacrolimus concentration data were available for modeling. In Changhai Hospital, the mean dose of tacrolimus was 5.6 mg·d −1 and the mean tacrolimus C0 was 14.8 ng·mL−1. In Huashan Hospital, the mean dose of tacrolimus was 4.6 mg·d−1 and the mean tacrolimus C0 was 6.5 ng·mL−1. Data of patients’ demographics, laboratory test results, and distribution of the CYP3A5*3, ABCB1Exon12, ABCB1Exon21, and ABCB1Exon26 genotypes, which were used for developing the model, are summarized in Table 1. The primer sequences of the CYP3A5*3, ABCB1Exon12, ABCB1Exon21, and ABCB1Exon26 genotypes are presented in Table S1. There was no deviation from Hardy-Weinberg equilibrium (P > 0.05). The wild types of CYP3A5 constituted 8.54% of the total genotypes. Detailed immunosuppressive regimens and co-medications in Changhai Hospital and Huashan Hospital are presented in Table S2. The doses of mycophenolate and glucocorticoid in Huashan Hospital were higher than those in Changhai Hospital, which may explain why the C0 of tacrolimus was lower in the former than in the latter.
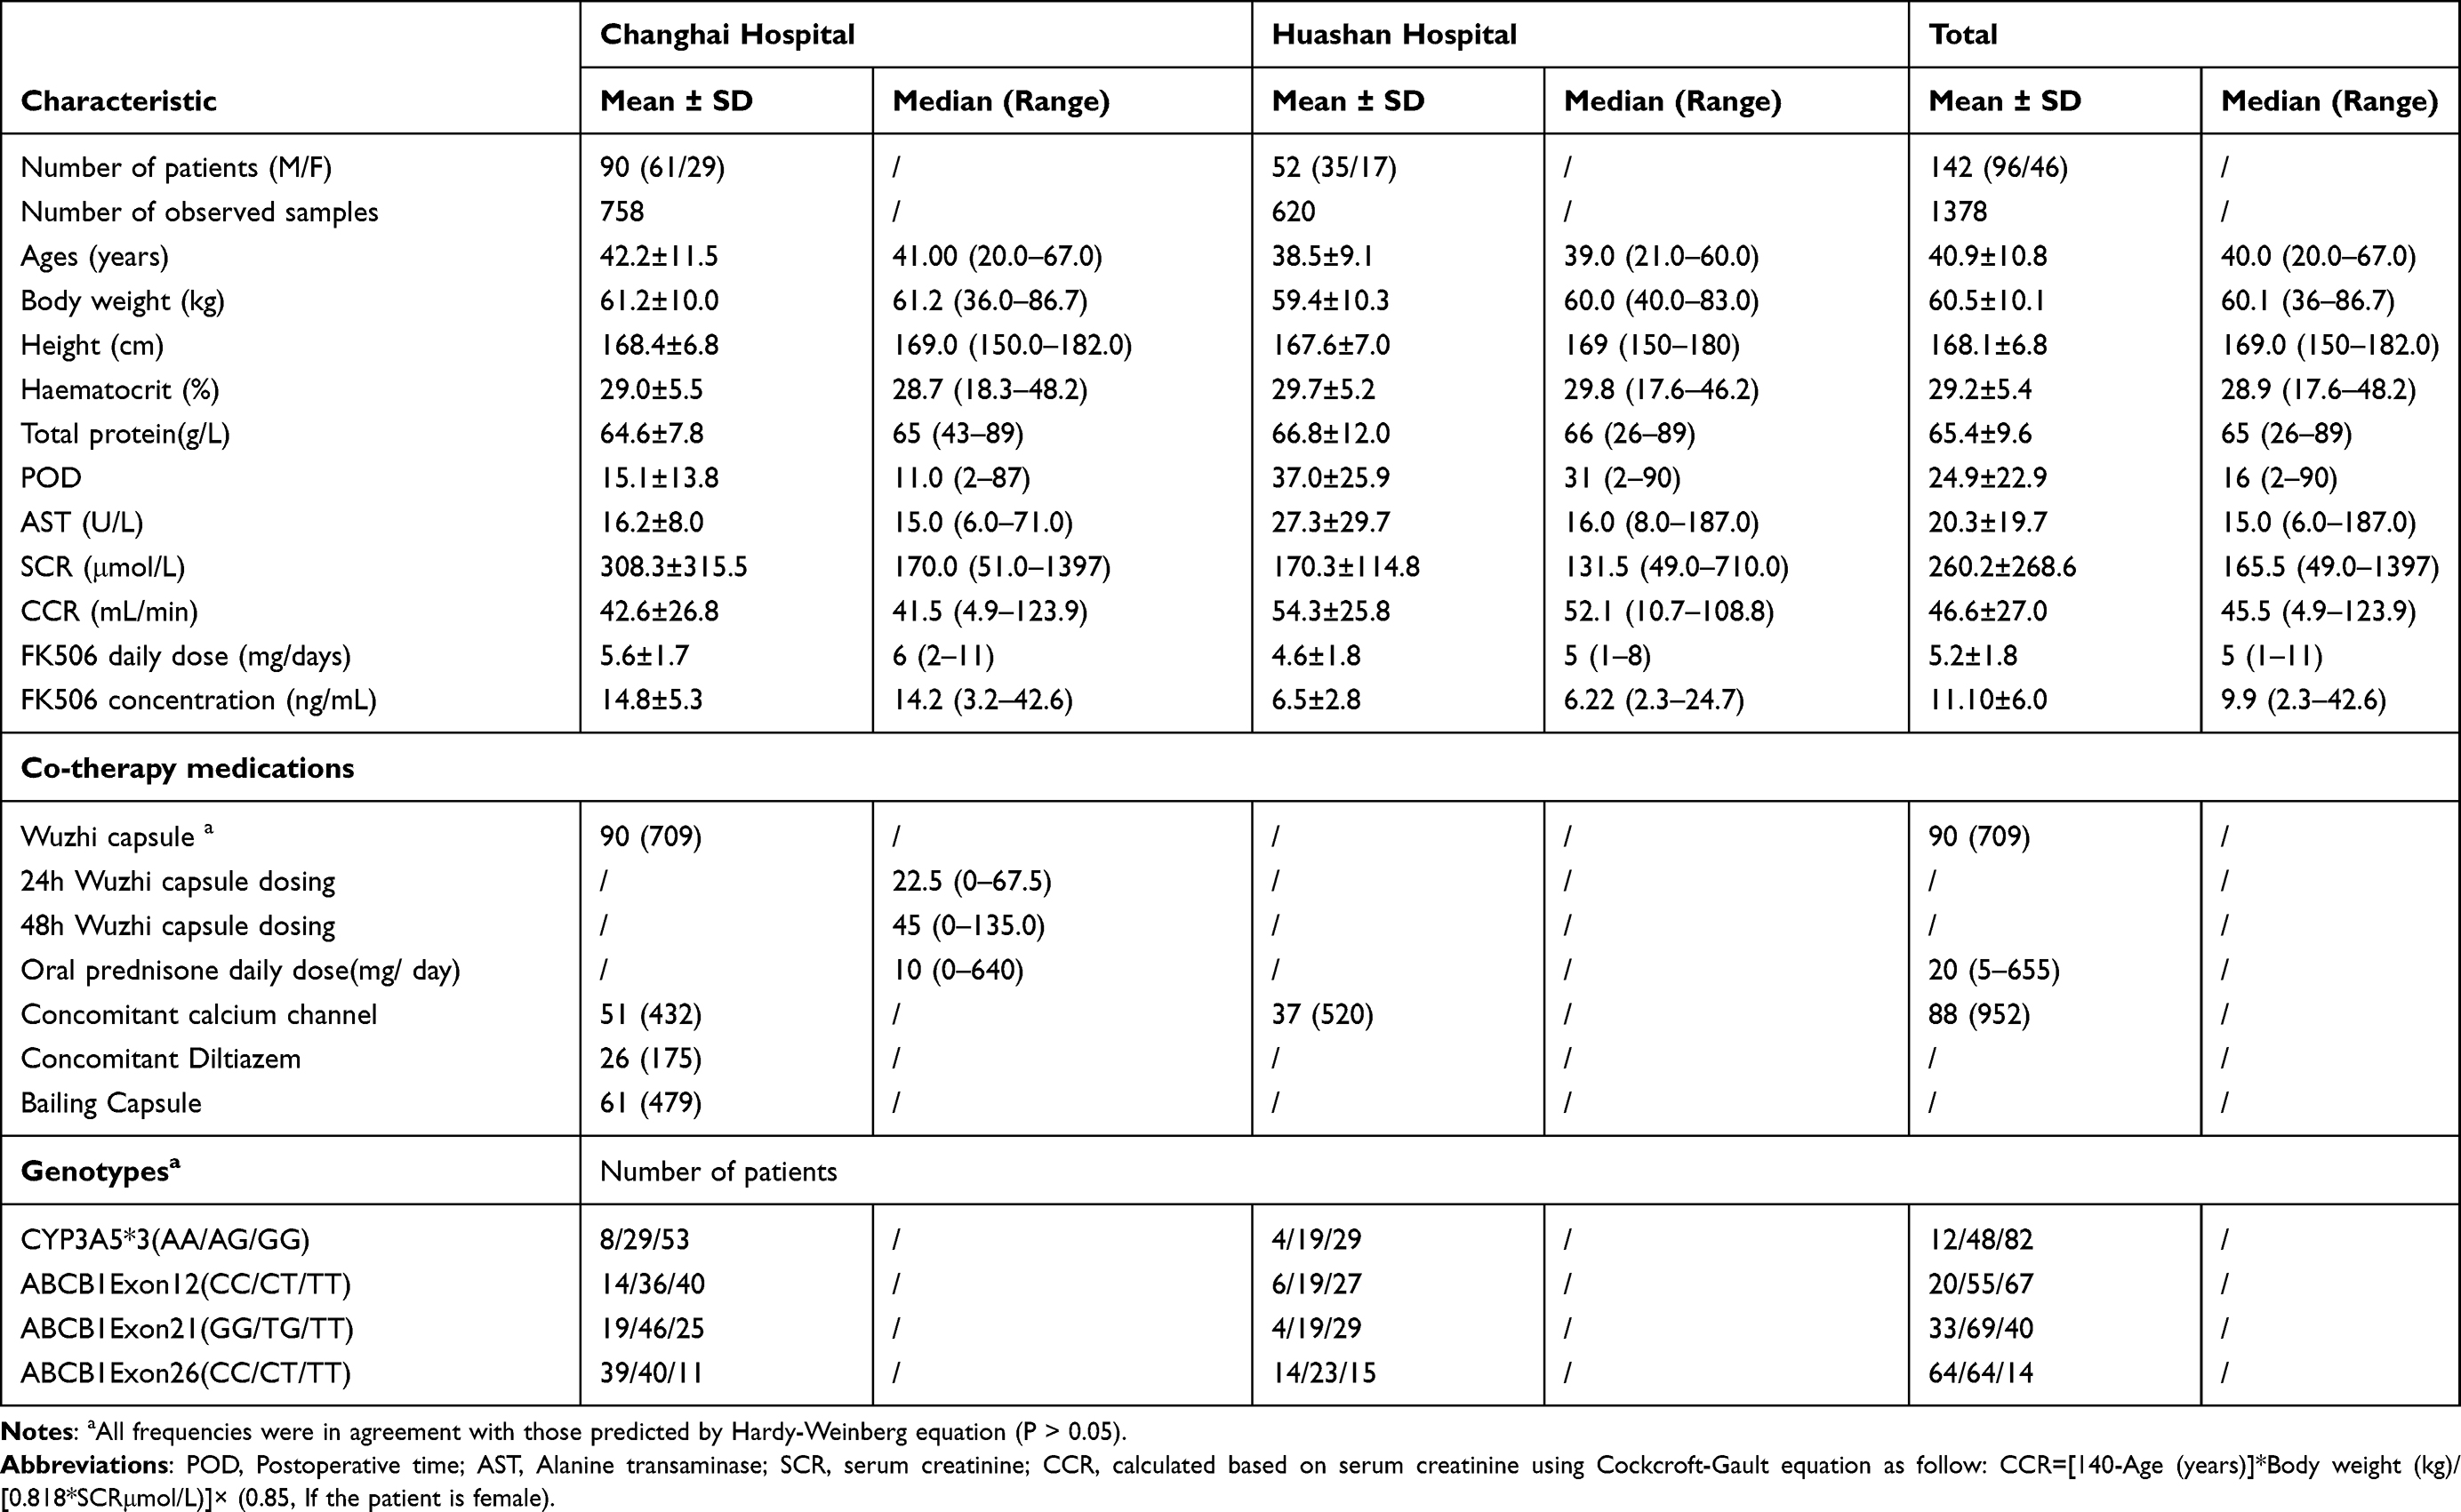 |
Table 1 Demographic Data of the Patients After Kidney Transplantation |
Population Pharmacokinetic Modeling
Our results indicated that a one-compartment model with the first-order absorption was the right choice for modeling. Our final model was stable and predictable and can be used in clinical setting. The residual error model was selected using an exponential method. The model revealed a significant decrease in the OFV for CL/F. None of the covariables affected the OFV of Vd/F in the covariate screening of the Vd/F (P > 0.001) as only trough concentrations were available. All covariates were retained in the final model in the backward elimination step. The forward addition and backward elimination results are presented in Table S3. The final popPK model included the following parameter-covariate relations:
CL/F=14.4 x (CCR/45.5)0.179 x (28.9/HCT)0.503 x (DOSE/5)0.351 x 1.29 (if CYP3A5*1*3 and *1*1 carriers) × 0.566 (if 48-h Wuzhi capsule dosage <45 mg) × 0.783 (if 48-h Wuzhi capsule dosage = 45 mg) × 0.598 (if 48-h Wuzhi capsule dosage >45 mg) × 1 (if 48-h Wuzhi capsule dosage = 0 mg)
Vd/F = 275
where CCR is the creatinine clearance rate by Cockcroft-Gault equation, HCT is hematocrit, and DOSE is the daily dose of tacrolimus.
The population parameter estimates of CL/F and Vd/F in the final model were 14.4 L·h−1 and 275 L, respectively. Furthermore, we also examined the effect of changes in Ka on CL/F. CL/F only decreased from 14.2 to 13.6 when Ka increased from 1 h−1 to 10 h−1, showing a change rate of less than 5%. All retained covariates in the final model explained the 25.4% BSV in CL/F compared with those in the base model, and the creatinine clearance rate showed an obvious effect on CL/F. Moreover, concomitant therapy with Wuzhi capsule led to >20% lower CL/F than non-concomitant therapy. The shrinkage for CL/F was estimated to be 12% and 25% for Vd/F. Precision of all parameters represented by a standard error was acceptable (<30%). The estimation of the population pharmacokinetic parameter and the accuracy of the final model with covariates are presented in Table 2.
 |
Table 2 Population Pharmacokinetic Parameter Estimates of the Base Model, Final Model, and Bootstrap of the Final Model |
Model Validation
Goodness-of-Fit Plots
The goodness-of-fit plots for the base and final models are shown in Figure 1 (a1 and a2). There were no significant biases and deviations in the final model, and the fitting of the final model was greatly improved compared with that of the base model. In the scatterplot of PRED versus DV, there were some underpredictions at high concentrations. However, CWRES were within ± 2, revealing the final model had acceptable fitness.
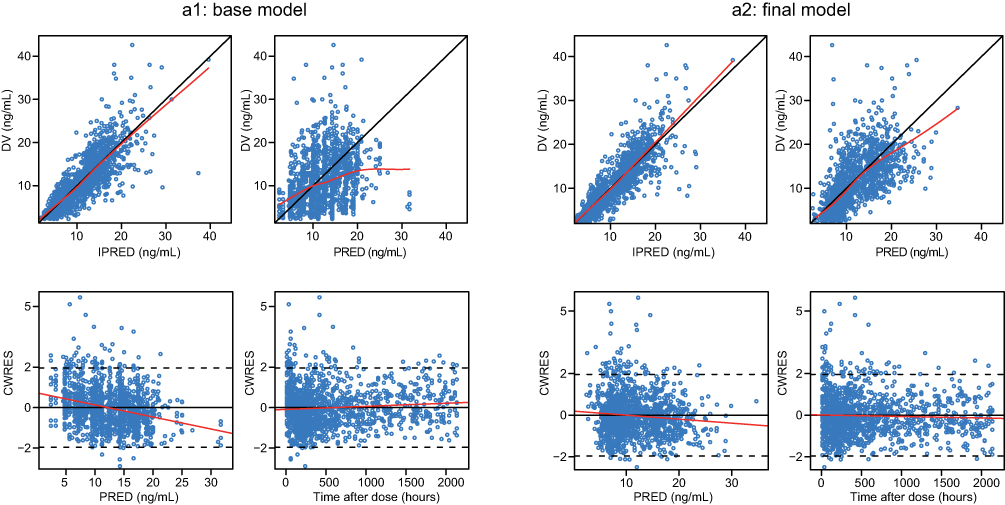 |
Figure 1 Goodness-of-fit plots for the base model (Figure a1) and final model (Figure a2). Abbreviations: DV, dependent variable; IPRED, individual prediction; PRED, population prediction; CWRES, conditional weighted residual. |
Bootstrap Analysis
The data were resampled and 95.6% of 1000 runs were successful in the bootstrap. The median and confidence interval between 2.5% and 97.5% of the estimated values of pharmacokinetic parameters obtained from bootstrap were close to the original dataset with <5% bias. Therefore, the final model was confirmed to be stable with good precision of parameter estimation, as shown in Table 2.
Pc-VPC
The pc-VPCs results of the final model are presented in Figure 2. The 10th, 50th, and 90th percentiles of the observations were within the 95% confidence interval (CI) of the final model’s corresponding prediction percentiles. In addition, nearly 6.83% of the observations was outside the 90% prediction range, revealing that the simulated data and observed concentrations are acceptable.
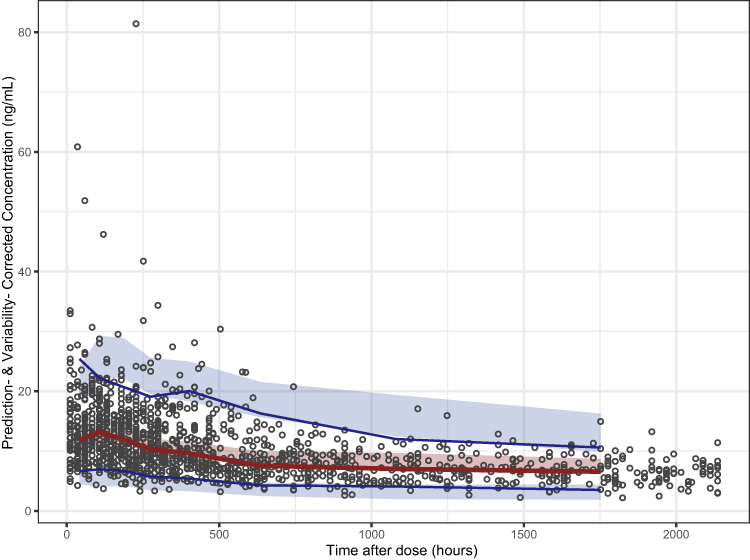 |
Figure 2 Prediction-corrected visual predictive check (pc-VPC) plot of the final pharmacokinetic model. The red solid line represents the prediction-corrected median observed concentration, and the semitransparent red shaded area represents the simulation-based 95% confidence intervals (CIs) for the median. The blue solid line represent the corrected observed 10th and 90th percentiles and the semi-transparent blue shaded areas represent the simulation-based 95% CIs for the corresponding predicted percentiles from the final model. The black dots represent the prediction-corrected observations. |
NPDE
The results of NPDE are presented in Figure 3. The Q-Q plots and histogram of the final model confirmed that the NPDE was normally distributed and had good predictability. The differences between predictions and observations were acceptable with P values >0.05.
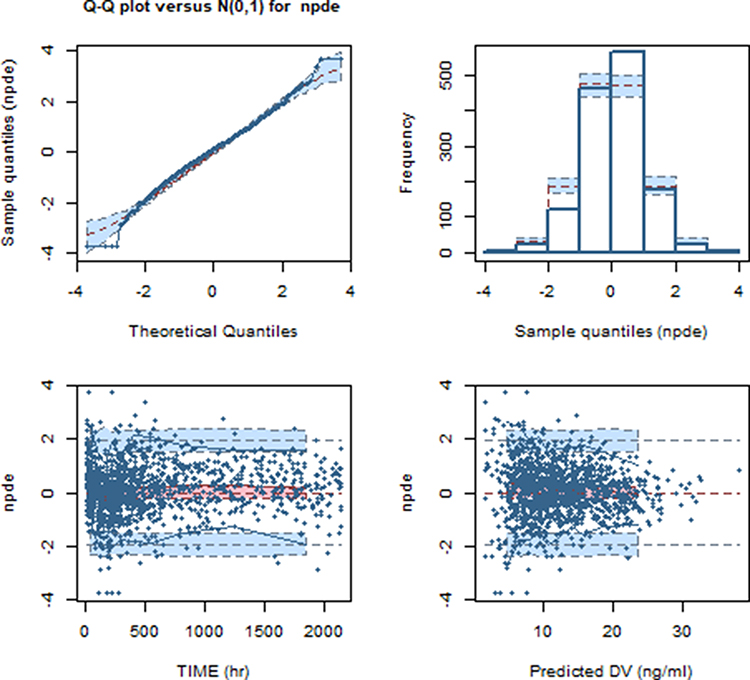 |
Figure 3 Normalized prediction distribution error (NPDE) plot of the final model. (A) Quantile–quantile plot of the distribution of NPDE against the theoretical distribution (semi-transparent blue fields), (B) Histogram of the distribution of NPDE against the theoretical distribution (semi-transparent blue fields), (C) NPDE vs postoperative time (days), (D) NPDE vs predicted concentrations. In plot C and D, the red solid lines represent the median NPDE of the observations, and semi-transparent red fields represent the simulation-based 95% confidence intervals (CIs) for the median. Blue solid lines represent NPDE of the observed 5th and 95th percentiles, and semi-transparent blue fields represent the simulation-based 95% CIs for the corresponding predicted percentiles from the final model. The blue dots represent the NPDE of the observations. |
Dosing Selection Strategies
Monte Carlo simulation results are shown in Figure 4. Serum trough concentrations with Wuzhi capsule (<45 mg, = 45 mg, and >45 mg) and without Wuzhi capsule post renal transplantation were simulated. Our modeling data were focused on the first 7-d period post renal transplantation, with target tacrolimus C0 following renal transplantation of 10–15 ng·mL−1. For CYP3A5 *1 carriers (AA/AG) who were not administered Wuzhi capsule, the current dosage seemed insufficient when compared with that for CYP3A5 *1 non-carriers. Moreover, to achieve the target concentration, patients co-administered with Wuzhi capsule received a lower dosage than CYP3A5 *1 non-carriers receiving only tacrolimus (2.0–3.0 mg q12h vs ≥3.0 mg q12h). Wuzhi capsule at an accumulated dose of below 45 mg (48-h) received the lower dosage, with CYP3A5 non-expressing patients receiving only tacrolimus at 1.0–2.0 mg q12h to attain the target concentration. The model diagnostic diagram indicated a good performance in describing tacrolimus concentration in the period of data collection.
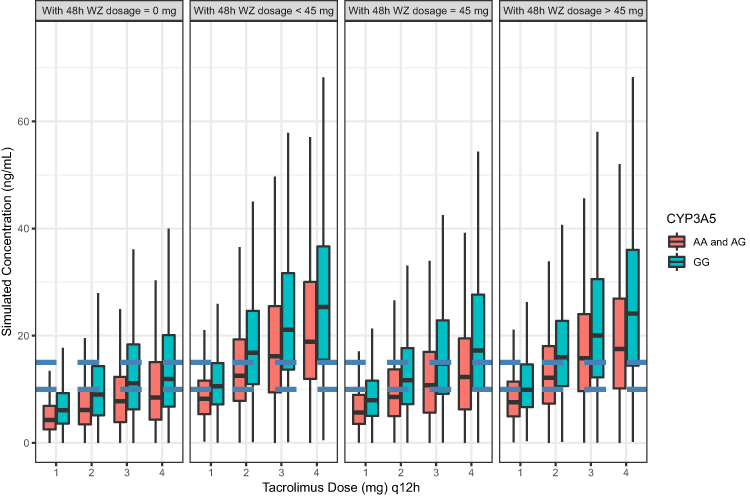 |
Figure 4 Boxplots of the distributions of simulated tacrolimus trough concentrations for CYP3A5 with AA/AG and GG co-administered Wuzhi capsule on 48h for dosage<45mg,=45mg and >45mg, and group on 1, 2, 3 and 4mg q12h regimens in kidney transplant patients. The bold horizontal bars in the middle show the median values, whereas the outer boundaries of the boxes represent the ranges of the 25th and 75th percentiles (interquartile ranges). The whiskers indicate the maximum and minimum values of trough concentrations. |
Discussion
To the best of our knowledge, Wuzhi capsule is commonly used in Chinese solid organ transplantation to reduce tacrolimus dosing. There are two domestic PopPK studies25,31 on the effects of co-administration of tacrolimus with Wuzhi capsule in Chinese renal transplant recipients. These two studies are limited to the effect of Wuzhi Capsule on tacrolimus clearance. To the best of our knowledge, there is no study on the effect of Wuzhi capsule dose on tacrolimus clearance, and it is unclear whether long-term consumption of Wuzhi capsule dose would also increase the blood concentration of tacrolimus. The aim of our study was to confirm the effect of Wuzhi capsule dose on tacrolimus elimination in Chinese kidney transplant recipients. Herein, we showed that an adult patient with CYP3A5*3/*3 would require a daily tacrolimus dose of 5 mg without co-treatment with Wuzhi capsule with a median creatinine clearance rate of 45.5 mL·min−1 and hematocrit of 29%; the typical CL/F was estimated to be 14.4 L·h−1. Using our model, we identified creatinine clearance rate, hematocrit, Wuzhi capsule dosage, CYP3A5*3 gene polymorphism, and daily tacrolimus dose as significant covariates affecting tacrolimus CL/F in the first 3 months following renal transplantation (p < 0.001). As the Ka was fixed, we performed sensitivity analysis to assess the effect of these covariates on the CL/F and Vd/F of tacrolimus. As all sampling points were in the elimination stage, Ka did not affect CL/F and Vd/F (p > 0.05).
This study revealed that patients with a lower creatinine clearance rate had a higher CL/F of tacrolimus. However, tacrolimus is not excreted through the kidney, and the relationship between tacrolimus and kidney function remains controversial. Most studies32 on calcineurin inhibitor popPK in transplant recipients have not considered renal function as a predictor of dose requirement. However, some studies have reported a significant correlation between serum creatinine level and CL/F.33,34
Notably, tacrolimus disposition and renal function relationship may be confused by the intrinsic acute and chronic nephrotoxic effects and the reduced renal function can affect drug disposition,32 which requires an increase in therapeutic dose. Some studies have reported that if acute changes in renal function occurred, which can affect the absorption and clearance of tacrolimus, renal tubular cells may express the P-gp and CYP3A5 genes.35,36 Thus, tacrolimus renal metabolism could lead to potentially nephrotoxic tacrolimus metabolite accumulation, which may be influenced by genotypes of CYP3A5 and P-gp.
Haematocrit fraction generally decreases during early post-operative period, and then increases as the kidney functions recover.37 Tacrolimus binds to erythrocytes (approximately 95%) in a concentration-dependent manner.32 We observed a negative correlation between tacrolimus CL/F and hematocrit, as a continuous covariate, ie, a decrease in hematocrit resulted in an increased blood concentration of free tacrolimus. In the plasma, tacrolimus binds to proteins, approximately 99% albumin and alpha-1-acid glycoprotein, and is independent of concentration at a range of 5 to 50 ng·mL−1. Clinical studies have confirmed that higher tacrolimus doses are required as hematocrit decreases,38–42 which is consistent with our current findings.
The present study also confirmed that the CYP3A5*3 genotype affected tacrolimus CL/F, whereas ABCB1 genotypes did not. We showed that among kidney transplant patients, tacrolimus CL/F of CYP3A5*1 carriers was 1.29-fold higher than that in non-carriers (CYP3A5*3/*3). Enzymes of the CYP3A family metabolize tacrolimus,43 and CYP3A5 genetic variations constitute 40% to 50% of the variability in tacrolimus systemic clearance.44 Blood tacrolimus concentrations have been reported to be strongly affected by CYP3A5 genotypes, and tacrolimus CL/F of CYP3A5 (*1*1 and *1*3) expressers was higher (p < 0.001) than that of CYP3A5 (*3*3) non-expressers, with a tacrolimus CL/F change of 1.45 (range 1.15–2.5) in CYP3A5 expressers.45 Clinical Pharmacogenetics Implementation Consortium Guidelines and Second Consensus Report of tacrolimus suggest that a CYP3A5 expresser would require a higher starting dose than the recommended dose (ie, starting dose is increased by 1.5–2 times) and a CYP3A5 non-expresser would require the standard recommended starting dose. Our finding further confirmed these results concerning the importance of CYP3A5 genotypes in tacrolimus metabolism. Hence, we recommend individualizing the initial tacrolimus treatment according to the CYP3A5 genotype.
Except for the above mentioned factors, drug–drug interactions between tacrolimus and Wuzhi capsule have been widely investigated. Wuzhi capsule considerably increased the blood concentrations of tacrolimus in patients and rats, and the action mechanism has been studied in rats.46–49 Pharmacokinetic interactions between Wuzhi capsule and tacrolimus have also been studied in rats.50 Following the administration of Wuzhi capsule at doses of 0, 25, 100, 150, 450, 1000, or 1250 mg/kg in rats, as Wuzhi capsule dosage was increased at a range of 0–450 mg/kg, the mean plasma concentration of tacrolimus increased simultaneously, with the maximum concentration of tacrolimus at 450 mg/kg. When Wuzhi capsule was administered at doses above 450 mg/kg, the tacrolimus AUC0→t failed to further increase, whereas the highest Wuzhi dose (1250 mg/kg) did not correspond to the highest effect, which suggested that Wuzhi capsule has a biphasic effect in regulating the pharmacokinetic parameters of tacrolimus. In other words, Wuzhi capsule treatment at 450 mg/kg exerts a stronger inhibitory effect than inductive effect on tacrolimus disposition in rats.
Wuzhi capsule inhibited P-gp-mediated efflux and CYP3A-mediated metabolism of tacrolimus, and reduced intestinal first-pass metabolism of tacrolimus was the major cause of increased tacrolimus oral bioavailability by Wuzhi capsule.47 Long-term pre-treatment with Wuzhi capsule through activation of the orphan nuclear receptor pregnane X receptor induced both CYP3A and CYP2C expression, which consisted of short-term inhibition followed by long-term induction, on the regulation of CYP3A expression. This phenomenon was also discovered in St. John’s wort.48 In rat and human liver microsomes, Wuzhi capsule extract at 100 μM almost completely inhibited tacrolimus metabolism,48 further supporting that Wuzhi capsule extract potentially inhibited the CYP3A-mediated metabolism of tacrolimus. Consistent with previous study findings, the present study suggested that Wuzhi capsule extract exhibited a concentration- and time-dependent inhibitory effect on CYP3A.
In the present study, patients treated with Wuzhi capsule at an accumulated dose of below 45 mg had the lowest tacrolimus clearance rate with a CL/F value of 0.566 L·h−1, those treated at an accumulated dose of 45 mg had a CL/F value of 0.783 L·h−1, and those treated at an accumulated dose of greater than 45 mg had a CL/F value of 0.598 L·h−1. These findings are similar to those of the above studies, which indicated that Wuzhi capsules at lower doses showed greater effect on tacrolimus clearance.
After the inclusion of daily dose of tacrolimus, the effect on CL/F increased with a decrease in the OFV by −138.106 points, which supported the non-linearity of tacrolimus pharmacokinetics. The CL/F of tacrolimus increased non-linearly as the daily dose increased, which is consistent with previous findings in kidney and lung transplant recipients.8,51,52 This phenomenon can be explained by the poor water solubility of tacrolimus and its low transmembrane permeability in the intestine, which may result in its low and variable oral bioavailability and limited absorption rate in the gastrointestinal tract.2 The non-linear kinetics of tacrolimus warrant further investigation with a larger sample size.
The adjustment of tacrolimus dose in the co-treatment with Wuzhi capsule remains an unmet need. Model simulation is used to design different clinical scenarios to simulate the concentration. By analyzing different combinations of tacrolimus doses and treatment with or without Wuzhi capsule, we provided a tacrolimus dose recommendation for co-treatment with Wuzhi capsule. According to the Chinese Renal Transplant Recipients Association guidelines for immunosuppressive therapy, the reference value of target trough tacrolimus concentration within 1 month of operation is 10–15 ng·mL−1 in a triple therapy with tacrolimus + MPA drugs + hormones. Our simulated values will be compared with the reference values.
There were some limitations to this study. First, we were unable to elucidate the effect of Wuzhi capsule on the absorption and distribution of tacrolimus owing to the limited samples. To date, although pharmacodynamic and immune-related biomarkers have been recommended by the guidelines, these have not been included in routine monitoring. We will obtain this information to build other popPK models in the future.
Second, due to the small sample size, we could not combine different genotypes of CYP3A5 with different dose groups of Wuzhi capsule. We will expand the sample size in future studies. Furthermore, data from intravenous administration were not obtained in this study, even though absorption should be investigated along with distribution and elimination. Therefore, we only estimated CL/F and Vd/F. However, despite these limitations, the current study provides a fundamental theory for individualized tacrolimus treatment when combined with Wuzhi capsules and served as a valuable model for adult kidney transplant. Additional analyses are required to evaluate the potential effects of these covariates, especially Wuzhi capsules, in the clinical implementation of these models to guide tacrolimus dosing.
Conclusion
In summary, a popPK model was established to characterize the pharmacokinetics of tacrolimus in Chinese kidney transplant recipients. Significant covariates were identified in the final model, including creatinine clearance rate, haematocrit, dosage of Wuzhi capsule, and CYP3A5*3 gene polymorphisms. To the best of our knowledge, this is the first popPK study to reveal the dose-dependent interactions between Wuzhi capsules and tacrolimus pharmacokinetics. Our findings showed that low-dose Wuzhi capsule exerted the optimum effect on tacrolimus pharmacokinetics. However, to elucidate the specific mechanisms underlying this effect, further studies need to be conducted Our results revealed that in a combination treatment with tacrolimus and Wuzhi capsule, popPK modeling and TDM can be implemented to optimize the dosing regimen and maintain trough tacrolimus concentration, which could ensure the efficacy and safety of tacrolimus.
Data Sharing Statement
The raw data required to reproduce these findings cannot be shared at this time as the data also form part of an ongoing study.
Informed Consent
Written informed consents were obtained from all individual participants included in the study. The organ donors provided informed consent to donate their kidneys.
Acknowledgments
We would like to thank Editage for English language editing.
Funding
This work was supported by the Clinical Research Plan of SHDC (SHDC2020CR4072), the Shanghai “Rising Stars of Medical Talent” Youth Development Program (Shanghai Municipal Health Commission Planning Personnel matters [2019]72), Weak Discipline Construction Project (2016ZB0303-01) of Shanghai Municipal Commission of Health and Family Planning, Study on the dose effect relationship mechanism of Wuzhi capsule increasing tacrolimus concentration based on population pharmacokinetic model (2020QNB11) and The National Natural Science Foundation of China (82173900).
Disclosure
The authors report no conflicts of interest in this work.
References
1. Snowsill TM, Moore J, Mujica Mota RE, et al. Immunosuppressive agents in adult kidney transplantation in the National Health Service: a model-based economic evaluation. Nephrol Dial Transpl. 2017;32(7):1251–1259. doi:10.1093/ndt/gfx074
2. Cai XJ, Song HZ, Jiao Z, et al. Population pharmacokinetics and dosing regimen optimization of tacrolimus in Chinese lung transplant recipients. Eur J Pharm Sci. 2020;152:105448. doi:10.1016/j.ejps.2020.105448
3. Wallemacq P, Armstrong VW, Brunet M, et al. Opportunities to optimize tacrolimus therapy in solid organ transplantation: report of the European consensus conference. Ther Drug Monit. 2009;31:139–152. doi:10.1097/FTD.0b013e318198d092
4. Staatz CE, Tett SE. Maximum a posteriori Bayesian estimation of mycophenolic acid area under the concentration-time curve: is this clinically useful for dosage prediction yet? Clin Pharmacokinet. 2011;50:759–772. doi:10.2165/11596380-000000000-00000
5. Zhu W, Xue L, Peng HW, et al. Tacrolimus population pharmacokinetic models according to CYP3A5/CYP3A4/POR genotypes in Chinese Han renal transplant patients. Pharmacogenomics. 2018;19:1013–1025. doi:10.2217/pgs-2017-0139
6. Zuo XC, Ng CM, Barrett JS, et al. Effects of CYP3A4 and CYP3A5 polymorphisms on tacrolimus pharmacokinetics in Chinese adult renal transplant recipients: a population pharmacokinetic analysis. Pharmacogenet Genomics. 2013;23:251–261. doi:10.1097/FPC.0b013e32835fcbb6
7. Benkali K, Premaud A, Picard N, et al. Tacrolimus population pharmacokinetic–pharmacogenetic analysis and Bayesian estimation in renal transplant recipients. Clin Pharmacokinet. 2009;48:805–816. doi:10.2165/11318080-000000000-00000
8. Zhao CY, Jiao Z, Mao JJ, et al. External evaluation of published population pharmacokinetic models of tacrolimus in adult renal. Br J Clin Pharmacol. 2016;81:891–907. doi:10.1111/bcp.12830
9. Gelder TV. Drug interactions with tacrolimus. Drug Saf. 2002;25:707–712. doi:10.2165/00002018-200225100-00003
10. Tacrolimus-FDA prescribing information, side effects and uses. Available from: https://www.drugs.com/pro/tacrolimus.html.
11. Brunet M, Gelder T, Åsberg A, et al. Therapeutic drug monitoring of tacrolimus-personalized therapy: second consensus report. Ther Drug Monit. 2019;41:261–307.
12. Saitoh H, Saikachi Y, Kobayashi M, et al. Limited interaction between tacrolimus and P-glycoprotein in the rat small intestine. Eur J Pharm Sci. 2006;28:34–42.
13. Birdwell K, Decker B, Barbarino JM, et al. Clinical Pharmacogenetics Implementation Consortium (CPIC) guidelines for CYP3A5 genotype and tacrolimus dosing. Clin Pharmacol Ther. 2015;98:19–24. doi:10.1002/cpt.113
14. Almeida-Paulo GN, Dapia Garcia I, Lubomirov R, et al. Weight of ABCB1 and POR genes on oral tacrolimus exposure in CYP3A5 nonexpressor pediatric patients with stable kidney transplant. Pharmacogenomics J. 2017;18:180–186. doi:10.1038/tpj.2016.93
15. Zuo XC, Zhou YN, Zhang BK, et al. Effect of CYP3A5*3 polymorphism on pharmacokinetic drug interaction between tacrolimus and amlodipine. Drug Metab Pharmacokinet. 2013;28:398–405. doi:10.2133/dmpk.DMPK-12-RG-148
16. Antignac M, Barrou B, Farinotti R, Lechat P, Urien S. Population pharmacokinetics and bioavailability of tacrolimus in kidney transplant patients. Br J Clin Pharmacol. 2007;64:750–757.
17. Press RR, Ploeger BA, Hartigh JD, et al. Explaining variability in tacrolimus pharmacokinetics to optimize early exposure in adult kidney transplant recipients. Ther Drug Monit. 2009;31:187–197. doi:10.1097/FTD.0b013e31819c3d6d
18. Zhang JJ, Liu SB, Xue L. The genetic polymorphisms of POR*28 and CYP3A5*3 significantly influence the pharmacokinetics of tacrolimus in Chinese renal transplant recipients. Int J Clin Pharmacol Ther. 2015;53:728–736. doi:10.5414/CP202152
19. Ko MS, Choi YH, Jung SH, et al. Tacrolimus therapy causes hepatotoxicity in patients with a history of liver disease. Int J Clin Pharmacol Ther. 2015;53:363–371. doi:10.5414/CP202226
20. Sun Z, Ren M, Wu Q, Du X. Co-administration of Wuzhi capsules and tacrolimus in patients with idiopathic membranous nephropathy: clinical efficacy and pharmacoeconomics. Int Urol Nephrol. 2014;46:1977–1982. doi:10.1007/s11255-014-0801-3
21. Huyke C, Engel K, Simon-Haarhaus B, Quirin KW, Schempp CM. Composition and biological activity of different extracts from Schisandra sphenanthera and Schisandra chinensis. Planta Med. 2007;3:1116–1126. doi:10.1055/s-2007-981559
22. Jiang JF, Wei SD, Chen GY. Influence of deoxyschizandrin at the blood concentration of tacrolimus in recipient of liver transplantation. Chine J Clin Pharmacol. 2012;28:411–413.
23. Xin HW, Li Q, Wu XW, et al. Effects of Schisandra sphenanthera extract on the blood concentration of tacrolimus in renal transplant recipients. Eur J Clin Pharmacol. 2011;67:1309–1311. doi:10.1007/s00228-011-1075-7
24. Xin HW, Wu XC, Li Q, et al. Effects of Schisandera sphenanthera extract on the pharmacokinetics of tacrolimus in healthy volunteers. Br J Clin Pharmacol. 2007;64:469–475. doi:10.1111/j.1365-2125.2007.02922.x
25. Wang DD, Chen X, Li ZP. Wuzhi capsule and haemoglobin influence tacrolimus elimination in paediatric kidney transplantation patients in a population pharmacokinetics analysis: a retrospective study. J Clin Pharm Ther. 2019;44:611–617. doi:10.1111/jcpt.12828
26. Mu Y, Zhang JN, Zhang SM, Zhou HH, Toma D, Ren SR. Traditional Chinese medicines Wu Wei Zi (Schisandra chinensis Baill) and Gan Cao (Glycyrrhiza uralensis Fisch) activate pregnane X receptor and increase warfarin clearance in rats. J Pharmacol Exp Ther. 2006;316:1369–1377. doi:10.1124/jpet.105.094342
27. Lai L, Hao HP, Wang Q, et al. Effects of short-term and long-term pretreatment of schisandra lignans on regulating hepatic and intestinal CYP3A in rats. Drug Metab Dispos. 2009;37(12):2399–2407. doi:10.1124/dmd.109.027433
28. Bazin C, Guinedor A, Barau C, et al. of the Architect tacrolimus assay in kidney, liver, and heart transplant recipients. J Pharm Biomed Anal. 2010;53:997–1002. doi:10.1016/j.jpba.2010.06.022
29. Viva-E System Gold-standard drug-testing performance with EMIT technology Siemens Global Website. Available from: http://www.healthcare.siemens.com/drugtesting-diagnostics/viva-drug-testing/viva-e-drug-testingsystem.
30. Comets E, Brendel K, Mentré F. Computing normalised prediction distribution errors to evaluate nonlinear mixed-effect models: the npde add-on package for R. Comput Meth Prog Biomed. 2008;90:154–166. doi:10.1016/j.cmpb.2007.12.002
31. Jing Y, Kong Y, Hou X, et al. Population pharmacokinetic analysis and dosing guidelines for tacrolimus co-administration with Wuzhi capsule in Chinese renal transplant recipients. J Clin Pharm Ther. 2021;46:1117–1128. doi:10.1111/jcpt.13407
32. Vanhove T, Annaert P, Kuypers DRJ. Clinical determinants of calcineurin inhibitor disposition: a mechanistic review. Drug Metab Rev. 2016;48:88–112. doi:10.3109/03602532.2016.1151037
33. Fukatsu S, Yano I, Igarashi T, et al. Population pharmacokinetics of tacrolimus in adult recipients receiving living-donor liver transplantation. Eur J Clin Pharmacol. 2001;57:479–484. doi:10.1007/s002280100331
34. Jacobson P, Ng J, Ratanatharathorn V, et al. Factors affecting the pharmacokinetics of tacrolimus (FK506) in hematopoietic cell transplant (HCT) patients. Bone Marrow Transplant. 2001;28:753–758. doi:10.1038/sj.bmt.1703224
35. Koch I, Weil R, Wolbold R, et al. Interindividual variability and tissue-specificity in the expression of cytochrome P450 3A mRNA. Drug Metab Dispos. 2002;30:1108–1114. doi:10.1124/dmd.30.10.1108
36. Krogstad V, Vethe NT, Robertsen I, et al. Determination of tacrolimus concentration and protein expression of P-glycoprotein in single human renal core biopsies. Ther Drug Monit. 2018;40:292–300. doi:10.1097/FTD.0000000000000510
37. Han NY, Yun HY, Hong JY, et al. Prediction of the tacrolimus population pharmacokinetic parameters according to CYP3A5 genotype and clinical factors using NONMEM in adult kidney transplant recipients. Eur J Clin Pharmacol. 2013;69:53–63. doi:10.1007/s00228-012-1296-4
38. Asberg A, Midtvedt K, van Guilder M, et al. Inclusion of CYP3A5 genotyping in a nonparametric population model improves dosing of tacrolimus early after transplantation. Transpl Int. 2013;26:1198–1207. doi:10.1111/tri.12194
39. de Jonge H, de Loor H, Verbeke K, et al. In vivo CYP3A4 activity, CYP3A5 genotype, and hematocrit predict tacrolimus dose requirements and clearance in renal transplant patients. Clin Pharmacol Ther. 2012;92:366–375. doi:10.1038/clpt.2012.109
40. Kim I-W, Moon YJ, Ji E, et al. Clinical and genetic factors affecting tacrolimus trough levels and drug-related outcomes in Korean kidney transplant recipients. Eur J Clin Pharmacol. 2012;68:657–669. doi:10.1007/s00228-011-1182-5
41. Staatz CE, Willis C, Taylor PJ, Tett SE. Population pharmacokinetics of tacrolimus in adult kidney transplant recipients. Clin Pharmacol Ther. 2002;72:660–669. doi:10.1067/mcp.2002.129304
42. Storset E, Holford N, Hennig S, et al. Improved prediction of tacrolimus concentrations early after kidney transplantation using theory-based pharmacokinetic modelling. Br J Clin Pharmacol. 2014;78:509–523. doi:10.1111/bcp.12361
43. Iwasaki K. Metabolism of tacrolimus (FK506) and recent topics in clinical pharmacokinetics. Drug Metab Pharmacokinet. 2007;22:328–335. doi:10.2133/dmpk.22.328
44. Tang JT, Andrews LM, Van gelder T, et al. Pharmacogenetic aspects of the use of tacrolimus in renal transplantation: recent developments and ethnic considerations. Expert Opin Drug Metab Toxicol. 2016;12:555–565. doi:10.1517/17425255.2016.1170808
45. Campagne O, Mager DE, Tornatore KM. Population pharmacokinetics of tacrolimus in transplant recipients: what did we learn about sources of interindividual variabilities? J Clin Pharmacol. 2019;59:309–325. doi:10.1002/jcph.1325
46. Qin XL, Chen X, Zhong GP, et al. Effect of tacrolimus on the pharmacokinetics of bioactive lignans of Wuzhi tablet (Schisandra sphenanthera extract) and the potential roles of CYP3A and P-gp. Phytomedicine. 2014;21:766–772. doi:10.1016/j.phymed.2013.12.006
47. Xie HG, Kim RB. St John’s wort-associated drug interactions: short-term inhibition and long-term induction? Clin Pharmacol Ther. 2005;78:19–24. doi:10.1016/j.clpt.2005.04.002
48. Rengelshausen J, Banfield M, Riedel KD, et al. Opposite effects of short-term And long-term St John’s wort intake on voriconazole pharmacokinetics. Clin Pharmacol Ther. 2005;78:25–33. doi:10.1016/j.clpt.2005.01.024
49. Lai L, Hao HP, Wang Q, et al. Effects of short-term and long-term pretreatment of Schisandra lignans on regulating hepatic and intestinal CYP3A in rats. Drug Metab Dispos. 2009;37:2399–2407.
50. Wei H, Tao X, Di P, et al. Effects of traditional Chinese medicine Wuzhi capsule on pharmacokinetics of tacrolimus in rats. Drug Metab Dispos. 2013;41:1398–1403. doi:10.1124/dmd.112.050302
51. Grover A, Frassetto LA, Benet LZ, Chakkera HA. Pharmacokinetic differences corroborate observed low tacrolimus dosage in native American renal transplant patients. Drug Metab Dispos. 2011;39:2017–2019. doi:10.1124/dmd.111.041350
52. Lee DR, Ho MJ, Jung HJ, et al. Enhanced dissolution and oral absorption of tacrolimus by supersaturable self-emulsifying drug delivery system. Int J Nanomedicine. 2016;11:1109–1117.
 © 2021 The Author(s). This work is published and licensed by Dove Medical Press Limited. The full terms of this license are available at https://www.dovepress.com/terms.php and incorporate the Creative Commons Attribution - Non Commercial (unported, v3.0) License.
By accessing the work you hereby accept the Terms. Non-commercial uses of the work are permitted without any further permission from Dove Medical Press Limited, provided the work is properly attributed. For permission for commercial use of this work, please see paragraphs 4.2 and 5 of our Terms.
© 2021 The Author(s). This work is published and licensed by Dove Medical Press Limited. The full terms of this license are available at https://www.dovepress.com/terms.php and incorporate the Creative Commons Attribution - Non Commercial (unported, v3.0) License.
By accessing the work you hereby accept the Terms. Non-commercial uses of the work are permitted without any further permission from Dove Medical Press Limited, provided the work is properly attributed. For permission for commercial use of this work, please see paragraphs 4.2 and 5 of our Terms.