Back to Journals » Clinical Epidemiology » Volume 10
Why was this transfusion given? Identifying clinical indications for blood transfusion in health care data
Authors van Hoeven LR, Kreuger AL, Roes KCB, Kemper PF, Koffijberg H, Kranenburg FJ, Rondeel JM, Janssen MP
Received 24 July 2017
Accepted for publication 21 November 2017
Published 29 March 2018 Volume 2018:10 Pages 353—362
DOI https://doi.org/10.2147/CLEP.S147142
Checked for plagiarism Yes
Review by Single anonymous peer review
Peer reviewer comments 2
Editor who approved publication: Professor Henrik Toft Sørensen
Loan R van Hoeven,1,2 Aukje L Kreuger,3,4 Kit CB Roes,1 Peter F Kemper,2,4 Hendrik Koffijberg,5 Floris J Kranenburg,3,4,6 Jan MM Rondeel,7 Mart P Janssen1,2
1Julius Center for Health Sciences and Primary Care, University Medical Center Utrecht, Utrecht, the Netherlands; 2Transfusion Technology Assessment Department, Sanquin Research, Amsterdam, the Netherlands; 3Department of Clinical Epidemiology, Leiden University Medical Center, Leiden, the Netherlands; 4Center for Clinical Transfusion Research, Sanquin Research, Leiden, the Netherlands; 5Department of Health Technology & Services Research, MIRA Institute for Biomedical Technology and Technical Medicine, University of Twente, Enschede, the Netherlands; 6Department of Intensive Care, Leiden University Medical Center, Leiden, the Netherlands; 7Department of Clinical Chemistry, Isala, Zwolle, the Netherlands
Background: To enhance the utility of transfusion data for research, ideally every transfusion should be linked to a primary clinical indication. In electronic patient records, many diagnostic and procedural codes are registered, but unfortunately, it is usually not specified which one is the reason for transfusion. Therefore, a method is needed to determine the most likely indication for transfusion in an automated way.
Study design and methods: An algorithm to identify the most likely transfusion indication was developed and evaluated against a gold standard based on the review of medical records for 234 cases by 2 experts. In a second step, information on misclassification was used to fine-tune the initial algorithm. The adapted algorithm predicts, out of all data available, the most likely indication for transfusion using information on medical specialism, surgical procedures, and diagnosis and procedure dates relative to the transfusion date.
Results: The adapted algorithm was able to predict 74.4% of indications in the sample correctly (extrapolated to the full data set 75.5%). A kappa score, which corrects for the number of options to choose from, was found of 0.63. This indicates that the algorithm performs substantially better than chance level.
Conclusion: It is possible to use an automated algorithm to predict the indication for transfusion in terms of procedures and/or diagnoses. Before implementation of the algorithm in other data sets, the obtained results should be externally validated in an independent hospital data set.
Keywords: indication for transfusion, selection algorithm, electronic health record data
Background
In blood transfusion research, it is important to know the clinical condition of the patient which motivated the physician to give the transfusion. By this, the underlying disease or treatment is meant, not the immediate reason for transfusion such as low blood values. Knowing the underlying cause of transfusion is valuable for monitoring trends and predicting future blood use in different patient groups. Typically, the reason for transfusion or transfusion indication is not routinely registered with the request for blood1 or only temporarily in the context of the study.2,3 Alternatively, routinely registered diagnostic and procedural codes can be used to determine the transfusion indication retrospectively. Potentially the primary diagnosis code can be used, but this code is not always available, and it has been shown that the primary diagnosis in many cases is not the indication for transfusion. For example, in the EASTR study,4 transfused patients were assigned to indication groups based on the surgical procedure (43% of all patients), International Classification of Diseases, Tenth Edition (ICD-10) primary diagnosis (36%), and ICD-10 secondary diagnosis (12%), with 9% of patients remaining unclassified. As each electronic patient record was reviewed by research nurses, this is a highly labor-intensive method for determining the transfusion indication.
The amount of data in transfusion research databases is generally very high, including many patient records as well as many diagnoses and procedures per record. Many patients have two or more diagnoses at the time of transfusion. As manual review is too time consuming, an algorithm is needed that predicts, out of all diagnoses and procedures registered, the most likely indication for transfusion. Currently, no method exists for determining the main indication for transfusion in an automated way. Reported strategies for attributing transfusion events to patients’ clinical information are as follows: to classify a transfusion as medical, surgical, or obstetric and gynecological or to attribute a transfusion to the requesting hospital department, specialism, or admitting service.1,2,5,6 Although these broad classifications provide information on the global indication, they do not identify an indication as specific as a diagnosis or procedure. In addition, this information is not always reliable because patients may be transferred to other specialisms during hospitalization. Also, the accuracy of the used coding system has to be validated, as reportedly patients with a diagnosis code do not always have the condition it represents.7 Therefore, indications for transfusion should be validated, but in practice, they are often not validated.8
The aim of this study is to establish an algorithm for the automated identification of transfusion indications and to evaluate the performance of this algorithm using expert evaluations. In addition, in order to validate the diagnostic and procedural codes, we checked transfusions with a single diagnosis as well as transfusions without any diagnostic information registered, to investigate whether the diagnosis was the most likely indication and whether information was missing, in a systematic way.
Study design and methods
In order to develop the initial version of the algorithm, expert opinions were asked and used to establish the rules of the algorithm. Subsequently, the algorithm was applied to hospital data, with the result that each transfusion was linked to its predicted most likely indication for transfusion. To evaluate the performance of the algorithm, the predicted indications were compared with the gold standard, which is the most likely indication for transfusion as determined independently by two clinical experts based on the medical record.
Data
We used data on all transfusions in a teaching hospital in the Netherlands over a 5-year period (Isala Hospital; 2010–2014; n = 86,043). In the Netherlands, diagnoses and procedures are currently coded using a national system adopted by all hospitals and are primarily for financial reimbursement (DBCO/NZa).9 Each diagnosis code consists of a specialism code and a more specific diagnosis code. For the current study, all diagnoses of a patient, which were pending at the time of transfusion, were selected as potential transfusion indications. Similarly, all surgical procedures falling within the hospitalization in which the transfusion was administered were selected, with an extra filter to include only procedures within a time interval of -7 and +1 days around the transfusion date. Procedures were linked to a specialism using the admitting specialism. Diagnoses that were registered on the same day under the same specialism, as well as surgeries that were performed on the same day under the same specialism were regarded as related and are clustered together into “diagnosis clusters” and “procedure clusters”.
Determination of the gold standard by reviewers
A sample of transfusion cases was manually reviewed by two reviewers (both medical doctors) to determine the true indication for transfusion, ie, the gold standard. The indication always consists of a diagnosis, optionally complemented by a procedure. This was decided firstly because it reflects the way that this type of information is registered, and secondly, because it makes sense that some transfusions are necessitated by a disease (ie, diagnosis) and other transfusions are necessitated by a treatment (ie, procedure) in the follow-up of a disease (ie, diagnosis).
The reviewers were given a list of patient identification numbers and transfusion events (ie, a transfusion date and the type and amount of products transfused). They were instructed to first look into the hospital electronic patient documentation (including electronic health records, correspondence, and clinical outcomes) and to determine the most likely indication for transfusion. After they had determined the indication, they looked at the answer categories provided (ie, diagnoses and procedures), selected the correct indication if available, and otherwise selected the option “none of these”. A free text field was provided to fill in the correct indication. In order to enhance the reliability of the gold standard, the two reviewers reviewed all cases independently of each other and afterward discussed the cases on which they disagreed until consensus was reached on the correct indication.
Sample selection
The sample of transfusion cases to be presented to the reviewers was selected using a stratified random approach. The sample was stratified by the six most important specialisms in terms of high blood use: cardiopulmonary surgery, gynecology, gastroenterology, internal medicine, surgery, and orthopedics. All remaining specialisms fell into the seventh category “Other”. The reason for stratifying by specialism was that this ensures a sufficient number of observations per specialism and will provide information as to whether the algorithm works for the most prevalent indications. As we did not yet know which of the specialisms associated with a transfusion was the actual transfusion indication, we stratified by specialism as predicted by the initial version of the algorithm.
The sample size was based on the expected performance of the algorithm and the predefined, acceptable margin of error. For instance, when the algorithm is expected to correctly identify the transfusion indication in 90% of cases, a sample size of n = 138 would be required (assuming power of 0.9 and α of 0.05); for an expected proportion of 80%, n = 246. We chose a sample size of 234 cases, resulting in a margin of error of 3.8% for an expected proportion of 90% and a margin of error of 5.1% for 80%. The sample was divided over nine strata: the seven specialism strata, a “data quality check” stratum of cases with only one diagnosis, and a stratum of transfusions that are not linked to any diagnosis or procedure at all (which is 3.1% of transfusions in the data set). These last two strata were also used to validate the data: 1) to check whether the single diagnosis was the correct indication, and 2) why diagnoses were missing and whether there was a pattern (for example, the absence of a diagnosis might be specific for certain specialisms).
Development of the algorithm
The core of the algorithm is a set of decision rules. Using these rules, the algorithm selects a diagnosis, and if available, a procedure as the most likely transfusion indication. These rules are based on the recommendations of transfusion experts (two medical doctors and a doctor working in transfusion medicine). The experts were asked to make a list of the most likely specialisms to be responsible for transfusion. Similarly, experts were asked to make a prioritization based on the time between the diagnosis and the procedure dates relative to the transfusion date. Based on these prioritizations, a decision tree algorithm was made and applied to the data. In a second step, the algorithm was adapted based on the performance of the initial algorithm.
Statistical analysis
The performance of the algorithm was evaluated by computing the percentage agreement between the algorithm and the gold standard. This was computed for the sample and also extrapolated to the full data set based on the sampling fraction per stratum (for the final algorithm). A secondary outcome was a quantification of the agreement corrected for agreement by chance. This score indicates whether and how much the algorithm performs better than random chance. The algorithm chooses between several diagnosis clusters, but, due to the nature of the data, the number of diagnosis clusters varies per case. The distribution of the number of diagnoses per patient is shown in Table 1, illustrating how many options the algorithm has to choose from. For example, when the choice is between two diagnosis options, the chance agreement is 50%, whereas a case with six diagnosis options has only a 16.7% chance agreement. Likewise, a guessing probability equal to 1 divided by the number of outcome categories was assigned to each case. The underlying assumption was that a priori all outcome categories are equally likely. With this information, the total expected chance level agreement can be calculated and compared with the observed proportion agreement. These two measures are used to calculate kappa (k), an agreement statistic similar to Cohen’s kappa.10 The formula for k is as follows:
 | Table 1 Number of diagnosis codes per patient from which the algorithm had to choose the one most likely to be the transfusion indication |
|
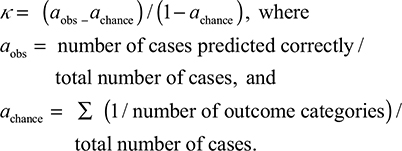
The interpretation of k is as follows: k = 0 indicates chance agreement, k = 1 indicates perfect agreement, k < 0 indicates lower than chance agreement, and k > 0 indicates agreement better than random chance. The advantage is that k corrects for the level of difficulty of each case, by taking into account the number of outcome categories.
As a sensitivity analysis, the data were analyzed both including and excluding cases lacking a gold standard. Evaluating only those cases for which a gold standard could be found in the data registered might be fairest because the algorithm, which always selects one indication, can never match with a missing gold standard. Conversely, an analysis that includes all cases better demonstrates the usefulness of the algorithm for the complete data set.
Ethics statement
This study falls under the Dutch Transfusion Data warehouse (DTD) project11 and can be seen as validation of the data collected. This project has been approved by the institutional review board of the Vrije Universiteit Medical Center (VUMC), which reviewed the study and concluded that informed consent by patients was not necessary because the data were transferred and stored in a deidentified format, excluding privacy sensitive information such as name and postal code.
Results
Gold standard: interrater consistency
The two reviewers initially agreed on 223 of 234 cases (95%). After discussion of the cases not agreed upon, consensus was reached for all cases. For diagnoses, the gold standard was “none of these” for n = 15 cases, meaning that none of the diagnoses provided was found likely to be the indication for the transfusion. Reasons that the indication could not be found in the available diagnoses varied: anemia of unknown cause (n = 6), registration lacking (n = 6), anemia of critical illness (n = 2), or no indication for transfusion according to the reviewers (n = 1). For procedures, the gold standard was “none of these” for n = 14 cases. Reasons that no procedure was selected were as follows: supposedly incorrect procedure dates (n = 6, these seemed to be mainly nonelective surgeries), the correct procedure fell outside the selected time period of -7 and +1 days around the date of transfusion (n = 4), missing registration of the correct procedure (n = 3), and it was not possible to select one procedure (n = 1) based on medical chart review.
As the predicted specialism strata were not always the true strata according to the gold standard, the number of observations in each specialism stratum changed somewhat. Also, during the determination of the true indication, the reviewers discovered that some of the diagnoses from which the algorithm had to choose were overlapping or the same (n = 24). This probably occurred because the same diagnoses were registered by different specialisms, resulting in different codes for the same diagnosis (of these cases, n = 16 had one duplicated diagnosis, n = 7 had two duplications, and n = 1 had three duplications). These duplicated diagnoses were recoded post hoc to make sure that equal alternatives would also be evaluated as such. This slightly changed the number of observations in each stratum, as n = 13 clusters went from multiple to only one diagnosis cluster and therefore moved to the “data quality check” cluster. For procedures, transfusion clusters with only one procedure cluster were combined into a “data quality check” stratum (n = 47). The remaining cases (n = 21) with multiple procedure clusters were grouped together, as a breakdown by specialisms would result in very low sample sizes per stratum.
Initial algorithm
Rules of the initial algorithm
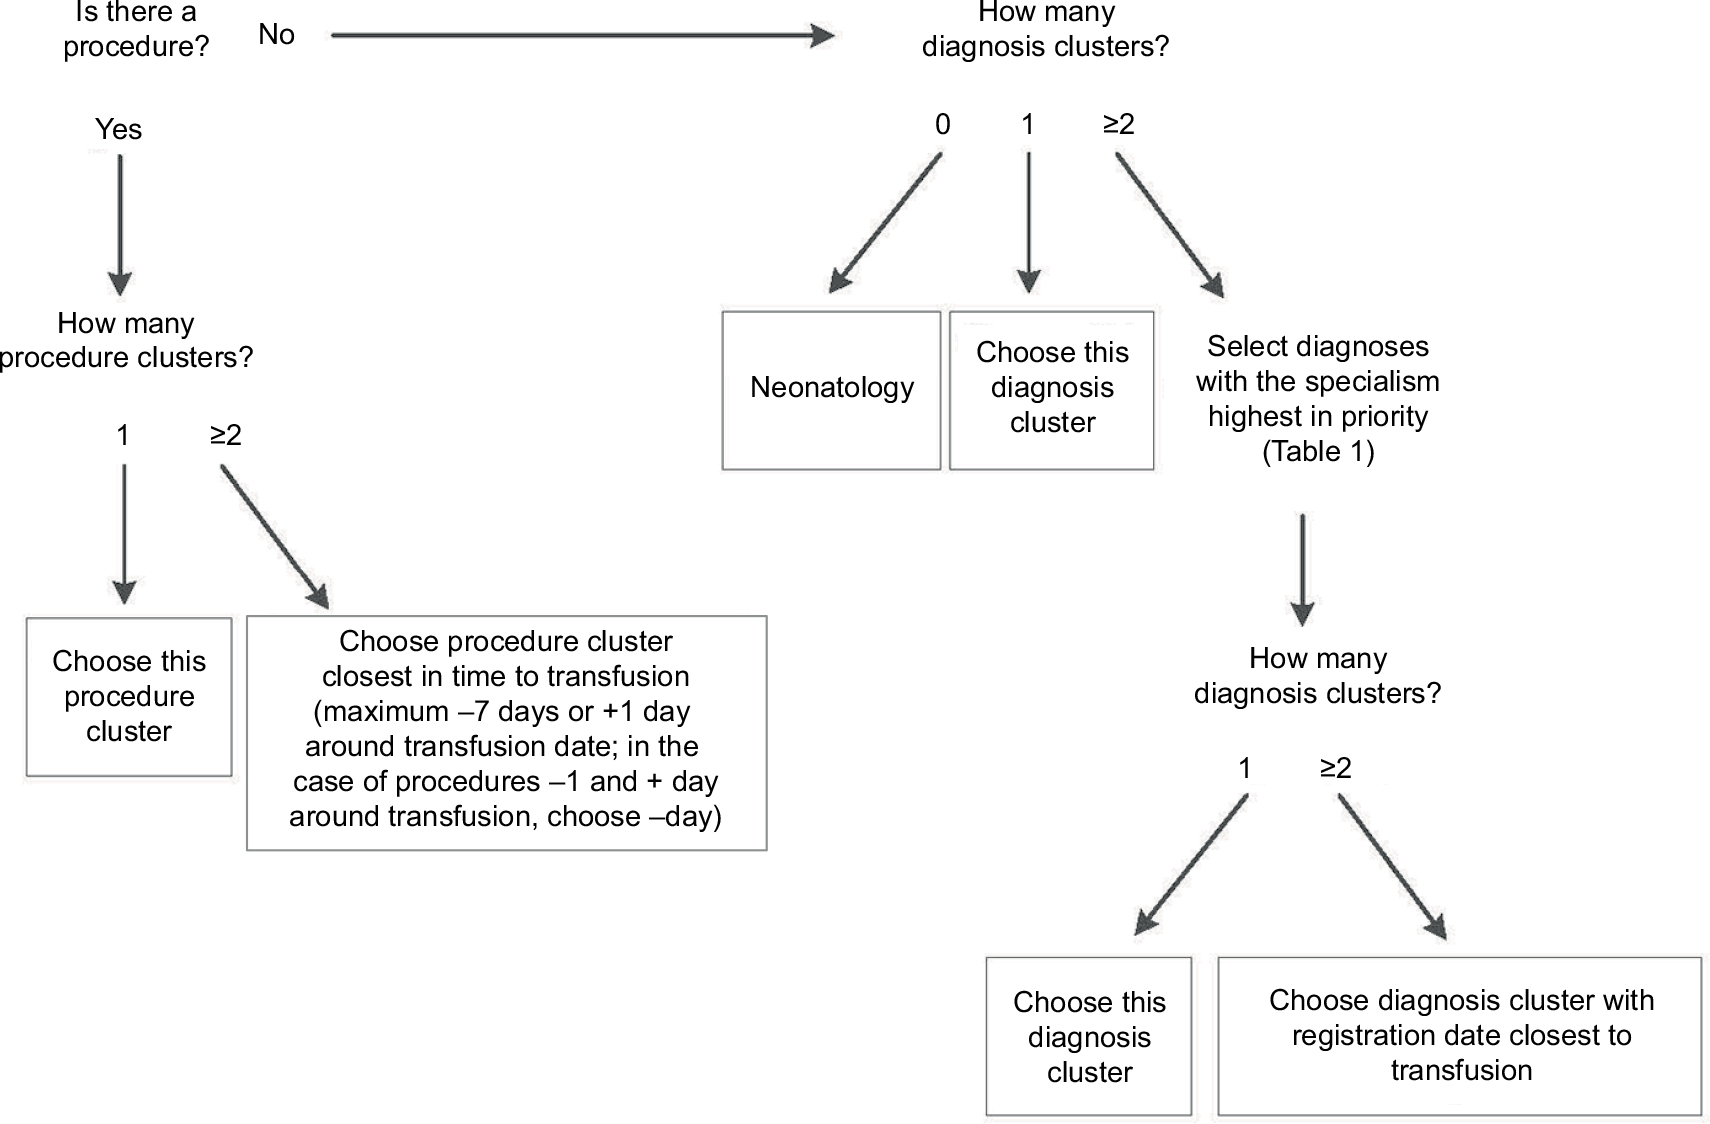
The algorithm works like a decision tree (Figure 1A and B). First, it selects diagnoses based on the prioritization of the specialisms of the available diagnoses (Table 2). If the patient underwent a procedure, the diagnosis matching the admission specialism (of the department the patient is hospitalized) highest in priority (according to “Order procedures” in Table 2) will be selected. If no procedure was registered for this patient, the diagnosis with the specialism highest in priority (according to “Order diagnoses” in Table 2) will be selected. Second, if after this first selection there is still more than one diagnosis option available, the algorithm selects the diagnosis that is closest in time to the transfusion (using the start date of the diagnosis). For procedures, the algorithm selects the procedure closest in time to the transfusion (prioritizing procedures 1 day before transfusion over 1 day after transfusion). The R code of the algorithm and a simulated test data set are provided in the Supplementary materials.
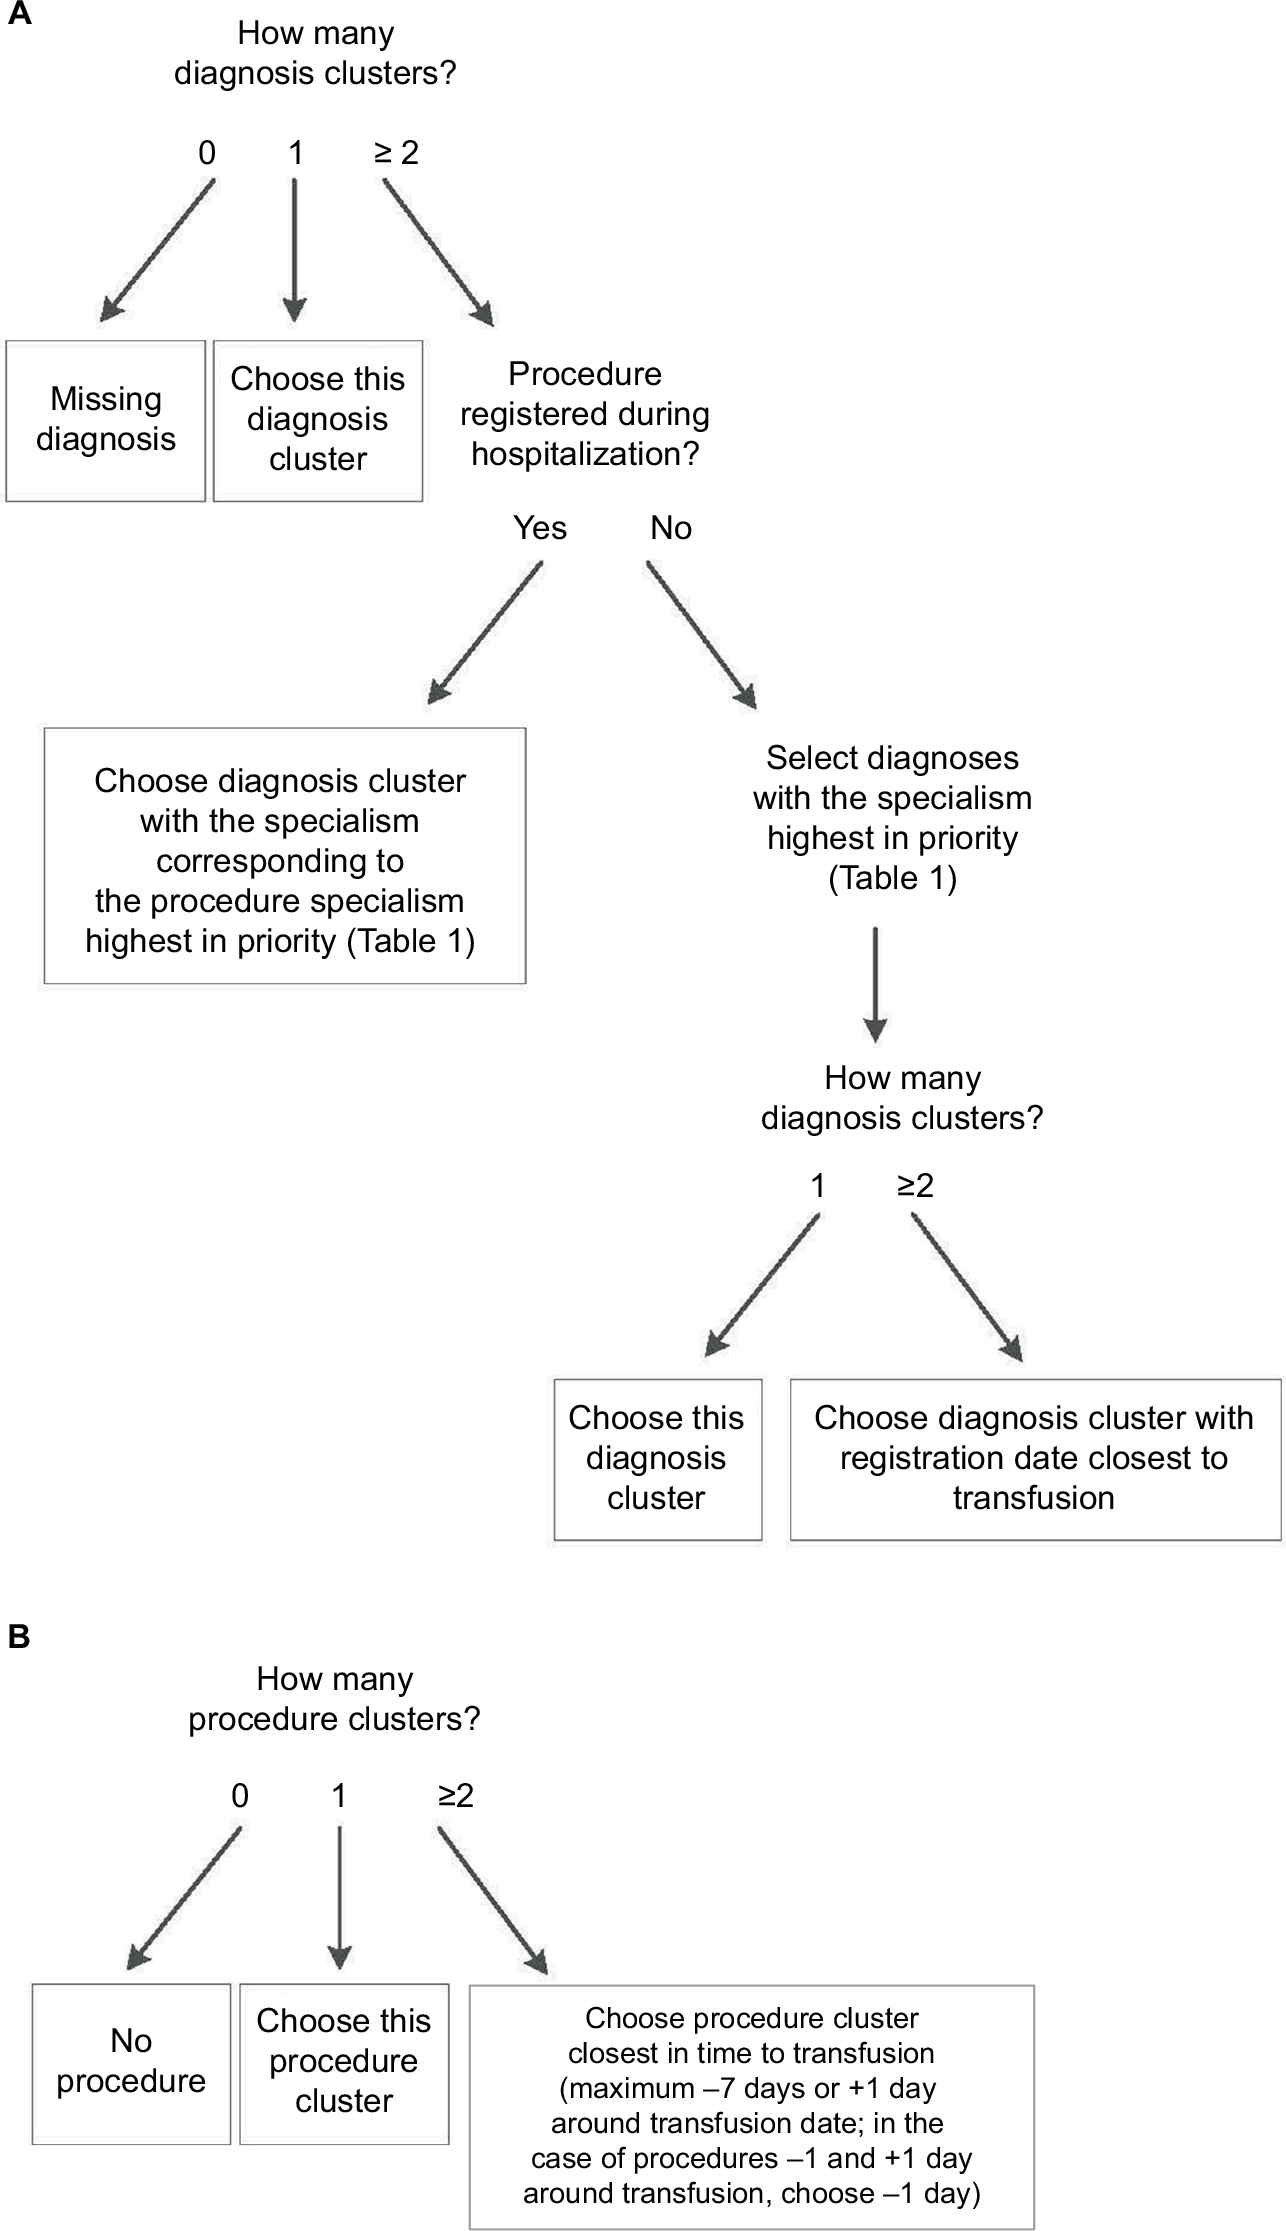 | Figure 1 Initial algorithm rules. Notes: (A) Diagnosis selection. (B) Procedure selection. |
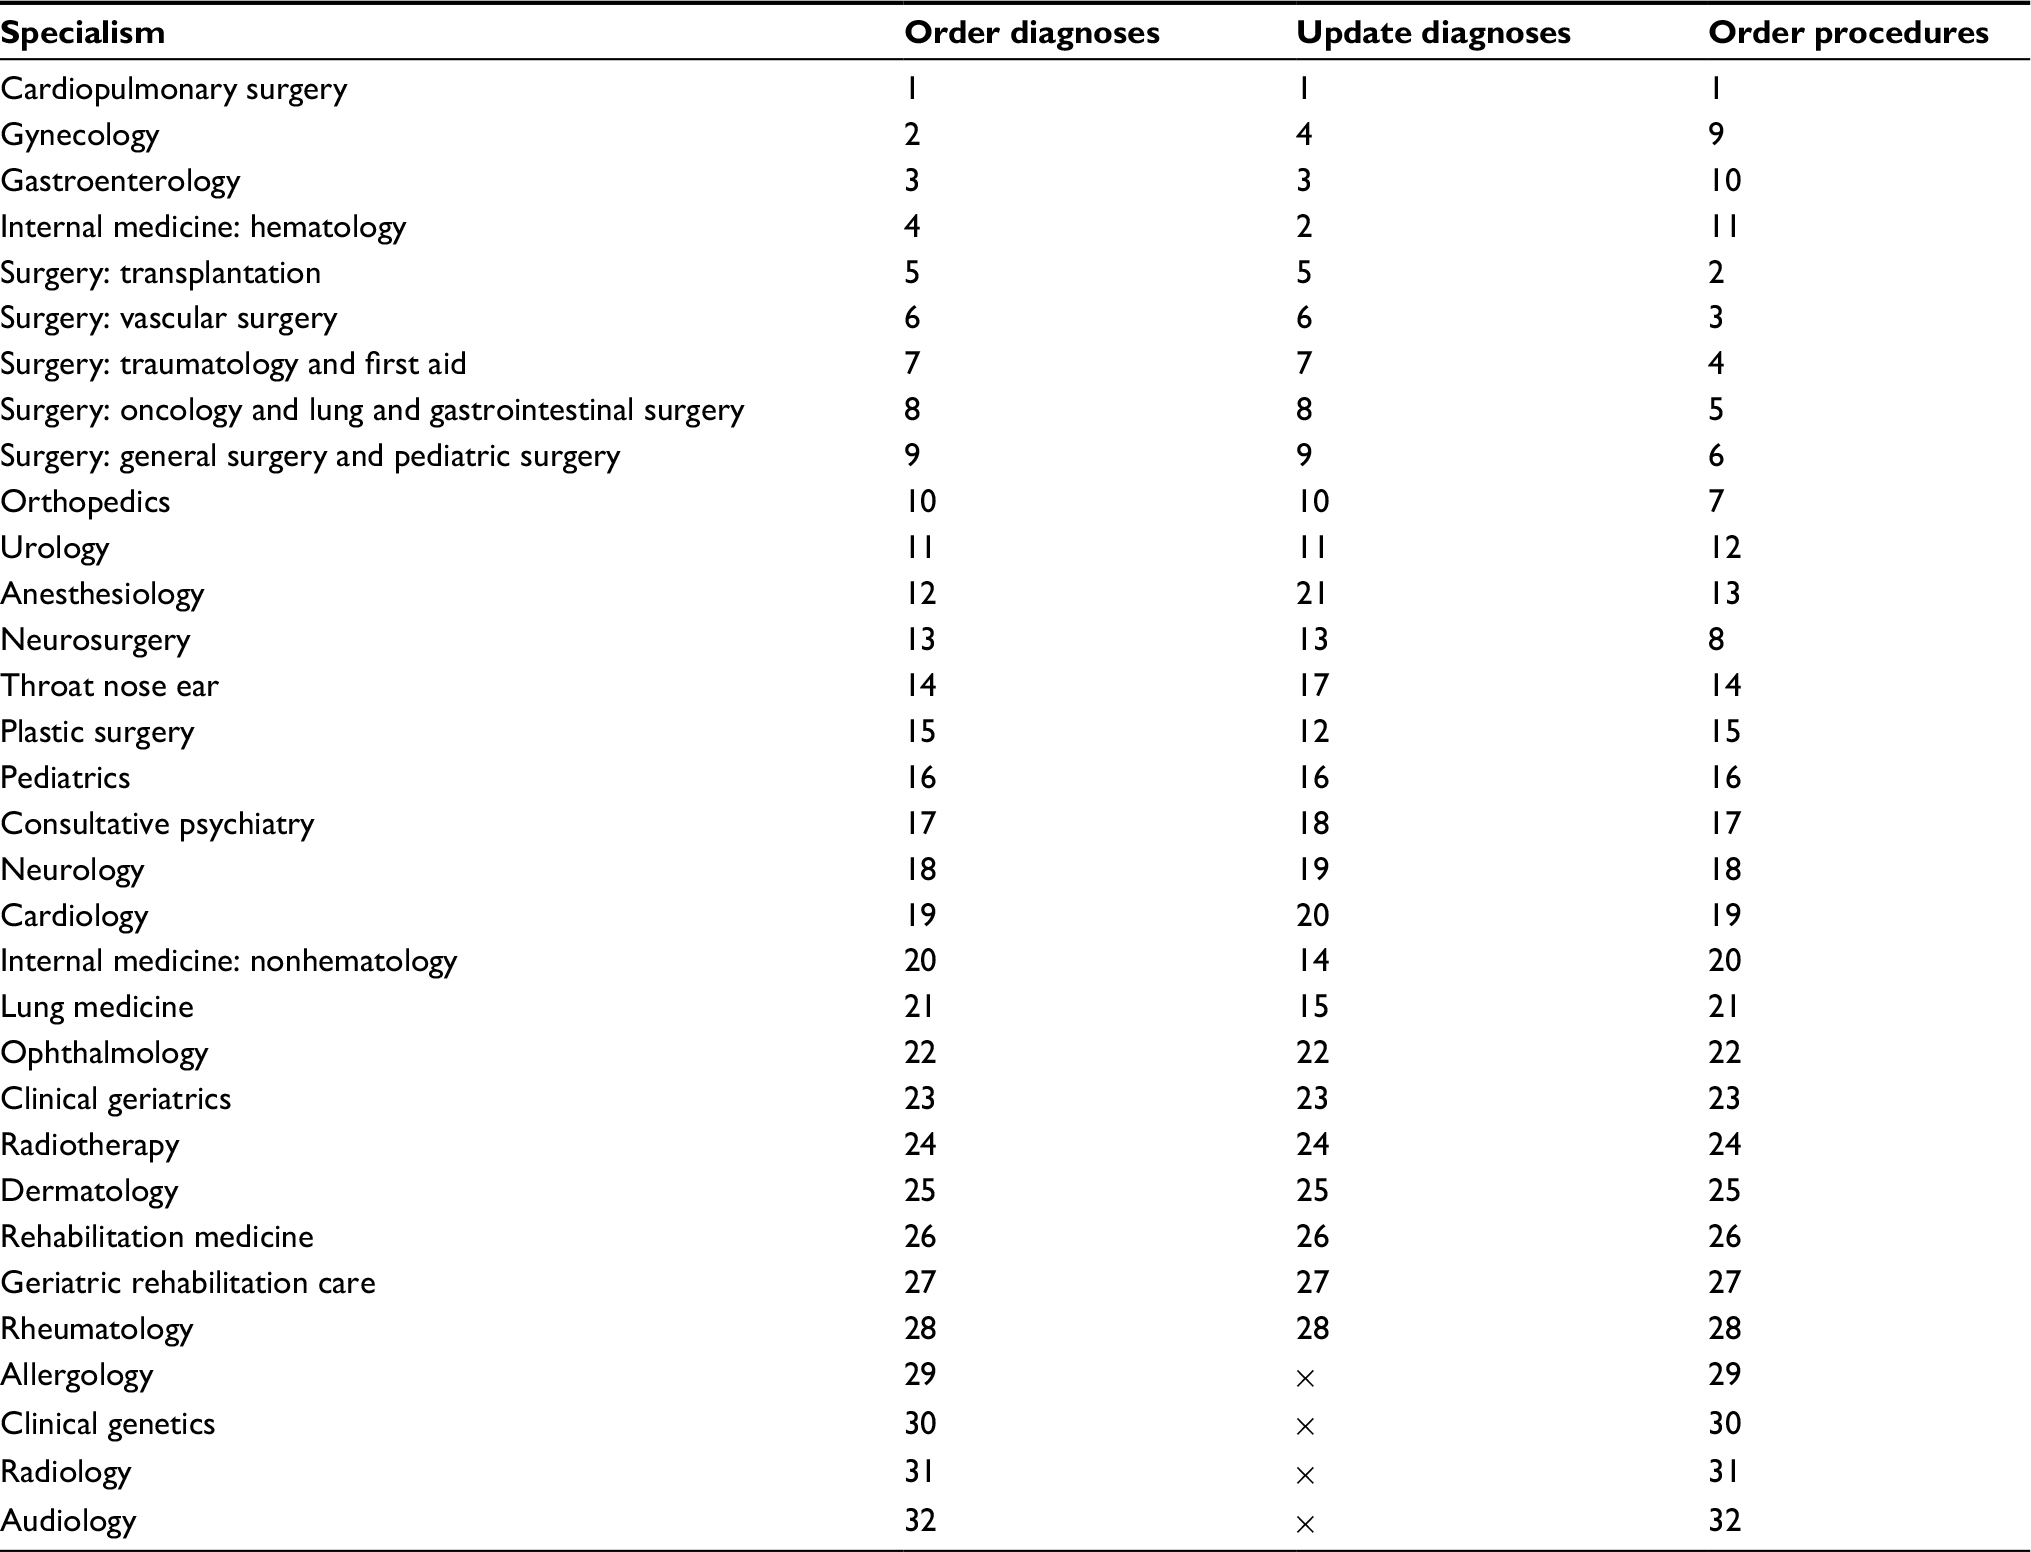 | Table 2 Order of diagnosis and procedure specialisms used for attributing indication to transfusion in the initial algorithm and after adjustment in the adapted algorithm, from high to low priority Note: The × symbols indicate not applicable. |
Performance of the initial algorithm
Diagnoses
For 208 of the 234 cases, one or more diagnoses were registered. The overall percentage raw agreement of the algorithm diagnoses with the gold standard was 56.0%. Excluding cases without a gold standard and those without diagnoses registered resulted in a higher agreement rate of 67.9%. Agreement varied per specialism from 20.0% (for “Other”) to 94.7% (for “Cardiopulmonary surgery”; Table 3).
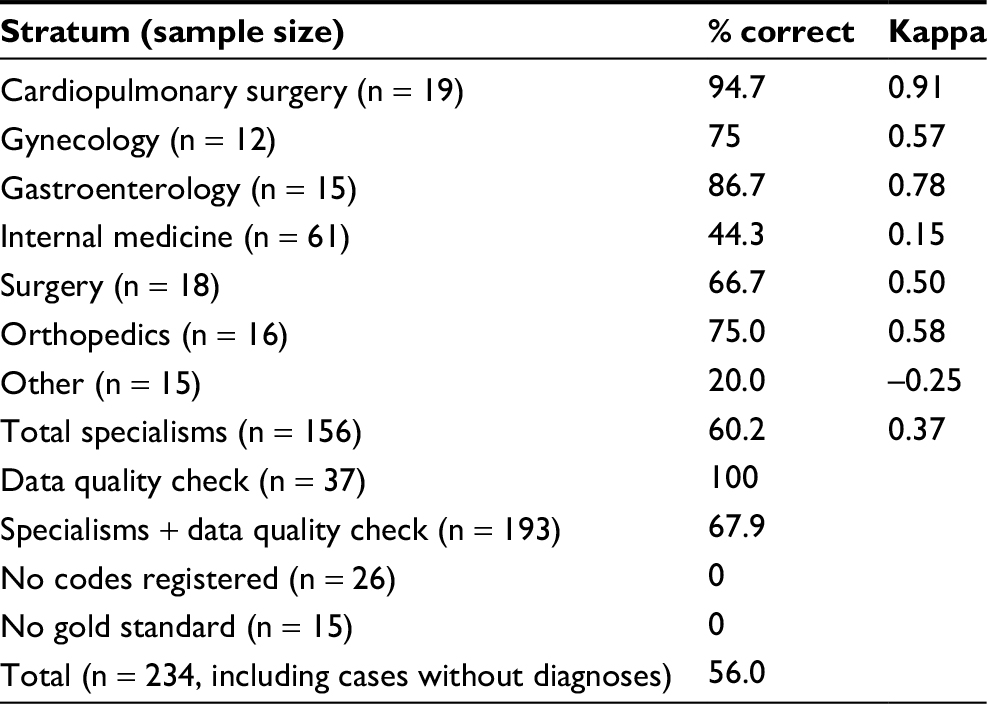 | Table 3 Agreement between initial algorithm and gold standard for diagnoses as observed in the sample (n = 234) Notes: The raw % correct in the sample is shown by specialism and in total, showing cases with only one diagnosis option (“data quality check”), cases without a gold standard, and cases without any diagnostic information as separate strata. Kappa provides a measure for chance-adjusted agreement for cases with at least two diagnosis options. |
Chance-adjusted agreement (excluding cases without a gold standard) was 0.37, varying per specialism from -0.25 (“Other”) to 0.91 (“Cardiopulmonary surgery”). This means that the algorithm performs better than chance level, both overall and for each specialism individually (except for the stratum “Other”). A more detailed overview of the predicted and observed diagnosis per specialism is provided in Table S1.
Procedures
For 78 of the 234 cases, one or more procedures were registered. The overall percentage raw agreement of the algorithm with the gold standard was 92.7% (Table 4). Excluding cases without a gold standard, this was 95.3%. Chance-adjusted agreement, excluding cases without a procedure, was 0.71. This means that overall the algorithm performs substantially better than chance level. A more detailed overview of the predicted and observed admission specialisms is provided in Table S2.
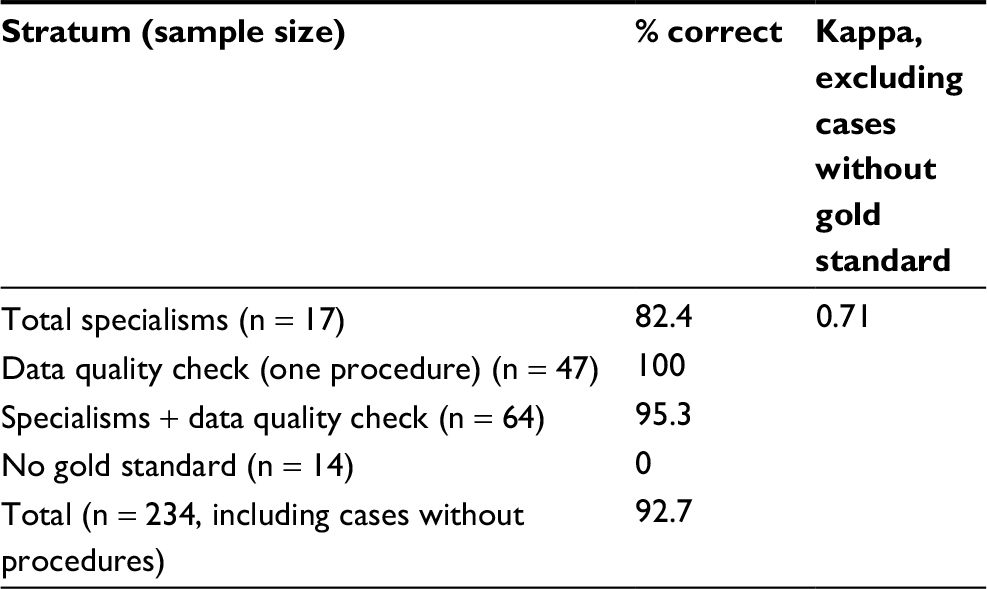 | Table 4 Agreement between initial algorithm and gold standard for procedures as observed in the sample (n = 234) Notes: The raw % correct in the sample is shown in total and separately for cases with only one procedure option (“data quality check”), cases without a gold standard, and cases without a procedure registered in the time selection. Kappa provides a measure for chance-adjusted agreement for cases with at least two procedure options. |
Data validation
The transfusions that linked to only one diagnosis and/or procedure (the “data quality check” stratum, n = 26) corresponded to the indication according to the gold standard in 100%.
The cases without any diagnoses registered (n = 26) consisted mostly of neonates (n = 25; 96.2%).
Adapted algorithm
Rules of the adapted algorithm
In the second step, the results of the initial algorithm, especially the misclassified cases, were used to adapt the algorithm. The following changes were made (Figure 2): first, instead of selecting both a diagnosis and a procedure (if available) as the indication for transfusion, the adapted algorithm selects either a procedure or a diagnosis, prioritizing procedures over diagnoses. The reason for this is that in the gold standard, a procedure, if present, was always selected as the indication. With this change in definition of the transfusion indication, the classification of cases into strata also changed somewhat (Table 5). Second, the prioritization of specialisms was adapted: diagnoses in Internal medicine: hematology and Gastroenterology are prioritized over Gynecology, because the specialism Internal medicine was misclassified relatively often (44.3% correct; Table 3). In the adapted algorithm, Gastroenterology is only selected as an indication if the patient underwent surgery under this specialism. In this way, a hematology patient with a Gastroenterology diagnosis but no surgery will be predicted to have had a hematological indication for transfusion. In addition, both Internal medicine: non-hematology and Lung medicine are placed higher on the prioritization list (Table 2). Based on the results of the data validation, cases lacking any diagnostic information were classified by the algorithm as Neonatology.
 | Figure 2 Adapted algorithm rules visualized by a decision tree. |
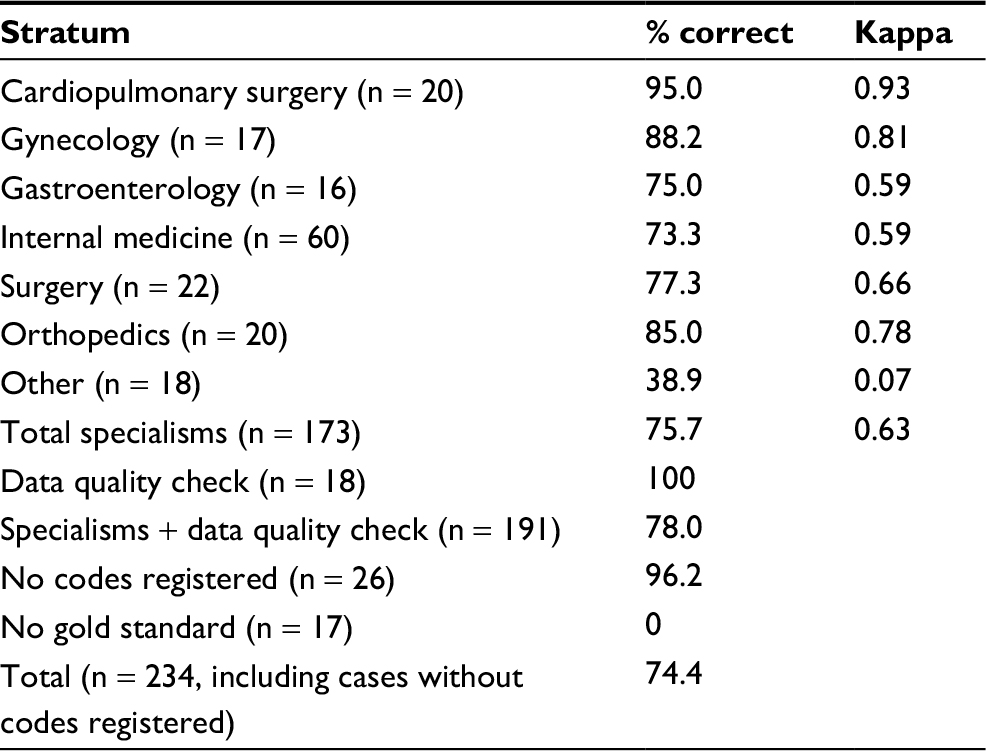 | Table 5 Agreement between adapted algorithm and gold standard for the transfusion indication as observed in the sample (n = 234) Notes: The raw % correct in the sample is shown by specialism and in total, showing cases with only one diagnosis option (“data quality check”), cases without a gold standard, and cases without any diagnostic information as separate strata. Kappa provides a measure for chance-adjusted agreement for cases with at least two options. |
Performance of the adapted algorithm
Performance in the sample
The overall percentage raw agreement of the adapted algorithm diagnoses with the gold standard was 74.4%. Excluding cases without a gold standard and those without any diagnosis or procedure registered resulted in an agreement rate of 78.0%. Agreement varied per specialism from 38.9% (for “Other”) to 95.0% (for “Cardiopulmonary surgery”; Table 5).
Performance extrapolated to the full data set
Weighting the agreement by the prevalence of predicted specialisms in the complete hospital data set, the adapted algorithm was estimated to predict the transfusion indication correctly in 75.5% of transfusion clusters in the full data set (results not shown).
Discussion
We presented a systematic approach to develop and test an algorithm for identifying the indication for transfusion, using expert opinion as starting point and a gold standard to validate and improve the algorithm. The final adapted algorithm was able to correctly identify the indication for transfusion in 74.4% of cases in the sample (75.5% when extrapolated to the full data set). The algorithm can be utilized by implementing it in the DTD.11 Knowledge of transfusion indications not only facilitates the selection of specific patient groups for future studies and the studying of reasons for transfusion but also allows benchmarking blood use in patient subpopulations.
Interpretation of results
As shown by the k = 0.63, the algorithm performed above chance level and was able to successfully identify the majority of transfusion indications. Still, for approximately 25% of cases, the algorithm’s predictions did not agree with the gold standard. Part of the disagreement can simply be explained by the fact that the algorithm is not perfect; on a more detailed level (not available to the algorithm), clinical situations of patients might differ, leading to different indications for transfusion. However, another part of the disagreement is due to data quality issues. The gold standard could not be inferred from the data in some cases because of missing registration or suspected incorrect registration dates. However, for other cases, even with perfect registration, it would be impossible to know the exact indication for transfusion. These cases often involve patients with multiple and complex morbidities (eg, resulting in anemia of critical illness), making it impossible even for the treating physician to point out one particular disease or procedure that solely necessitated the transfusion. Finally, the cases without any diagnostic information registered (approximately 3% of all transfusions) showed a clear pattern: almost all were premature neonates. This is comparable to a European study in seven hospitals, where neonates also received 3% of all red blood cell units with a medical indication.3 On request at the hospital, we found that the reason for missing data was that neonates are registered in a separate system. This is a useful outcome of the data check; now we know where to find the diagnostic information for this group if required for research.
Generalizability
Other data warehouses might use a similar approach to identify the indication for transfusion. Although the exact coding of diagnoses and procedures studied in this paper is specific for the Netherlands, the algorithm’s prioritization rules are more generally applicable. The algorithm uses the broad category of specialisms and registration dates to select the indication, which is basic information that is generally available in hospitals. Moreover, transfusion indications are often major, invasive diseases, which are expected to be registered quite consistently, allowing not much room for subjective interpretation of registration codes. In a next step, the transfusion indications resulting from the algorithm could be clustered post hoc into indication groups (for example, the study by Llewelyn et al12). This would increase generalizability and comparability of transfusion indications worldwide if similar categories are used. We generalized the sample results to the full data set by weighting the sample values according to the sampling fraction per stratum. As these strata were based on the predicted specialisms, which were not always the true specialisms, this might have introduced some level of bias if certain specialisms did not end up in the sample in sufficient numbers. However, because within each predicted stratum a random sample of cases was drawn, the most important specialisms were included in the sample with at least n = 16 cases.
Future recommendations
To ensure that the algorithm also works for a different case mix of patients, the algorithm should be validated in one or more external hospital data sets. This validation should be performed by developing a gold standard in the external data set against which the algorithm can be checked. If necessary, the algorithm may be subsequently adapted for a particular data set. A way to improve the algorithm is to take into account more detailed patient information such as age, gender, previous treatments, and the number and type of blood products received. Also, the algorithm might be improved for certain patient groups by considering a broader time frame for procedures (we only included procedures within -7 and +1 days around transfusion, and it is likely that some procedures are missed because of this selection). More specifically, the cases that were misclassified by the algorithm often concerned patients with chronic conditions like renal dialysis or malignancies. Therefore, we prioritized internal medicine (hematology) higher, so that when no surgery was present, this indication was selected more often. Another solution for selecting these hematology patients would be to consider the frequency of and interval between transfusions; regular transfusions within a broader time interval point to a hematological transfusion indication. Finally, it would be interesting to investigate whether supervised machine learning techniques would be able to improve the algorithm. Note that such an approach would require more cases with a known gold standard to train the selection model.
In the long term, a structural solution for incomplete information on transfusion indications would be to nationally improve registration at the source. Projects that try to improve source registration have been set up in the Netherlands,13,14 for example, implementing a diagnosis and procedure thesaurus that corresponds to the international standard of SNOMED CT, as well as in the US.15 In Europe, the EUROREC Institute (EuroRec), an independent not-for-profit organization, is promoting the use of high-quality Electronic Health Record systems.16 In time, projects like these will hopefully lead to enhanced data quality through better registration. Ideally, hospitals should register the diagnosis and/or procedure that motivated the transfusion for each blood product administered. Better registration is not only important for transfusion research, it is also in the direct interest of the patient and care; especially for blood transfusion, which is in itself a risky treatment.
Conclusion
An expert opinion-based algorithm is able to identify the indication for transfusion accurately for the majority of transfusions. The selected indications can be implemented in the DTD, where they can serve as a starting point for future studies. Before implementation of the algorithm in other data sets, the algorithm should be externally validated in one or more independent hospital data sets. The systematic approach can be used to apply, evaluate, and improve the algorithm in other databases.
Acknowledgment
This work was funded by Sanquin Blood Supply (PPOC- 11-042).
Author contributions
All authors contributed toward data analysis, drafting and critically revising the paper, gave final approval of the version to be published, and agree to be accountable for all aspects of the work.
Disclosure
The authors report no conflicts of interest in this work.
References
Biggin K, Warner P, Prescott R, McClelland B. A review of methods used in comprehensive, descriptive studies that relate red blood cell transfusion to clinical data. Transfusion. 2010;50(3):711–718. | ||
Tinegate H, Chattree S, Iqbal A, et al. Ten-year pattern of red blood cell use in the North of England. Transfusion. 2013;53(3):483–489. | ||
Bruun MT, Pendry K, Georgsen J, et al. Patient blood management in Europe: surveys on top indications for red blood cell use and Patient Blood Management organization and activities in seven European university hospitals. Vox Sang. 2016;111(4):391–398. | ||
Wells AW, Mounter PJ, Chapman CE, Stainsby D, Wallis JP. Where does blood go? Prospective observational study of red cell transfusion in north England. BMJ. 2002;325(7368):803. | ||
Frank SM, Resar LM, Rothschild JA, Dackiw EA, Savage WJ, Ness PM. A novel method of data analysis for utilization of red blood cell transfusion. Transfusion. 2013;53(12):3052–3059. | ||
Shehata N, Forster A, Lawrence N, et al. Changing trends in blood transfusion: an analysis of 244,013 hospitalizations. Transfusion. 2014;54(10 pt 2):2631–2639. | ||
van Walraven C, Bennett C, Forster AJ. Administrative database research infrequently used validated diagnostic or procedural codes. J Clin Epidemiol. 2011;64(10):1054–1059. | ||
Kleinman S, Glynn SA. Database research in transfusion medicine: the power of large numbers. Transfusion. 2015;55(7):1591–1595. | ||
Krabbe-Alkemade YJ, Groot TL, Lindeboom M. Competition in the Dutch hospital sector: an analysis of health care volume and cost. Eur J Health Econ. 2017;18(2):139–153. | ||
Hallgren KA. Computing inter-rater reliability for observational data: an overview and tutorial. Tutor Quant Methods Psychol. 2012;8(1):23–34. | ||
van Hoeven LR, Hooftman BH, Janssen MP, et al. Protocol for a national blood transfusion data warehouse from donor to recipient. BMJ Open. 2016;6(8):e010962. | ||
Llewelyn CA, Wells AW, Amin M, et al. The EASTR study: a new approach to determine the reasons for transfusion in epidemiological studies. Transfus Med. 2009;19(2):89–98. | ||
Dutch Federation of University medical centers (NFU). Source Registration [Registratie aan de bron]. Available from: http://www.nfu.nl/img/pdf/13.3694_Brochure_Registratie_aan_de_bron_versie_4-7-13.pdf. Accessed January 2017. | ||
Dutch Association of General Hospitals and Specialized Institutions (NVZ) [webpage on the Internet]. Information Policiy: Four Priorities [Informatiebeleidsplan NVZ: vier speerpunten]. Available from: https://www.nvz-ziekenhuizen.nl/onderwerpen/informatiebeleid. Accessed January 2017. | ||
CMS [webpage on the Internet]. EHR Incentive Programs. Available from: https://www.cms.gov/Regulations-and-Guidance/Legislation/EHRIncentivePrograms/index.html?redirect=/ehrincentiveprograms. Accessed January 2017. | ||
EuroRec [webpage on the Internet]. Seal. Available from: http://www.eurorec.org/services/seal/index.cfm. Accessed January 2017. |
 © 2018 The Author(s). This work is published and licensed by Dove Medical Press Limited. The
full terms of this license are available at https://www.dovepress.com/terms
and incorporate the Creative Commons Attribution
- Non Commercial (unported, 3.0) License.
By accessing the work you hereby accept the Terms. Non-commercial uses of the work are permitted
without any further permission from Dove Medical Press Limited, provided the work is properly
attributed. For permission for commercial use of this work, please see paragraphs 4.2 and 5 of our Terms.
© 2018 The Author(s). This work is published and licensed by Dove Medical Press Limited. The
full terms of this license are available at https://www.dovepress.com/terms
and incorporate the Creative Commons Attribution
- Non Commercial (unported, 3.0) License.
By accessing the work you hereby accept the Terms. Non-commercial uses of the work are permitted
without any further permission from Dove Medical Press Limited, provided the work is properly
attributed. For permission for commercial use of this work, please see paragraphs 4.2 and 5 of our Terms.