Back to Journals » Diabetes, Metabolic Syndrome and Obesity » Volume 18
Waist-to-Height Ratio – Reference Values and Associations with Cardiovascular Risk Factors in a Russian Adult Population
Authors Kholmatova K, Krettek A, Dvoryashina IV, Malyutina S, Cook S ![]() , Avdeeva E, Kudryavtsev AV
, Avdeeva E, Kudryavtsev AV ![]()
Received 13 August 2024
Accepted for publication 11 June 2025
Published 1 August 2025 Volume 2025:18 Pages 2641—2653
DOI https://doi.org/10.2147/DMSO.S491261
Checked for plagiarism Yes
Review by Single anonymous peer review
Peer reviewer comments 3
Editor who approved publication: Dr Rebecca Baqiyyah Conway
Kamila Kholmatova,1– 3 Alexandra Krettek,1,4,5 Irina V Dvoryashina,3 Sofia Malyutina,6,7 Sarah Cook,8 Ekaterina Avdeeva,6 Alexander V Kudryavtsev2
1Department of Community Medicine, UiT The Arctic University of Norway, Tromsø, Norway; 2International Research Competence Centre, Northern State Medical University, Arkhangelsk, Russia; 3Department of Hospital Therapy and Endocrinology, Northern State Medical University, Arkhangelsk, Russia; 4Department of Public Health, School of Health Sciences, University of Skövde, Skövde, Sweden; 5Department of Internal Medicine and Clinical Nutrition, Institute of Medicine, Sahlgrenska Academy at University of Gothenburg, Gothenburg, Sweden; 6Scientific Research Institute of Internal and Preventive Medicine, Branch of Federal Research Centre Institute of Cytology and Genetics, Siberian Branch of the Russian Academy of Sciences, Novosibirsk, Russia; 7Department of Therapy, Hematology and Transfusiology, Novosibirsk State Medical University, Novosibirsk, Russia; 8School of Public Health, Faculty of Medicine, Imperial College London, London, UK
Correspondence: Kamila Kholmatova, Department of Community Medicine, UiT The Arctic University of Norway, PO Box 6050, Langnes, NO-9037, Tromsø, Norway, Email [email protected]
Purpose: Waist-to-height ratio (WHtR) is an anthropometric index with limited data on its population distribution. The aim was to establish WHtR reference values and investigate WHtR associations with socio-demographic, lifestyle and clinical characteristics in Russian adults.
Methods: We used data from the population-based cross-sectional Know Your Heart study (2015– 2018, Arkhangelsk and Novosibirsk, N = 4495, 58.1% of women, 35– 69 years, mean age 54.0). Age-adjusted WHtR reference values for the total study population and by sex were modeled as marginal 5th-95th percentiles (P5-P95) through quantile regressions. WHtR associations with cardiovascular biomarkers were assessed using linear regressions.
Results: The conventional WHtR threshold of 0.5 for abdominal obesity was the value of P25, while P50 and P75 values were 0.54 and 0.60. In ages 35– 49 years, P5-P50 values were higher in men. In the age group 60– 69 years, P25-P95 values were higher in women. In both sexes, WHtR was associated with age, city of residence, not having university education and low physical activity; in women – with poor financial situation, in men – with being married, non-smoking and hazardous drinking. Among clinical parameters, C-reactive protein had the strongest positive association with WHtR in both sexes, while HDL cholesterol had the strongest negative association. Each standard deviation (SD) change in ln-transformed C-reactive protein was associated with 0.435 and 0.321 SD increase in WHtR in women and men, respectively. One SD increase in HDL cholesterol was associated with − 0.334 SD change in WHtR in women and with corresponding change of − 0.297 SD in men. In women, WHtR had stronger associations with age, university education, poor financial situation, blood pressure, HDL cholesterol, and ln-transformed C-reactive protein, in men – with being married, current smoking, LDL and non-HDL cholesterol, and HbA1c.
Conclusion: Three-quarters of the study population had WHtR values exceeding the conventional threshold for abdominal obesity. Men and women differed in the WHtR associations with socio-demographic and lifestyle risk factors, biomarkers of inflammation, hypertension, dyslipidemia, and diabetes. WHtR is a useful cardiovascular risk indicator in a Russian adult population.
Keywords: waist-to-height ratio, reference values, obesity, Russia
Introduction
Obesity has reached epidemic proportions with a worldwide prevalence that has nearly tripled over the last forty years. 1 It is one of the key modifiable risk factors of cardiovascular disease (CVD) 1,2 and is a particular public health concern in the Russian Federation – a country with high CVD mortality (640 per 100000 population).3–5
Based on the World Health Organization assessments, 23.1% of Russian adults are obese; 26.9% of women and 18.1% of men.6 According to NCD Risk Factor Collaboration (NCD-RisC) data for 1990–2022, there was a 15.4% increase in obesity prevalence in Russian men, while there was no detectable change in the prevalence of obesity in women.7 However, our recent study showed that Russian women have a particularly high prevalence of obesity compared with women in Norway.8 Correspondingly, the Russian population had higher prevalence of obesity-related risk CVD factors (ie, hypertension, diabetes, and cigarette smoking) compared to the Norwegian population.8–10 Combined with other traditional risk factors, obesity is used for CVD risk stratification3,11 and commonly associates with other socio-economic, lifestyle, and psychological characteristics with independent prognostic values for CVD development.3,12,13
While obesity is commonly determined using body mass index (BMI), abnormal body fat accumulation is a CVD risk factor independently of BMI.2,14,15 Abdominal obesity, also referred to as central obesity, contributes to the development of other CVD risk factors that are part of the metabolic syndrome.16–18 Fat tissue may also induce systemic low-grade inflammation, which influences metabolic homeostasis and contributes to CVD pathogenesis.19
Waist circumference (WC) is the most commonly used index of central obesity.20 However, it does not consider height, as a shorter individual with similar WC would have more adipose tissue.21 In that sense, waist-to-hip ratio (WHR) and waist-to-height ratio (WHtR) are more reliable, as they are calculated relative to other body size parameters.22,23 There are also other anthropometry-based indices of abdominal obesity (abdominal volume index, weight-adjusted-waist-index, body shape index, conicity index, body roundness index, body adiposity index, and hip index), which are infrequently used because they are calculated using complex formulas and are more difficult to interpret.20,24–31 Instrumental approaches to measure the amount of adipose tissue are computed tomography, magnetic resonance imaging, dual-energy X-ray absorptiometry, and biological impedance analysis.32,33 However, these methods are less available in primary health care as they require expensive equipment and complex analysis techniques.34,35
Recently, WHtR has evolved as an index with a single cut-off of 0.5 for abdominal obesity across age and gender, which exhibits stronger associations with metabolic CVD risk factors compared to the other anthropometric indices and serves as an indicator of the “early health risk”.15,35–40 In Russia, clinicians and obesity researchers conventionally use BMI and WC.41–43 However, in our recent study that assessed the prevalence of obesity in Russian adults using six indices, WHtR showed the closest associations with hypertension and combinations of cardiometabolic disorders in women while being non-inferior compared to the other five indices in men.44 Therefore, WHtR is a promising tool for preventive cardiology in Russia, but the void in knowledge of its population distribution and lacking reference values limit its acceptance by the medical community, hampers its benefits for early CVD prevention, and prevents regional and international comparisons.45
The aim of this study was to establish reference values for WHtR and to investigate the associations of WHtR with socio-demographic, lifestyle and clinical characteristics in a Russian adult population.
Materials and Methods
Study Design and Population
The Know Your Heart study was a population-based cross-sectional study, conducted in 2015–2018 in two Russian cities – Arkhangelsk and Novosibirsk. Potential participants aged 35–69 years were selected from the two urban populations using anonymized address databases of regional health insurance funds. Each record in the sampling frame included address, age, and sex of a potential participant. Participants were recruited from four districts in each city, representing the socio-economic variability of the study settings.46 Addresses were selected at random (stratified by age, sex and district) and visited to invite persons of the required sex and age to participate. In total, 5089 men and women were interviewed at home (baseline interview) on socio-demographic and lifestyle factors. Those interviewed were invited to a health check at a local polyclinic. The health check comprised a medical interview, physical examination, anthropometric measurements, laboratory tests, and instrumental examinations. The exclusion criteria were psychiatric diagnoses, acute infections or exacerbations of chronic diseases. The response rate to the baseline interview was 68.2% in Arkhangelsk and 41.1% in Novosibirsk. Of the interviewed participants, 96% in Arkhangelsk and 83% in Novosibirsk underwent the health check (2381 and 2161 participants, respectively). Details of the KYH study design, sampling, measurements and sample characteristics have been described elsewhere.8,44,46 For this paper, we used data of 4495 KYH participants with complete data on anthropometric parameters.
Variables
Body weight was measured with TANITA BC 418 body composition analyzer (TANITA, Europe GmbH). Height was measured with Seca® 217 portable stadiometer (Seca limited). WC was measured twice at the narrowest part of the trunk to the nearest 0.1 cm.46 WHtR was calculated as the mean of two WC measurements divided by height, both in centimeters. WHtR cut-off of ≥0.5 was used to define abdominal obesity.23
Socio-demographic data were collected at the baseline interview. The following socio-demographic variables were used in this study: age (years); sex (male/female); city of residence (Novosibirsk or Arkhangelsk); living with a spouse/partner in a registered or unregistered marriage (yes/no); university education (yes/no); and poor financial situation defined as having not enough money for food or clothes (yes/no).
We also used data on diet, physical activity, cigarette smoking, and hazardous alcohol intake. Diet quality was evaluated with the Dietary Quality Score (DQS) questionnaire and categorized as unhealthy, average, and healthy.47 Physical activity was assessed through the Total Physical Activity Index (EPIC) questionnaire based on questions about physical activity at work, recreation, and stair climbing during the last year.48 Low physical activity was defined as sedentary job with <0.5 hours of recreational activity per day or standing job with no recreational activity.49 Cigarette smoking was analyzed as current smoking (yes/no). Hazardous drinking was defined as ≥8 points on the Alcohol Use Disorders Identification Test (AUDIT).50
Systolic and diastolic blood pressure (SBP and DBP; mm Hg) and resting heart rate (HR) were measured on the brachial artery. Three measurements were performed at two-minute intervals using OMRON 705 IT automatic blood pressure monitor (OMRON Healthcare Company Limited). Analyzed values of SBP, DBP and HR were calculated as means of the second and third measurements.
The fasting period prior to blood sampling was four hours. Levels of total cholesterol (TC, mmol/L), low-density lipoprotein cholesterol (LDL-C, mmol/L), and high-density lipoprotein cholesterol (HDL-C, mmol/L) were assessed in blood serum using enzymatic color tests (AU 680 Chemistry System Beckman Coulter). High-sensitivity C-reactive protein (hs-CRP, mg/L) and glycated hemoglobin (HbA1c, %) were evaluated in serum using immuno-turbidimetric tests (AU 680; Chemistry System Beckman Coulter).46 Non high-density lipoprotein cholesterol (non-HDL-C) was calculated by subtracting HDL-C from TC (mmol/L).3
Depression was evaluated using the Patient Health Questionnaire-9 (PHQ-9), with depression levels defined as mild (≥5–9 points), moderate (10–14 points), moderately severe (15–19 points), or severe (≥20 points).51 Anxiety levels were assessed using the General Anxiety Disorder-7 (GAD-7) questionnaire with levels of mild (5–9 points), moderate (10–14 points), or severe (≥15 points).52
Data on medication use were collected by asking the participants about currently used medicines (up to seven per participant). The commercial name, dose, indication, and frequency were recorded. According to the international WHO anatomical therapeutic chemical (ATC) classification system (2016), the medications’ names were coded as: antidiabetic medication (ATC class A10); antihypertensive medication (ATC classes C02, C03, C07, C08, or C09); heart rate lowering (HR-lowering) medication (ATC classes C01A, C01BC03, C01BD, or C01EB17); lipid-lowering medication (ATC class C10).53,54
Statistical Methods
Continuous variables were presented as means (M) with standard deviations (SD) or medians (Me) with quartiles (Q1-Q3), categorical variables – as absolute numbers (Abs) and proportions (%). Comparisons of men and women on categorical variables were performed using Pearson’s chi-squared test, on continuous variables – using two-sample t-test or Wilcoxon rank-sum test.
We estimated reference values for WHtR for the total study population, for women and men separately, and for 5-year age bands (from 35–39 to 64–69 years) within each sex. Age- and sex-adjusted WHtR mean values for both sexes and age-adjusted means for each sex were estimated as marginal means, modelled using multivariable linear regressions with age in years and sex being the covariates. Estimated means for 5-year age groups in men and women were obtained using similar regressions with corresponding stratification. Age- and sex-adjusted percentile values (5th, 10th, 25th, 50th, 75th, 90th, and 95th) of WHtR for both sexes and age-adjusted percentiles for men and women separately were estimated as marginal percentile values, obtained using quantile regressions with age in years and sex as covariates. Age-specific percentile values of WHtR for men and women were assessed in similar quantile regressions, stratified by sex and 5-year age bands. Differences between men and women on mean and percentile values of WHtR were reported when coefficients for sex variable in corresponding regressions were significant at p <0.05.
Associations of WHtR with socio-demographic, lifestyle and clinical parameters were assessed for men and women separately using linear regression analysis. At step one (model 1), we assessed univariate associations of all factors with WHtR with adjustments only for age. At the second step (model 2) of the analyses of socio-demographic and lifestyle factors, we entered all these factors in regression simultaneously. In analyses of clinical factors, the second step (model 2) involved adjustments for age and all socio-demographic factors and lifestyle factors, which were significantly associated with WHtR in either women, or men. In Models 1 and 2, BP variables were additionally adjusted for BP medication, lipid profile variables – for lipid lowering medication, HbA1c – for medication for diabetes, resting heart rate – for HR-lowering medication. Skewed continuous variables were entered in ln-transformed form. Results of regression analyses were shown as B coefficients with 95% CIs and as standardized β coefficients. Comparisons of men and women on the strength of associations between WHtR and the studied covariates were performed in multivariable models repeated on the pooled data for both sexes by assessing interactions of each covariate with sex. Continuous variables were tested for interactions after categorization into pentiles. Interactions were assessed by comparing models with and without interaction terms using likelihood ratio tests. All statistical tests were two-tailed. Statistical analysis was performed using STATA V.18 (StataCorp, College Station, TX, USA).
Results
Characteristics of the Study Participants
Women (N = 2611) and men (N = 1884) in the study were of similar age (53.8 vs 54.1 years, respectively), but differed in socio-demographic variables (except for city of residence), lifestyle, and psychological characteristics (Table 1). More women had university education and exhibited healthy diet. Furthermore, women more frequently had poor financial situation, depression and anxiety compared to men. Higher proportions of men were married, smoked cigarettes and had hazardous drinking compared to women. Among clinical parameters, men had higher SBP and DBP, and TG levels, while levels of TC, LDL-C, and HDL-C were higher in women.
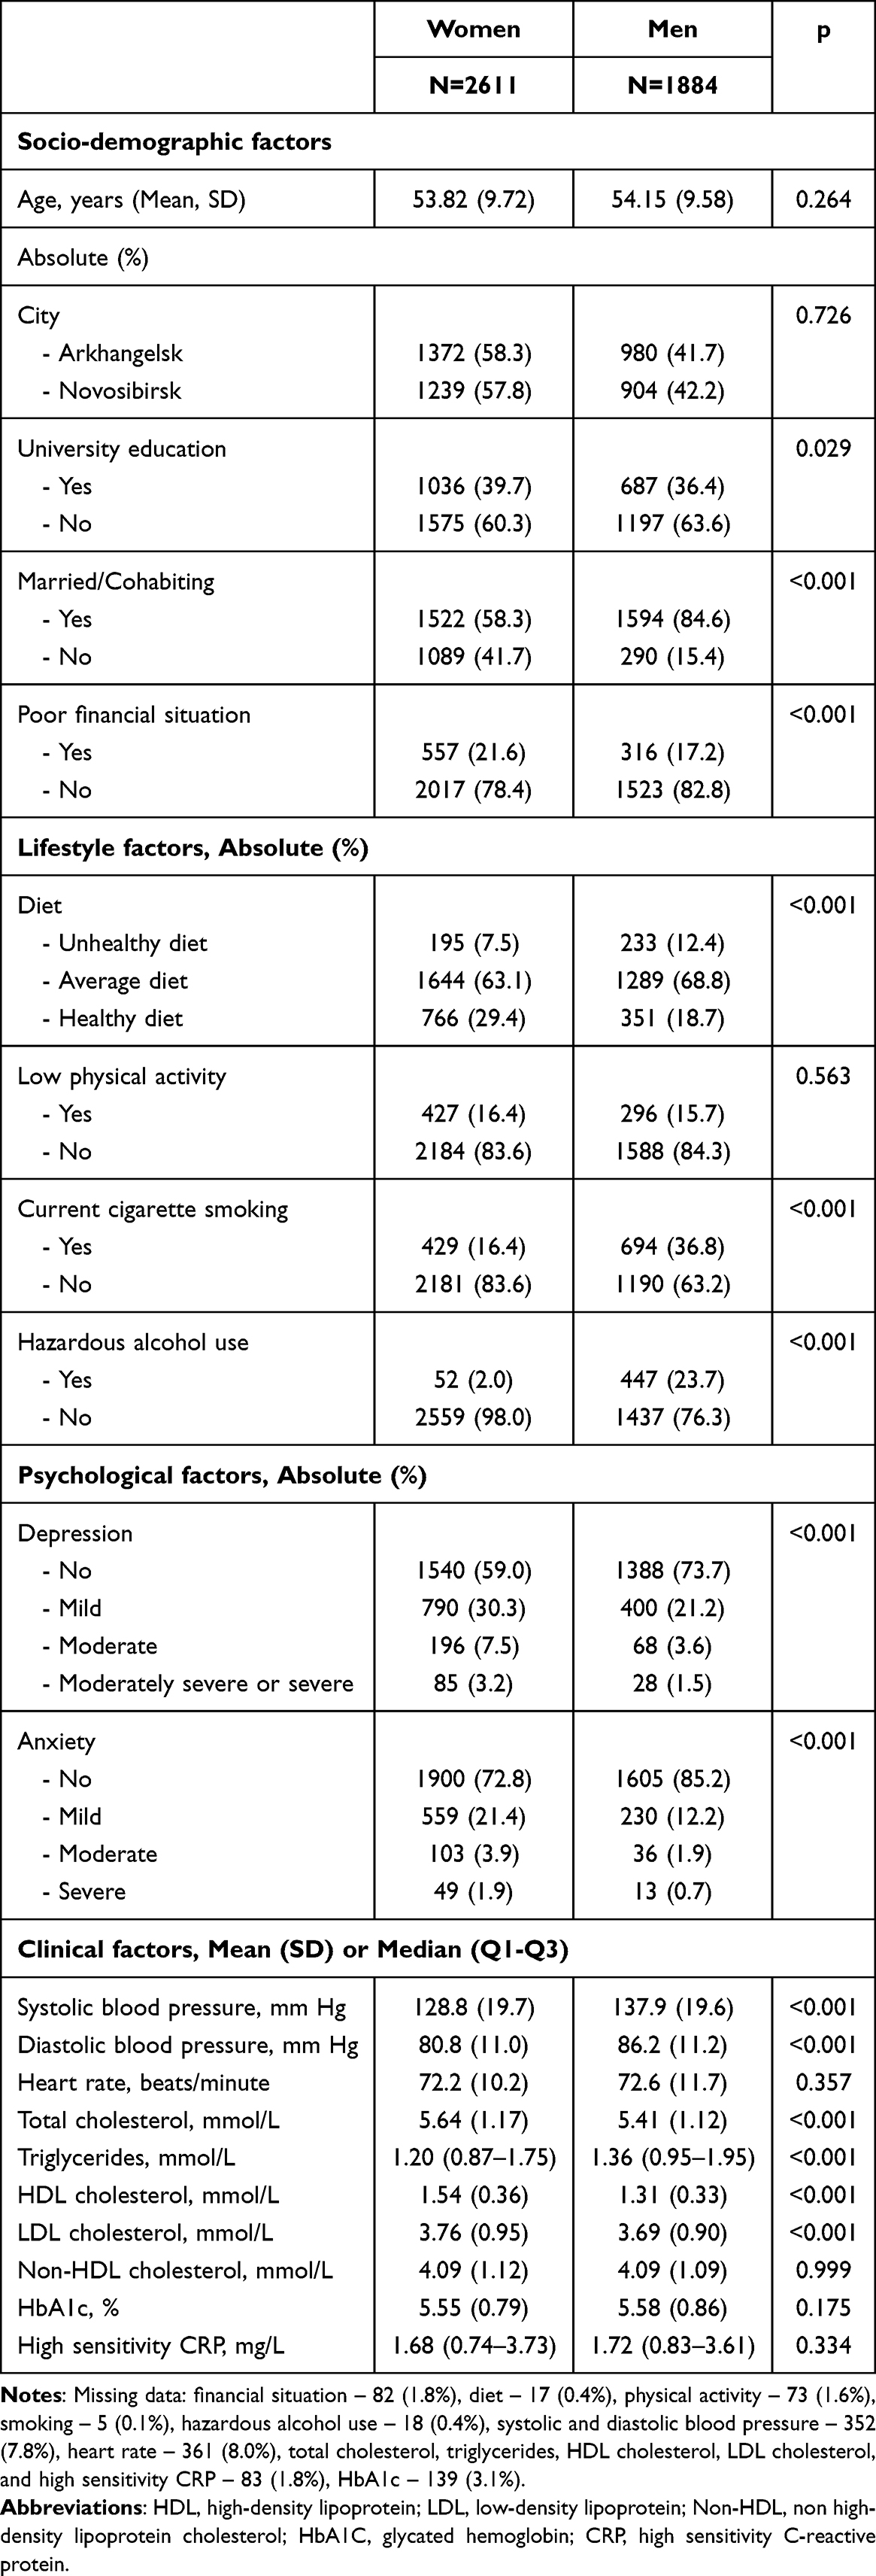 |
Table 1 Socio-Demographic, Lifestyle, Psychological, and Clinical Characteristics of Study Participants by Sex |
WHtR Reference Values
The distributions of the modelled WHtR mean percentile values in men and women are shown in Table 2. While there was no difference in mean WHtR between women and men aged 35–69 years, the means were higher in men aged 35–49 years. Medians WHtR values (P50) did not differ between men (0.55) and women (0.54). However, in the age group 35–49 years, P5-P50 values were higher in men, while for women, the values of P25-P95 were higher for the age group 60–69 years. Women had P50 values below 0.5 (the conventional cut-off point for abdominal obesity) in the age group 35–44 years, whereas men had WHtR values ranging from 0.52 to 0.53 in the corresponding age group. The P50 values were 25.0% and 9.1% higher in the ages of 65–69 years compared with 35–39 years in women and in men, respectively. The conventional cut-off value of 0.5 was the value of the 25th percentile for both men and women, suggesting that 75% of studied population had abdominal obesity as defined according to WHtR. The upper quartile (P75) was 0.61 in women and 0.59 in men. The 90th percentile of WHtR was 0.67 and 0.64 in women and men, respectively.
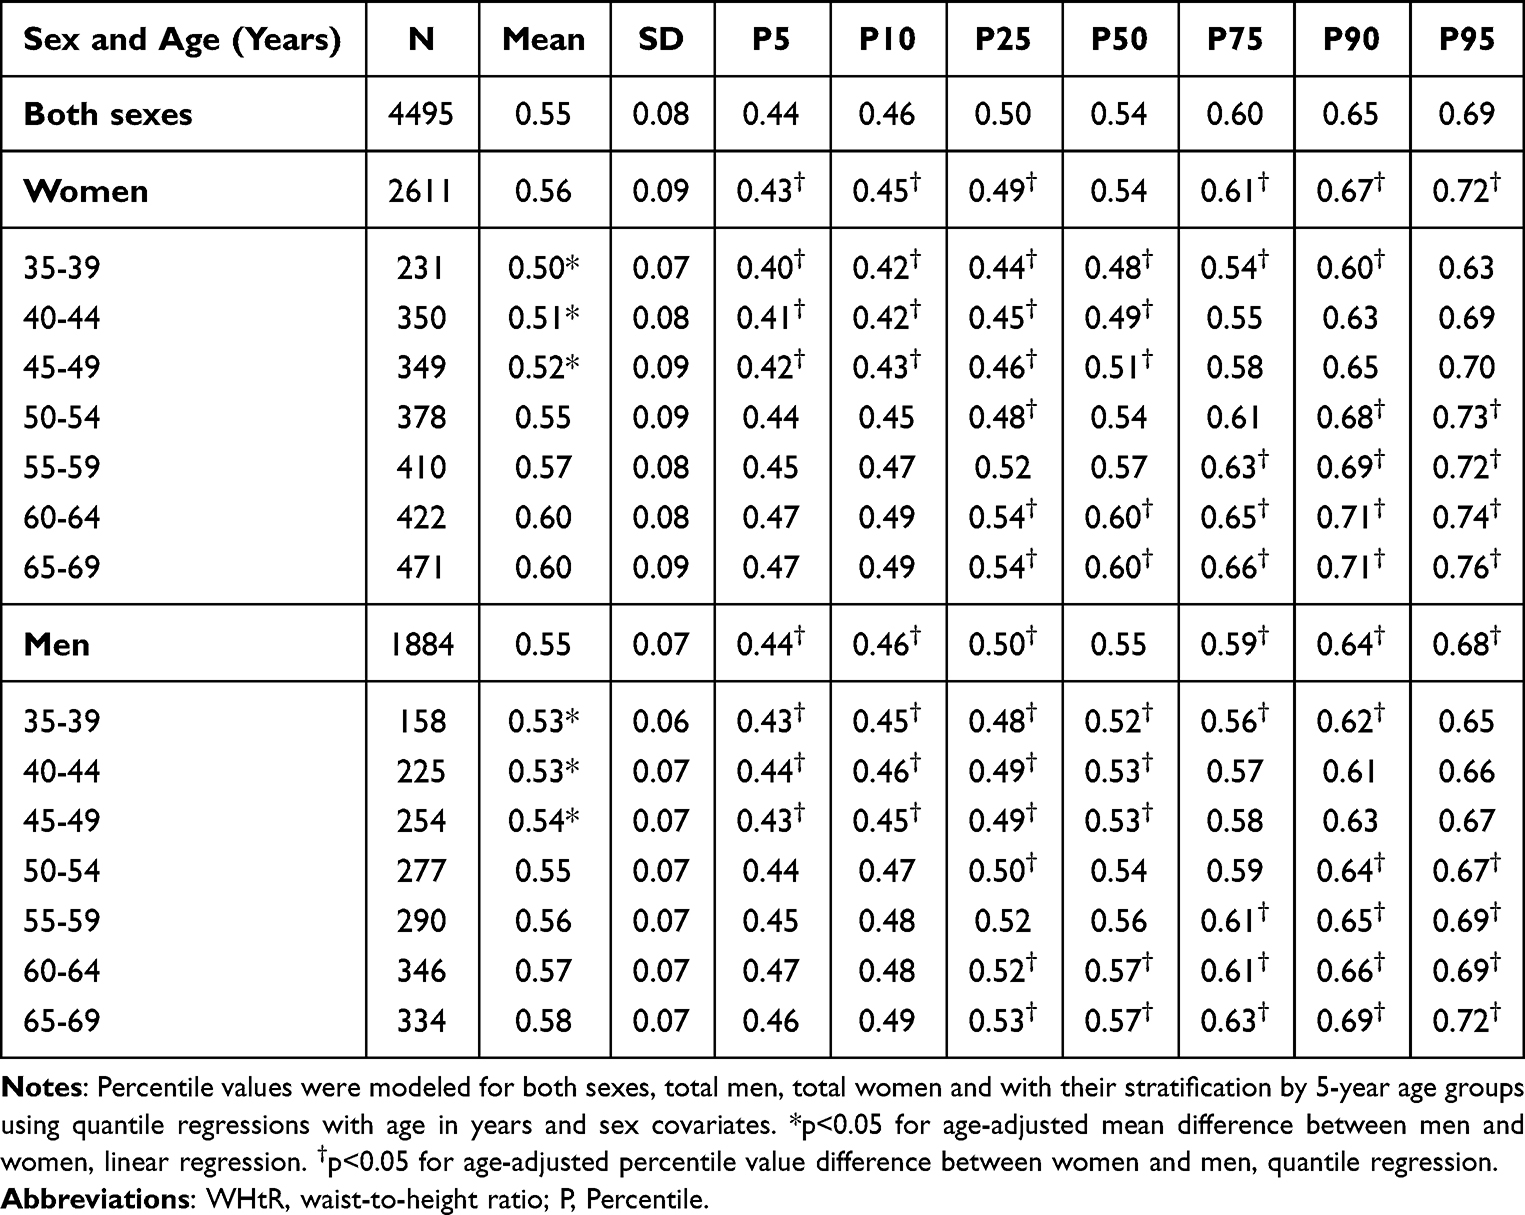 |
Table 2 Sex- and Age-Specific Percentile Values for WHtR According to Sex and 5-year Age Groups |
Socio-Demographic, Lifestyle, Psychological, and Medical Correlates of WHtR
In both sexes, age was positively associated with WHtR in the univariate regression Model 1 and after adjustment for all other socio-demographic and lifestyle variables in Model 2 (Table 3). The standardized β coefficients for the association of WHtR with age were highest compared to other socio-demographic and lifestyle parameters in both sexes, although in women it was almost twice as high as in men. Living in Arkhangelsk was negatively associated with WHtR compared to Novosibirsk in both Models and for both sexes. Married men exhibited higher values of WHtR in Models 1 and 2 compared to unmarried men. There was no association between marital status and WHtR in women. Having no university education was positively associated with WHtR in both models in women, while in men the association was only present in the adjusted Model 2. Women, but not men, with poor financial situation had higher values of WHtR in the age-adjusted and multivariable models. According to interaction analysis, all the differences in the strength of the adjusted associations between WHtR and socio-demographic covariates except city of residence were significant between sexes.
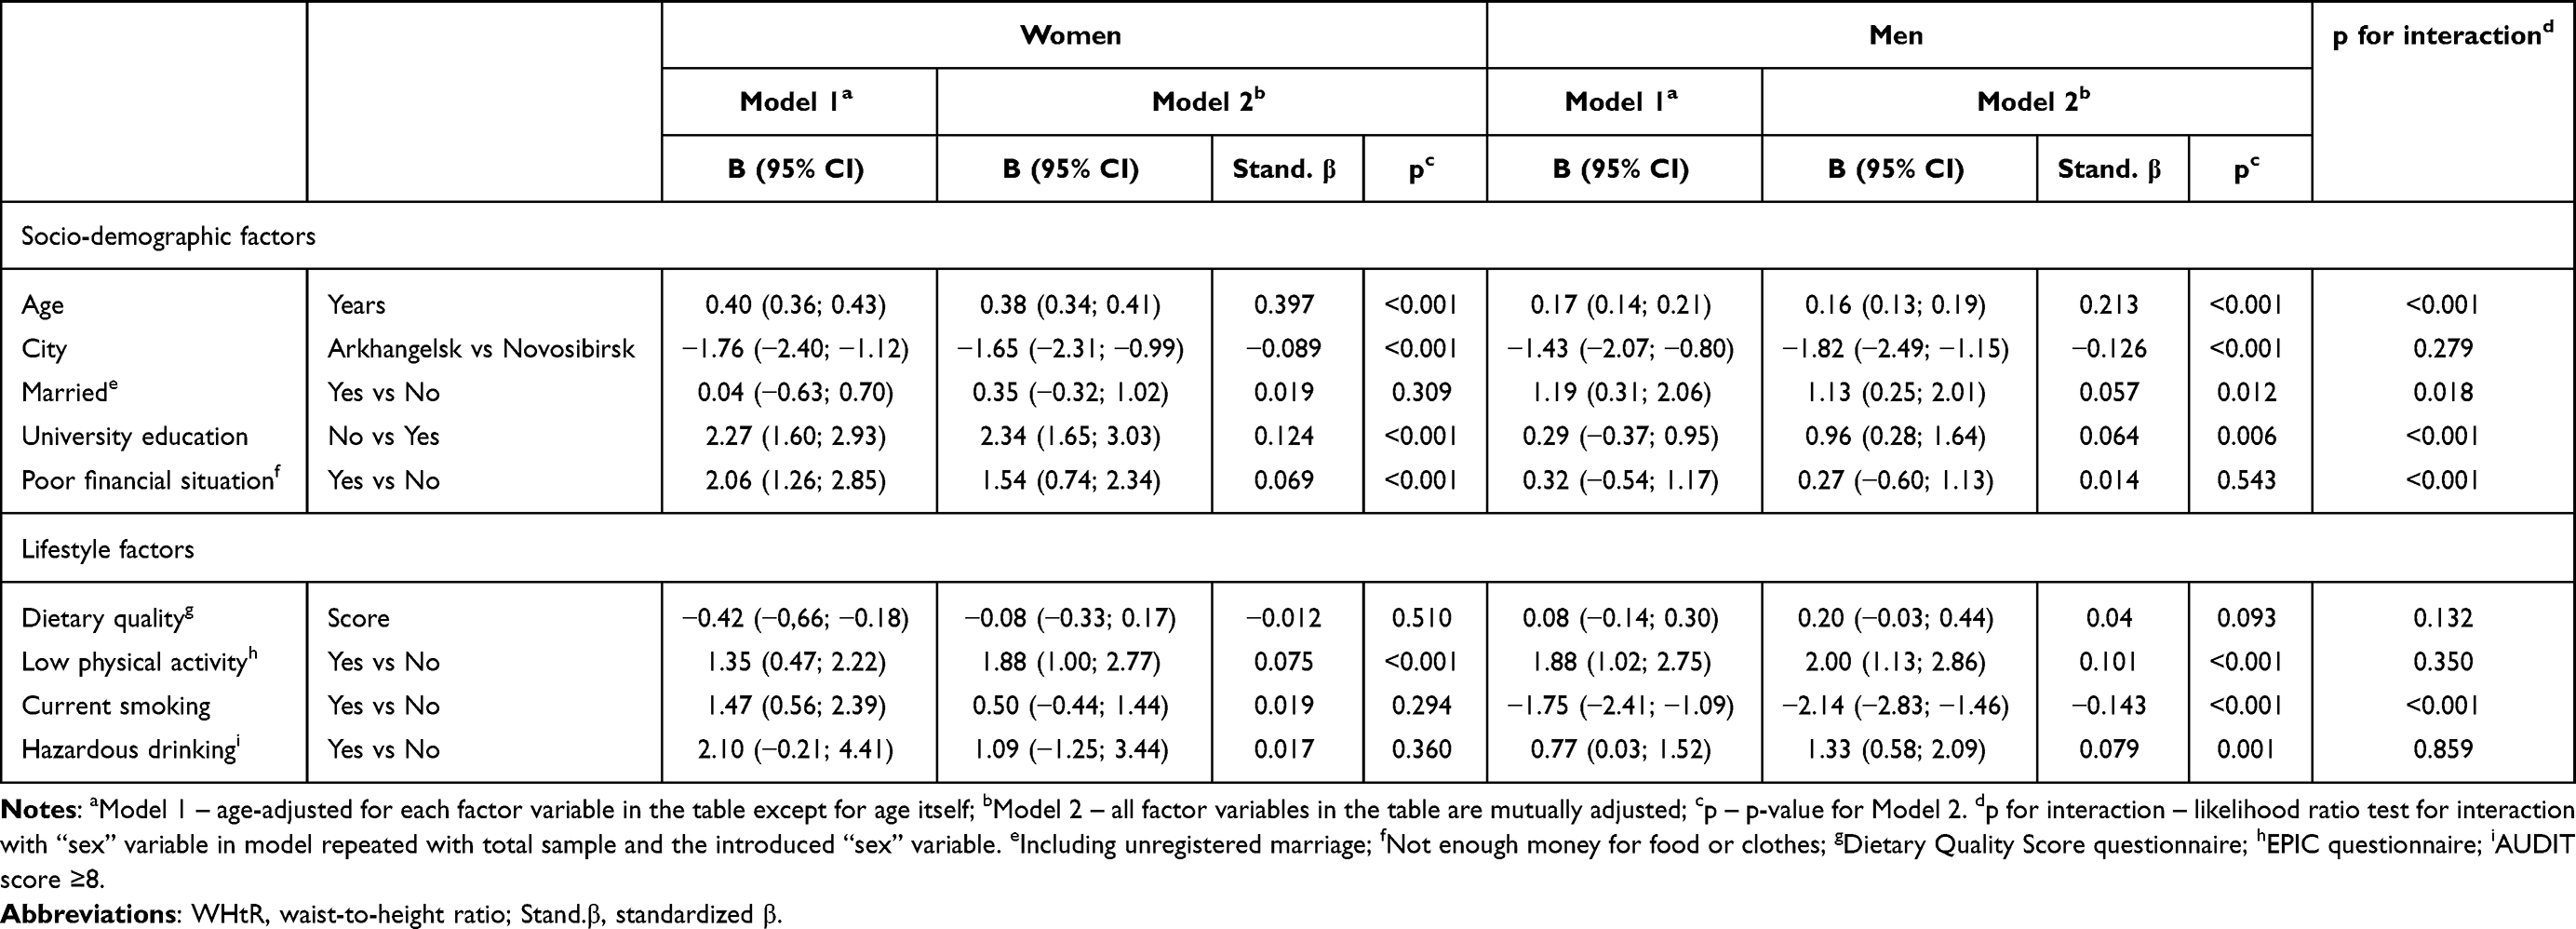 |
Table 3 Associations of Socio-Demographic and Lifestyle Factors with WHtR (%) in Women and Men |
Healthy diet was negatively associated with WHtR in age-adjusted Model 1 only in women, but was attenuated to non-significance in Model 2. Participants of both sexes with low physical activity levels had higher values of WHtR in both Models 1 and 2. Current smoking was negatively associated with WHtR in both Models, but only in men, while in women it had positive associations only in Model 1, which was reflected in the significant between-sex difference in the strength of WHtR’s association with smoking. Hazardous drinking showed positive associations with WHtR in both Models, but only in men.
Associations of SBP and DBP with WHtR adjusted for age and BP medication intake in Model 1 and for all other significant socio-demographic and lifestyle factors in Model 2 were positive and significant in both sexes, exhibiting stronger correlation in women (Table 4). Among the lipid parameters, in both males and females, HDL-C was negatively correlated with WHtR, while LDL-C and non-HDL-C showed positive associations with WHtR in both models. Positive associations of TC with WHtR were significant in both models, but only in men. HbA1c and resting heart rate had positive associations with WHtR in both models and for both sexes. Positive associations of ln-transformed hsCRP with WHtR were significant in age-adjusted Model 1 and in multivariate Model 2 in both women and men.
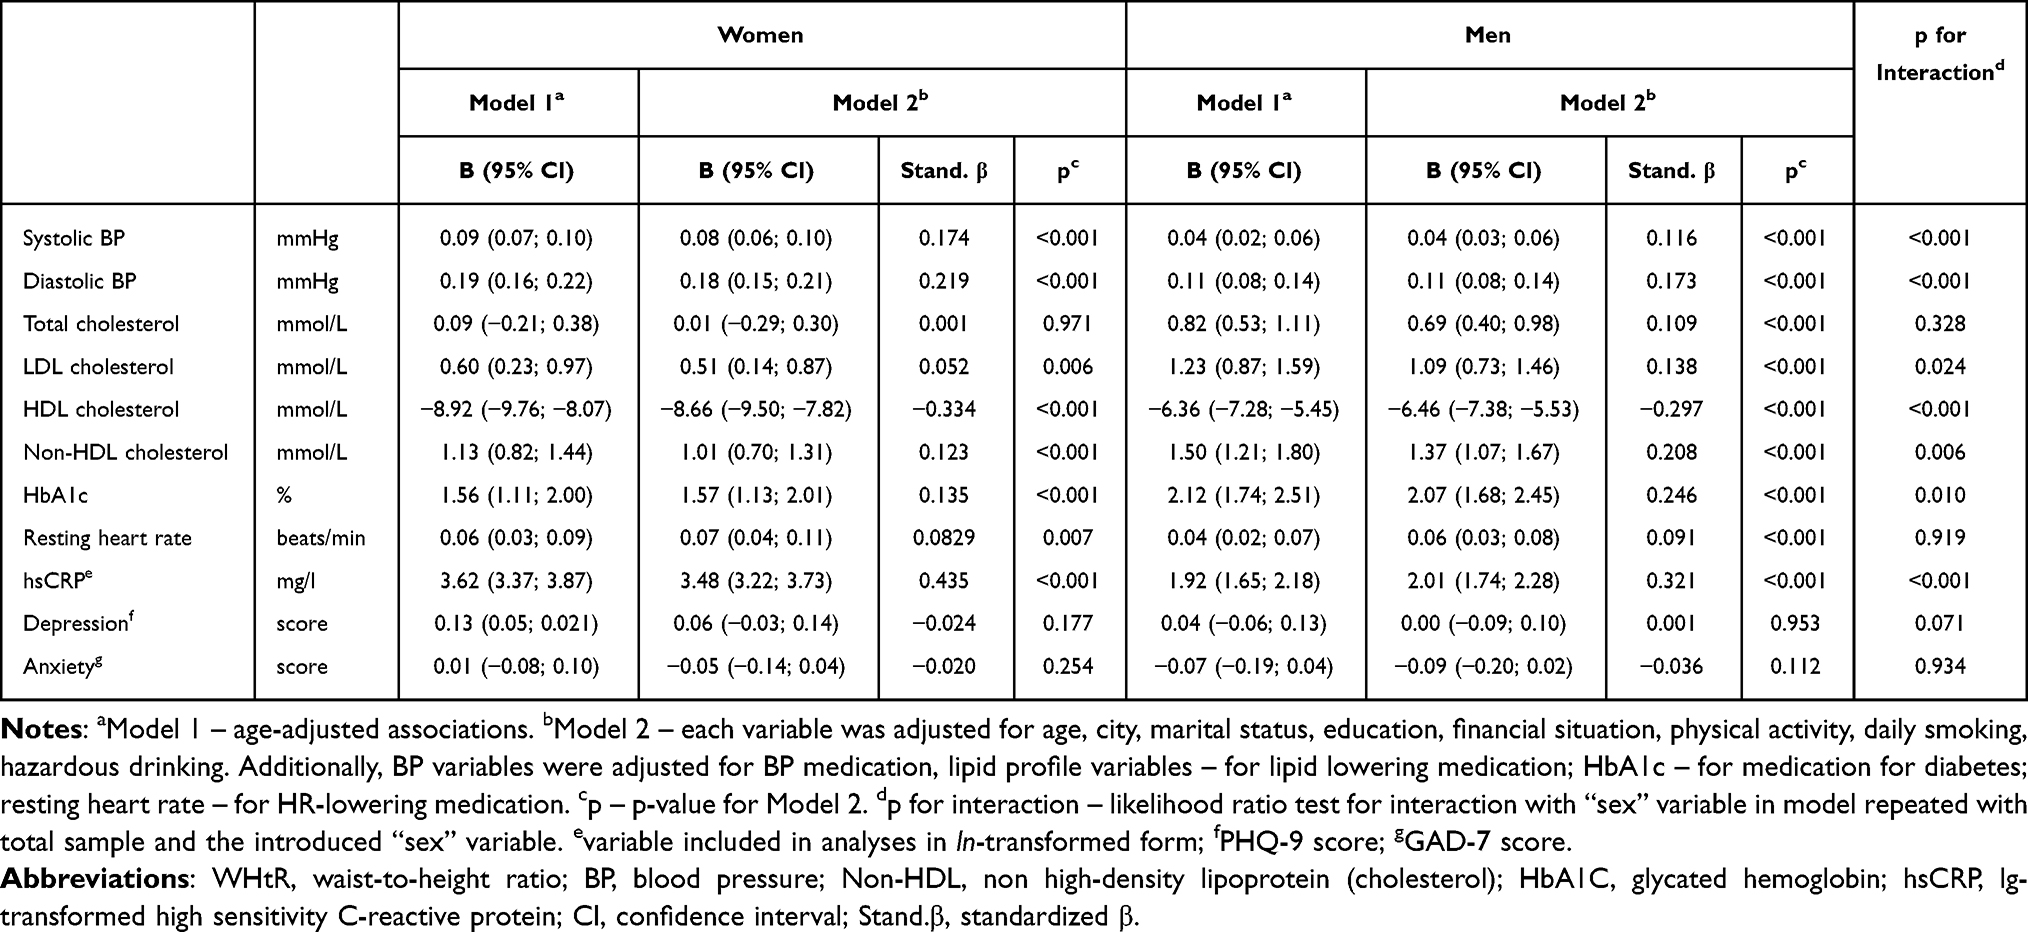 |
Table 4 Associations of Clinical Characteristics with WHtR (%) in Women and Men |
Among the clinical parameters, in Model 2 ln-transformed hsCRP showed the strongest positive associations with WHtR in women (β = 0.435) and in men (β = 0.321), while HDL-C was the strongest negative WHtR correlate (β = −0.334 and β = −0.297, respectively). The third-order correlate was DBP (β = 0.219) in women and HbA1c (β = 0.246) in men. Depression score was positively associated with WHtR in women, but only in Model 1, before adjustment for other significant socio-demographic factors.
Women had stronger WHtR associations with age, university education, poor financial situation, blood pressure, HDL cholesterol, and ln-transformed hsCRP. In men, WHtR demonstrated a stronger association with being married, current smoking, LDL and non-HDL cholesterol and HbA1c.
Discussion
The present study is the first to provide sex- and age-specific reference values for WHtR in Russian adults aged 35–69 years. In our study population, the average WHtR values (from 25th to 75th percentile) were 0.50–0.60, the values above average (from 75th to 90th percentile) were 0.60–0.65, the values below average (from 10th to 25th percentile) were 0.46–0.50, low and high values (below 10th percentile and above 90th percentile) were <0.46 and >0.65, respectively. Approximately 75% of the study population had abdominal obesity, as assessed according to WHtR’s conventional threshold value of 0.5.
To date, reference values of WHtR in adults of different age groups according to sex are available from Columbia.55 Here, WHtR values in all percentiles are higher in women in all age groups compared to men. When the WHtR conventional cut-off point was assessed, the value 0.5 was registered in the 50th percentile of men aged 40–45 years and women aged 35–40 years. In contrast, our study identified values close to cut-offs in younger age group for men ≥35–39 years, but in older age in women ≥45–49 years. For the US-population, the 50th percentiles in the age group 18–44 years were comparable with men of our sample aged 35–39 years (0.51 vs 0.52) and with women aged 40–44 years (0.49 vs 0.49),56 although 45–64-year-old US adults had lower 50th percentiles (0.56 in men and 0.57 in women) compared to our study population. Mean values of WHtR for different European countries are available through the DECODE study,57 but the majority of them are not comparable with our results due to the younger age of participants in DECODE. In Turkey, the mean WHtR is higher in both women (0.58) and men (0.56) of the mean age 52.7–53.2 years compared to our study.
When we assessed the prevalence of obesity according to the WHtR cut-off value 0.5, we found that 75% of the study population of both sexes were obese. In Columbia, the prevalence values are comparable with those of females of our population, while Russian males had lower WHtR obesity prevalence.55 Data from Portugal and the United Kingdom demonstrate lower prevalence of obesity according to WHtR with prevalence of WHtR >0.5 41.1% and 71% in adults, respectively.15,58 While the US and Nepal exhibits higher WHtR-based obesity prevalence of 82.7% in adults aged ≥20 years and 85.95% in adults aged 40–69 years, accordingly.
As fat frequently accumulates in the abdominal region as people age, WHtR is positively associated with age.55 We found that WHtR increased in the age group 50–59 years, with maximum WHtR gains of P50, P75 and P90 in women. WHtR in women aged ≥60 years was higher compared to men.
As expected, there were differences between sexes in socio-economic factors in the current study since we previously identified similar results when comparing obesity according to BMI and WHR.8 All socio-economic factors (except place of residence) had different gender strength of association with WHtR, suggesting that context-specific approaches may be needed to prevent and treat obesity.
Abdominal obesity increases the risk of metabolic disorders and CVDs. WHtR has proven superior in identifying obesity-related metabolic abnormalities and as a prognostic tool for CVD development compared to other obesity indices.15,35,37–39,59 According to our previous data, in women, WHtR had the closest associations with hypertension and with a combination of at least two of three analyzed cardiometabolic disorders (hypertension, diabetes, and hypercholesterolemia), compared with BMI, WC, WHR, and also with body fat percentage and fat mass index, which were assessed using biological impedance analysis. In men, WHtR was non-inferior to the other indices in terms of associations with the three cardiometabolic disorders.44
WHtR is divided to the following categories according to degree of risk to health: “no increased risk” (WHtR <0.5), “increased risk” (WHtR ≥0.5 and <0.6) and “very high risk” (WHtR ≥0.6).15,60 Thus, 75% of the study population could be classified as at “increased risk”, while 25% of them could be classified as at “very high risk”. Several recent prospective studies describe a positive association of higher WHtR with an increased risk of CVD and all-cause mortality in adults and increased cardiometabolic risk in children and adolescents.61–64
Among all studied CVD risk factors, hsCRP had the closest association with WHtR. Inflammatory dysregulation is one of the central tenets of the theory of adiposopathy.65,66 The inflammation, underlying adiposopathy, occurs earlier than the obesity-related cardiometabolic consequences, usually considered within the metabolic syndrome definition (hypertension, diabetes, and dyslipidemia). This leads to a closer relationship between obesity and inflammation, than between obesity and cardiometabolic disorders or CVD. According to the 20-year follow-up STANISLAS study, childhood adiposity status assessed by BMI and WHtR was significantly associated with increased carotid intima thickness, but this association was attenuated to non-significance when CRP was included as a covariate.67 This suggests inflammatory pathways could be a key factor underlying the associations between adiposity in childhood and adult atherosclerosis.67
According to prior research, using WHtR with a threshold of 0.5 for assessing abdominal obesity gives a substantially higher abdominal obesity prevalence, compared to estimates based on other indices.8,42,44 On the other hand, this simple approach has an advantage of early detection of increased risks of cardiometabolic disorders and CVD. This allows early preventive measures.15,21,44 In 2022, the National Institute for Health and Care Excellence of the United Kingdom recommended to use WHtR, but not other indices, for assessing abdominal obesity in adults in addition to BMI.68 As Russia is a country with high CVD mortality, using WHtR of 0.5 for assessing abdominal obesity by health professionals could be beneficial for improving early risk detection.15,35,39,68,69
Our study has several strengths. Similar studies of WHtR have not been previously reported in Russian adults. We applied a large population-based sample with assessment of different age groups and sexes for adults aged 35–69 years from two Russian cities. Furthermore, a wide range of analyzed CVD risk factors allowed us to assess their associations with WHtR and to determine differences in associations according to sex.
Limitations include the cross-sectional study design as it restricted our ability to assess causal relations between WHtR and the studied covariates. Self-reported information (eg, socioeconomic, psychological, lifestyle factors, and medication use) could contribute to information bias. The period of fasting before blood collection was minimum four hours, and for this reason, we could not include the level of triglycerides in the analysis. The relatively low and varying response rates in Arkhangelsk (68%) in Novosibirsk (41%) could be a source of selection bias, although the distributions of participants by education were similar to those of Arkhangelsk, Novosibirsk, and the entire Russian urban population aged 35–69 years according to the 2010 Russian census.46 Furthermore, findings in our urban population study of limited age range may not be generalizable to the whole country with substantial rural component and the full age spectrum. Finally, the study was conducted prior to the COVID-19 pandemic. The COVID-19 pandemic could have led to an increase in the prevalence of obesity and corresponding changes in population values of WHtR in Russia.70
Further population studies of WHtR should cover populations of other ages, including children, young adults, and the elderly. Prospective studies are needed to assess the value of WHtR in predicting CVD and other health outcomes in the Russian population.
Conclusion
This is the first study to provide sex- and age-specific reference values for WHtR in Russian adults aged 35–69 years. Three-quarters of the study population had WHtR values exceeding the conventional threshold for abdominal obesity. There were between-sex differences in WHtR associations with socio-demographic and lifestyle CVD risk factors, biomarkers of inflammation, hypertension, dyslipidemia, and diabetes. We therefore recommend WHtR in clinical practice as a useful cardiovascular risk indicator.
Data Sharing Statement
Researchers may apply for access to KYH data. See data access regulations and instructions at https://metadata.knowyourheart.science (accessed on 28 February 2025). All data requests will be guided by the protection of personal information, the confidentiality agreement with the participants and participants’ informed consent.
Ethical Approval
The authors declare that all procedures that contributed to this work comply with the ethical standards of the Declaration of Helsinki. All participants signed an informed consent form. Ethical approval for the study was received from the ethics committees of the London School of Hygiene and Tropical Medicine (approval number 8808), Novosibirsk State Medical University (approval number 75; 21 May 2015), the Institute of Preventative Medicine, Novosibirsk (approval received 26 December 2014), and the Northern State Medical University, Arkhangelsk (approval number 01/01–15; 27 January 2015).
Acknowledgments
The authors would like to acknowledge the participants and personnel of the KYH study for their contributions in terms of time and effort.
Author Contributions
All authors made a significant contribution to the work reported, whether that is in the conception, study design, execution, acquisition of data, analysis and interpretation, or in all these areas; took part in drafting, revising or critically reviewing the article; gave final approval of the version to be published; have agreed on the journal to which the article has been submitted; and agreed to be accountable for all aspects of the work.
Funding
The KYH study was part of the International Project on Cardiovascular Disease in Russia (IPCDR). It was funded by the Wellcome Trust Strategic Award (100217), UiT The Arctic University of Norway, the Norwegian Institute of Public Health, and the Norwegian Ministry of Health and Social Affairs. SM and EA are supported by the Russian Academy of Science, State Target (grant number: # FWNR-2024-0002).
Disclosure
Sarah Cook reports grants from NIHR, outside the submitted work. The authors declare no other conflicts of interest.
References
1. World Health Organization. Obesity and overweight. Available from: https://www.who.int/news-room/fact-sheets/detail/obesity-and-overweight.
2. Powell-Wiley TM, Poirier P, Burke LE, et al. Obesity and cardiovascular disease: a scientific statement from the American heart association. Circulation. 2021;143(21):e984–e1010. doi:10.1161/CIR.0000000000000973
3. Visseren FLJ, Mach F, Smulders YM, et al. 2021 ESC guidelines on cardiovascular disease prevention in clinical practice. Eur Heart J. 2021;42(34):3227–3337. doi:10.1093/eurheartj/ehab484
4. Federal State Statistics Service. Russia in numbers. Rosstat. 2020:550.
5. Global Cardiovascular Risk C. Global effect of modifiable risk factors on cardiovascular disease and mortality. N Engl J Med. 2023;389(14):1273–1285. doi:10.1056/NEJMoa2206916
6. World Health Organization. WHO European regional obesity report 2022. 2022:208.
7. Collaboration NCDRF. Worldwide trends in underweight and obesity from 1990 to 2022: a pooled analysis of 3663 population-representative studies with 222 million children, adolescents, and adults. Lancet. 2024;403(10431):1027–1050. doi:10.1016/S0140-6736(23)02750-2
8. Kholmatova K, Krettek A, Leon DA, et al. Obesity prevalence and associated socio-demographic characteristics and health behaviors in Russia and Norway. Int J Environ Res Public Health. 2022;19(15). doi:10.3390/ijerph19159428
9. Cook S, Solbu MD, Eggen AE, et al. Comparing prevalence of chronic kidney disease and its risk factors between population-based surveys in Russia and Norway. BMC Nephrol. 2022;23(1):145. doi:10.1186/s12882-022-02738-2
10. Iakunchykova O, Averina M, Wilsgaard T, et al. What factors explain the much higher diabetes prevalence in Russia compared with Norway? Major sex differences in the contribution of adiposity. BMJ Open Diabetes Res Care. 2021;9(1):e002021. doi:10.1136/bmjdrc-2020-002021
11. Hageman S, Pennells L, Ojeda F. Group Sw, collaboration ESCCr. SCORE2 risk prediction algorithms: new models to estimate 10-year risk of cardiovascular disease in Europe. Eur Heart J. 2021;42(25):2439–2454. doi:10.1093/eurheartj/ehab309
12. Lechner K, von Schacky C, McKenzie AL, et al. Lifestyle factors and high-risk atherosclerosis: pathways and mechanisms beyond traditional risk factors. Eur J Prev Cardiol. 2020;27(4):394–406. doi:10.1177/2047487319869400
13. Tillmann T, Lall K, Dukes O, et al. Development and validation of two SCORE-based cardiovascular risk prediction models for Eastern Europe: a multicohort study. Eur Heart J. 2020;41(35):3325–3333. doi:10.1093/eurheartj/ehaa571
14. Rao G, Powell-Wiley TM, Ancheta I, et al. Identification of obesity and cardiovascular risk in ethnically and racially diverse populations: a scientific statement From the American heart association. Circulation. 2015;132(5):457–472. doi:10.1161/CIR.0000000000000223
15. Ashwell M, Gibson S. Waist-to-height ratio as an indicator of ‘early health risk’: simpler and more predictive than using a ‘matrix’ based on BMI and waist circumference. BMJ Open. 2016;6(3):e010159. doi:10.1136/bmjopen-2015-010159
16. Kivimaki M, Strandberg T, Pentti J, et al. Body-mass index and risk of obesity-related complex multimorbidity: an observational multicohort study. Lancet Diabetes Endocrinol. 2022;10(4):253–263. doi:10.1016/S2213-8587(22)00033-X
17. Dobrowolski P, Prejbisz A, Kurylowicz A, et al. Metabolic syndrome - a new definition and management guidelines: a joint position paper by the polish society of hypertension, polish society for the treatment of obesity, polish lipid association, polish association for study of liver, polish society of family medicine, polish society of lifestyle medicine, division of prevention and epidemiology polish cardiac society, “Club 30. Polish Cardiac Society Division Metabol Bariatric Surg Soc Polish Surg Arch Med Sci. 2022;18(5):1133–1156. doi:10.5114/aoms/152921
18. Rymar OD, Shcherbakova LV, Nikitenko TM, Bobak M, Malyutina SK, Simonova G.I. MSV. Metabolic syndrome and risk of cardiovascular and total mortality: data from a 14-year prospective cohort study in Siberia. Rossijskij Kardiologicheskij Zhurnal. 2020;25(6):86–94. doi:10.15829/1560-4071-2020-3821
19. Saltiel AR, Olefsky JM. Inflammatory mechanisms linking obesity and metabolic disease. J Clin Invest. 2017;127(1):1–4. doi:10.1172/JCI92035
20. World Health Organization. Waist Circumference and Waist-Hip Ratio. Report of a WHO Expert Consultation. 2008:8–11.
21. Schneider HJ, Klotsche J, Silber S, Stalla GK, Wittchen HU. Measuring abdominal obesity: effects of height on distribution of cardiometabolic risk factors risk using waist circumference and waist-to-height ratio. Diabetes Care. 2011;34(1):e7. doi:10.2337/dc10-1794
22. Bajpai A. Waist-to-height ratio-time for a new obesity metric? Indian J Pediatr. 2022;89(6):534–535. doi:10.1007/s12098-022-04173-5
23. Yoo EG. Waist-to-height ratio as a screening tool for obesity and cardiometabolic risk. Korean J Pediatr. 2016;59(11):425–431. doi:10.3345/kjp.2016.59.11.425
24. Tchernof A, Despres JP. Pathophysiology of human visceral obesity: an update. Physiol Rev. 2013;93(1):359–404. doi:10.1152/physrev.00033.2011
25. Brel NKKAN, Gruzdeva OV. Advantages and disadvantages of different methods for diagnosis of visceral obesity. Obesity Metabol. 2018;15(4):3–8. doi:10.14341/OMET9510
26. Perona JS, Schmidt Rio-Valle J, Ramirez-Velez R, Correa-Rodriguez M, Fernandez-Aparicio A, Gonzalez-Jimenez E. Waist circumference and abdominal volume index are the strongest anthropometric discriminators of metabolic syndrome in Spanish adolescents. Eur J Clin Invest. 2019;49(3):e13060. doi:10.1111/eci.13060
27. Park Y, Kim NH, Kwon TY, Kim SG. A novel adiposity index as an integrated predictor of cardiometabolic disease morbidity and mortality. Sci Rep. 2018;8(1):16753. doi:10.1038/s41598-018-35073-4
28. Tian T, Zhang J, Zhu Q, Xie W, Wang Y, Dai Y. Predicting value of five anthropometric measures in metabolic syndrome among Jiangsu Province, China. BMC Public Health. 2020;20(1):1317. doi:10.1186/s12889-020-09423-9
29. Bergman RN. A better index of body adiposity. Obesity. 2012;20(6):1135. doi:10.1038/oby.2012.99
30. Bennasar-Veny M, Lopez-Gonzalez AA, Tauler P, et al. Body adiposity index and cardiovascular health risk factors in caucasians: a comparison with the body mass index and others. PLoS One. 2013;8(5):e63999. doi:10.1371/journal.pone.0063999
31. Krakauer NY, Krakauer JC. An anthropometric risk index based on combining height, weight, waist, and hip measurements. J Obes. 2016;2016:8094275. doi:10.1155/2016/8094275
32. Baggerman MR, Dekker IM, Winkens B, Olde Damink SWM, Weijs PJM, van de Poll M. Computed tomography reference values for visceral obesity and increased metabolic risk in a Caucasian cohort. Clin Nutr ESPEN. 2022;48:408–413. doi:10.1016/j.clnesp.2022.01.009
33. Mitra S, Fernandez-Del-Valle M, Hill JE. The role of MRI in understanding the underlying mechanisms in obesity associated diseases. Biochim Biophys Acta Mol Basis Dis. 2017;1863(5):1115–1131. doi:10.1016/j.bbadis.2016.09.008
34. Volgyi E, Tylavsky FA, Lyytikainen A, Suominen H, Alen M, Cheng S. Assessing body composition with DXA and bioimpedance: effects of obesity, physical activity, and age. Obesity. 2008;16(3):700–705. doi:10.1038/oby.2007.94
35. Kang SH, Cho KH, Park JW, Do JY. Comparison of waist to height ratio and body indices for prediction of metabolic disturbances in the Korean population: the Korean National Health and Nutrition Examination Survey 2008-2011. BMC Endocr Disord. 2015;15:79. doi:10.1186/s12902-015-0075-5
36. Li WC, Chen IC, Chang YC, Loke SS, Wang SH, Hsiao KY. Waist-to-height ratio, waist circumference, and body mass index as indices of cardiometabolic risk among 36,642 Taiwanese adults. Eur J Nutr. 2013;52(1):57–65. doi:10.1007/s00394-011-0286-0
37. Caminha TC, Ferreira HS, Costa NS, et al. Waist-to-height ratio is the best anthropometric predictor of hypertension: a population-based study with women from a state of northeast of Brazil. Medicine. 2017;96(2):e5874. doi:10.1097/MD.0000000000005874
38. Savva SC, Lamnisos D, Kafatos AG. Predicting cardiometabolic risk: waist-to-height ratio or BMI. A meta-analysis. Diabetes Metab Syndr Obes. 2013;6:403–419. doi:10.2147/DMSO.S34220
39. Browning LM, Hsieh SD, Ashwell M. A systematic review of waist-to-height ratio as a screening tool for the prediction of cardiovascular disease and diabetes: 0.5 could be a suitable global boundary value. Nutr Res Rev. 2010;23(2):247–269. doi:10.1017/S0954422410000144
40. Correa MM, Facchini LA, Thume E, Oliveira ERA, Tomasi E. The ability of waist-to-height ratio to identify health risk. Rev Saude Publica. 2019;53:66. doi:10.11606/s1518-8787.2019053000895
41. Kontsevaya A, Shalnova S, Deev A, et al. Overweight and obesity in the Russian population: prevalence in adults and association with socioeconomic parameters and cardiovascular risk factors. Obes Facts. 2019;12(1):103–114. doi:10.1159/000493885
42. Zhernakova YV, Zheleznova EA, Chazova IE, et al. The prevalence of abdominal obesity and the association with socioeconomic status in regions of the Russian federation, the results of the epidemiological study - ESSE-RF. Ter Arkh. 2018;90(10):14–22. doi:10.26442/terarkh2018901014-22
43. Mustafina SV, Rymar OD, Shcherbakova LV, et al. The risk of type 2 diabetes mellitus in a Russian population cohort according to data from the HAPIEE project. J Pers Med. 2021;11(2). doi:10.3390/jpm11020119
44. Kholmatova K, Krettek A, Dvoryashina IV, Malyutina S, Kudryavtsev AV. Assessing the prevalence of obesity in a Russian adult population by six indices and their associations with hypertension, diabetes mellitus and hypercholesterolaemia. Int J Circumpolar Health. 2024;83(1):2386783. doi:10.1080/22423982.2024.2386783
45. Peng Y, Li W, Wang Y, Bo J, Chen H. The cut-off point and boundary values of waist-to-height ratio as an indicator for cardiovascular risk factors in Chinese adults from the PURE Study. PLoS One. 2015;10(12):e0144539. doi:10.1371/journal.pone.0144539
46. SMS C, Kudryavtsev AV, Averina M, et al. Know your heart: rationale, design and conduct of a cross-sectional study of cardiovascular structure, function and risk factors in 4500 men and women aged 35-69 years from two Russian cities, 2015-18. Wellcome Open Res. 2018;3(67). doi:10.12688/wellcomeopenres.14619.3
47. Toft U, Kristoffersen LH, Lau C, Borch-Johnsen K, Jorgensen T. The dietary quality score: validation and association with cardiovascular risk factors: the Inter99 study. Eur J Clin Nutr. 2007;61(2):270–278. doi:10.1038/sj.ejcn.1602503
48. Cust AE, Smith BJ, Chau J, et al. Validity and repeatability of the EPIC physical activity questionnaire: a validation study using accelerometers as an objective measure. Int J Behav Nutr Phys Act. 2008;5:33. doi:10.1186/1479-5868-5-33
49. Wareham NJ, Jakes RW, Rennie KL, et al. Validity and repeatability of a simple index derived from the short physical activity questionnaire used in the European prospective investigation into cancer and nutrition (EPIC) study. Public Health Nutr. 2003;6(4):407–413. doi:10.1079/PHN2002439
50. Saunders JB, Aasland OG, Babor TF, de la Fuente JR, Grant M. Development of the Alcohol Use Disorders Identification Test (AUDIT): WHO collaborative project on early detection of persons with harmful alcohol consumption--II. Addiction. 1993;88(6):791–804. doi:10.1111/j.1360-0443.1993.tb02093.x
51. Kroenke K, Spitzer RL, Williams JB. The PHQ-9: validity of a brief depression severity measure. J Gen Intern Med. 2001;16(9):606–613. doi:10.1046/j.1525-1497.2001.016009606.x
52. Spitzer RL, Kroenke K, Williams JB, Lowe B. A brief measure for assessing generalized anxiety disorder: the GAD-7. Arch Intern Med. 2006;166(10):1092–1097. doi:10.1001/archinte.166.10.1092
53. ATC; WHOCC. WHOCC—ATC/DDD Index. Available from: https://www.whocc.no/atc_ddd_index/.
54. WHO. WHO collaborating centre for drug statistics methodology. Available from: https://www.whocc.no/.
55. Ramirez-Velez R, Correa-Bautista JE, Martinez-Torres J, et al. LMS tables for waist circumference and waist-height ratio in Colombian adults: analysis of nationwide data 2010. Eur J Clin Nutr. 2016;70(10):1189–1196. doi:10.1038/ejcn.2016.46
56. Kahn HS, Bullard KM, Barker LE, Imperatore G. Differences between adiposity indicators for predicting all-cause mortality in a representative sample of United States non-elderly adults. PLoS One. 2012;7(11):e50428. doi:10.1371/journal.pone.0050428
57. Song X, Tabak AG, Zethelius B, et al. Obesity attenuates gender differences in cardiovascular mortality. Cardiovasc Diabetol. 2014;13:144. doi:10.1186/s12933-014-0144-5
58. Kowalkowska J, Poinhos R, Franchini B, et al. General and abdominal adiposity in a representative sample of Portuguese adults: dependency of measures and socio-demographic factors’ influence - CORRIGENDUM. Br J Nutr. 2016;115(2):377. doi:10.1017/S0007114515004808
59. Lee CM, Huxley RR, Wildman RP, Woodward M. Indices of abdominal obesity are better discriminators of cardiovascular risk factors than BMI: a meta-analysis. J Clin Epidemiol. 2008;61(7):646–653. doi:10.1016/j.jclinepi.2007.08.012
60. Shrestha R, Upadhyay SK, Khatri B, Bhattarai JR, Kayastha M, Upadhyay MP. BMI, waist to height ratio and waist circumference as a screening tool for hypertension in hospital outpatients: a cross-sectional, non-inferiority study. BMJ Open. 2021;11(11):e050096. doi:10.1136/bmjopen-2021-050096
61. Feng Q, Besevic J, Conroy M, et al. Waist-to-height ratio and body fat percentage as risk factors for ischemic cardiovascular disease: a prospective cohort study from UK Biobank. Am J Clin Nutr. 2024;119(6):1386–1396. doi:10.1016/j.ajcnut.2024.03.018
62. Abdi Dezfouli R, Mohammadian Khonsari N, Hosseinpour A, Asadi S, Ejtahed HS, Qorbani M. Waist to height ratio as a simple tool for predicting mortality: a systematic review and meta-analysis. Int J Obes Lond. 2023;47(12):1286–1301. doi:10.1038/s41366-023-01388-0
63. Wang P, Zhao Y, Wang D, et al. Relationship between waist-to-height ratio and heart failure outcome: a single-centre prospective cohort study. ESC Heart Fail. 2025;12(1):290–303. doi:10.1002/ehf2.15029
64. Zong X, Kelishadi R, Kim HS, et al. Utility of waist-to-height ratio, waist circumference and body mass index in predicting clustered cardiometabolic risk factors and subclinical vascular phenotypes in children and adolescents: a pooled analysis of individual data from 14 countries. Diabetes Metab Syndr. 2024;18(5):103042. doi:10.1016/j.dsx.2024.103042
65. Neeland IJ, Poirier P, Despres JP. Cardiovascular and metabolic heterogeneity of obesity: clinical challenges and implications for management. Circulation. 2018;137(13):1391–1406. doi:10.1161/CIRCULATIONAHA.117.029617
66. Artemniak-Wojtowicz D, Kucharska AM, Pyrzak B. Obesity and chronic inflammation crosslinking. Cent Eur J Immunol. 2020;45(4):461–468. doi:10.5114/ceji.2020.103418
67. Fujikawa T, Kobayashi M, Wagner S, et al. Associations of childhood adiposity with adult intima-media thickness and inflammation: a 20-year longitudinal population-based cohort. J Hypertens. 2023;41(3):402–410. doi:10.1097/HJH.0000000000003343
68. National Institute for Health and Care Excellence. Obesity: identification, assessment and management. Available from: www.nice.org.uk/guidance/cg189.
69. Lo K, Wong M, Khalechelvam P, Tam W. Waist-to-height ratio, body mass index and waist circumference for screening paediatric cardio-metabolic risk factors: a meta-analysis. Obes Rev. 2016;17(12):1258–1275. doi:10.1111/obr.12456
70. Nour TY, Altintas KH. Effect of the COVID-19 pandemic on obesity and it is risk factors: a systematic review. BMC Public Health. 2023;23(1):1018. doi:10.1186/s12889-023-15833-2
 © 2025 The Author(s). This work is published and licensed by Dove Medical Press Limited. The
full terms of this license are available at https://www.dovepress.com/terms
and incorporate the Creative Commons Attribution
- Non Commercial (unported, 4.0) License.
By accessing the work you hereby accept the Terms. Non-commercial uses of the work are permitted
without any further permission from Dove Medical Press Limited, provided the work is properly
attributed. For permission for commercial use of this work, please see paragraphs 4.2 and 5 of our Terms.
© 2025 The Author(s). This work is published and licensed by Dove Medical Press Limited. The
full terms of this license are available at https://www.dovepress.com/terms
and incorporate the Creative Commons Attribution
- Non Commercial (unported, 4.0) License.
By accessing the work you hereby accept the Terms. Non-commercial uses of the work are permitted
without any further permission from Dove Medical Press Limited, provided the work is properly
attributed. For permission for commercial use of this work, please see paragraphs 4.2 and 5 of our Terms.