Back to Journals » Drug Design, Development and Therapy » Volume 15
Volumetric Absorptive Microsampling as a New Biosampling Tool for Monitoring of Tamoxifen, Endoxifen, 4-OH Tamoxifen and N-Desmethyltamoxifen in Breast Cancer Patients
Authors Maggadani BP, Harmita, Haryono SJ ![]() , Rinaldi MR, Harahap Y
, Rinaldi MR, Harahap Y ![]()
Received 14 December 2020
Accepted for publication 14 April 2021
Published 4 June 2021 Volume 2021:15 Pages 2417—2430
DOI https://doi.org/10.2147/DDDT.S286409
Checked for plagiarism Yes
Review by Single anonymous peer review
Peer reviewer comments 3
Editor who approved publication: Dr Qiongyu Guo
Baitha Palanggatan Maggadani,1 Harmita,1 Samuel J Haryono,2 Marcellino Ryan Rinaldi,1 Yahdiana Harahap1
1Faculty of Pharmacy, Universitas Indonesia, Depok, 16424, Indonesia; 2Surgical Oncology Division, MRCCC Siloam Hospital, Jakarta, Indonesia
Correspondence: Yahdiana Harahap
Faculty of Pharmacy. Universitas Indonesia, Depok, 16424, Indonesia
Tel +62-21-7270031
Fax +62-21-7863433
Email [email protected]
Introduction: In this research, we used a volumetric absorptive microsampling (VAMS) technique to collect blood samples from the patients. A rapid and simple sample preparation method and LC-MS.MS assay was then developed and validated for the simultaneous analysis of tamoxifen and its three active metabolites.
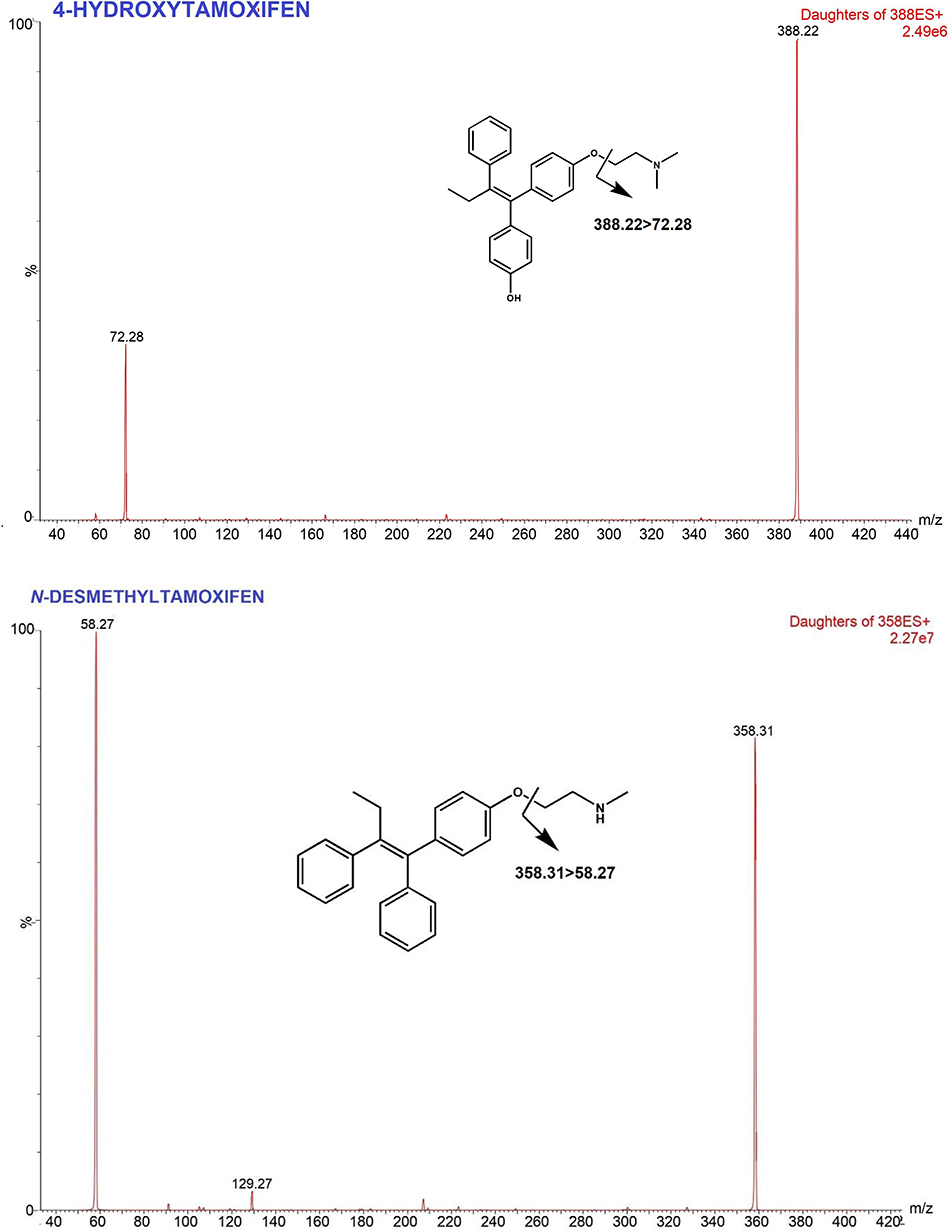
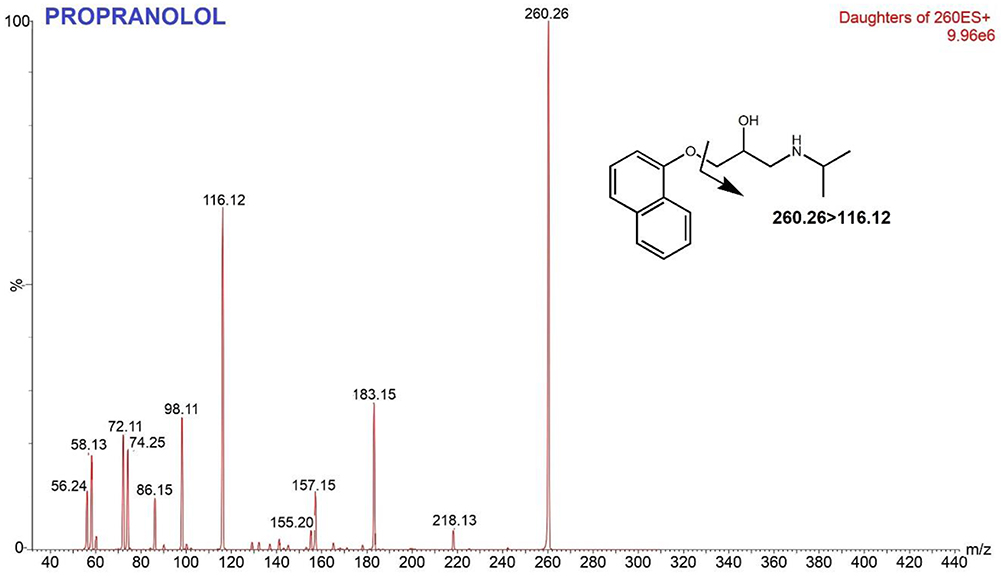
Methods: VAMS extraction was performed in methanol by sonication-assisted extraction method for 25 min after 2 hof VAMS drying. Separation was carried out using Acquity UPLC BEH C18 column (2.1 x 100 mm; 1.7 μm), with a flow rate of 0.2 mL/min, and the mobile phase gradient of formic acid 0.1% and formic acid 0.1% in acetonitrile for 5 min. The multiple reaction monitoring (MRM) values were set at m/z 358.31> 58.27 for N-desmethyltamoxifen, m/z 372.33> 72.28 for tamoxifen, m/z 388.22> 72.28 for 4-hydroxytamoxifen, m/z 374.25> 58.25 for endoxifen, and m/z 260.26> 116.12 for propranolol.
Results and Discussion: The lower limit of quantification value (LLOQ) was 2.50 ng/mL for tamoxifen, 2.50 ng/mL for endoxifen, 1.50 ng/mL for 4-hydroxitamoxifen, and 2.00 ng/mL for N-desmethyltamoxifen. Accuracy (%bias) and precision (%CV) were within 20% for LLOQ and 15% for other concentrations. There were no interference responses > 20% of the LLOQ and 5% of the internal standard. The level of ion suppression in all analytes was less than 7%. The preparation system developed in this study successfully extracted more than 90% of analytes from the matrix with precision below 15%. Carryover was shown to be below 6% in all analytes. Stability of analytes in VAMS was demonstrated for up to 30 days, under room temperature storage in a sealed plastic bag with desiccant. This method was successfully applied to analyze tamoxifen and the metabolites level in 30 ER+ breast cancer patients.
Keywords: UPLC-MSMS, validation, method development, VAMS, estrogen receptor
Introduction
Tamoxifen (TAM) is a selective estrogen receptor modulator (SERM). TAM binds to estrogen receptors (ER), thereby inhibiting ER transcriptional activity and inhibiting tumor growth. TAM is commonly used for the treatment of premenopausal women with hormone receptor-positive breast cancer, as sequential treatment in post-menopausal women and also as chemoprevention to reduce the risk of developing breast cancer in women.1–3 TAM is a prodrug that undergoes extensive hepatic metabolism Phase 1 to form at least 22 metabolites.4,5 TAM is metabolized by cytochrome P450 into its more active metabolites with different affinities for estrogen receptors.6 The main metabolites of TAM, N-desmethyltamoxifen (NDT), 4-hydroxytamoxifen (4HT) and endoxifen (END), are considered 30–100 times more potent than TAM itself.7 Among them, END is the most important metabolite in pharmacological effects because END shows higher steady-state concentration in serum.8 Figure 1 Continued. Figure 1 Continued. Figure 1 Mass spectra and fragmentation pathways of tamoxifen, endoxifen, 4-hydroxytamoxifen, N-desmethyltamoxifen and propranolol.
Based on previous studies, the effectiveness of tamoxifen therapy in breast cancer patients depends on the concentration of endoxifen, where patients with endoxifen levels in serum above 5.9 ng/mL had a smaller risk of recurrence than patients with endoxifen level below this point.9,10 However, the metabolism of TAM to END depends on the CYP2D6 genetic polymorphism status.7,11–13 CYP2D6 is highly polymorphic with more than 100 variant alleles, resulting in four phenotypes, Ultra-rapid Metabolizer (UM), Extensive Metabolizer (EM), Intermediate Metabolizer (IM), and Poor Metabolizer (PM). This polymorphism leads to a disparity in patient response to TAM therapy, thus contributing to different outcomes.7,14,15 Therefore, it is necessary to measure the blood level of TAM and its metabolites to ensure that patients maintain END levels beyond threshold.
Analysis of TAM and its metabolites has been carried out in several studies, using dried blood samples5,16–18 and plasma and serum samples.4,8,19–21 However, in general, analysis using plasma samples and dried blood spot samples (DBS) has several drawbacks, i.e. larger sample volumes are required for plasma use and the sampling technique is invasive. For DBS samples, there are problems for hematocrit effects and homogeneity. Therefore, an analytical method called volumetric absorptive microsampling (VAMS) is being developed. When compared with plasma sampling, the VAMS method has several advantages, for example the volume of samples needed is reduced, the sampling process and sample preparation are simpler, shipping costs are reduced, and room temperature is allowed. When compared with DBS, sample volumes that were taken by the VAMS method produce more stable and homogeneous samples, in addition this method overcomes the problem of hematocrit effects.22–25
No studies of development and validation of an analysis method for TAM had been carried out using the VAMS method. Therefore, this study was conducted to obtain optimum and validated chromatographic and separation conditions for the analysis of TAM and its metabolites, such as END, 4HT and NDT. The validation of the analytical method was carried out based on the 2011 EMA guidelines26 and FDA bioanalysis method validation guidelines in 2018.27 The results of the development and validation of this bioanalysis method are expected to be applied for monitoring TAM therapy in breast cancer patients.
Materials and Methods
Chemical Reagents and Materials
Tamoxifen, (Z)-Endoxifen, and Propranolol Hydrochloride were purchased from Sigma-Aldrich. (Z)-4-Hydroxytamoxifen and N-desmethyltamoxifen were purchased from Santa Cruz Biotechnology. Acetonitrile HPLC grade, Formic acid as eluent and methanol HPLC grade were obtained from Merck. VAMS Mitra® tips was purchased from Mitra Neoteryx, USA.
Stock Solutions, Calibration and Quality Control Samples Preparation
NDT, TAM, END and 4HT stock solution in methanol were prepared to obtain a concentration of 1000 ng/mL. The stock solution of NDT and TAM were diluted to obtain 100 ng/mL intermediate solution, while END and 4HT were diluted to 10 ng/mL. Propranolol (PRO) as internal standard, stock solution of 1000 ng/mL was prepared by diluting in methanol. Calibration samples were prepared by diluting the working solution with whole blood to achieve a calibration set. Quality control (QC) solutions in whole blood NDT were prepared for low (QCL), med (QCM), and high (QCH) at 6; 250; and 500 ng/mL, TAM 7.50; 60; and 150 ng/mL, END 7.5; 18; and 25 ng/mL, 4HT 4.5; 15; and 25 ng/mL, respectively.
Sample Preparation
VAMS samples were prepared by immersing the Mitra® tip in the spiked whole blood and dried for 2 h. Mitra® tips were removed and put in a micro tube. Extraction was done by adding 100 ng/mL PRO in methanol. The mixture was vortexed for 1 min. Extraction was carried out by sonication for 25 min. The mixture was pipetted as much as 850 μL and dried in a water bath at 55°C under nitrogen stream. Dried extract was reconstituted in 100 μL mobile phase. The mixture was homogenized with 20 s vortex. 70 μL of the supernatant was transferred to an auto sampler vial and 10 μL of supernatant was injected onto the UPLC-MS/MS system.
UPLC-MS/MS Equipment and Conditions
Analysis system was using Waters Xevo TQD Triple Quadrupole, separation was performed using Acquity UPLC C18 BEH column (2.1 x 100 mm; 1.7 μm), controlled by MassLynx Software from Waters (Milford, USA). The mobile phase consisted of 0.1% formic acid (eluent A) and 0.1% formic acid in acetonitrile (eluent B) at flow rate of 0.2 mL/min. The initial composition of eluent was 5% A which was maintained for 3 min, followed by increasing its composition to 70% A for the next 2 min. Total analytical time was 5 min. The parameters of MS condition were optimized as follows: capillary voltage +3500 V; nitrogen temperature 450°C and the flow rate at 700 L/h. Argon was used as the collision gas: ionization using ESI positive mode with m/z values: 358.31>58.27 for N-desmethyltamoxifen, m/z 372.33>72.28 for tamoxifen, m/z 388.22>72.28 for 4-hydroxytamoxifen, m/z 374.25>58.25 for endoxifen, and m/z 260.26>116.12 for propranolol. The MS conditions are listed in Table 1.
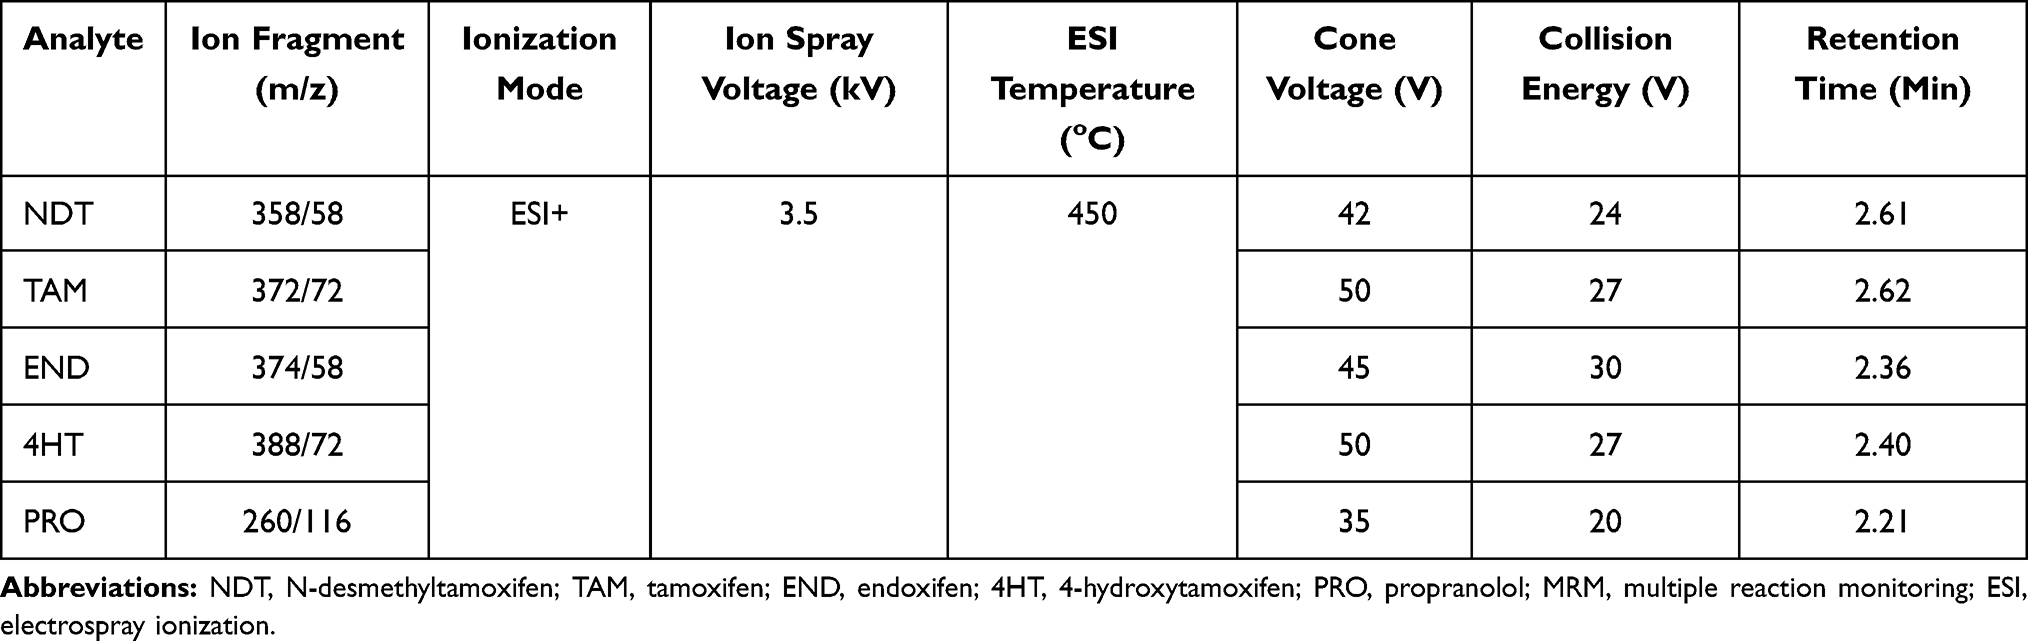 |
Table 1 MRM Transitions and MS Parameter |
Method Validation
The Lower Limit of Quantification (LLOQ)
This test aims to find the lowest concentration that can be analyzed and meet the requirements of accuracy and precision. This concentration is the lowest point in the calibration curve. To test LLOQ, NDT, TAM, END, and 4HT were tested at concentrations of 2.0; 2.5; 2.5 and 1.5 ng/mL, respectively. Quality control solution was used and this assay was performed with five replicates. The test is continued with a concentration of half that value and so on. LLOQ is selected at a concentration where the %CV and %bias do not exceed 20%
Calibration Curve
Calibration curve were prepared from fresh spiked blood samples at eight levels of concentrations containing NDT (2–600 ng/mL), TAM (2.5–200 ng/mL), END (2.5–40 ng/mL), and 4HT (1.5–30 ng/mL). Blank, zero, and calibration samples were applied to VAMS, dried at room temperature for 2 hand analyzed within 24 h. Calibration curves are determined for the area ratio of the NDT, TAM, END and 4HT peaks to the propranolol peak and the actual concentrations of the calibration samples. Linearity was examined by evaluating the calibration plots on three separate runs, assessing the coefficient of correlation (r) and the back-calculated accuracy.
Selectivity
Selectivity was assessed by spiking LLOQ solution to blood matrix, obtained from six different sources. The area was compared with blank matrix from each source to ensure no interference at the retention time of analyte and IS. Interference was allowed if the response is not exceeding 20% of LLOQ area and not more than 5% of the IS area.
Precision and Accuracy
Intra- and inter-day accuracy and precision were evaluated by measuring analyte spiked matrix at concentration LLOQ, QCL, QCM, and QCH in five replicates. Inter-day assay was performed over 3 consecutive batches (at least 2 days). The acceptance criteria established for the accuracy and precision is %CV not to exceed 15%, and 20% for LLOQ. The accuracy (%diff) should be within ± 15%, and for LLOQ ± 20%.
Recovery and Matrix Factor
Aliquots of whole blood matrix were spiked with analytes in QCL, QCM, and QCH concentrations. Recovery was evaluated by comparing the area of the pre-extracted analyte spike sample with the post-extraction spiking sample. Both assays were performed with three replicates for each concentration. Recovery does not have to be 100%, the value of % coefficient of variance (%CV) of the recovery values should be less than 15% (consistent and reproducible).
Carry Over
The carry-over is analyzed by comparing the area of the blank sample after injection of high concentration (ULOQ) of each analyte. The area that might occur on the blank sample at the retention time of the analyte should not exceed 20% of the LLOQ area.
Dilution Integrity
The standard work solutions of NDT, TAM, END, and 4HT were diluted in whole blood until the concentration was above ULOQ (2 times the concentration of QCH). Then, the solution were diluted to a half and a quarter of its concentration by using blank whole blood. The assay was performed with two replicates for each concentration. Dilution should not affect accuracy and precision with the acceptance criteria established is maximum 15% for the %CV.
Matrix Effects
ME was determined using QCL and QCH concentration, extracted from six different whole blood donors. Matrix effect is evaluated by comparing the ratio between area of spiked sample post extraction and matrix free analyte solution. IS normalized matrix factor is calculated from the comparison between the matrix effect of analytes and the IS matrix effect. The result of the matrix effect indicates the amount of ion suppression or enhancement induced by the components in the matrix. Matrix effect analysis meets the requirements if the %CV does not exceed 15%.
Stability
The stability analysis was tested using NDT, TAM, END, 4HT and internal standard propranolol stock solution which were stored at room temperature for 0, 6, and 24 h and stored at −20°C for 0 and 60 days before analysis. The %diff is compared with the response at starting point and should not be higher than 10%. The assay was performed with two replicates. The assay was also performed to observe analyte in VAMS matrix at two concentration levels: QCL and QCH which were stored at room temperature for 0, 6, and 24 h and for 0 and 30 days. The assay was performed with three replicates. Besides, the stability of analyte in the matrix that was stored in auto sampler was also tested after 0 and 24 h. All assays were performed with three replicates.
Patients and Method Application
The method using VAMS was applied to determine TAM and its metabolites including NDT, END, and 4HT in breast cancer patients. Patients inclusion criteria were female patients aged over 18 years who were diagnosed with positive estrogen-type breast cancer at all stages and received 20 mg tamoxifen therapy per day for at least 8 weeks before their blood could be drawn to ensure steady state level. This study was approved by the ethics committee of MRCCC Siloam Semanggi Jakarta and conducted according to the Declaration of Helsinki. Each participant provided informed consent and an explanation of the study and procedures. Only after the patients had agreed and signed the informed consent, blood samples were taken from the fingertips and absorbed in 20 microliters of Mitra® VAMS. The tips were dried for 2 hin Mitra® drying rack and then stored in the Mitra® clamshell and put with a desiccant until the time of analysis within 8 weeks. The sample tips to be analyzed were released from the handle and extracted using 1000 μL methanol (containing 100 ng/mL IS). The extraction procedure follows extraction of the calibration curve. 10 µL of sample extract solution was injected into UPLC-MS/MS and the levels were calculated through daily calibration curves. Quality control samples were also inserted at each analytical run to ensure data validity.
Results
Optimum UPLC-MS/MS Condition
A triple quadrupole UPLC-MS/MS with an electrospray ion source were used in this study. Protonated molecules (positive mode) were selected as precursor ions to produce product ion spectra. MRM transition was determined from the most intense ion product to provide high sensitivity and selectivity. The MS optimization was conducted via direct infusion of analyte solution into MS. The adjusted parameters were ESI temperature, cone voltages, collision energy, nebulizer and dissolution gases. In Table 1, the optimized conditions are presented for TAM and its metabolites. The capillary pipe voltage was 3.5 kV with 350°C for desolvation temperature, nebulizer was set at 20 psi and 700 L/h for the gas flow rate. The product ion spectrum is produced from protonated molecules ([M + H] +) as parent/precursor ions. The most intense ion products were selected as MRM transitions to ensure sensitive and selective analyses. The optimum mass transitions for tamoxifen and its metabolites are shown in Table 1 and proposed fragmentation pathways are presented in Figure 1.
Optimization of Chromatographic Separation
Optimum chromatographic conditions were achieved by adjusting several parameters such as composition and combination of the mobile phase, flow rate, and gradient profile. The assay was performed by comparing three combinations of mobile Phase 0.2% formic acid with 0.2% formic acid in acetonitrile; 0.1% formic acid with acetonitrile; and 0.1% formic acid with 0.1% formic acid in acetonitrile. Those combinations of mobile phase were tested under isocratic methods with a ratio of 20% aqueous phase and 80% acetonitrile as an organic phase and flow rate of 0.2 mL. A mixture of 0.1% formic acid (A) with 0.1% formic acid in acetonitrile (B) was chosen as it gave the best chromatogram compared with the other combinations. When the formic acid was added to 0.2%, the shape of the peak was broadened and split, meanwhile reducing the formic acid was also broadening the peak as low acidity leads to low protonated ion product. However, the composition of 20–80% of mobile phase B was not ideal due to the small area produced. Reducing water portion and increasing organic (5:95) led to better peak shape and ESI response. Water produced larger droplets due to its high surface tension compared with acetonitrile. Furthermore, evaporation of water is slower than organic solvent like acetonitrile. Hence, a bigger portion of water resulted in less efficiency in charged droplet disintegration and led to lower ESI response.28 Flow rate of 0.2 mL/min was also chosen as increasing the flow rate resulted in an asymmetric peak.
Optimization of Mobile Phase Gradient Elution
Isocratic elution as described above resulted in good amount of area but inconsistent repeatability. Tailing and broadened peak was also shown when repeated injections were performed. To overcome this problem, gradient elution was added at the end of isocratic elution. A linear gradient separation was used with 5–95% of mobile phase A-B from 0–3 min, then adding gradient 70–30% of mobile phase B, which was held for 2 min for re-equilibration of the system and also to wash off retained sample from previous injection. This method successfully separated analytes within 5 minwith mobile phase consumption only 1 mL per run. The chromatograms illustration of spiked blood (LLOQ) and clinical sample of TAM and metabolites extracted from VAMS are shown in Figure 2. The retention time of TAM, END, 4HT, NDT QC sample and patient sample were 2.61 and 2.59; 2.36 and 2.37; 2.37 and 2.39; 2.60 and 2.59 min, consecutively. Retention time of IS was 2.21 min.
 |
Figure 2 UPLC-MS/MS chromatograms obtained from VAMS device. (A) Blank blood extract; (B) spiked at the concentration of the LLOQ; and (C) clinical sample on steady state. |
System Suitability Test
After obtaining optimum conditions of analysis, the system suitability test was done to ensure the system works well to produce accurate data. Based on test results, the %CV of the area produced by NDT, TAM, END, 4HT, and propranolol was: 2.38%; 1.22%; 1.40%; 1.64%; and 1.65%. While %CV of the retention time produced by NDT, TAM, END, 4HT, and propranolol was: 2.51%; 2.34%; 2.51%; 2.75%; and 3.15%, respectively. Based on the results, it can be concluded that the analysis system is running well because it meets the %CV requirements for system suitability testing that do not exceed 6%.
Optimization of Sample Preparation
Optimization of sample preparation in VAMS was done by optimizing the tip drying time and sonication time. Tip drying time was tested for 60, 120 and 180 minutes. Sonication time was tested for 15, 25 and 40 min. Based on the results, drying the tips for 120 min at room temperature (20–25°C) gave the best results as it produced the biggest response. These results are similar to previous studies, where prolongation of drying time did not provide a significant increase in response while drying time shorter than 120 min gave lower response. This may indicate that the blood samples were not dried enough and were not bound adequately to card matrix. Blood samples should be completely dried before processing, storage or transportation. Drying time may vary between type of paper and volume of spotted blood, thus optimization needs to be done before analysis.
Extraction of analytes from VAMs used a simple technique with 100% methanol. In this study, the sonication time was optimized at 15, 25 and 40 min. Sonication for 25 min produces a better response and better recovery than 15 minsonication, while sonication for 40 min gave the same response as 25 min. This extraction time was faster than the previous 45-min sonication process.17 Sonication is an important step in the extraction of analytes because of its role in the release of analytes from the pores of the matrix. In a review outlined by Kok and Fillet (2017), sonication reduced bias and increased recovery in the extraction of VAMs, especially in high hematocrit.23
Method Validation
Calibration Curve
Calibrators were prepared and analyzed during 3 analytical runs. The working solution containing NDT, TAM, END, and 4HT was diluted by whole blood to achieve eight concentration levels: 2–600 ng/mL for NDT; 2.5–200 ng/mL for TAM; 2.5–40 ng/mL for END; and 1.5–30 ng/mL for 4HT. Calibration curve was measured based on the ratio of NDT, TAM, END, and 4HT area to IS area. The linear regression of the analyte/internal standard peak area ratio (PAR) versus the concentration of analytes (x) was weighted 1/x the correlation coefficient (r) was 0.9945 for NDT; 0.9955 for TAM; 0.9937 for END; and 0.9929 for 4HT. All back-calculated calibration and coefficients of variation were below 15% (20% for LLOQ).
Selectivity
Based on the results, the interference response at the retention time of NDT, TAM, END, and 4HT was 14.50%; 10.45%; 6.77%; 11.84% consecutively and the interference response at the retention time of propranolol was 0.58%. These results showed that there were no interference responses >20% of the LLOQ and 5% of the internal standard. The method was hence considered to be selective.26
Accuracy and Precision
The assay was carried out by analyzing five replicates of analyte at the concentrations of LLOQ, QCL, QCM, and QCH in three different runs. The results of the accuracy and precision assay are presented in Table 2. The accuracy (%bias) of NDT, TAM, END, and 4HT was less than ± 20% for LLOQ and ± 15% for other QC samples. The intra- and inter-assay values (% CV) were also less than ± 20% for LLOQ and ± 15% for other QC samples. These results indicate adequate repeatability of this method.
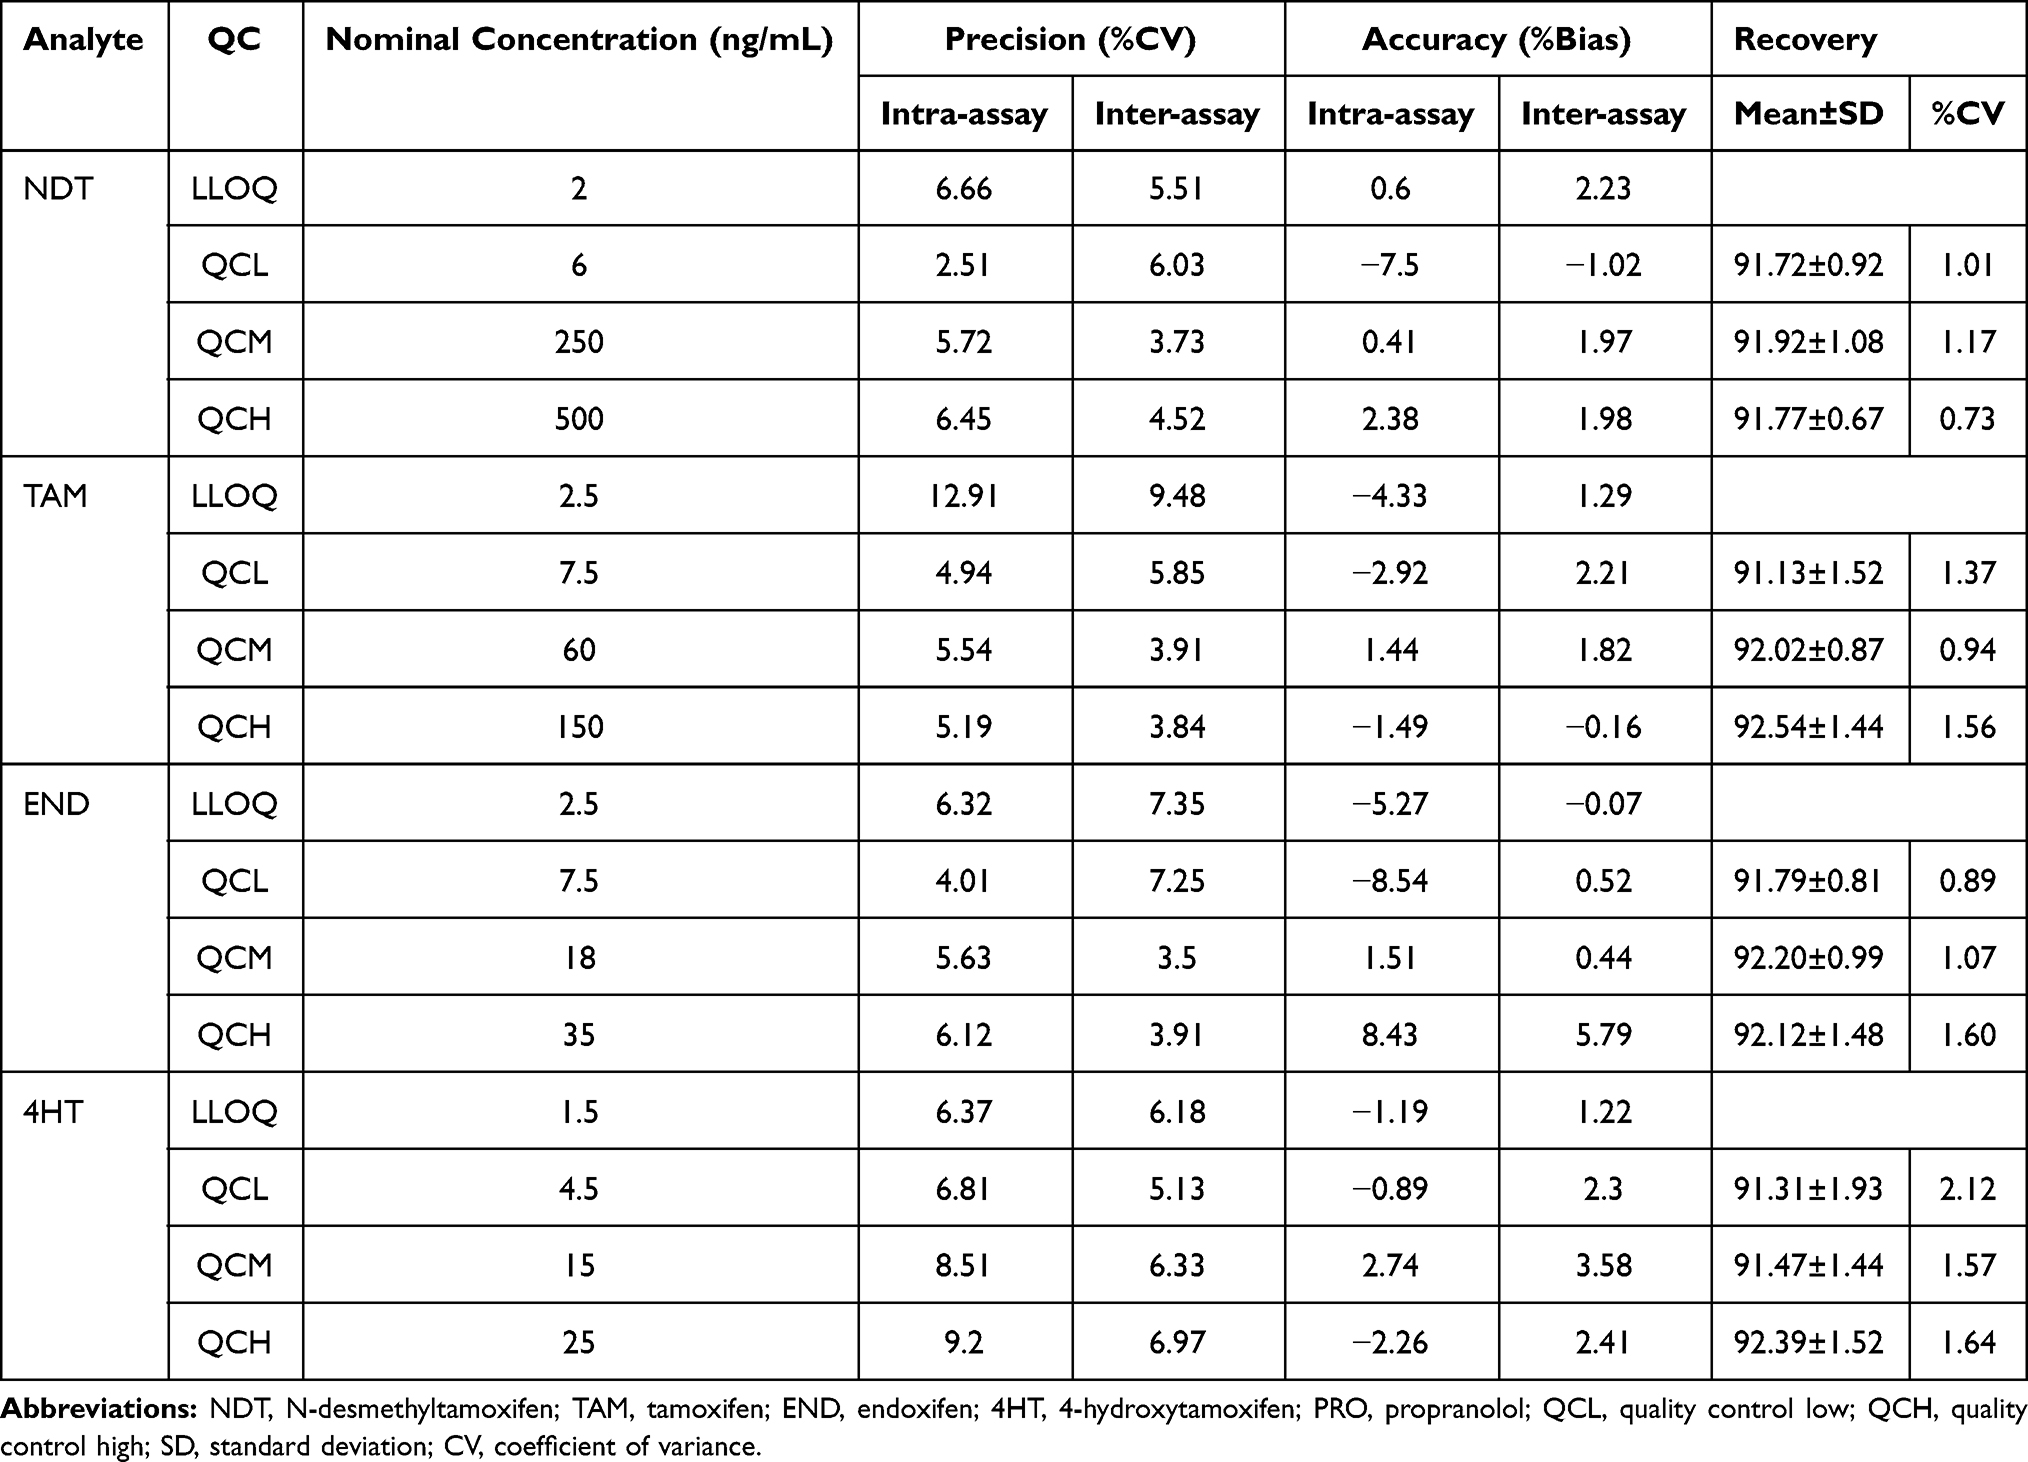 |
Table 2 Results of the Accuracy and Precision Experiment (n=5) |
Recovery
Extraction recovery was calculated from the ratio of the area of the extracted analyte (a) to the analyte spiked after extraction (b). The assay was carried out at the concentrations of QCL, QCM, and QCH for 3 replications each. Analyte recovery from biological matrix does not have to be 100%, but it should be consistent, precise, and reproducible. The preparation method developed in this study successfully extracted more than 90% analytes from the matrix with %CV between analysis below 15%. Data are presented in Table 2.
Carry Over
The measured peak area of the blank sample injected after ULOQ standard was between 1.85–4.08% of the peak area at LLOQ for NDT, between 2.25–4.56% of the peak area at LLOQ for TAM, between 4.21–5.26% of the peak area at LLOQ for END, between 2.49–3.86% of the peak area at LLOQ for 4HT and between 0.67–1.22% of the peak area at LLOQ for propranolol.
Dilution Integrity
The assay was carried out by preparing 5 replicates of VAMS with a concentration twice above ULOQ. Preparation is carried out in accordance with the optimum preparation method. The final extract was then subjected to half and quarter dilutions. % bias and precision (% CV) represented a value of not more than 15% for all analytes.
Matrix Effects
The molecules in the biological matrix can interfere with the ionization process and affect the UPLC-MS/MS response. The molecules in the matrix can cause ion suppression and enhancement.29 This study was carried out by post-extraction spiked at the concentration of QCL and QCH against a blank matrix from six different sources. As shown in Table 3, the occurrence of ion suppression in all analytes were within 7%. This value indicates only minimal interference caused by co-eluting the matrix component. IS normalized factor showed a value close to 1 which indicates that the internal support used can compensate for the matrix effect. % CV on the effect matrix and IS normalized matrix factor were below 15 which indicates that this test meets the requirements.
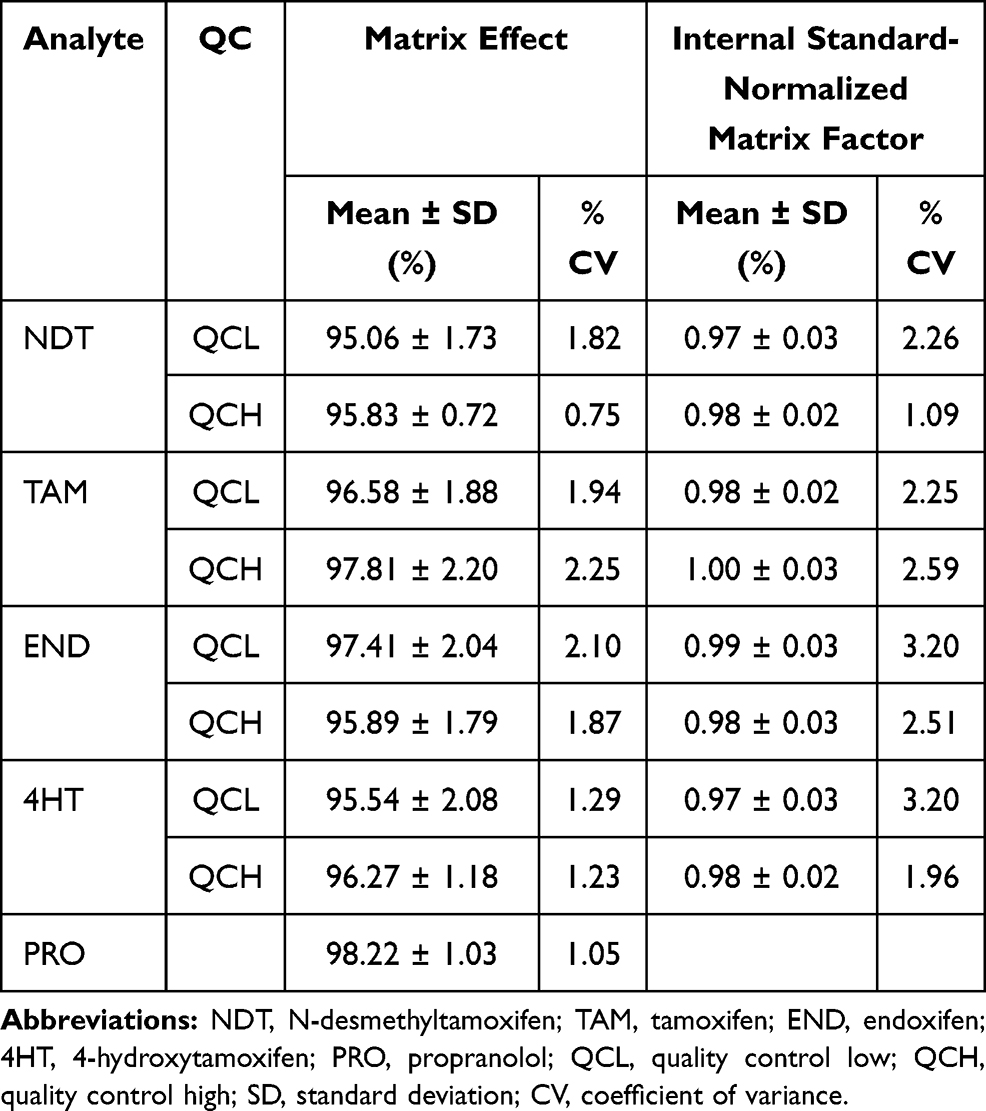 |
Table 3 Results of Matrix Effect for Tamoxifen and Its Metabolites |
Stability
The results of the storage stability of stock solution showed %bias below 10% for all analytes in methanol at room temperature (25°C) for 24 h and in the refrigerator (−20°C) for 1 months, in amber glass vial, protected from light. The results of the NDT, TAM, END, and 4HT stability tests on VAMS also showed good stability with the %bias and %CV values below 15%. The stability of the analytes in VAMS has been demonstrated during a room temperature storage period of up to 1 month, in a sealed plastic bag with desiccant and protected from light. The stability studies data are summarized in Table 4.
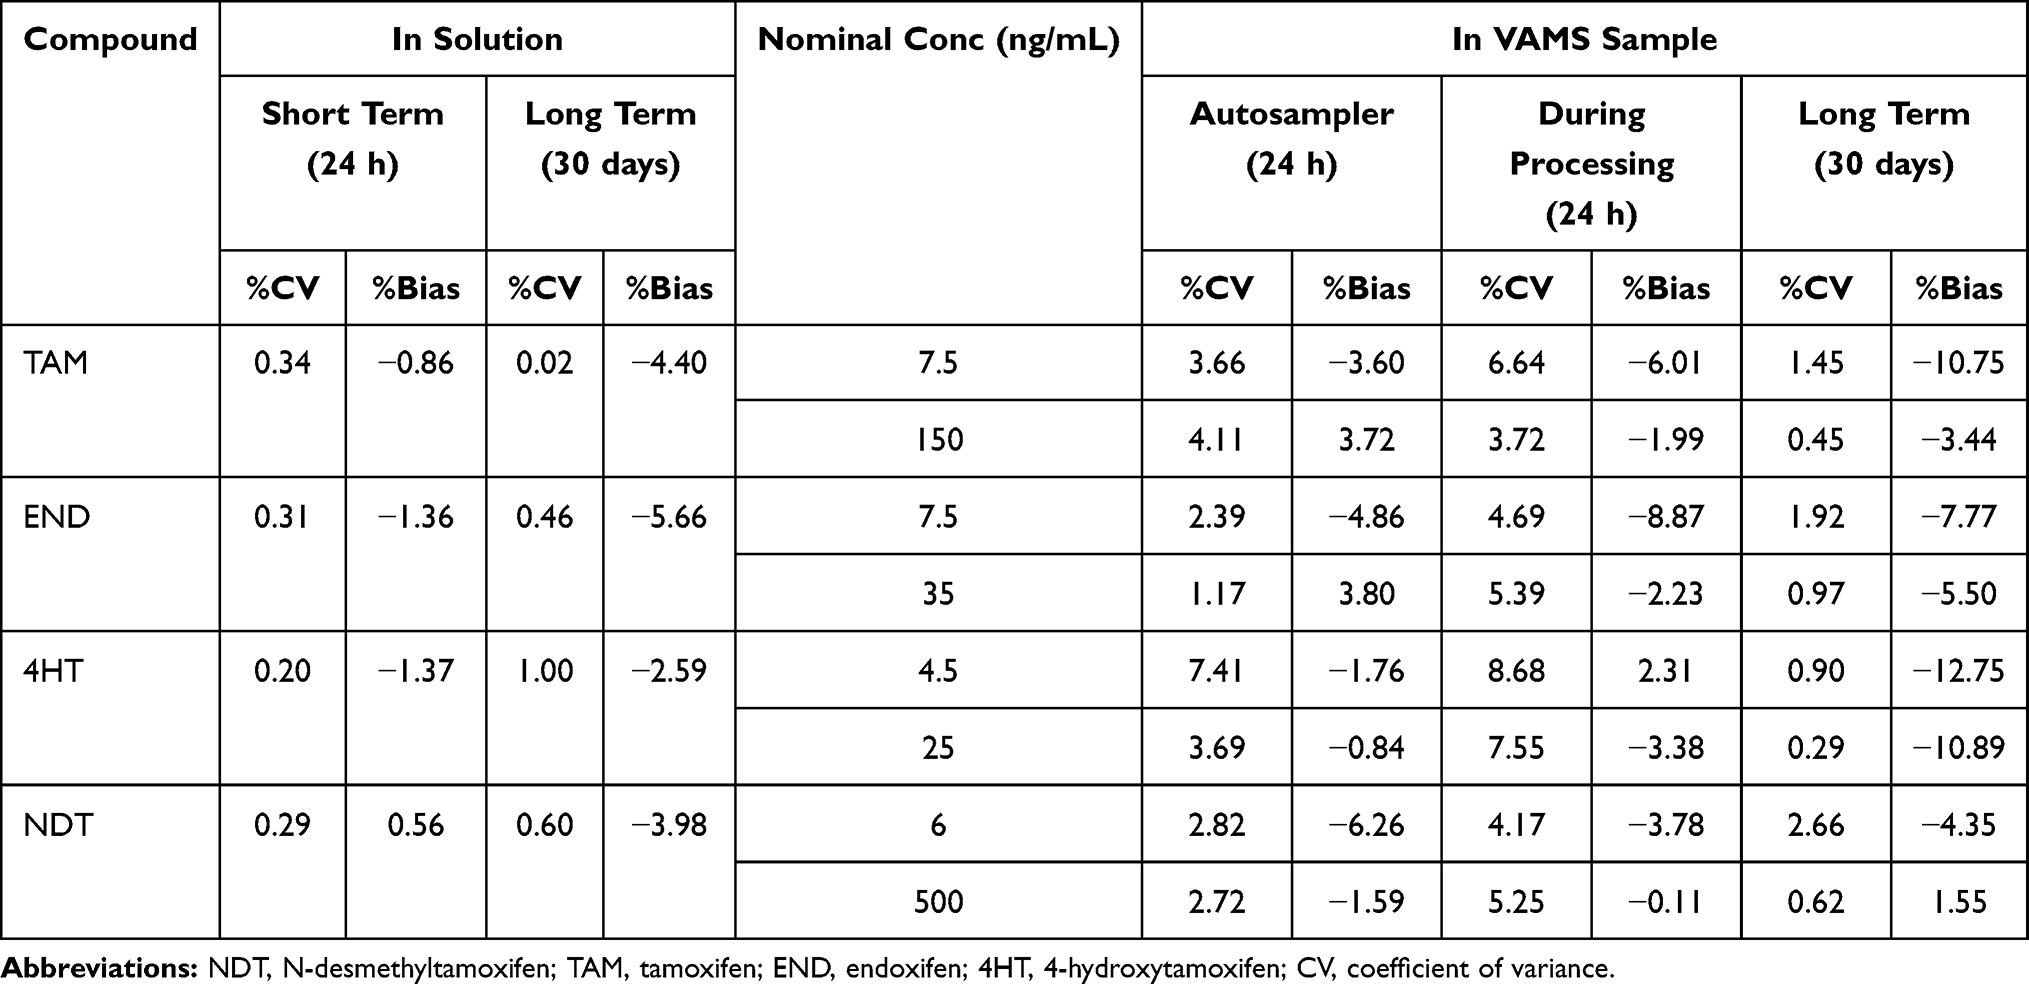 |
Table 4 Summary of Stability Data |
Application of the Method
Total of 30 pre- and post-menopausal patients were recruited in this study from September to October 2019 at the MRCCC Siloam Semanggi hospital Jakarta. The patient population was predominantly premenopausal (n = 24) and others were postmenopausal (n = 6). The median of age is 46 with a range of 26–53. The median of BMI is 23.3 kg/m2 with a range of 18.73–27.63 kg/m2. All patients are Indonesian with a large proportion of ethnic Javanese and Chinese. No patient took any medication that was classified as a CYP2D6 inhibitor.
The analysis showed that the median VAMS level in all cohorts was TAM 84.68 ng/mL, NDT 245.35 ng/mL, END 7.96 ng/mL and 4HT 3.3 ng/mL. As presented in Table 5, NDT is the metabolite with the highest concentration in VAMS samples while 4HT showed the lowest among the metabolites. This study also observed a wide range of metabolite concentrations. Tamoxifen shows levels in the range 31.22–178.96 ng/mL, endoxifen 3.4–21.67 ng/mL, 4HT 1.5–13.71 ng/mL, and NDT 87.38–337.29 ng/mL. Substantial differences are shown in 4HT and END with a difference of 7.8 and 6.4 fold between the highest and lowest levels measured.
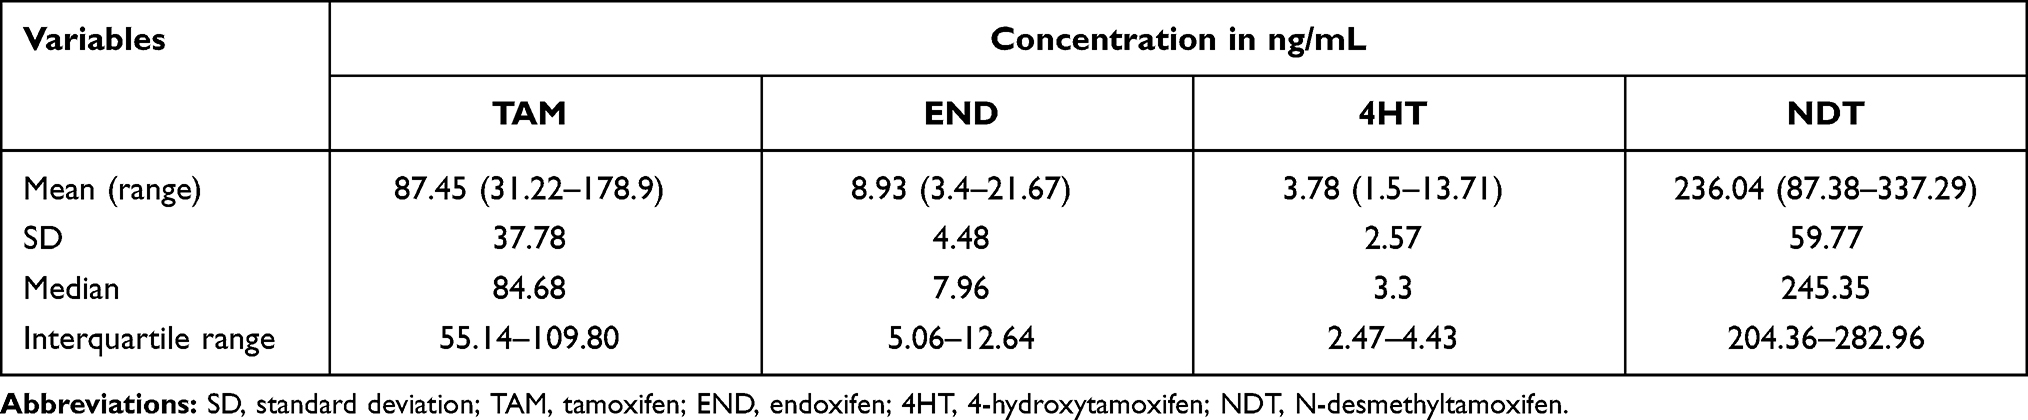 |
Table 5 The Distribution of Concentration of TAM, END, 4HT and NDT in 30 Patients |
Mean/median END in serum and plasma sample vary between studies. Previous journals reported mean/median END of 5.5 ng/mL to 14.5 ng/mL in plasma and serum patients.3,12,17,30,31 Other studies that have been conducted on Asian patients have shown higher END plasma levels of 11.1 ng/mL to 35.4 ng/mL.11,13,32,33 DBS level of TAM and metabolites were reported by Antunnes17 and Jager.30 Compared with previous studies, median DBS, TAM and 4HT in this study showed lower values than those reported by Antunnes (84.68 vs 100 ng/mL and 3.3 vs 0.9 ng/mL), while NDT and END showed higher values (245.35 vs 202 and 7.96 vs 5.9 ng/mL). There are no reported studies on TAM and its metabolites in VAMS so no comparisons can be carried out.
A study by Madlensky (2012) expressing END levels as a predictor outcome or success of tamoxifen therapystated that a serum END level of 5.9 ng/mL was the threshold for successful therapy, with patients with levels below this having a higher risk of recurrence and death than patients with levels above it. Jager (2014) has converted levels of 5.9 ng/mL in serum equivalent to 3.9 ng/mL in DBS,30 while Antunes converted the threshold in DBS equivalent to 3.3 ng/mL. Of the 30 patients analyzed, two patients had END level below 3.9 ng/mL. Clinicians should consider continuation of tamoxifen therapy in these two patients. Further investigation regarding the cause of the low END level in the patient’s blood should also be carried out. Various possible causes are the presence of non-compliance, concomitant drugs that can inhibit the mechanism and genetic polymorphisms that cause differences in the ability to metabolize TAM.
Conclusion
In conclusion, the UPLC-ESI-MS/MS method for quantitative analysis of N-desmethyltamoxifen, tamoxifen, endoxifen, and 4-hydroxytamoxifen with propranolol as the internal standard in VAMS was successfully developed and validated. The method proved to be rapid, sensitive, and specific. The LLOQ obtained in this study was 2.0 ng/mL for N-desmethyltamoxifen, 2.50 ng/mL for tamoxifen, 2.5 ng/mL for endoxifen, and 1.5 ng/mL for 4-hydroxytamoxifen with analysis time of 5 minutes. Simple analytic extraction using single extraction with methanol aided by 25 minutes of sonication also obtained good recovery. The method developed in the study proved to be applicable to the measurement of TAM, END, 4HT and NDT level in patients. Biosampling method with VAMS makes sampling easier, faster and more accurate than conventional DBS methods. LLOQ obtained from this method is adequate to analyze TAM, END, 4HT and NDT in blood samples but further development needs to be done for 4HT in order to obtain lower LLOQ.
Acknowledgments
This work was supported by TADOK Grant by Ministry of Research, Technology, and Higher Education of Indonesia. The funder had no role in study design, data collection and analysis, decision to publish, or preparation of the manuscript.
Disclosure
The authors declare that they have no conflicts of interest for this work.
References
1. Clemons M, Danson S, Howell A. Tamoxifen (‘ Nolvadex ’): a review. Cancer Treat Rev. 2002;7372(02):165–180. doi:10.1016/S0305-7372(02)00036-1
2. Davies C, Pan H, Godwin J, et al. Long-term eff ects of continuing adjuvant tamoxifen to 10 years versus stopping at 5 years after diagnosis of oestrogen receptor-positive breast cancer: ATLAS, a randomised trial. Lancet. 2012;6736(12):1–12. DOI:10.1016/S0140-6736(12)61963-1
3. Hennig EE, Piatkowska M, Karczmarski J, et al. Limited predictive value of achieving beneficial plasma (Z)-endoxifen threshold level by CYP2D6 genotyping in tamoxifen-treated Polish women with breast cancer. BMC Cancer. 2015;15(1). doi:10.1186/s12885-015-1575-4
4. Teunissen SF, Rosing H, Schinkel AH, Schellens JHM, Beijnen JH. Bioanalytical methods for determination of tamoxifen and its Phase I metabolites: a review. Anal Chim Acta. 2010;683(1):21–37. doi:10.1016/j.aca.2010.10.009
5. Tré-Hardy M, Capron A, Antunes MV, Linden R, Wallemacq P. Fast method for simultaneous quantification of tamoxifen and metabolites in dried blood spots using an entry level UPLC–MS/MS system. Clin Biochem. 2016;49(16–17):1295–1298. doi:10.1016/j.clinbiochem.2016.07.018
6. Tchu SM, Lynch KL. Therapeutic drug monitoring of tamoxifen using LC-MS/MS. In: Langman L, Snozek C, editors. LC-MS in Drug Analysis. Methods in Molecular Biology (Methods and Protocols). Vol. 902. Totowa, NJ: Humana Press; 2012.
7. Saladores P, Mürdter T, Eccles D, et al. Tamoxifen metabolism predicts drug concentrations and outcome in premenopausal patients with early breast cancer. Pharmacogenomics J. 2015;15(1):84–94. doi:10.1038/tpj.2014.34
8. Teunissen SF, Jager NGL, Rosing H, Schinkel AH, Schellens JHM, Beijnen JH. Development and validation of a quantitative assay for the determination of tamoxifen and its five main phase I metabolites in human serum using liquid chromatography coupled with tandem mass spectrometry. J Chromatogr B Anal Technol Biomed Life Sci. 2011;879(19):1677–1685. doi:10.1016/j.jchromb.2011.04.011
9. Madlensky L, Natarajan L, Tchu S, et al. Tamoxifen metabolite concentration, CYP2D6 genotype and breast cancer outcomes. Clin Pharmacol Ther. 2007;86(3):573–579. doi:10.1109/TMI.2012.2196707
10. Fox P, Balleine RL, Lee C, et al. Dose escalation of tamoxifen in patients with low endoxifen level: evidence for therapeutic drug monitoring - The TADE study. Clin Cancer Res. 2016;22(13):3164–3171. doi:10.1158/1078-0432.CCR-15-1470
11. Woo HI, Lee SK, Kim J, et al. Variations in plasma concentrations of tamoxifen metabolites and the effects of genetic polymorphisms on tamoxifen metabolism in Korean patients with breast cancer. Oncotarget. 2017;8(59):100296–100311. doi:10.18632/oncotarget.22220
12. Mürdter TE, Schroth W, Bacchus-Gerybadze L, et al. Activity levels of tamoxifen metabolites at the estrogen receptor and the impact of genetic polymorphisms of phase I and II enzymes on their concentration levels in plasma. Clin Pharmacol Ther. 2011;89(5):708–717. doi:10.1038/clpt.2011.27
13. Love RR, Desta Z, Flockhart D, et al. CYP2D6 genotypes, endoxifen levels, and disease recurrence in 224 Filipino and Vietnamese women receiving adjuvant tamoxifen for operable breast cancer. Springerplus. 2013;2(1):52. doi:10.1186/2193-1801-2-52
14. Schultink AH, Alexi X, Werkhoven EV, et al. An antiestrogenic activity score for tamoxifen and its metabolites is associated with breast cancer outcome. Breast Cancer Res Treat. 2018;161(3):567–574. doi:10.1007/s10549-016-4083-6
15. Rae JM, Drury S, Hayes DF, et al. CYP2D6 and UGT2B7 genotype and risk of recurrence in tamoxifen-treated breast cancer patients. J Natl Cancer Inst. 2012;104(6):452–460. doi:10.1093/jnci/djs126
16. Jager NG, Rosing H, Schellens JH, Beijnen JH. Determination of tamoxifen and endoxifen in dried blood spots using LC–MS/MS and the effect of coated DBS cards on recovery and matrix effects. Bioanalysis. 2014;6(22):2999–3009. doi:10.4155/bio.14.157
17. Antunes MV, Raymundo S, de Oliveira V, et al. Ultra-high performance liquid chromatography tandem mass spectrometric method for the determination of tamoxifen, N -desmethyltamoxifen, 4-hydroxytamoxifen and endoxifen in dried blood spots—development, validation and clinical application during breast cancer. Talanta. 2015;132:775–784. doi:10.1016/j.talanta.2014.10.040
18. Harahap Y,Maggadani BP,Sitorus TRJ,Mulyadi CA,Purwanto DJ.Clinical application of dried blood spot for monitoring studies of tamoxifen, endoxifen, and 4-hydroxytamoxifen in breast cancer patient using liquid chromatography. Int J Appl Pharm. 2019;11:59–63. doi:10.22159/ijap.2019v11i2.30310.
19. Jager NGL, Rosing H, Linn SC, Schellens JHM, Beijnen JH. Importance of highly selective LC-MS/MS analysis for the accurate quantification of tamoxifen and its metabolites: focus on endoxifen and 4-hydroxytamoxifen. Breast Cancer Res Treat. 2012;133(2):793–798. doi:10.1007/s10549-012-2000-1
20. De Krou S, Rosing H, Nuijen B, Schellens JHM, Beijnen JH. Fast and adequate liquid chromatography-tandem mass spectrometric determination of z-endoxifen serum levels for therapeutic drug monitoring. Ther Drug Monit. 2017;39(2):132–137. doi:10.1097/FTD.0000000000000372
21. Binkhorst L, Mathijssen RHJ, Ghobadi Moghaddam-Helmantel IM, et al. Quantification of tamoxifen and three of its phase-I metabolites in human plasma by liquid chromatography/triple-quadrupole mass spectrometry. J Pharm Biomed Anal. 2011;56(5):1016–1023. doi:10.1016/j.jpba.2011.08.002
22. Kip AE, Kiers KC, Rosing H, Schellens JHM, Beijnen JH, Dorlo TPC. Volumetric absorptive microsampling (VAMS) as an alternative to conventional dried blood spots in the quantification of miltefosine in dried blood samples. J Pharm Biomed Anal. 2017;135:160–166. doi:10.1016/j.jpba.2016.12.012
23. Kok MGM, Fillet M. Volumetric absorptive microsampling: current advances and applications. J Pharm Biomed Anal. 2018;147:288–296. doi:10.1016/j.jpba.2017.07.029
24. Denniff P, Spooner N. Volumetric absorptive microsampling: a dried sample collection technique for quantitative bioanalysis. Anal Chem. 2014;86:8489–8495. doi:10.1021/ac5022562
25. Spooner N, Denniff P, Michielsen L, et al. A device for dried blood microsampling in quantitative bioanalysis: overcoming the issues associated with blood hematocrit. Bioanalysis. 2015;7(6):653–659. doi:10.4155/bio.14.310
26. European Medicines Agency, Committee for Medicinal Products for Human Use. Guideline on Bioanalytical Method Validation. London, UK: European Medicines Agency. 2011.
27. US Department of Health and Human Services, US FDA, Center for Drug Evaluation and Research, Center for Veterinary Medicine. Guidance for Industry. Bioanalytical Method Validation. Rockville, MD, USA: US FDA; 2018.
28. Kostiainen R, Kauppila TJ. Effect of eluent on the ionization process in liquid chromatography – mass spectrometry. J Chromatogr A. 2009;1216:685–699. doi:10.1016/j.chroma.2008.08.095
29. Gosetti F, Mazzucco E, Zampieri D, Gennaro MC. Signal suppression/enhancement in high-performance liquid chromatography tandem mass spectrometry. J Chromatogr A. 2010;1217(25):3929–3937. doi:10.1016/j.chroma.2009.11.060
30. Jager NGL, Rosing H, Schellens JHM, Beijnen JH, Linn SC. Use of dried blood spots for the determination of serum concentrations of tamoxifen and endoxifen. Breast Cancer Res Treat. 2014;137–144. DOI:10.1007/s10549-014-2999-2
31. Barginear MF, Jaremko M, Peter I, et al. Increasing tamoxifen dose in breast cancer patients based on CYP2D6 genotypes and endoxifen levels: effect on active metabolite isomers and the antiestrogenic activity score. Clin Pharmacol Ther. 2011;90(4):605–611. doi:10.1038/clpt.2011.153
32. Khalaj Z, Baratieh Z, Nikpour P, et al. Clinical trial: CYP2D6 related dose escalation of tamoxifen in breast cancer patients with Iranian ethnic background resulted in increased concentrations of tamoxifen and its metabolites. Front Pharmacol. 2019;10(May):1–13. DOI:10.3389/fphar.2019.00530
33. Lim JSL, Chen XA, Singh O, et al. Impact of CYP2D6, CYP3A5, polymorphisms on tamoxifen pharmacokinetics in Asian breast cancer patients. Br J Clin Pharmacol. 2011;737–750. doi:10.1111/j.1365-2125.2011.03905.x
 © 2021 The Author(s). This work is published and licensed by Dove Medical Press Limited. The
full terms of this license are available at https://www.dovepress.com/terms
and incorporate the Creative Commons Attribution
- Non Commercial (unported, 3.0) License.
By accessing the work you hereby accept the Terms. Non-commercial uses of the work are permitted
without any further permission from Dove Medical Press Limited, provided the work is properly
attributed. For permission for commercial use of this work, please see paragraphs 4.2 and 5 of our Terms.
© 2021 The Author(s). This work is published and licensed by Dove Medical Press Limited. The
full terms of this license are available at https://www.dovepress.com/terms
and incorporate the Creative Commons Attribution
- Non Commercial (unported, 3.0) License.
By accessing the work you hereby accept the Terms. Non-commercial uses of the work are permitted
without any further permission from Dove Medical Press Limited, provided the work is properly
attributed. For permission for commercial use of this work, please see paragraphs 4.2 and 5 of our Terms.