Back to Journals » Diabetes, Metabolic Syndrome and Obesity » Volume 13
Vitamin D Status and Correlation with Glucose and Lipid Metabolism in Gansu Province, China
Authors Yang K, Liu J ![]() , Fu S, Tang X, Ma L, Sun W, Niu Y, Jing G, Niu Q
, Fu S, Tang X, Ma L, Sun W, Niu Y, Jing G, Niu Q
Received 10 February 2020
Accepted for publication 17 April 2020
Published 7 May 2020 Volume 2020:13 Pages 1555—1563
DOI https://doi.org/10.2147/DMSO.S249049
Checked for plagiarism Yes
Review by Single anonymous peer review
Peer reviewer comments 2
Editor who approved publication: Prof. Dr. Juei-Tang Cheng
Kaili Yang, Jingfang Liu, Songbo Fu, Xulei Tang, Lihua Ma, Weiming Sun, Ying Niu, Gaojing Jing, Qianglong Niu
Department of Endocrinology, The First Hospital of Lanzhou University, Lanzhou, Gansu 730000, People’s Republic of China
Correspondence: Jingfang Liu
Department of Endocrinology, The First Hospital of Lanzhou University, Lanzhou 730000, Gansu, Peoples’ Republic of China
Tel +86-931-8356242
Email [email protected]
Objective: To investigate the relationship between serum 25-hydroxyvitamin D [25(OH)D] levels and blood glucose and lipid levels in people over 18 years of age in Gansu, China.
Subjects and Methods: A total of 1928 volunteers (958 males and 970 females) were selected. The prevalence of abnormal glucose metabolism and lipid metabolism in the vitamin D deficiency group (< 20 ng/mL) and the non-vitamin D deficiency group (≥ 20 ng/mL) were compared. The correlations between serum 25(OH)D and blood glucose and lipid were analyzed.
Results: A total of 1681 patients had 25(OH)D deficiency, with an overall prevalence of 87.2% (82.9% in males and 91.4% in females). The levels of 25(OH)D in the diabetic group and the IGT/IFG group were significantly lower than that in the normal group. The level of 25(OH)D was significantly lower in the dyslipidemia group than that in the normal group, and was significantly lower in the fasting plasma glucose (FPG) ≥ 5.6 mmol/L group than that in the FPG < 5.6 mmol/L group (p=0.002). The 25(OH)D level in the serum triglyceride (TG) ≥ 1.7 mmol/L group was significantly lower than that of the TG < 1.7 mmol/L group (p=0.0274). The age, heart rate, TG, TC, FPG and H2PG levels in the vitamin D deficiency group were significantly higher than those in the non-vitamin D deficiency group (p< 0.05). The prevalence of FPG ≥ 5.6 mmol/L in the vitamin D deficiency group was higher than that in the non-vitamin D deficiency group (23.5% vs 16.6%, p=0.016). Multiple linear regression analysis suggested that serum 25(OH)D levels were independently correlated with gender, age, FPG, TG and heart rate (β=− 0.218, − 0.129, − 0.075, β=− 0.103, − 0.058, all p< 0.05).
Conclusion: The incidences of dyslipidemia and dysglycemia were higher in the vitamin D deficiency group. The vitamin D level was independently and negatively correlated with FPG and TC, but not with waist circumference, BMI and blood pressure.
Keywords: 25(OH)D, lipid metabolism, glucose metabolism
Introduction
Vitamin D is a steroid hormone that can be synthesized in the skin after exposure to ultraviolet light and can also be obtained through exogenous supplementation or dietary intake.1 Epidemiological studies have shown that vitamin D deficiency affects nearly one billion people worldwide.2 Vitamin D deficiency is more severe in adults, especially in the Middle East and Asia.3 The prevalence of vitamin D deficiency varies by geographical location, duration of sunlight, use of sunscreen, and dietary habits.4 A recent multi-centric study in five major cities in China5 found that the prevalence of vitamin D deficiency in mainland urban population was 55.9%, and the serum level of 25-hydroxyvitamin D [25(OH)D] was <50 nmol/L. Other studies have shown that the prevalence of vitamin D deficiency in adult men and women in the United States ranged from 40% to 100%.6
Vitamin D plays an important role in maintaining bone health and mineral homeostasis. Vitamin D receptors are widely distributed in most tissues, and vitamin D has various important exoskeletal effects. Recent studies have confirmed that vitamin D is also involved in the metabolic regulation of nutrients in the body, such as sugar and fat.1 To the subjects with overweight and obesity, serum vitamin D levels were associated with body mass index (BMI), waist circumference (WC), fat mass, hyperinsulinemia, insulin resistance, and inflammatory markers, such as C-reactive protein, complement C3, and complement C4.7,8 De Pergola et al reported vitamin D deficiency was significantly associated to autoimmune thyroiditis in overweight and obese subjects.9 In animal models with vitamin D deficiency, supplementation improved insulin and glucose homeostasis.10,11 In addition, studies have shown that vitamin D deficiency increases the risk of hypertension and cardiovascular disease.12 Although numerous studies have shown a correlation between vitamin D and glycolipid metabolism, studies on vitamin D deficiency and its relationship with glycolipid metabolism in China, especially in Gansu province, are relatively rare.
Subjects and Methods
Subjects
A total of 1928 volunteers (aged 18–87 years) were selected to participate in the National Survey Of Diabetes Prevalence in Gansu province, including 958 males and 970 females. The survey and blood collection took place during December 2015 and May 2016.
Inclusion criteria: age ≥18 years, Han nationality, at least 5 years’ residence in the community (village) of the flow transfer sites and those who had not received vitamin D preparations or calcium supplements in the last three months.
Exclusion criteria: missing data and outliers in the questionnaire; subjects with diabetes history; pregnant women; subjects with thyroid dysfunction with or without medication; subjects with parathyroid disease history; patients with severe liver and kidney dysfunction; patients with recent acute infection; subjects with newly broken bones, and those who recently took vitamin D, hormones and other drugs that affect blood calcium and vitamin D metabolism.
Methods
Collection of Basic Information of the Subjects
The volunteers’ basic information, education level, drinking history, smoking history, diabetes and hypertension history, family history of coronary heart disease, dietary and living habits (including milk, calcium and vitamin D supplements, etc.) were collected. The subjects were also asked whether they had metabolic osteopathy, thyroid diseases, severe hepatic and renal insufficiency, or malignant tumors. Height, weight, waist circumference (WC), systolic blood pressure (SBP), diastolic blood pressure (DBP) and heart rate were measured. The height and weight of the subjects were measured by professional medical staff, and the subjects were required to take off their shoes and wear thin clothing. Body mass index (BMI) was calculated by dividing weight by height squared (Kg/m2). WC was measured at the umbilical plane. Heart rate, SBP and DBP were read with an electronic sphygmomanometer after a 10-minute rest.
Determination of Serum Biochemical Indicators
After fasting overnight for 8 h, the venous blood samples were collected in the morning. The fasting plasma glucose (FPG), 2 h postprandial plasma glucose (H2PG), total cholesterol (TC), triglyceride (TG), high-density lipoprotein cholesterol (HDL-C), low-density lipoprotein cholesterol (LDL-C) and blood calcium (Ca) were measured using the Bs-220 automatic biochemical analyzer (Mairui Biotechnology Co. Ltd., China). The reagents were purchased from Meigao medical technology Co. Ltd., China.
Diagnostic Standards
Serum 25(OH)D <20 ng/mL (50 nmol/L) was defined as vitamin D deficiency, 20–30 ng/mL (50–75 nmol/L) as vitamin D insufficient, and >30 ng/mL (>75 nmol/L) as vitamin D sufficient.13
According to the American Diabetes Association (ADA) recommendations, diabetes mellitus is recognized when FPG ≥7.0 mmol/L or H2PG ≥11.1 mmol/L. Impaired Fasting Glucose (IFG): 5.6 mmol/L ≤FPG ≤6.9 mmol/L; Impaired Glucose Tolerance (IGT): 7.8 mmol/L ≤ H2PG <11.0 mmol/L.
Diagnosis of dysglycemia:14 fasting blood glucose ≥5.6 mmol/L; H2PG ≥7.8 mmol/L, and any of the above two abnormalities is defined as dysglycemia.
Diagnosis of dyslipidemia:15 TG ≥1.70 mmol/L; TC ≥5.2 mmol/L; LDL-C ≥3.4 mmol/L; HDL-C <1.04 mmol/L; and any of the above is considered as dyslipidemia.
Statistical Analysis
All data were analyzed using SPSS25.0. Measurement data are expressed as mean ± standard deviation ( ). Independent sample t-test was used for the comparison of normal distribution data between two groups. One-way ANOVA was used for the comparison between multiple groups, and LSD method was used for the pairwise comparison. Non-normal distribution data were tested by non-parametric test. The counting data were compared between the two groups using the chi-square test. The correlations between serum vitamin D levels and glucose and lipid metabolism were analyzed by Pearson’s correlation analysis. Multivariate linear regression analysis was performed to analyze the independent factors influencing serum vitamin D levels. Since gender as a discontinuous variable, we converted gender into a dummy variable in regression analysis, with 0 for males and 1 for females. A p-value<0.05 was considered as statistically significant.
Results
Comparison of 25(OH)D Levels with Different Characteristics of the Population
The mean age of the 1928 participants was 42.9 years, of which 35 (1.8%) had adequate levels of 25(OH) D, 212 (11.0%) had inadequate levels, and 1681 (87.2%) were considered as deficient. When stratified by gender, 794 (82.9%) males and 887 (91.4%) females were 25(OH) D deficient (Table 1).
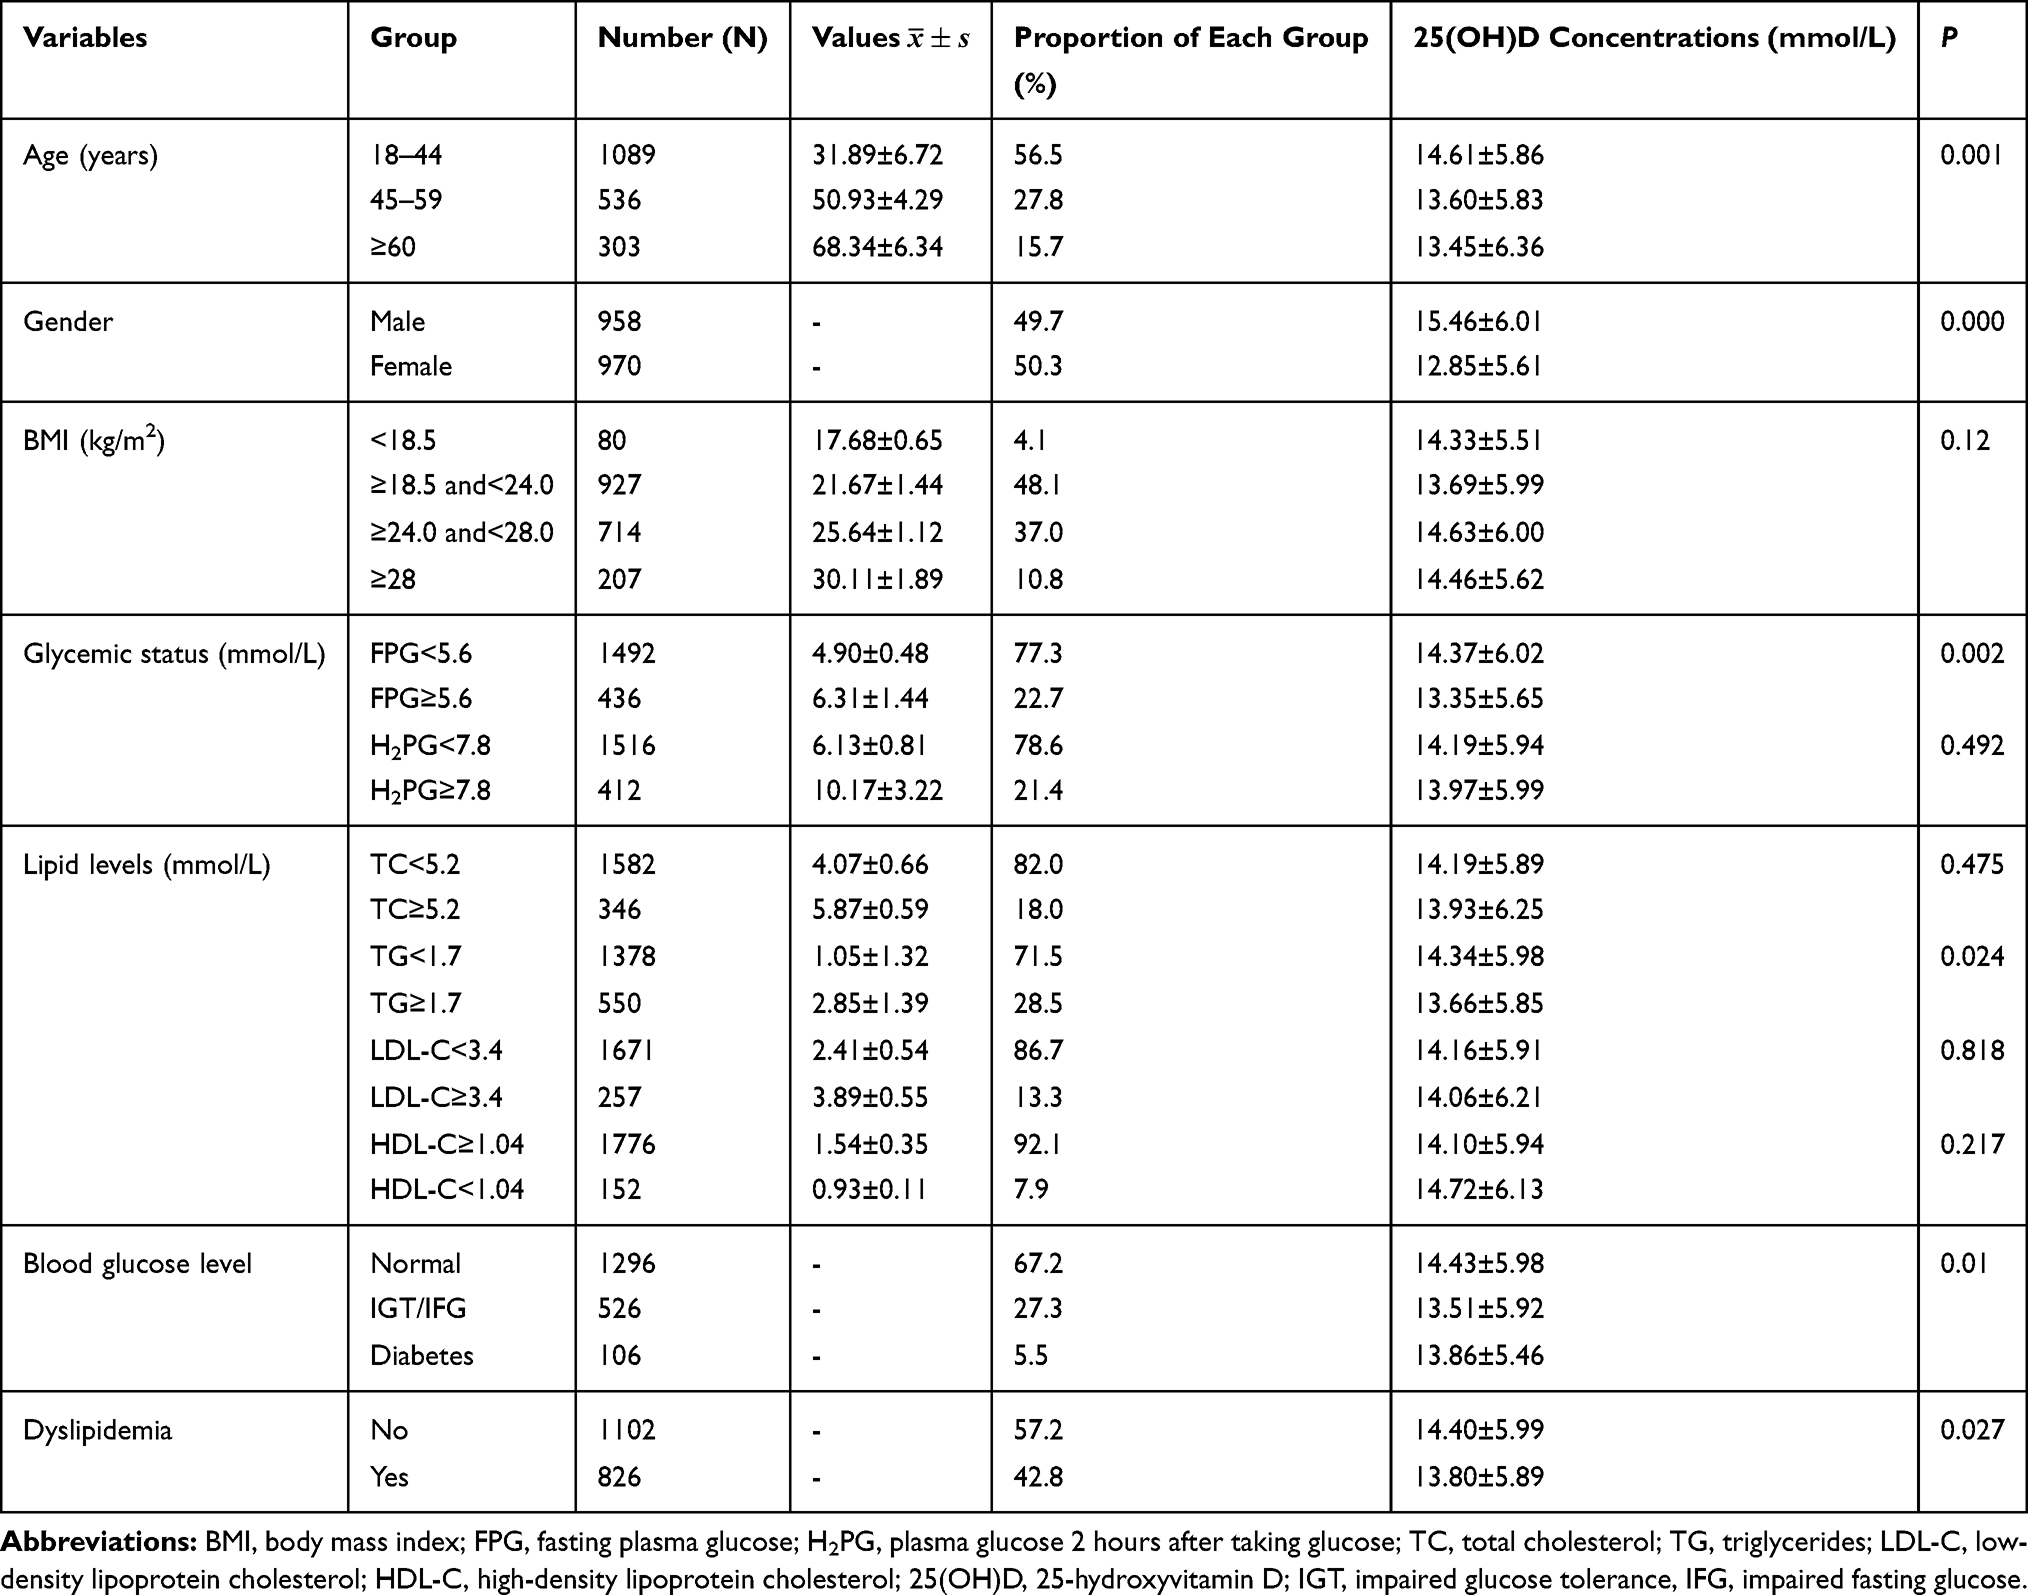 |
Table 1 Comparison of Vitamin D Levels Among Subjects with Different Characteristics |
Vitamin D levels were significantly lower in the ≥60 years age group than in the 18–44 and 45–59 years age groups (p=0.001). There was no significant difference in serum vitamin D levels between the 18–44 and 45–59 years age groups. Vitamin D levels were significantly higher in men than in women (p<0.001) (Table 1). There was no significant difference in serum vitamin D levels among different BMI groups (Table 1).
Among the 1928 participants, 106 (5.5%) cases were newly diagnosed with diabetes and 526 (27.3%) had IGT/IFG. The serum vitamin D levels of the diabetic group and the IGT/IFG group were significantly lower than that of the normal blood glucose group. There was no significant difference in vitamin D levels between the diabetic group and the IGT/IFG group. The level of vitamin D in the FPG ≥5.6 mmol/L group was significantly lower than that in the FPG <5.6 mmol/L group (p=0.002). Vitamin D levels between the H2PG <7.8 mmol/L group and the H2PG≥7.8 mmol/L group showed no statistical difference (Table 1).
The serum vitamin D levels in the dyslipidemia group were significantly lower than that in the normal group (Table 1). The serum vitamin D level of the TG ≥1.7 mmol/L group was significantly lower than that of the TG <1.7 mmol/L group (p=0.0274). There was no significant difference in serum vitamin D levels between the groups with different TC, HDL-C, and LDL-C levels (Table 1).
Comparison of Relevant Indexes Among the Different 25(OH)D Level Groups
The number of cases in the vitamin D sufficient group was small (n=35), therefore, the vitamin D sufficient group and the vitamin D insufficient group (n=212) were combined into one group. According to the dichotomy, vitamin D levels were divided into the vitamin D deficiency group 25(OH)D <20 ng/mL (<50 nmol/L) and the non-vitamin D deficiency group 25(OH)D ≥20 ng/mL (≥50 nmol/L), respectively.
The age, heart rate, TG, TC, FPG and H2PG levels of the vitamin D deficiency group were significantly higher than that of the non-vitamin D deficiency group (p<0.05), while the blood Ca level was significantly lower than that of the non-vitamin D deficiency group (p<0.05) (Table 2).
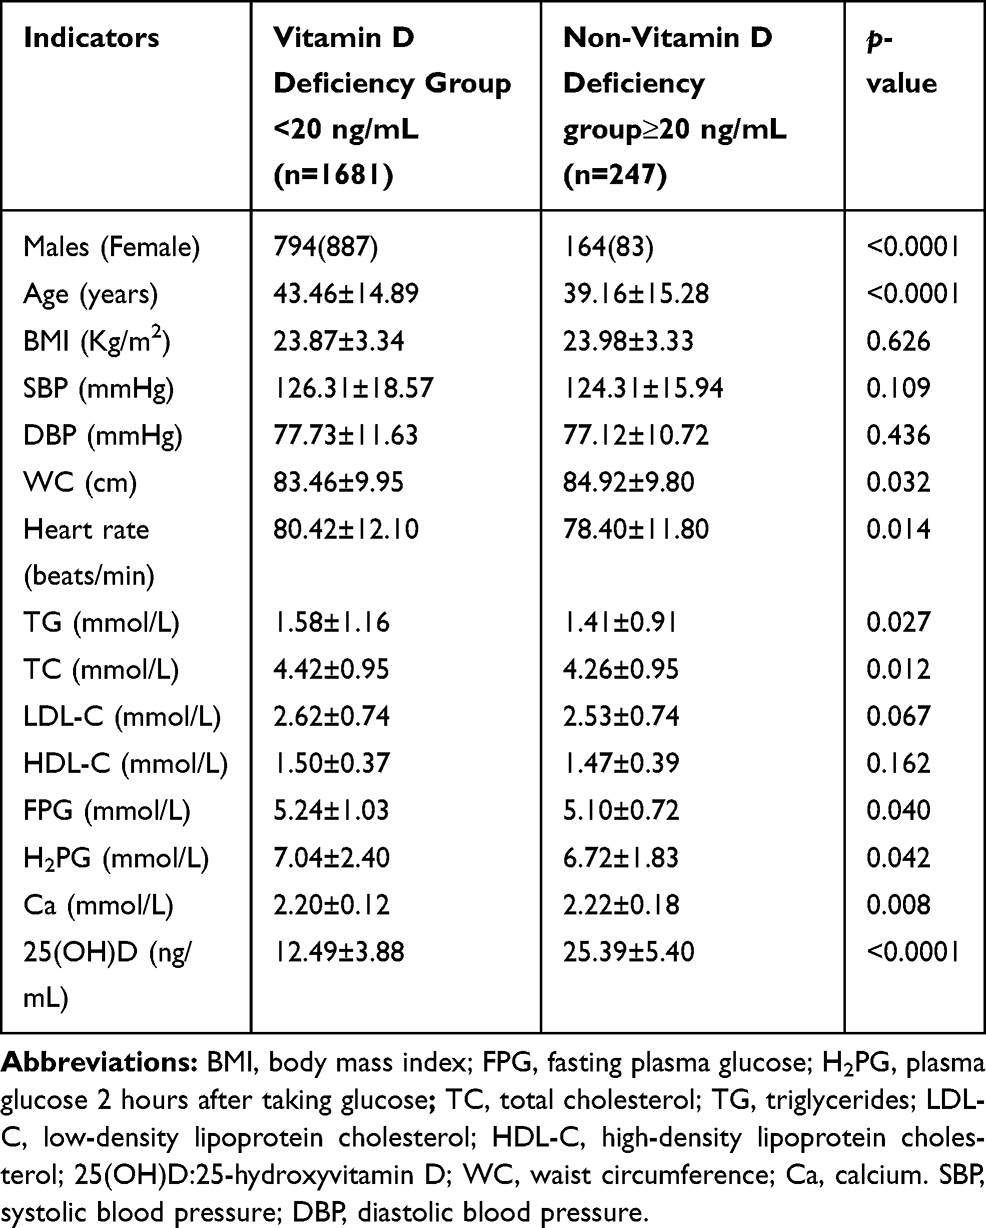 |
Table 2 Comparison of Indicators Between Vitamin D Deficiency Group and Non-Vitamin D Deficiency Group ( |

Prevalence of Dyslipidemia and Dysglycemia in the Different 25(OH)D Groups
The prevalence of FPG ≥5.6 mmol/L in the vitamin D deficiency group was significantly higher than that in the non-vitamin D deficiency group (23.5% vs 16.6%, p=0.016). In addition, the prevalence of TG ≥1.70 mmol/L in the vitamin D deficiency group was higher than that in the non-vitamin D deficiency group (29.3% vs 23.5%), but did not reach statistical significance (p=0.06) (Figure 1)
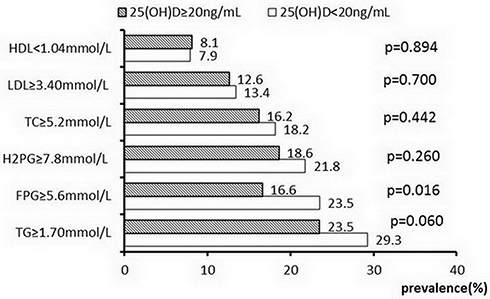 |
Figure 1 The prevalence of dysglycemia and dyslipidemia in different 25(OH)D groups. |
Relationship Between 25(OH)D Level and Glucose and Lipid Metabolism
Pearson’s correlation analysis showed that serum 25(OH)D levels were negatively correlated with serum TG (r=−0.067, p=0.003), HDL-C (r=−0.050, p=0.029), FPG (r=−0.063, p=0.006), age (r=−0.116, p<0.001), and heart rate (r=−0.077, p=0.001). Moreover,serum 25(OH)D levels were positively correlated with serum calcium level (r=0.078, p=0.001). There was no correlation between LDL-C, SBP and DBP levels (Table 3).
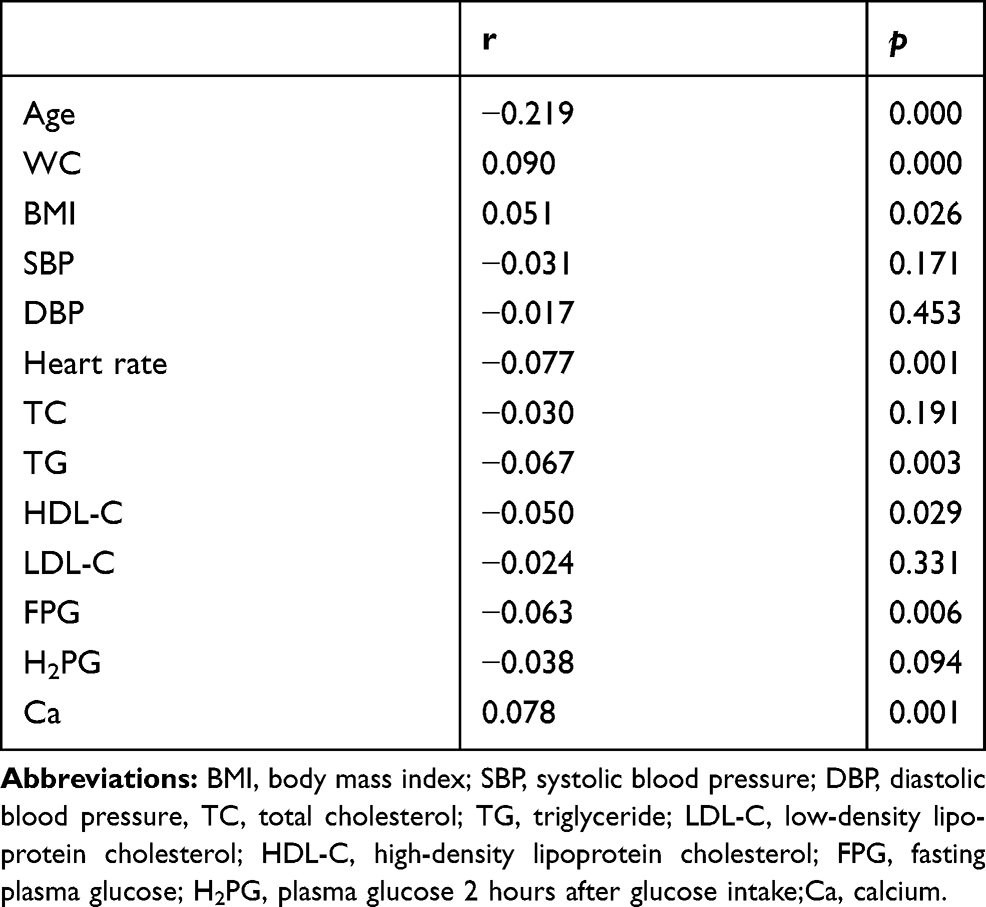 |
Table 3 Correlation Analysis of 25(OH) D and Various Metabolic Indexes |
Multiple Linear Regression Analysis
With serum 25(OH)D level as the dependent variable, and FPG, H2PG, TG, TC, LDL-C, HDL-C, WC, blood Ca and heart rate as independent variables, multiple linear regression analysis suggested that FPG (β=−0.069, p=0.038), TG (β=−0.113, p=0.000), LDL-C (β=−0.086, p=0.037) and heart rate (β=−0.073, p=0.002) were independently and negatively correlated with serum 25(OH)D level. Blood Ca levels were independently and positively correlated with vitamin D levels (β=0.079, p=0.000). After further adjustments for age, gender and BMI, serum 25(OH)D levels were independently correlated with gender (β=−0.218, p<0.001), age (β=−0.129, p<0.001), FPG (β=−0.075, p=0.021), TG (β=−0.103, p<0.001), and heart rate (β=−0.058, p=0.011) (Table 4).
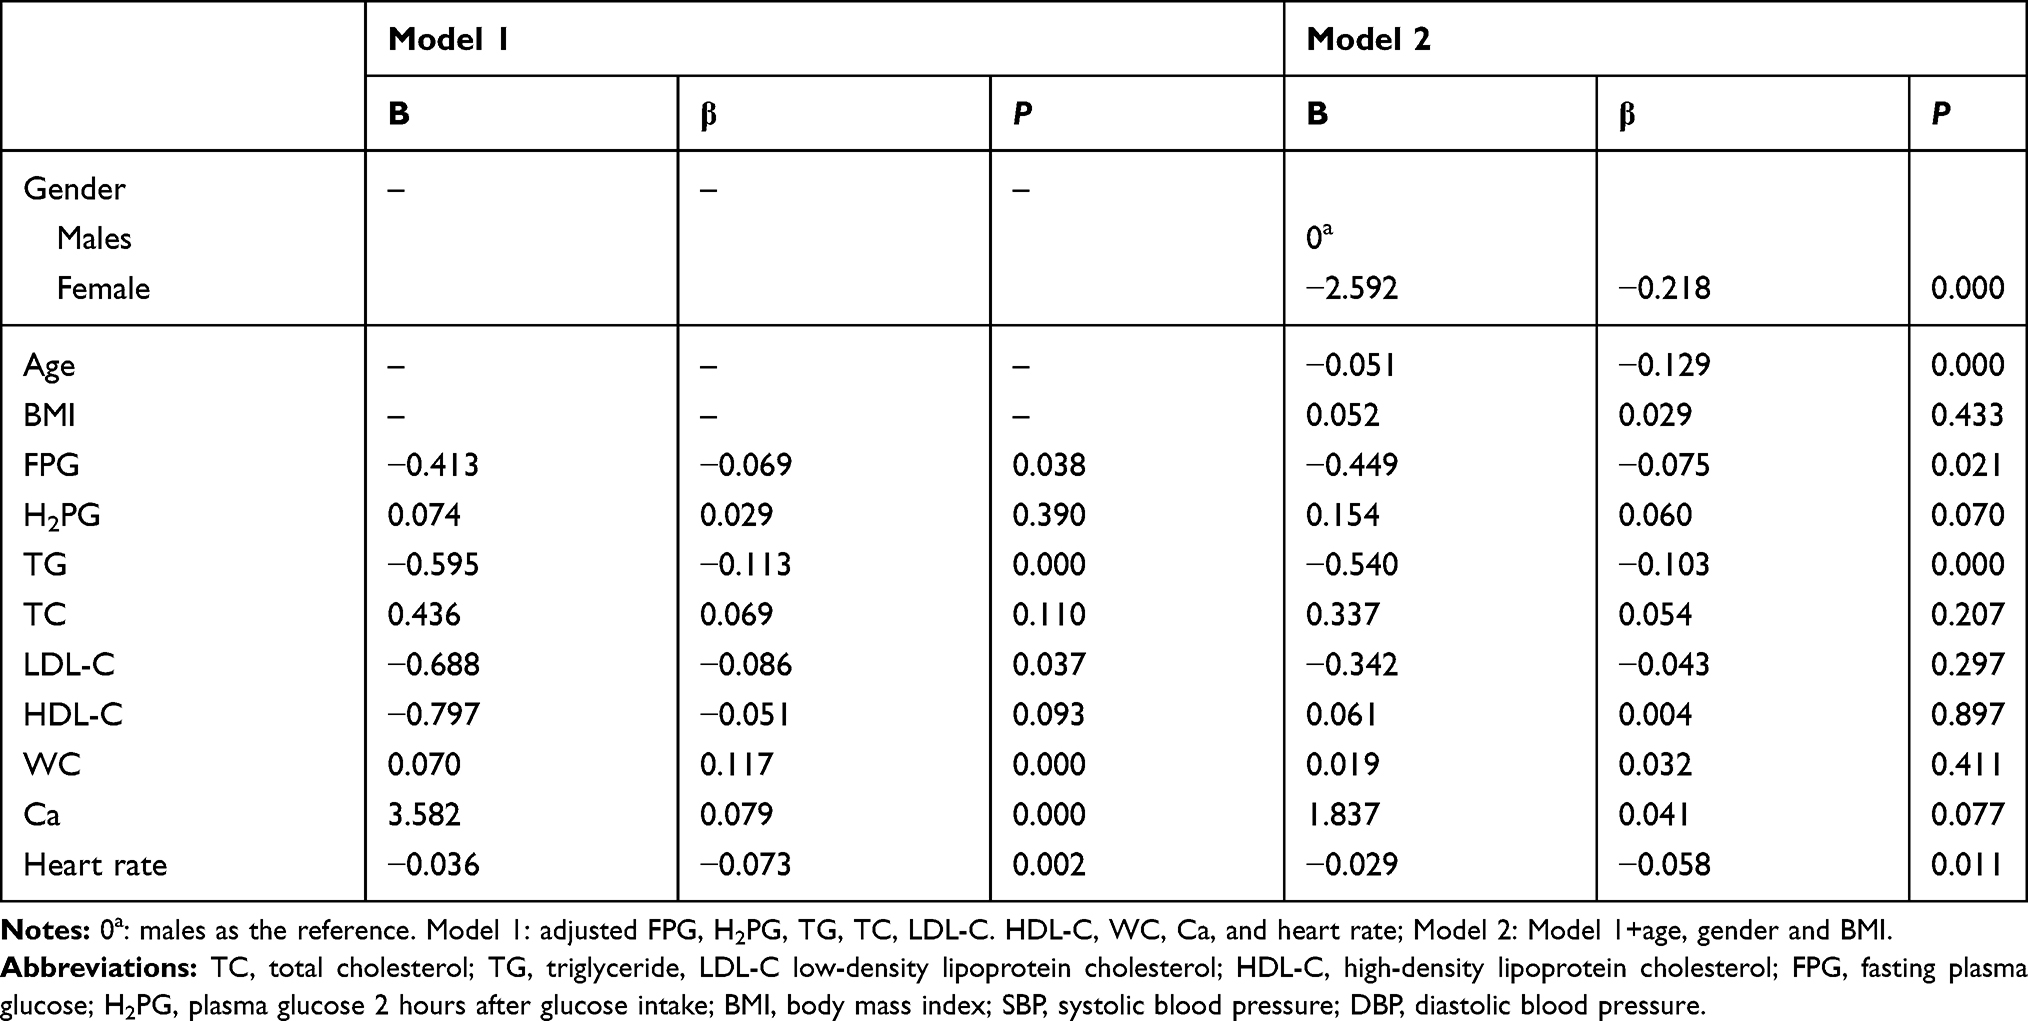 |
Table 4 Multiple Linear Regression Analysis of Vitamin D and Various Metabolic Indexes |
Discussion
25(OH)D, the main form of vitamin D in the blood circulation, reflects the nutritional status of vitamin D. 1, 25-dihydroxyvitamin D is the main bioactive form of vitamin D, which exerts biological effects by binding to vitamin D receptor (VDR).1 At present, the definition of vitamin D deficiency remains controversial. According to the guidelines of the United States in 201113 and the clinical consensus of vitamin D and its analogs in China in 2018,16 vitamin D deficiency is defined as 25(OH)D <20 ng/mL.A systematic review showed that vitamin D deficiency was prevalent in most regions of China.17 In this study, the prevalence of vitamin D deficiency in Gansu (Western China) was 87.2%, which was higher than that in other Chinese cities.18–21 It was also higher than in some foreign countries, such as Japan (40.8%), Finland (69%), Spain (30.5%) and Iran (71.2%).22–25 The disparity may be due to the fact that Gansu is relatively underdeveloped economically and inland, where people eat fewer foods rich in vitamin D, such as fish. Gansu province is located in latitude of 32°31”-42°57”N and longitude of 92°13”-108°46”E. It is far from the equator and ultraviolet radiation intensity is weaker, leading to less vitamin D synthesis in the skin. In addition, vitamin D levels are generally higher in summer than in winter, which may be related to UV intensity.26,27
Vitamin D, as the main regulator of calcium and phosphorus metabolism, plays an important role in maintaining intracellular and extracellular calcium homeostasis. In addition to its association with bone health, vitamin D is also associated with obesity, insulin resistance, diabetes, hypertension, atherosclerosis and other diseases.16 In this study, the relationship between vitamin D and glucose and lipid metabolism as well as blood calcium and heart rate was analyzed. The results showed that vitamin D was negatively correlated with FPG, TG and TC, and after adjusting for gender, age and BMI, vitamin D was negatively correlated with FPG and TG. Previous studies have shown a close relationship between vitamin D levels and glycolipid metabolism. Most observational studies have shown that vitamin D was negatively correlated with FPG,21,28-30 TG,24,28-33 TC,28,30,34,35 LDL-C24,28,31 and positively correlated with serum HDL-C.24,28,31,34 Szternel et al29 showed that serum vitamin D level was negatively correlated with FPG and TC in children aged 9–11 years, and every 1 ng/mL reduction in 25(OH)D concentration was associated with a 0.013 mmol/L increase in FPG, a 0.25 mmol/L increase in TC, and a 0.015 mmol/L decrease in HDL-C.
Some potential mechanisms have been suggested to explain the role of vitamin D deficiency in insulin resistance,35,36 because the vitamin D by the pancreas and nerve tissue of the VDR directly stimulates the production of insulin, and vitamin D deficiency may indirectly affect the variations of calcium level during insulin secretion, signal transduction and the activity of glucose transporter. In addition, insulin secretion is a calcium-dependent process, and vitamin D indirectly regulates the function of cells by regulating extracellular calcium and calcium fluxes. So a lack of vitamin D or calcium intake may alter the stability of the intracellular and extracellular calcium pools, which in turn may affect the normal secretion of insulin. In an animal study, VDR knock-out mice consumed more energy and oxygen than wild-type mice. Therefore, they had less body fat and lower plasma TG and TC levels.37 Vitamin D can improve lipid metabolism by inhibiting parathyroid hormone (PTH) secretion (PTH can reduce fat breakdown) and increasing blood calcium level (calcium can reduce the formation and secretion of liver TG).16 Vitamin D supplementation may reduce the rate of conversion from pre-diabetes to diabetes, and the incidence of obesity.38
Consistent with previous studies,18,28,39 vitamin D levels were negatively correlated with age in this study, and lower vitamin D concentrations were observed with the increase in age. This has been linked to a decline in the ability of older people’s skin to synthesize vitamin D.1 However, Nakhaee et al25 reported that the age of the vitamin D sufficient group was higher than that of the non-deficient and deficient groups. In addition, the vitamin D level of women was lower than that of men in the present study, which was consistent with previous studies,18,21,28,30 and may be related to the different lifestyles of men and women, as many women used sunblock products or performed fewer outdoor activities.
The relationship between vitamin D levels and obesity is inconsistent. Most studies suggested that vitamin D levels were lower in obese people, and negatively correlated with BMI22,26,27,32 and WC.30,32,34 The possible mechanism is that excessive vitamin D accumulates in the adipose tissue of obese people, leading to a decrease in vitamin D in the blood circulation and affecting its biological activity. Similarly, vitamin D inhibits the differentiation of pre-adipocytes into adipocytes, thereby reducing the production of fat. However, our study showed no significant correlation between vitamin D concentration and BMI. This may be related to dietary characteristics, ethnic differences, physical activity levels and education levels in different study populations, especially in foreign populations and more obese people.
Previous studies have found that the regulation of 1,25(OH)D on renin does not depend on the metabolism of calcium, but inhibits the production of renin through a mechanism mediated by VDR. Therefore, 1,25(OH)D is believed to be a negative regulator of renin-angiotensin system, which can prevent and improve hypertension.
Some studies have shown a significant negative correlation between serum vitamin D levels and SBP, or DBP levels.23,32 However, the current results suggest that serum vitamin D levels are not correlated with SBP and DBP levels. Consistent with our results, Kwon et al40 reported that serum vitamin D levels were not correlated with blood pressure. The reason for the inconsistent results may be that hypertension is a multifactorial disease, and interactions with race, age, diet, or other factors may weaken the association between vitamin D and blood pressure. More well-designed studies are needed to clarify the issue in the future.
There are few studies on the relationship between heart rate and vitamin D. In the current study, vitamin D was negatively correlated with heart rate. Studies have shown that vitamin D was associated with cardiac autonomic nerve activity,23,41 therefore, people with vitamin D deficiency may have a higher resting heart rate. The increased resting heart rate may also affect blood glucose and lipid levels.42 Consistent with our results, Ke et al23 found that vitamin D levels were negatively correlated with heart rate at baseline and after four years, even after adjusting for related confounding factors. Holick et al13 reported a similar correlation between vitamin D and heart rate.
In summary, the present study suggested that the prevalence of vitamin D deficiency in Gansu province was relatively high, and the incidence of abnormal glucose and lipid levels in the vitamin D deficiency group was relatively high. Vitamin D was negatively correlated with FPG and TG, positively correlated with blood Ca, but not significantly correlated with WC, BMI and blood pressure. However, there were limitations to this study, which was a cross-sectional study, and could not show a causal relationship between vitamin D deficiency and abnormal glucose and lipid metabolism. In addition, the study did not exclude confounding factors such as exposure to sunlight, smoking and work environment. Moreover, data such as insulin levels and parathyroid hormone levels were not collected in the study, so the correlation between vitamin D and insulin resistance could not be better evaluated. The sample size of this study was small. Furthermore, there is a percentage of individuals who are affected by diabetes, but that do not know to have this disease and that possibly have been enclosed in this study, which may influence the results. Hence, more prospective studies are needed to further explore the effects of vitamin D deficiency on dysglycemia, and whether appropriate vitamin D supplementation is beneficial for improving dysglycemia.
Conclusions
The incidence of dyslipidemia and dysglycemia was higher in the vitamin D deficiency group. The level of vitamin D was independently and negatively correlated with FPG and TC, but not with waist circumference, BMI and blood pressure.
Abbreviations
BMI, body mass index; FPG, fasting plasma glucose; H2PG, plasma glucose 2 hours after taking glucose; TC, total cholesterol; TG, triglycerides; LDL-C, low-density lipoprotein cholesterol; HDL-C, high-density lipoprotein cholesterol; 25(OH)D, 25-hydroxyvitamin D; IGT, impaired glucose tolerance, IFG, impaired fasting glucose; WC, waist circumference; Ca, calcium; SBP, systolic blood pressure; DBP, diastolic blood pressure.
Data Sharing Statement
The data that support the findings of this study are available from the corresponding author.
Ethics Approval and Consent to Participate
The study was approved by the First Hospital of Lanzhou University Ethics Committee, in accordance with the declaration of Helsinki, and the participants provided written informed consent.
Acknowledgments
The authors wish to thank the support from the Special Fund for Clinical Medical Research of Chinese Medical Association under grant (15010010589). We are grateful to all members of the group for their assistance in data collection.
Author Contributions
All authors made substantial contributions to conception and design, acquisition of data, or analysis and interpretation of data; took part in drafting the article or revising it critically for important intellectual content; gave final approval of the version to be published; and agree to be accountable for all aspects of the work.
Funding
This work was supported by the financial support from the Special Fund for Clinical Medical Research of Chinese Medical Association under grant number 15010010589.
Disclosure
The authors declare that they have no competing interests.
References
1. Holick MF. Vitamin D deficiency. N Engl J Med. 2007;357(3):266-281.
2. Palacios C, Gonzalez L. Is vitamin D deficiency a major global public health problem? J Steroid Biochem Mol Biol. 2014;144(Pt A):138–145. doi:10.1016/j.jsbmb.2013.11.003
3. Van Schoor NM, Lips P. Worldwide vitamin D status. Best Pract Res Clin Endocrinol Metab. 2011;25(4):671–680. doi:10.1016/j.beem.2011.06.007
4. Calvo MS, Lamberg-Allardt CJ. Vitamin D research and public health nutrition: a current perspective. Public Health Nutr. 2017;20(10):1713–1717. doi:10.1017/S1368980017001835
5. Yu S, Fang H, Han J, et al. The high prevalence of hypovitaminosis D in China: a multicenter vitamin D status survey. Medicine (Baltimore). 2015;94(8):e585. doi:10.1097/MD.0000000000000585
6. Forrest KY, Stuhldreher WL. Prevalence and correlates of vitamin D deficiency in US adults. Nutr Res. 2011;31:48–54. doi:10.1016/j.nutres.2010.12.001
7. De Pergola G, Martino T, Zupo R, et al. 25 Hydroxyvitamin D levels are negatively and independently associated with fat mass in a cohort of healthy overweight and obese subjects. Endocr Metab Immune Disord Drug Targets. 2019;19(6):838–844. doi:10.2174/1871530319666190122094039
8. De Pergola G, Nitti A, Bartolomeo N, et al. Possible role of hyperinsulinemia and insulin resistance in lower vitamin D levels in overweight and obese patients. Biomed Res Int. 2013;2013:921348. doi:10.1155/2013/921348
9. De Pergola G, Triggiani V, Bartolomeo N, et al. Low 25 hydroxyvitamin D levels are independently associated with autoimmune thyroiditis in a cohort of healthy overweight and obese subjects. Endocr Metab Immune Disord Drug Targets. 2018;18(6):646–652. doi:10.2174/1871530318666180406163426
10. Norman AW, Frankel JB, Heldt AM, Grodsky GM. Vitamin D deficiency inhibits pancreatic secretion of insulin. Science. 1980;209(4458):823–825. doi:10.1126/science.6250216
11. Kadowaki S, Norman AW. Dietary vitamin D is essential for normal insulin secretion from the perfused rat pancreas. J Clin Invest. 1984;73(3):759–766. doi:10.1172/JCI111269
12. Zittermann A. Vitamin D and disease prevention with special reference to cardiovascular disease. Prog Biophys Mol Biol. 2006;92(1):39–48. doi:10.1016/j.pbiomolbio.2006.02.001
13. Holick MF, Binkley NC, Bischoff-Ferrari HA, et al. Evaluation, treatment, and prevention of vitamin D deficiency: an Endocrine Society clinical practice guideline. J Clin Endocrinol Metab. 2011;96(7):1911–1930. doi:10.1210/jc.2011-0385
14. American Diabetes Association.Diagnosis. and classification of diabetes mellitus. Diabetes Care. 2013;36(Suppl 1):S67–S74. doi:10.2337/dc13-S067
15. Joint Committee for Developing Chinese guidelines on Prevention and Treatment of Dyslipidemia in Adults. [Guidelines for the prevention and treatment of dyslipidemia in Chinese adults]. Chin Circ J. 2016;31:937–952. Chinese.
16. Chinese Association Of Osteoporosis And Bone mineral Salt Disease. [Consensus on the clinical application of vitamin D and its analogs]. Chin J Osteoporosis Bone Miner Res. 2018;11:1–13. Chinese.
17. Zhang W, Stoecklin E, Eggersdorfer M. A glimpse of vitamin D status in Mainland China. Nutrition. 2013;29(7–8):953–957. doi:10.1016/j.nut.2013.01.010
18. Zhen D, Liu L, Guan C, Zhao N, Tang X. High prevalence of vitamin D deficiency among middle-aged and elderly individuals in northwestern China: its relationship to osteoporosis and lifestyle factors. Bone. 2015;71:1–6. doi:10.1016/j.bone.2014.09.024
19. Zhang L, Lu Y, Chen X, Liu M, Sun B, Li C. Correlation analysis between serum 25hydroxyvitamin D level and dyslipidemia in middle-aged and elderly population. Chin J Intern Med. 2016;10.
20. Lu H-K, Zhang Z, Ke YH, et al. High Prevalence of Vitamin D Insufficiency in China: relationship with the Levels of Parathyroid Hormone and Markers of Bone Turnover. PLoS One. 2012;7(11).
21. Yan X, Thomson JS, Zhao R, et al. Vitamin D Status of Residents in Taiyuan, China and Influencing Factors. Nutrients. 2017;9(8):898. doi:10.3390/nu9080898
22. Akter S, Eguchi M, Kurotani K, et al. Serum 25-hydroxyvitamin D and metabolic syndrome in a Japanese working population: the Furukawa Nutrition and Health Study. Nutrition. 2017;36:26–32. doi:10.1016/j.nut.2016.02.024
23. Ke L, Graubard BI, Albanes D, et al. Hypertension, pulse, and other cardiovascular risk factors and vitamin D status in Finnish men. Am J Hypertens. 2013;26(8):951–956. doi:10.1093/ajh/hpt051
24. Souza WN, Aparicio-Ugarriza R, Bibiloni MM, et al. Better body composition and lipid profile can be associated with vitamin D status in Spanish elderly? The PHYSMED study. J Nutr Health Aging. 2017;21(10):1329–1336. doi:10.1007/s12603-017-0949-5
25. Nakhaee S, Ali Yaghoubi M, Zarban A, et al. Vitamin D deficiency and its associated risk factors in normal adult population of Birjand, Iran. Clin Nutr ESPEN. 2019;32:113–117. doi:10.1016/j.clnesp.2019.04.002
26. Bettencourt A, Boleixa D, Reis J, et al. Serum 25-hydroxyvitamin D levels in a healthy population from the North of Portugal. J Steroid Biochem Mol Biol. 2018;175:97–101. doi:10.1016/j.jsbmb.2016.11.005
27. Pittaway JK, Ahuja KD, Beckett JM, Bird ML, Robertson IK, Ball MJ. Make vitamin D while the sun shines, take supplements when it doesn’t: a longitudinal, observational study of older adults in Tasmania, Australia. PLoS One. 2013;8(3):e59063. doi:10.1371/journal.pone.0059063
28. Yin X, Sun Q, Zhang X, et al. Serum 25(OH)D is inversely associated with metabolic syndrome risk profile among urban middle-aged Chinese population. Nutr J. 2012;11:68. doi:10.1186/1475-2891-11-68
29. Szternel L, Krintus M, Bergmann K, Derezinski T, Sypniewska G. Association between fasting glucose concentration, lipid profile and 25(OH)D status in children aged 9(-)11. Nutrients. 2018;10(10):1359. doi:10.3390/nu10101359
30. Diaz GM, Gonzalez L, Ramos-Trautmann G, Perez CM, Palacios C. Vitamin D status is associated with metabolic syndrome in a clinic-based sample of hispanic adults. Metab Syndr Relat Disord. 2016;14(5):259–264. doi:10.1089/met.2015.0117
31. Jiang X, Peng M, Chen S, Wu S, Zhang W. Vitamin D deficiency is associated with dyslipidemia: a cross-sectional study in 3,788 subjects. Curr Med Res Opin. 2019;35(6):1059–1063. doi:10.1080/03007995.2018.1552849
32. Huang CY, Chang HH, Lu CW, Tseng FY, Lee LT, Huang KC. Vitamin D status and risk of metabolic syndrome among non-diabetic young adults. Clin Nutr. 2015;34(3):484–489. doi:10.1016/j.clnu.2014.05.010
33. Delvin EE, Lambert M, Levy E, et al. Vitamin D status is modestly associated with glycemia and indicators of lipid metabolism in French-Canadian children and adolescents. J Nutr. 2010;140(5):987–991. doi:10.3945/jn.109.112250
34. Lu L, Yu Z, Pan A, et al. Plasma 25-hydroxyvitamin D concentration and metabolic syndrome among middle-aged and elderly Chinese individuals. Diabetes Care. 2009;32(7):1278–1283.
35. Kim MK, Il Kang M, wang Oh K, et al. The association of serum vitamin D level with presence of metabolic syndrome and hypertension in middle-aged Korean subjects. Clin Endocrinol (Oxf). 2010;73(3):330–338. doi:10.1111/j.1365-2265.2010.03798.x
36. Pittas AG, Lau J, Hu FB, Dawson-Hughes B. The role of vitamin D and calcium in type 2 diabetes.A systematic review and meta-analysis. J Clin Endocrinol Metab. 2007;92(6):2017–2029. doi:10.1210/jc.2007-0298
37. Wang JH, Keisala T, Solakivi T, Minasyan A, Kalueff AV, Tuohimaa P. Serum cholesterol and expression of ApoAI, LXRbeta and SREBP2 in vitamin D receptor knock-out mice. J Steroid Biochem Mol Biol. 2009;113(3–5):222–226. doi:10.1016/j.jsbmb.2009.01.003
38. Viljakainen HT, Vaisanen M, Kemi V, et al. Wintertime vitamin D supplementation inhibits seasonal variation of calcitropic hormones and maintains bone turnover in healthy men. J Bone Miner Res. 2009;24(2):346–352. doi:10.1359/jbmr.081009
39. Wang CM, Chang CS, Chang YF, et al. Inverse relationship between metabolic syndrome and 25-Hydroxyvitamin D concentration in elderly people without vitamin D deficiency. Sci Rep. 2018;8(1):17052. doi:10.1038/s41598-018-35229-2
40. Kwon HN, Lim H. Relationship between serum vitamin D status and metabolic risk factors among Korean Adults with prediabetes. PLoS One. 2016;11(10):e0165324. doi:10.1371/journal.pone.0165324
41. Hansen CS, Fleischer J, Vistisen D, Ridderstrale M, Jensen JS, Jorgensen ME. High and low vitamin D level is associated with cardiovascular autonomic neuropathy in people with Type 1 and Type 2 diabetes. Diabet Med. 2017;34(3):364–371. doi:10.1111/dme.13269
42. Jiang X, Liu X, Wu S, et al. Metabolic syndrome is associated with and predicted by resting heart rate: a cross-sectional and longitudinal study. Heart. 2015;101(1):44–49. doi:10.1136/heartjnl-2014-305685
 © 2020 The Author(s). This work is published and licensed by Dove Medical Press Limited. The
full terms of this license are available at https://www.dovepress.com/terms
and incorporate the Creative Commons Attribution
- Non Commercial (unported, 3.0) License.
By accessing the work you hereby accept the Terms. Non-commercial uses of the work are permitted
without any further permission from Dove Medical Press Limited, provided the work is properly
attributed. For permission for commercial use of this work, please see paragraphs 4.2 and 5 of our Terms.
© 2020 The Author(s). This work is published and licensed by Dove Medical Press Limited. The
full terms of this license are available at https://www.dovepress.com/terms
and incorporate the Creative Commons Attribution
- Non Commercial (unported, 3.0) License.
By accessing the work you hereby accept the Terms. Non-commercial uses of the work are permitted
without any further permission from Dove Medical Press Limited, provided the work is properly
attributed. For permission for commercial use of this work, please see paragraphs 4.2 and 5 of our Terms.