Back to Journals » Diabetes, Metabolic Syndrome and Obesity » Volume 12
Vitamin D receptor rs7975232, rs731236 and rs1544410 single nucleotide polymorphisms, and 25-hydroxyvitamin D levels in Egyptian children with type 1 diabetes mellitus: effect of vitamin D co-therapy
Authors Ahmed AEA ![]() , Sakhr HM
, Sakhr HM ![]() , Hassan MH
, Hassan MH ![]() , El-Amir MI
, El-Amir MI ![]() , Ameen HH
, Ameen HH
Received 3 March 2019
Accepted for publication 4 April 2019
Published 14 May 2019 Volume 2019:12 Pages 703—716
DOI https://doi.org/10.2147/DMSO.S201525
Checked for plagiarism Yes
Review by Single anonymous peer review
Peer reviewer comments 2
Editor who approved publication: Professor Ming-Hui Zou
Video abstract presented by Ahmed El-Abd Ahmed.
Views: 1491
Ahmed El-Abd Ahmed,1 Hala M Sakhr,1 Mohammed H Hassan,2 Mostafa I El-Amir,3 Hesham H Ameen4
1Department of Pediatrics, Faculty of Medicine, South Valley University, Qena, Egypt; 2Department of Medical Biochemistry, Faculty of Medicine, South Valley University, Qena, Egypt; 3Department of Medical Microbiology and Immunology, Faculty of Medicine, South Valley University, Qena, Egypt; 4Department of Clinical Pathology, Faculty of Medicine, Al-Azhar University (Assiut Branch), Assiut, Egypt
Purpose: We aimed to examine the possible association role of vitamin D and vitamin D receptor (VDR) single nucleotide polymorphisms (SNPs) in type 1 diabetes mellitus (T1DM) development, glycemic control and complications among a cohort of Egyptian children.
Subjects and methods: A prospective case-control study has been conducted on 50 Egyptian children with T1DM who were comparable with 50 controls. Vitamin D and HbA1c were measured. VDR-SNPs [ApaI (rs7975232), TaqI (rs731236) and BsmI (rs1544410)] detection was done by polymerase chain reaction through restriction fragment length polymorphism (PCR-RFLP) technique. Vitamin D supplements were given to the included T1DM children with low vitamin D and reassessments of both HbA1c% and 25(OH)D serum levels were performed in those children three months later.
Results: Eighty percent of the included diabetic patients have poor glycemic control. Vitamin D was deficient in 68% and insufficient in 16% of diabetic patients. Significant improvements in both vitamin D and glycemic status among T1DM children, who have low vitamin D and received vitamin D supplementations. There were significantly negative correlations between serum levels of vitamin D with both HbA1c % (r= –0.358, P˂0.05) and daily insulin dose (r=−0.473, P˂0.05). Compared with controls, T1DM children presented more commonly with ApaI a allele (OR: 2.87; 95%CI: 1.39–5.91, P˂0.05) and BsmI b allele (OR: 4.38; 95%CI: 2.30–8.33, P˂0.05). TaqI t allele wasn’t significantly differing among patients and controls (P˃0.05). Aa+aa and Bb+bb genotypes were significantly higher among T1DM vs the controls (OR: 3.08;, 95%CI: 1.33–7.15, P˂0.05 and OR: 9.33; 95%CI: 3.61–24.17, P˂0.05respectively).
Conclusion: ApaI and BsmI were associated with risk of T1DM development among Egyptian children. Low vitamin D status was frequently occurring among T1DM with significant improvement in the glycemic control of such children when adding vitamin D supplements to the standard insulin therapy.
Keywords: vitamin D receptor single nucleotide polymorphisms, genomic DNA, vitamin D, type 1 diabetes mellitus, Egyptian children, vitamin D therapy
Introduction
Type 1 diabetes mellitus (T1DM) is an autoimmune disease characterized by multiple genetic and environmental factors which are implicated in disease pathogenesis.1 T1DM occurs due to destruction of beta cells of pancreas resulting in deficiency of insulin1 , is one of the most rapidly growing diseases, and is the most frequent type in childhood accounting for about two-thirds of newly diagnosed DM in patients ≤19 years old in the US.2 In Egypt, calculated age-adjusted T1DM incidence in 1996, 2006, and 2011 was 0.7, 2.0 and 3.1/105/year, respectively, while age-adjusted T1DM prevalence in the same years was 1.9, 15.5 and 26.8/105/year, respectively.3
Vitamin D (25(OH)D) plays an essential role as a transcription factor that regulates the insulin secretion from pancreatic beta cells through vitamin D receptor (VDR), which belongs to the nuclear hormone receptors superfamily.1,4 In addition, vitamin D has an immune-modulator function via enhancing the differentiation of monocytes and inhibiting the proliferation of lymphocytes and the secretion of cytokines5 Furthermore, vitamin D decreases the Fas expression and major histocompatibility complex (MHC) class I molecules with subsequent inhibition of pancreatic β-cell apoptosis.6,7 Polymorphisms of the VDR gene are accompanied by altered gene function or expression and was found to be associated with many autoimmune disorders in humans, but its role in T1DM pathogenesis is still unclear despite several studies.8,9
VDR gene is located on the chromosomes no. 12 and 14, with four commonly identified single nucleotide polymorphisms (SNPs) (ApaI, TaqI, BsmI and FokI).10–13 The focus of the present study was to investigate the possible associations between T1DM, its complications and glycemic control, and vitamin D status with SNPs in the VDR (ApaI, TaqI, and BsmI) and analysis of their distribution in a cohort of Egyptian children with T1DM. The present research was also to assesse the correlation between vitamin D and HbA1c, and to study the effect of vitamin D replacement therapy on glycemic control in relation to the studied genetic variants among T1DM children who exhibited vitamin D deficiency.
Patients and methods
Study design and participants
The current prospective case-control, hospital-based study, has been conducted on 50 Egyptian children with T1DM, who were diagnosed according to the American Diabetes Association for T1DM.14 They were recruited from the outpatients‘ pediatric clinics and inpatients‘ Pediatric Departments of the University Hospital, South Valley University, Qena, Egypt, which is a major tertiary referral centre in upper Egypt. The included pediatric patients were comparable with 50 unrelated healthy, age and sex matched children selected as controls. The recruitment of patients and controls in the present study was done in accordance with the guidelines laid down in the Declaration of Helsinki, and all children‘s parents were informed about the aim of the study and their written informed consent was obtained, after approval of the University Hospital Ethics Committee. The total duration of the study was one year, from December 1, 2017 to November 30, 2018. We adjusted the size of the sample to achieve 80% power and 5% confidence of significance (type 1 error).
The included patients who have vitamin D insufficiency received oral cholecalciferol 800 units daily for 3 months,15 while patients with vitamin D deficient children received 4,000 units of oral cholecalciferol daily for 3 months with calcium supplementation (50 mg/kg/day),16–19 and reassessments of both glycemic control (HbA1C) and vitamin D levels after 3 months were performed (Figure 1).
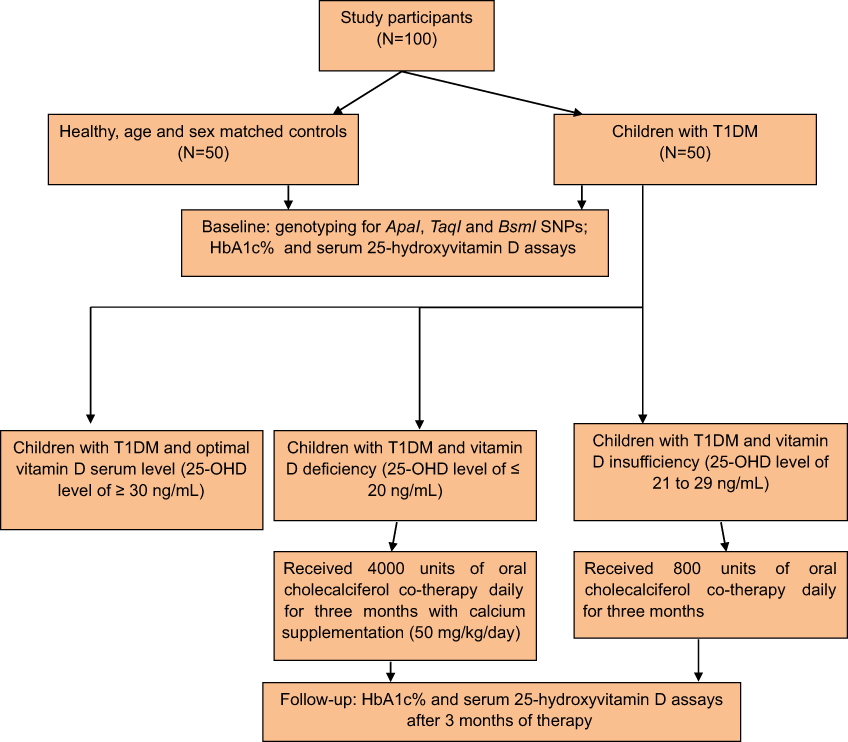 | Figure 1 Flowchart of the study participants and methodology. |

Children who received calcium or vitamin D supplements or glucocorticoids for the last 3 months or with renal or liver diseases or other nondiabetic related autoimmune disorders, or had undergone immunosuppressive therapy, any other systemic disease, were all excluded from the study.
Clinical evaluation of the included children
Detailed medical history was taken from every included patient’s parents in the form of age of the patient, age at onset of diabetes as determined by the time of the first insulin dose administration,20 duration of diabetes in years, family history of T1DM, type and doses of insulin therapy,21 history of diabetic ketoacidosis (DKA),22 medical history suggestive of associated autoimmune disease (as regards thyroid, Addison’s and celiac diseases), nutritional history, and symptoms of exercise intolerance or musculoskeletal pain and numbness.
Weight and height were recorded, and individual body mass index (BMI) was calculated (weight, kg/height, m2) both for patients and for controls and evaluated.23 Assessment of puberty in adolescent patients was done according to sexual maturity rating and cases of delayed puberty are identified as regards absence of breast development in girls more than 13 years old or testicular volume less than 4 ml in boys older than 14 years old.24 Complete general physical, systemic and neurological examination was conducted.
According to Glastras et al,25 prepubertal children with at least 5 years duration of diabetes or pubertal children with at least 2 years duration were screened for diabetic complications. For detection of retinopathy, fundus examination was performed after topical mydriatic application,26 by an experienced ophthalmologist, a morning urine sample for urinary albumin/creatinine ratio (UACR) and microalbumin assays was done to determine the presence or absence of microalbuminuria (30–300 mg/day) in at least two consecutive specimens for diabetic nephropathy screening.27 In addition, electrophysiological studies using multiple channel apparatus (MEB-9400, Nihon Kohden Inc, Tokyo, Japan), with the presence of at least two independent and abnormal neurophysiological nerve parameters as the criteria for peripheral nervous system involvement28 to confirm occurrence of diabetic neuropathy.
Laboratory workup
Blood samples
A total of 6 mL of peripheral blood venous samples were drawn from an antecubital vein which was divided into two vacutainer tubes. A total of 4 mL was collected on two EDTA tubes, 2 ml each, one was used for genotyping (stored at −80°C till time of analysis) and the other was used for HbA1C assay. The remaining 2 mL of venous blood was evacuated into serum separator gel tubes, where the samples were allowed to clot for 30 minutess at 37°C before centrifugation for 15 minutes at 3,500 rpm. Separated sera were used for vitamin D3 assays.
Biochemical assays
Vitamin D assays were performed using commercially available sandwich ELISA kit, supplied by Chongqing Biospes Co., Ltd (Chongqing, People’s Republic of China) with the catalog number: BYEK1472 using microplate ELISA reader (EMR−500, Labomed, Inc., LA, USA). Vitamin D deficiency was defined as a 25-OHD level of ≤20 ng/ml and vitamin D insufficiency as 21–29 ng/ml and optimal level as ≥30 ng/ml.29–32
HbA1c assays were done using cobas c311, Hitachi, Roche Diagnostics, Germany. The patients were considered as poor glycemic control when their HbA1c ˃8%, while those having their HbA1c≤8% were categorized as having good glycemic control.9
Three months later, HbA1C and Vitamin D assays were repeated for vitamin D deficient patients who received vitamin D replacement therapy in addition to the routine insulin therapy.
DNA extraction
Genomic DNA was extracted from the whole blood by using G-spinTM total DNA extraction kit protocol (iNtRON Biotechnology, Inc., Korea) according to the manufacturer’s protocol. The extracted DNA was stored at −20 °C for further genetic analysis.
VDR genotyping
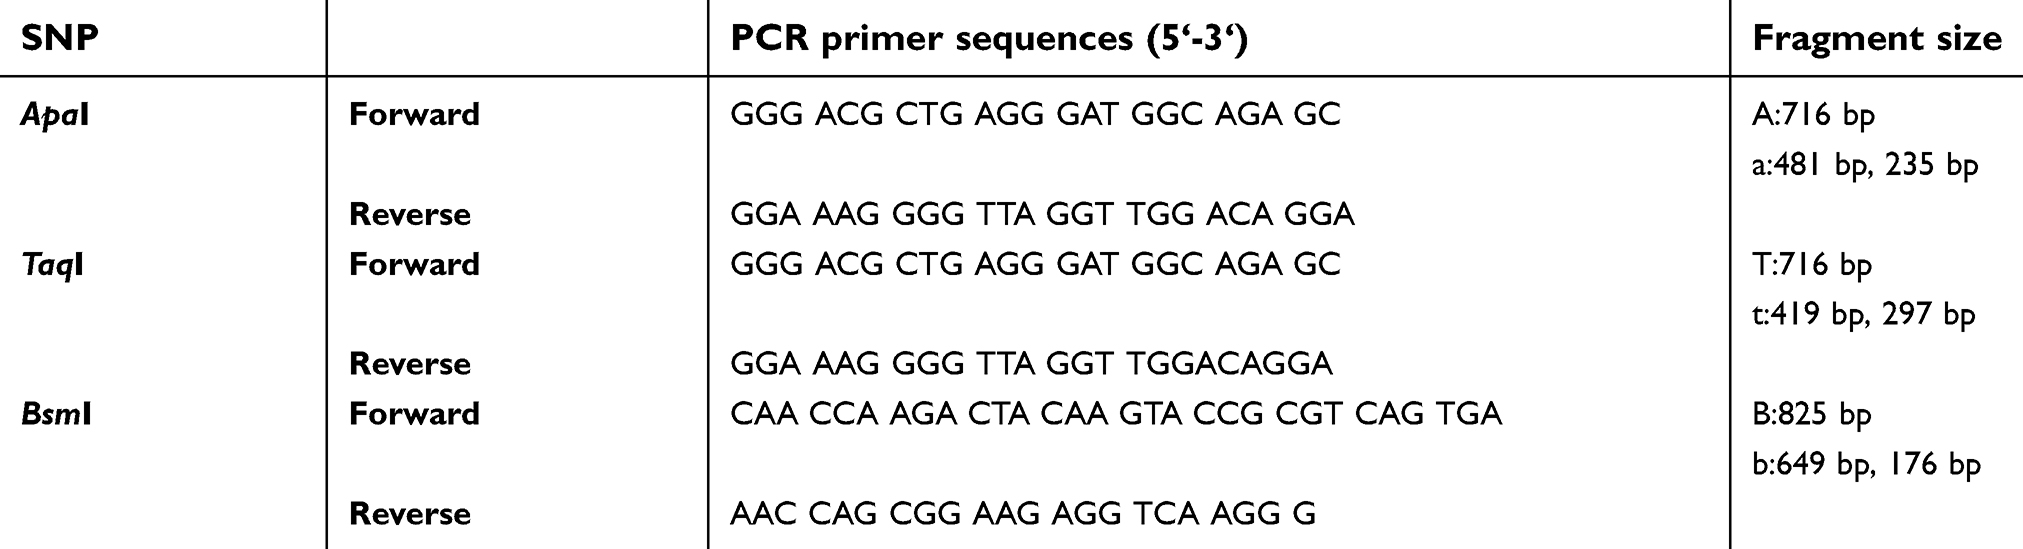
All the included children were genotyped using polymerase chain reaction-restriction fragment length polymorphism (PCR-RFLP), for three restriction sites in the VDR gene, ApaI (rs7975232), TaqI (rs731236), and BsmI (rs1544410) SNPs using specific primer sequences (Table 1), available at the PubMed (NCBI Reference Sequence: NG_008731.1), in concordance with previous protocols.9,33,34
 | Table 1 PCR primer sequences used to amplify VDR SNPs and length of DNA fragments of VDR gene polymorphism |
After mixing 25 μL from the PCR master mix solution (Catalog no. 25028, iNtRON Biotechnolog, Korea) with 1 μL forward primer, 1 μL reverse primer (both primers with concentration of 10 nmol), 21 μL nuclease free water, and 2 μL from the extracted DNA, the PCR condition used for ApaI and TaqI amplifications was as follows: 10 minutes of initial denaturation at 94°C, and the following temperature profile was used for 30 cycles as follows: 94°C for 1 minute, 62°C for 1 minute, 72°C for 1 minute, and a final extension of 5 minutes, using Biometra thermal cycler (serial no. 2603204, Biometra, Germany). The PCR products, (Figure 2), were 716-bp in size (for A or T alleles), using 50-bp DNA ladder (Catalog No. 24072, iNtRON Biotechnolog, Korea) and were digested using ApaI (Catalog No. ER 1411, Thermo Fisher Scientific, Waltham, MA, USA) and TaqI (Catalog No. R051S, Enzynomics Co., Ltd, Korea), where 10 μL of the PCR reaction mixture added to 2 μL of 10X buffer, 2 μL of the restriction enzyme and mixed with 18 μL nuclease-free water to be incubated at 37°C and 65°C for 2 hours respectively, then loaded in gel electrophoresis (serial no. 283BR11101, Bio-Rad-pac 300, Bio-Rad Laboratories Inc., Hercules, CA, USA), using 2% agarose gel stained with 5 μL ethidium bromide).
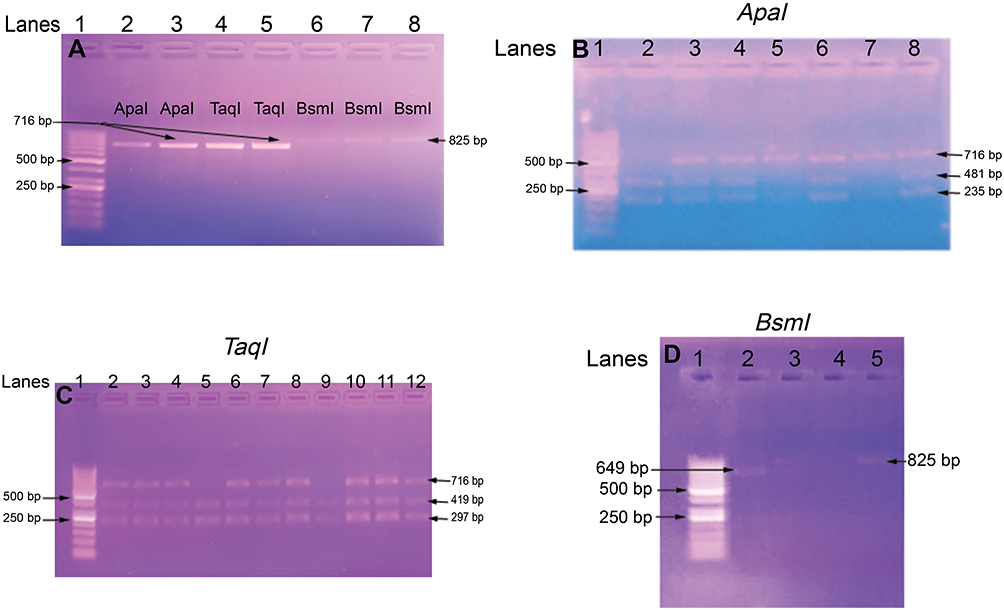 | Figure 2 Gel electrophoresis of the PCR products (A) Numbers refer to lanes. Lane 1 shows 50 bp DNA ladder. Lanes 2–5 showed amplified DNA segments of length 716 bp: Lanes 2 and 3 for ApaI alleles, Lanes 4 and 5 for Taq1 alleles (both have the same size 716 bp); Lanes 6, 7 and 8 for BsmI alleles (with DNA fragment size of 825 bp). Detection of ApaI polymorphism using PCR-RFLP method (B) Lane 1: 50 bp DNA ladder, Lane 2 mutant (235 bp and 481 bp) homozygote (aa), Lanes 3, 4, 6, and 8 are mutant heterozygote (Aa), Lanes 5, 7 are wild type homozygote (AA), nonmutant. Detection of Taq1 polymorphism using PCR-RFLP method (C) Lane 1: 50 bp DNA ladder, Lanes 5, 9: mutant (297 bp and 419 bp) homoozygote (tt), Lanes 2, 3, 4, 6, 7, 8, 10, 11, and 12 are mutant heterozygote (Tt). Detection of BsmI polymorphism using PCR-RFLP method (D) Lane 1: 50 bp DNA ladder, Lane 2: mutant (649 bp and 176 bp) homozygote (bb), Lane 3 is mutant heterozygote (Bb), Lane 5 is wild type homozygote (BB), nonmutant. |
Visualization of DNA fragments was done under ultraviolet light (using U.V. Transilluminator 2000, serial no. 642–1045, Bio-Rad Laboratories Inc.) using 50-bp DNA ladder. The ApaI restriction fragments lengths were 481 and 235-bp (mutant allele, a), while those for TaqI were 419 and 297-bp (mutant allele t). Thus the ApaI (rs7975232, NM_000376.2: c.1025-49G>T), located in intron 8 of VDR gene, results in T (variant “A”) changing into G (variant “a”); AA (TT); Aa (TG); Aa (GG),35 and the TaqI (rs731236, NM_000376.2: c.1056T>C), observed in exon 9, results in T(variant “T”) changing into C (variant “t”); TT (TT), Tt (TC), tt (CC),36 (Figure 2).
The PCR condition used for BsmI amplification as follows: 5 minutes of initial denaturation at 94°C, and the following temperature profile was used for 30 cycles as follows: 94°C for 1 minutes, 56°C for 1 minute, 72°C for 1 minute, and a final extension of 5 minutes. The PCR products were 825-bp long (B allele), and their digestion was performed using Mva12691 (BsmI, Catalog No. ER 0961, Thermo Fisher Scientific) via incubation at 37°C for 3 hours. The length of the restriction fragments were 649 and 176-bp (mutant allele, b), so the BsmI (rs1544410, NM_000376.2: c.1024+283G˃A), detected in itron 8, causes a changes of A (variant “B“) into G (variant ”b”); BB (AA), Bb (AG), bb (GG),37 (Figure 2).
Statistical analysis
Date entry and data analysis were done using SPSS version 22 (Statistical Package for Social Science). Data were presented as number, percentage, mean, standard deviation. Chi-squared test and Fisher's Exact test were used to compare qualitative variables. Independent t-test (unpaired t-test) was used to compare quantitative variables between two different groups and ANOVA test for more than two groups. Paired samples t-test was done to compare quantitative variables between before and after treatment within the same group. Pearson correlation was done to measure correlation between quantitative variables. P-value considered statistically significant when P<0.05. The studied SNPs were followed the Hardy–Weinberg (HW) equation.38,39
Results
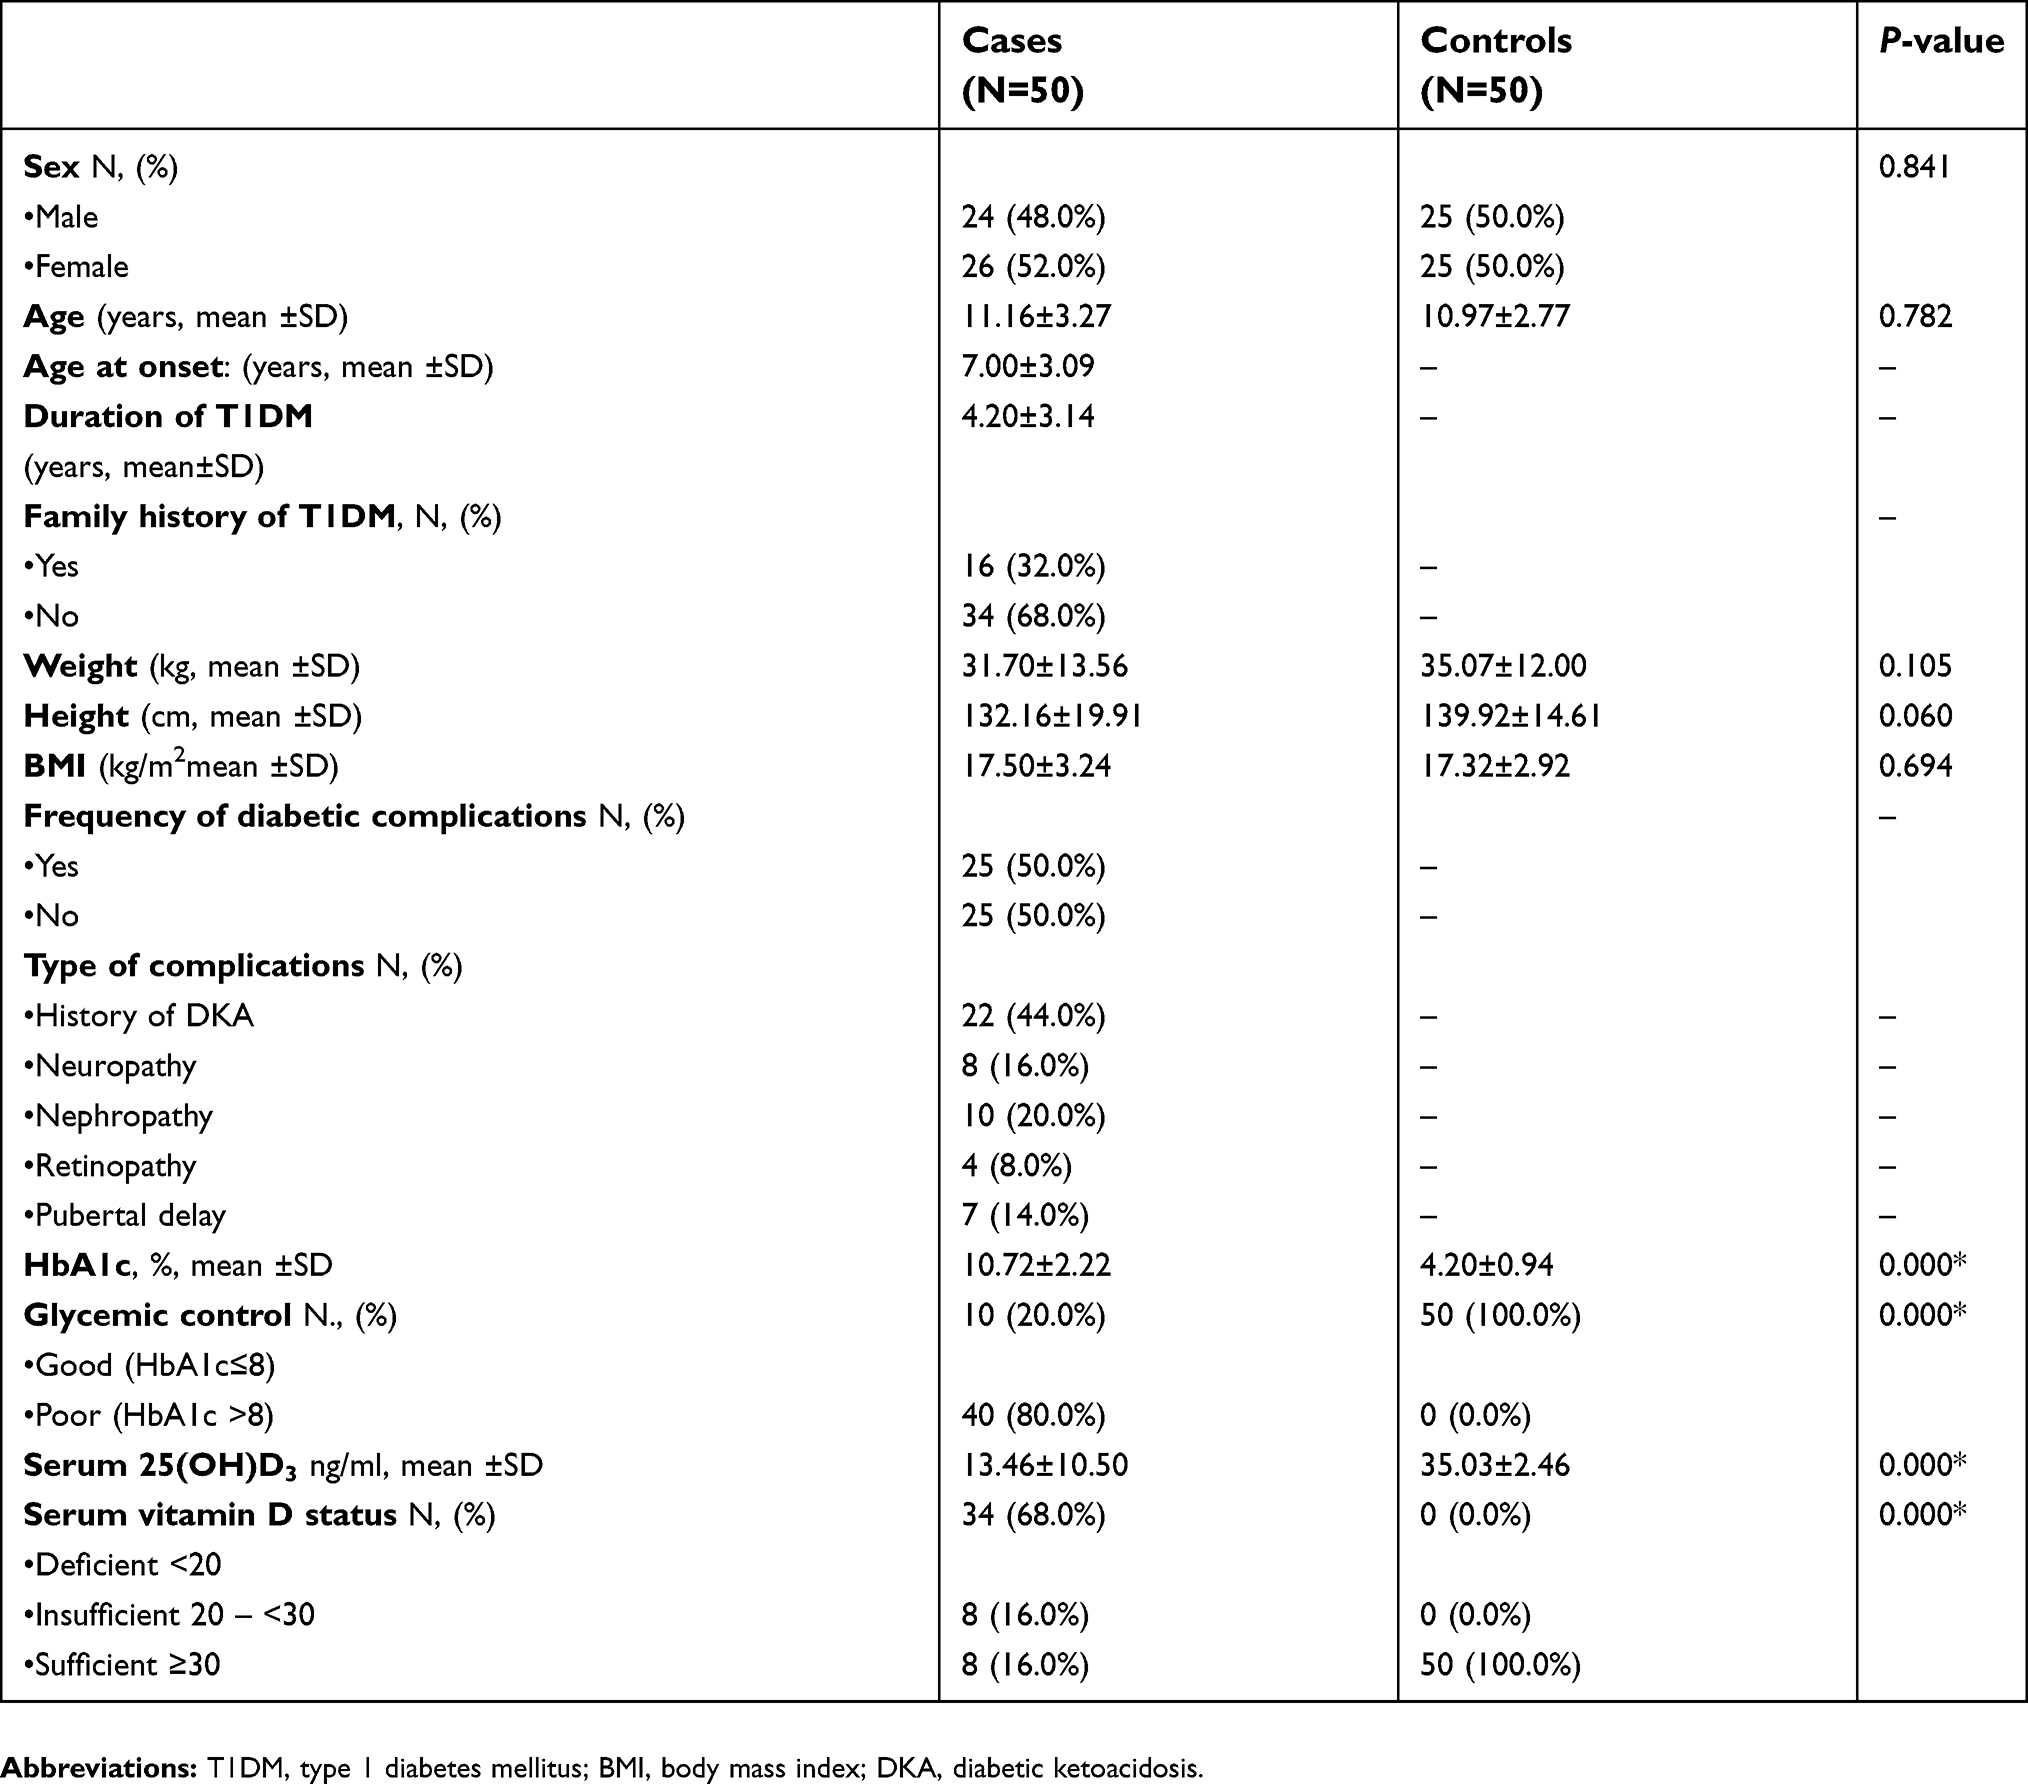
The present study included 50 children with T1DM, 24 males and 26 females, with a mean age of 11.16 years ±3.27 SD and a mean BMI of 17.50±3.24 SD. They were comparable to 50 healthy age, sex and BMI-matched children who were selected as controls; the control children (25 males and 25 females) had a mean age of 10.97 years ±2.77 SD and a mean BMI of 17.32±2.92 SD, which were not significantly different from those of the included cases (Table 2)
 | Table 2 Demographic, clinical and biochemical characteristics of the study groups |
Positive family history of T1DM was present in 16% of cases, while diabetic complications were frequent in 50% of the included patients with the highest frequency was for history of DKA (44%) and diabetic retinopathy was the less frequent complication (8%). Poor glycemic control was frequent in 80% of the included cases, and optimal serum vitamin D level was present in only 16% of patients with 68% of them had vitamin D deficiency and 16% had insufficient vitamin D status (Table 2).
Regarding mean ±SD of HbA1c and serum vitamin D among T1DM children in relation to glycemic control, vitamin D status, occurrence of diabetic complications and effect of vitamin D therapy, there was significantly lower (mean ±SD) serum vitamin D among T1DM with poor glycemic control (11.46±8.95 ng/ml) versus those with good glycemic control (21.48±12.80 ng/ml), also patients with diabetic complications exhibited significantly lower vitamin D serum levels (7.97±5.82 ng/ml) than those without diabetic complications (18.95±11.34 ng/ml). There was significantly higher HbA1c level (11.13±2.07%) among T1DM who have decreased vitamin D levels (mean insulin dose was 1.25 U/kg ±0.43), with nonsignificant difference between the vitamin D deficient and insufficient subgroups, when compared with those having normal level of vitamin D (8.56±1.75%), (mean insulin dose was 0.90 U/kg ±0.24), with P ˂0.05 for all (Table 3).
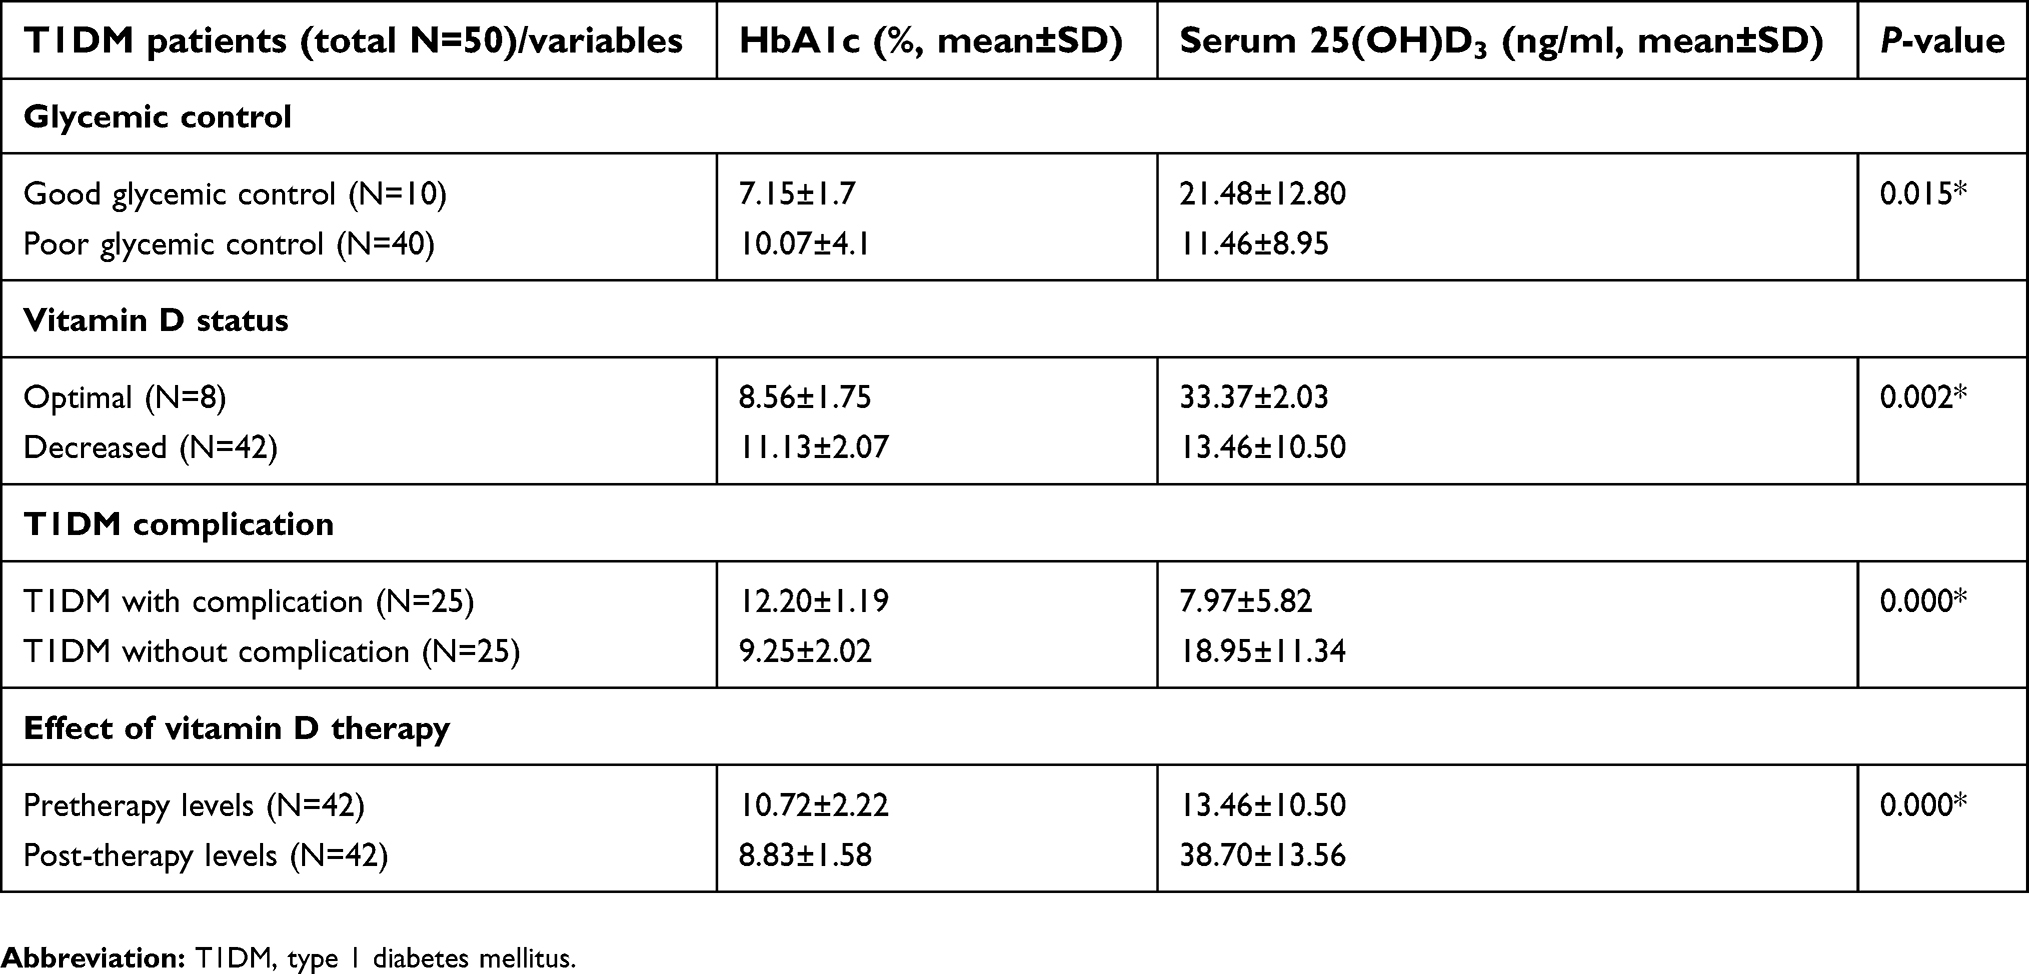 | Table 3 Mean ±SD of HbA1c and serum vitamin D among T1DM children in relation to glycemic control, vitamin D status, occurrence of diabetic complications and effect of vitamin D therapy |
Patients with low vitamin D and received vitamin D replacement therapy (N=42, 36 of them (85.7%) have poor glycemic control) exhibited significant decrease in their mean HbA1c % (pre-therapy =10.72±2.22% versus post-therapy =8.83±1.58%, with nonsignificant difference between the vitamin D deficient and insufficient subgroups) with significant improvement in their vitamin D serum levels (pre-therapy =13.46±10.50 ng/mL versus post-therapy=38.70±13.56 ng/mL, with nonsignificant difference between the vitamin D deficient and insufficient subgroups), with P˂0.05 for all (Table 3). Regarding vitamin D status in those patients, 36 out of 42 patients (85.7%) became sufficient after 3 months of vitamin D replacement therapy; 11 out of 36 (30.5%) exhibited good glycemic control after co-therapy with vitamin D.
Regarding to the correlations between serum 25(OH)D levels and some variables among patients‘ group, there were significantly negative correlations between serum levels of vitamin D with both HbA1c % (r= –0.358, P=0.011) and daily insulin requirement (r=−0.473, P=0.001), with nonsignificant correlations with BMI, age at onset or duration of DM (Figure 3).
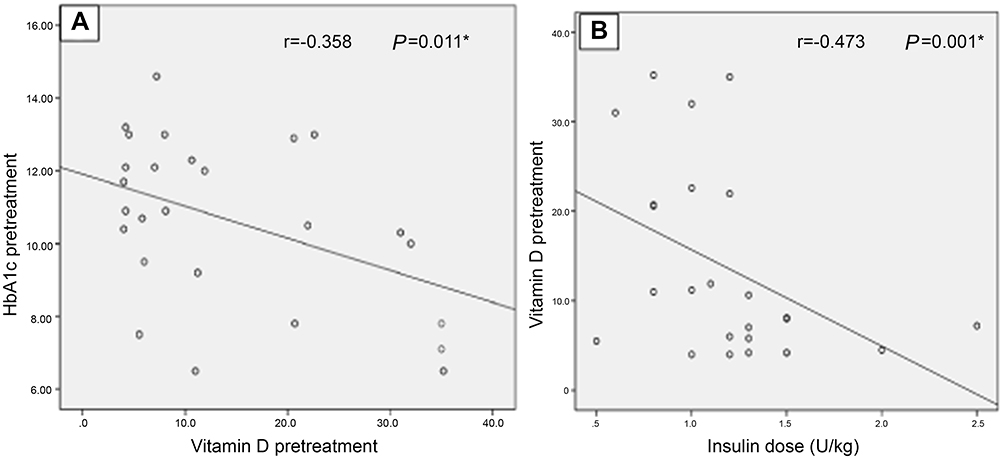 | Figure 3 Negative correlations between serum vitamin D with both HbA1c (A), and insulin dose requirements (B). |
The allelic and genotype frequencies of the VDR gene at ApaI, TaqI and BsmI polymorphic sites were evaluated in T1DM patients in comparison to the controls and were presented in Table 4 and Figure 4. Regarding to the genetic analysis, the frequencies of ApaI genotypes determined from T1DM children were 48% for AA and 52% for (Aa + aa), while in controls, the frequency of AA and Aa + aa were present in a percentage of 74% and 26% respectively, with significantly higher allelic frequency for (a) among patients vs controls (30% and 13% respectively) and significantly higher frequency for A allele among the controls vs the patients group (87% and 70%). This indicated that ApaI polymorphism is associated with an increased risk of T1DM (AA vs (Aa + aa): OR: 3.08; 95%CI: 1.33–7.15, P=0.008) also, A vs a (OR: 2.87; 95%CI: 1.39–5.91, P=0.003). For BsmI geneotypic frequencies, BB and (Bb + bb) were 16% and 84% respectively among T1DM while among the controls were 64% and 36% respectively, with significantly higher allelic frequency for (b) among T1DM vs the control group (49% and 18% respectively) together with significantly higher frequency for B allele among controls vs patients (82% and 51% respectively). Thus, Bb and bb genotypes, and b allele making the population at risk of T1DM development (BB vs (Bb+bb): OR: 9.33; 95%CI: 3.61–24.17, P=0.000; B vs.b (OR: 4.38; 95%CI: 2.30–8.33, P=0.000), (Table 4 and Figure 4).
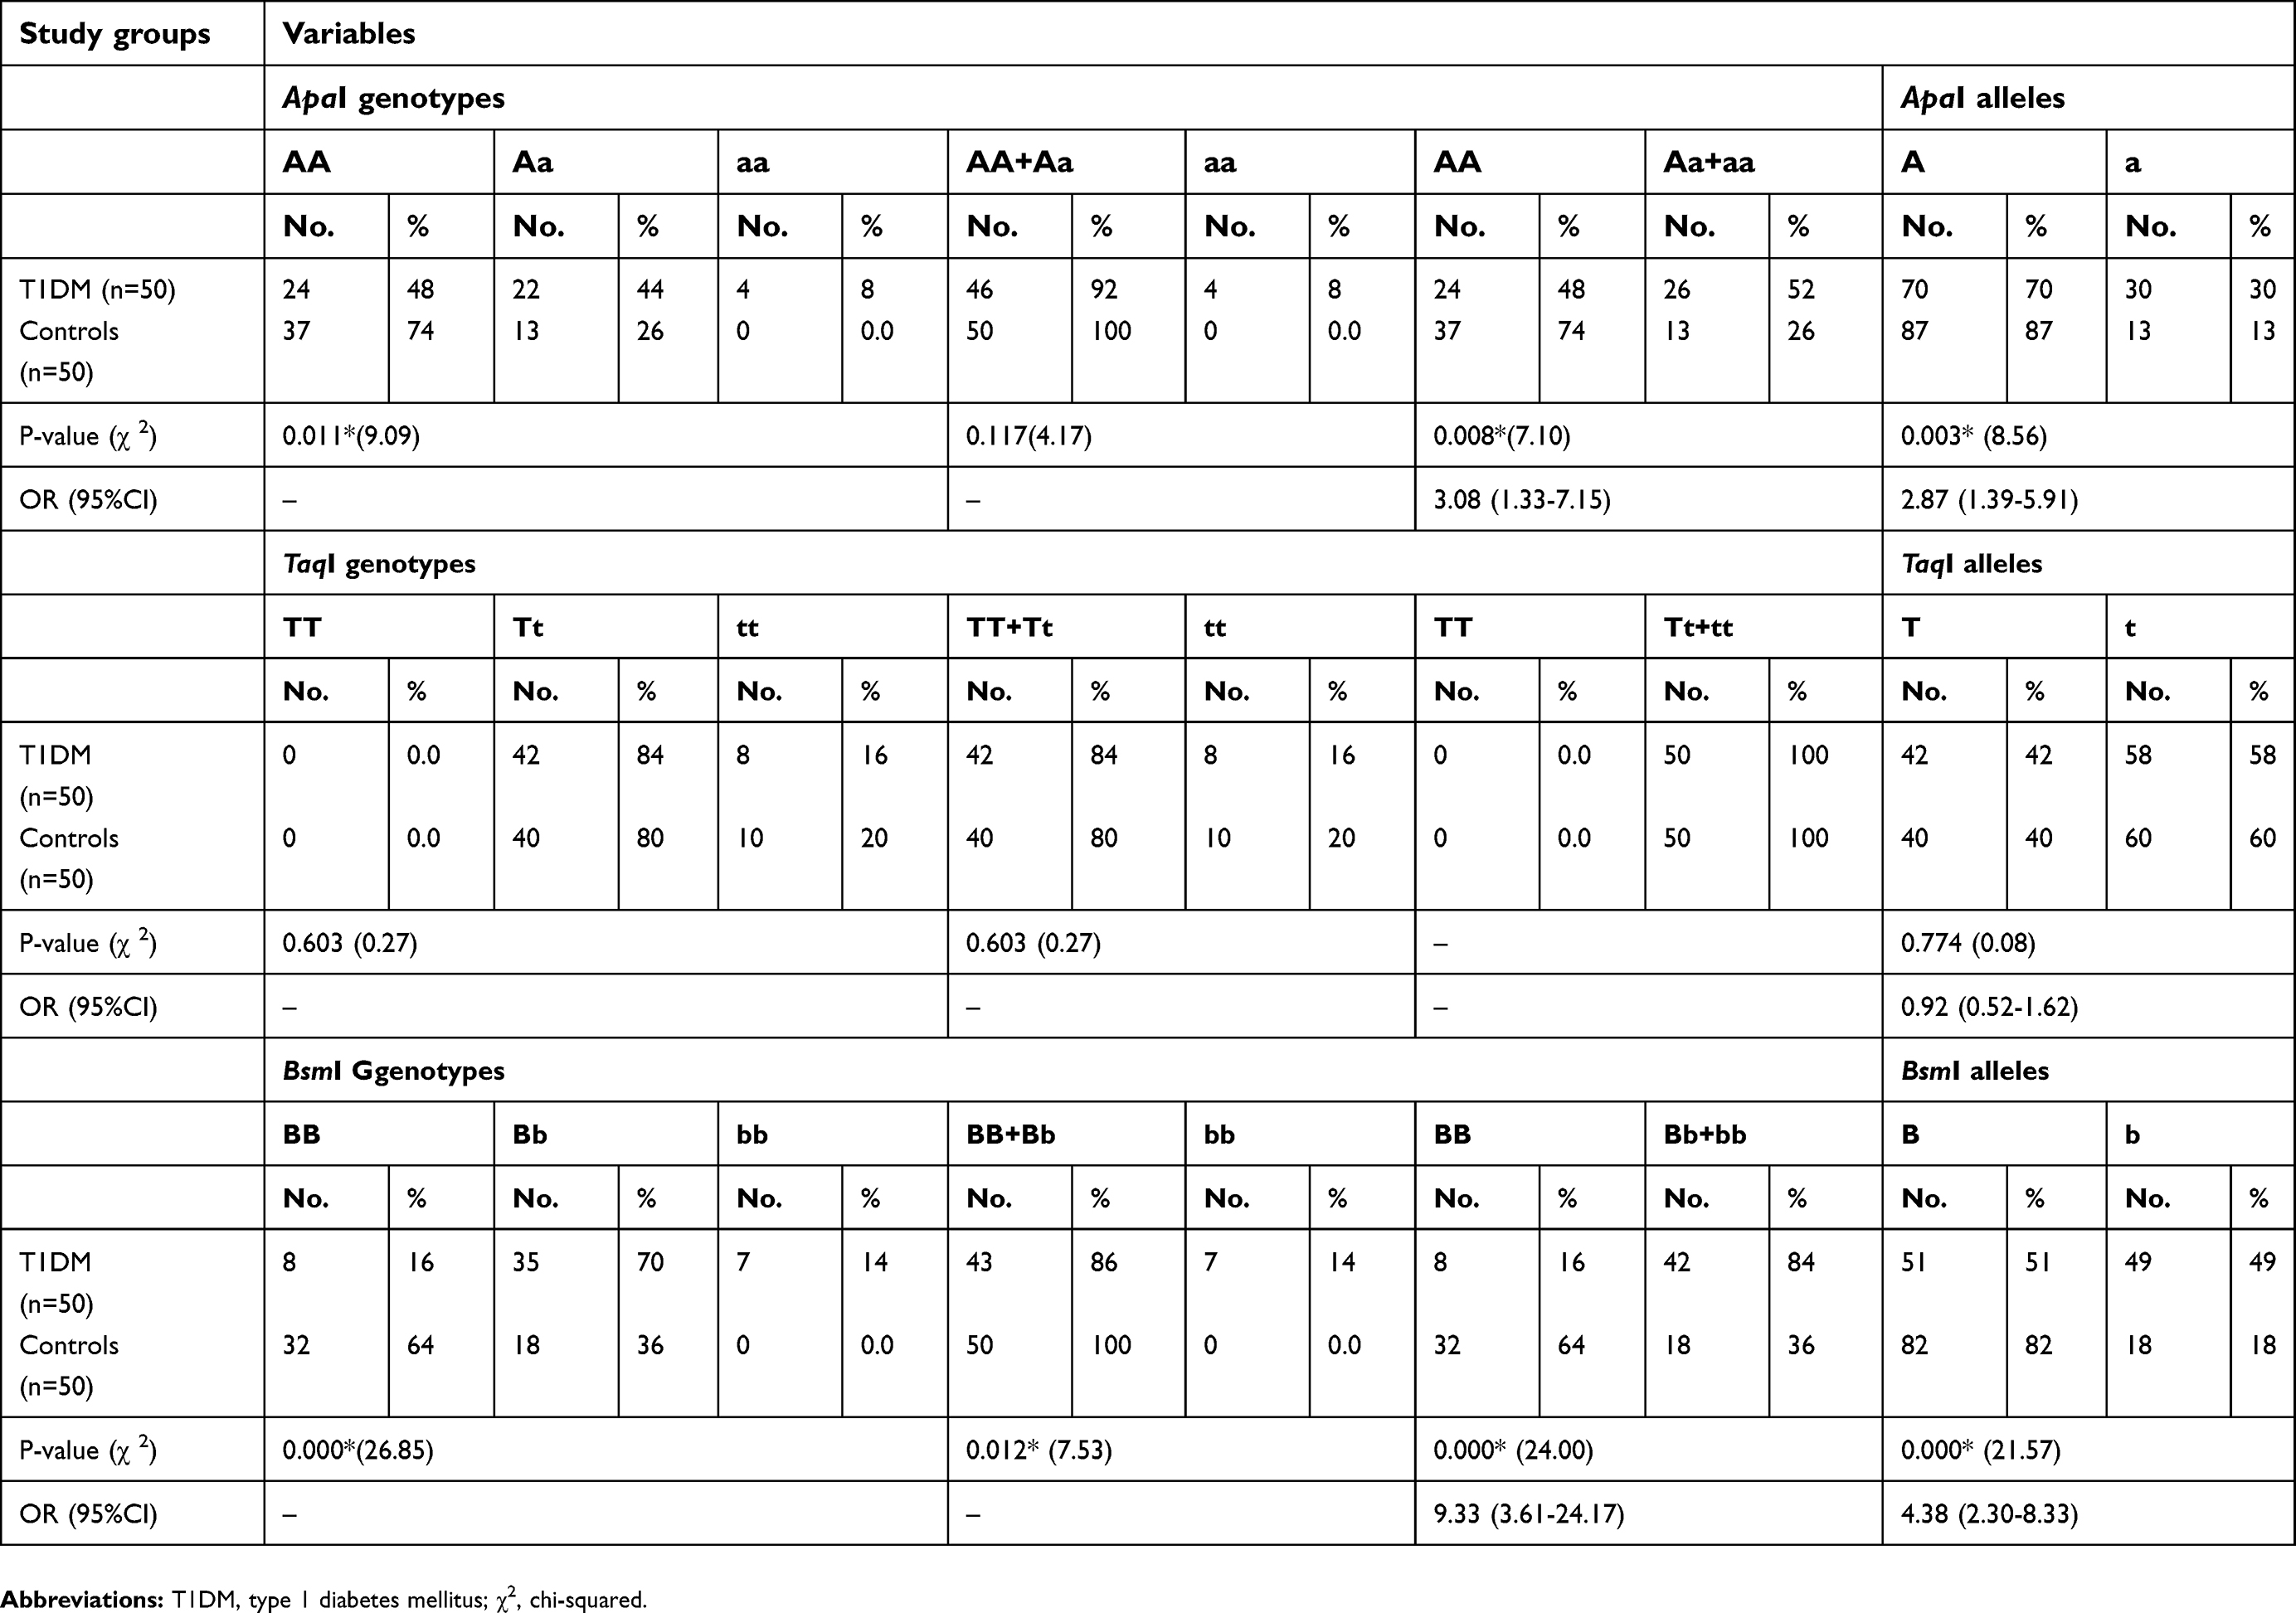 | Table 4 Genotypes and alleles frequencies of ApaI, TaqI and BsmI in T1DM patients in comparison to the controls |
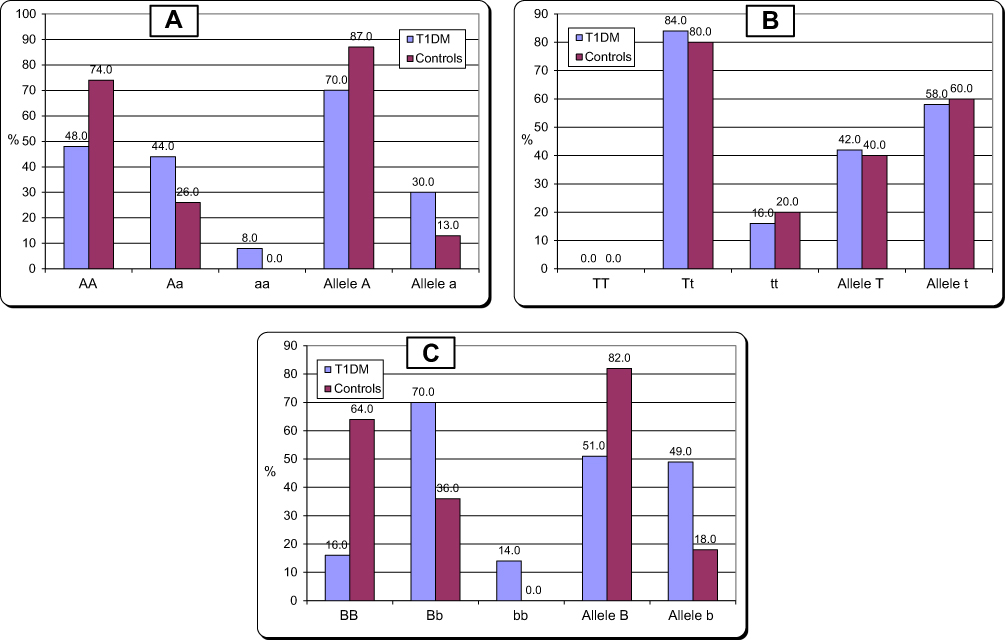 | Figure 4 Distribution of vitamin D receptor ApaI and alleles (A and a) genotypes (A); TaqI (B); BsmI (C) in patients with T1DM in comparison to the controls. Abbreviation: T1DM, type 1 diabetes mellitus. |
As regards TaqI polymorphisms, our study did not show any frequency for TT, with nonsignificant difference in the genotypic frequency of (Tt+tt) or allelic frequency (T and t) among T1DM patients (100%, 42% and 58% respectively) when compared with the control group (100%, 40% and 60% respectively), P˃0.05 for all, (Table 4 and Figure 4).
There were nonsignificant differences in the frequency of VDR polymorphisms among the patients group with regard to good or poor glycemic control, occurrence of complications and vitamin D status, mean ±SD of HbA1c and serum 25(OH)D, gender, family history and age at onset. Additionally, there were nonsignificant differences in the frequency of VDR polymorphisms in relation to the response to vitamin D replacement therapy using its effects on vitamin D and glycemic status among the patients' group, with P ˃0.05 for all.
Discussion
The exact etiology and natural history of T1DM are still undetermined, although both genetics and environmental factors contribute to its development.40 T1DM is considered as a T-cell mediated disease that completely destroys the body's ability to synthesize and secrete insulin associated with pancreatic β cells apoptosis.41,42 Vitamin D plays an immune-modulatory effects in T1DM prevention,43 as it decreases the proinflammatory cytokines expression involved in T1DM pathogenesis, thus pancreatic β cells became less prone to inflammation with subsequent reduction in T-cell recruitment and infiltration, and suppression of the autoimmune process with immune tolerance.44
The findings of the current study regarding serum vitamin D among T1DM revealed that 84% of cases have abnormally low vitamin D status (vitamin D deficiency and insufficiency). This was in line with Abd-Allah et al,45 who reported that 75% of T1DM exhibited vitamin D deficiency or insufficiency among Egyptian children with T1DM. Liu et al,46 in their meta-analysis study suggested that low vitamin D level is associated with T1DM in children. Also, Rasoul et al,47 reported significant frequency of vitamin D insufficiency and deficiency among T1DM children and concluded that serum vitamin D status is a major contributor in T1DM prevalence among Kuwaiti children. Additionally, Liu et al,48 and Alshawi et al,49 both reported significantly lower 25(OH)D serum levels among children with T1DM in comparison with the controls. The immunomodulatory effects of vitamin D are well-known in preventing T1DM development proved by in vitro inhibition of apoptosis induced by cytokines in the pancreatic islets of humans.7
The findings of the current study revealed more significantly decreased vitamin D levels among those having poor glycemic control. Additionally, T1DM children with low vitamin D serum levels required a higher daily insulin dose than those with normal levels of vitamin D. In agreement, Savastio et al,50 reported significant higher insulin requirements and HbA1c among T1DM with vitamin D deficiency than those with normal vitamin D status.
Our results showed significantly lower vitamin D among children with T1DM who developed diabetic complications, in the form of recurrent DKA, diabetic neuropathy, diabetic nephropathy, diabetic retinopathy and pubertal delay, than those with uncomplicated T1DM. Vitamin D is essential for maintenance of normal renal podocyte health. Vitamin D insufficiency and deficiency may contribute to the pathogenesis of albuminuria and the progression of kidney disease.51,52 In line with our findings, Peng and Li53 reported significant lower serum 25(OH)D in patients with diabetes with diabetic nephropathy (DN) compared with those without DN with significant negative correlation of serum 25(OH)D with albumin:creatinine ratio.
Also vitamin D plays a role in the pathogenesis of diabetic retinopathy as evidenced by its potent inhibitory effect on retinal neovascularization in mouse model with oxygen induced ischemic retinopathy.54 Since vitamin D receptors are extensively expressed in the retina.55 In agreement with the current study findings, Inukai et al56 reported significant lower serum vitamin D in patients with diabetic retinopathy when compared with those without diabetic microangiopathy.
Luo et al,57 in a meta-analysis study, concluded the presence of strong association between vitamin D deficiency and increased risk of diabetic nephropathy. Furthermore, vitamin D plays an essential promoter for secretion of nerve growth factor (NGF) which inturn regulates the sensitivity and phenotype of nociceptor fiberes, and its defective secretion results in clinical diabetic small nerve fiber neuropathy.58 Ozuguz et al59 reported significant positive correlation between serum NGF and vitamin D in T1DM patients with neuropathy, which confirms the mechanism of neuropathy in diabetic patients with vitamin D deficiency. In line with our results, Shillo et al60 suggested a possible role of vitamin D in the pathogenesis of diabetic neuropathy as evidenced in their study by reporting significant lower serum vitamin D levels in diabetic patients with peripheral neuropathy.
In addition, Huynh et al61 concluded that T1DM may disturb vitamin D metabolism among children or alternatively, vitamin D deficiency may contribute to risk of presentation with DKA as evidenced in their study by the presence of significant association between acidosis and low serum vitamin D. Also, Salvation et al50 reported a significant inverse correlation between vitamin D and DKA severity among T1DM.
Rodland et al62 reported altered regulatory mechanisms of vitamin D endocrine system among diabetic children at puberty with failure to attain an increase in the vitamin D normally seen during pubertal stages of maximal growth velocity confirming the involvement of vitamin D deficiency in occurrence of pubertal delay among T1DM children, which was consistent with our study results.
In our study, patients with low vitamin D and received vitamin D replacement therapy showed significant decrease in their HbA1c% with significant improvement in their vitamin D serum levels. In accordance, Savastio et al,50 Mohammadian et al,63 Buhary et al,64 Wierzbicka et al,65 Giri et al,66 Sharma et al,67 Dehkordi et al,68 Felício et al,69 Deda,70 noticed significant improvement in HbA1c% following vitamin D supplementation among these patients.
In the present study, there were significant negative correlations between serum levels of vitamin D with both HbA1c% and daily insulin requirement. These results were in agreement with many investigators,45,48,50,64,71 and they reported an inverse correlation between serum 25(OH)D and HbA1c in T1DM patients with poor gylcemic control among diabetic patients having vitamin D deficiency. Moreover, Savastio et al,50 reported significant negative correlation between vitamin D serum levels and daily insulin requirements among T1DM children. This suggests a mechanistic link between diabetes, vitamin D and diabetic complications. Vitamin D affects the insulin secretion and sensitivity and its deficiency may be linked to impaired glucose tolerance, diabetes predisposition and development.64,72,73
VDRs have been demonstrated to be expressed in many tissues including pancreatic β cells, making vitamin D acts as a potential direct modulator for the response of insulin to high blood glucose and indirect action via calcium homeostasis.74–76 Genotype of VDR appeared to be an important determining factor in individual susceptibility of developing T1DM.77,78
Notably, various studies have emerged recently to investigate possible association between VDR polymorphisms and T1DM, with conflicting results; some revealed significant associations, while, others failed to reach statistical significance.79
The results of the current study revealed statistically significant association between ApaI and BsmI polymorphisms allele and genotypic distributions and an increased risk of T1DM with nonsignificant association found regarding TaqI polymorphism. In agreement, two meta-analysis studies80,81 reported significant association of BsmI polymorphism with T1DM risk especially in East Asians, but with nonsignificant association for the other two polymorphisms. Lemos et al82 reported lack of association of any of the studied VDR-SNPS with susceptibility of T1DM in the Portuguese population. Similarly, Angel et al34 reported these findings among Chilean subjects. Mohammadnejad et al83 demonstrated that allele t was the risk allele for T1DM development among the Iranian population with nonsignificant associations between ApaI and BsmI SNPs and disease susceptibility. Bonakdaran et al84 reported significant higher genotype frequencies of both ApaI and BsmI in the patients group with nonsignificant difference regarding TaqI polymorphism between patients and controls in T1DM among children of the Khorasan Province, Islamic Republic of Iran. El-Kafoury et al85 reported nonsignificant difference for SNP BsmI in their study which included 60 T1DM patients comparable with 60 controls recruited from the Diabetes Clinic, Alexandria University Children’s Hospital, Egypt. Abd-Allah et al45 reported that BsmI Bb and bb genotypes were associated with T1DM risk with lack of association of VDR ApaI and TaqI polymorphisms with T1DM among sample of Egyptian children from Zagazig, Egypt. Cheon et al86 reported protective role of T and b TaqI and BsmI against T1DM in the Korean population with nonsignificant difference regarding ApaI. Khalid et al9 suggested that BsmI and TaqI SNPs confer T1DM susceptibility among Sudanese with nonsignificant difference regarding ApaI. Kandala and Abdul Ridha87 have concluded that VDR SNP BsmI may have significant effect on the occurrence of T1DM in the Iraqi population. Mukhtar et al88 reported significant association of allelic and genotypic frequencies of ApaI with T1DM risk, while TaqI did not depict any association with T1DM at allelic or genotypic levels among Pakistanis. The differences between the involved studies could attribute to ethnic differences related to VDR polymorphisms distributions, geographic differences, other environmental and genetic factors involved in T1DM pathogenesis.
To the best of our knowledge, studies traced in the literature regarding the association of VDR polymorphisms with diabetic complications among children with T1DM or the onset of the disease, family history, or gender were scarce, The current study revealed lack of association of SNPs of VDR with diabetic complications or vitamin D status or glycemic control or the onset of the disease, or family history, or gender. This was in agreement with Bonakdaran et al,84 who reported nonsignificant differences between the genotype frequencies and the onset pattern or chronic complications of T1DM. Nasreen et al1 reported nonsignificant association between VDR polymorphism and vitamin D levels.
Conclusion
VDR polymorphisms could be considered as an important risk factor in T1DM development among Egyptian children. In addition, serum vitamin D level should be regularly screened in children with T1DM to add benefits to T1DM children with abnormally low vitamin D status from the therapeutic effects of vitamin D supplements in both glycemic controls and postponing diabetic complications.
Limitations of the study
Lack of the long-term follow-up of T1DM children who have been received vitamin D supplements, regarding glycemic control and development of diabetic complications, which could be approached in further studies.
Disclosure
The authors report no conflicts of interest in this work.
References
1. Nasreen M, Lone KP, Khaliq S. Serum vitamin D levels and gene polymorphisms (Fok1 and Apa1) in children with type I diabetes and healthy controls. J Pak Med Assoc. 2016;66:1215–1220.
2. Lipton RB, Drum M, Burnet D, et al. Obesity at the onset of diabetes in an ethnically diverse population of children: what doesit mean for epidemiologists and clinicians? Pediatrics. 2005;115:e553.
3. El-Ziny MA, Salem NA, El-Hawary AK, et al. Epidemiology of childhood type 1 diabetes mellitus in Nile Delta, northern Egypt - a retrospective study. J Clin Res Pediatr Endocrinol. 2014;6:9–15.
4. Panierakis C, Goulielmos G, Mamoulakis D, et al. Vitamin D receptor gene polymorphisms and susceptibility to type 1 diabetes in Crete Greece. Clin Immunol. 2009;133:276–281.
5. Uitterlinden AG, Fang Y, Van Meurs JB, et al. Genetics and biology of vitamin D receptor polymorphisms. Gene. 2004;338:143.
6. Hahn HJ, Kuttler B, Mathieu C, et al. 1, 25- Dihydroxyvitamin D3 reduced MHC-antigen expression on pancreatic β-cells in vitro. Cell Transplant. 1996;5:60.
7. Riachy R, Vandewalle B, Moerman E, et al. 1, 25-Dihydroxyvitamin D3 protects human pancreatic islets against cytokine-induced apoptosis via down-regulation of the Fas receptor. Apoptosis. 2006;11:151–159.
8. Van Etten E, Verliden L, Giulietti A, et al. The vitamin D receptor gene FokI polymorphism: functional impact on the immune system. Eur J Immunol. 2007;37:395–405.
9. Khalid KE. Vitamin D receptor gene polymorphisms in Sudanese children with type 1 diabetes. AIMS Genet. 2016;3:167–176.
10. Miyamoto K, Kesterson RA, Yamamoto H, et al. Structural organization of the human vitamin D receptor chromosomal gene and its promoter. Mol Endocrinol. 1997;11:1165–1179.
11. Chang TJ, Lei HH, Yeh JI, et al. Vitamin D receptor gene polymorphism influences susceptibility to type 1 diabetes mellitus in the Taiwanese population. Clin Endocrinol. 2000;52:575–580.
12. Audí L, Martí G, Esteban C, et al. VDR gene polymorphism at exon 2 start codon (FokI) may have influenced type 1 diabetes mellitus susceptibility in two Spanish populations. Diabet Med. 2004;21:393–394.
13. Capoluongo E, Pitocco D, Concolino P, et al. Slight association between type 1 diabetes and “ff” VDR FokI genotype in patients from the Italian Lazio Region. Lack of association with diabetes complications. Clin Biochem. 2006;39:888–892.
14.
15. Pearce SHS, Cheetham TD. Diagnosis and management of vitamin D deficiency. Br Med J. 2010;340:142–147.
16. Huh SY, Gordon CM. Vitamin D deficiency in children and adolescents: epidemiology, impact and treatment. Rev Endocr Metab Disord. 2008;9:161–170.
17.
18. Hafez M, Hassan M, Musa N, et al. Vitamin D status in Egyptian children with type 1 diabetes and the role of vitamin D replacement in glycemic control. J Pediatr Endocrinol Metab. 2017;30:389–394.
19. Rusińska A, Płudowski P, Walczak M, et al. Vitamin D supplementation guidelines for general population and groups at risk of vitamin D deficiency in poland-recommendations of the polish society of pediatric endocrinology and diabetes and the expert panel with participation of national specialist consultants and representatives of scientific societies-2018 update. Front Endocrinol (Lausanne). 2018;9:246.
20.
21. Danne T, Phillip M, Buckingham BA, et al. ISPAD clinical practice consensus guidelines 2018: insulin treatment in children and adolescents with diabetes. Pediatr Diabetes. 2018;19:115–135.
22. Wolfsdorf JI, Allgrove J, Craig ME, et al.;
23.
24. Busiah K, Belien V, Dallot N, et al. Diagnosis of delayed puberty. Arch Pediatr. 2007;14:1101–1110.
25. Glastras SJ, Mohsin F, Donaghu KC. Complications of diabetes mellitus in childhood. Pediatr Clin North. 2005;52:1735–1753.
26. Demirel F, Tepe D, Kara O, et al. Microvascular complications in adolescents with type 1 diabetes mellitus. J Clin Res Pediatr Endocrinol. 2013;5:145–149.
27. Huang CY, Ting WH, Lo FS, et al. Factors associated with diabetic nephropathy in children, adolescents, and adults with type 1 diabetes. J Formos Med Assoc. 2017;116:924–932. doi:10.1016/j.jfma.2017.09.015
28. Hasani N, Khosrawi S, Hashemipour M, et al. Prevalence and related risk-factors of peripheral neuropathy in children with insulin- dependent diabetes mellitus. J Res Med Sci. 2013;18:132–136.
29. Kim TH, Lee BH, Lee HM, et al. Prevalenceof vitamin D deficiency in patients with lumbar spinal stenosis and its relationship with pain. Pain Physician. 2013;16:165–176.
30. Desoky T, Hassan MH, Fayed HM, et al. Biochemical assessments of thyroid profile, serum 25-hydroxycholecalciferol and cluster of differentiation 5 expression levels among children with autism. Neuropsychiatr Dis Treat. 2017;13:2397–2403.
31. Hassan MH, Ibrahim HM, El-Taieb MA. 25-Hydroxy cholecalciferol, anti-Müllerian hormone, and thyroid profiles among infertile men. Aging Male. 2018;22:1–7. [Epub ahead of print]. 10.1080/13685538.2018.1538338
32. Abd-Elmaged WM, Nada EA, Hassan MH, et al. Lesional and circulating levels of interleukin-17 and 25-hydroxycholecalciferol in active acne vulgaris: correlation to disease severity. J Cosmet Dermatol. 2018. doi:10.1111/jocd.12715 [[Epub ahead of print]].
33. Pani MA, Knapp M, Donner H, et al. Vitamin D receptor allele combinations influence genetic susceptibility to type 1 diabetes in Germans. Diabetes. 2000;49:504–507.
34. Angel B, Santos JL, Carrasco E, et al. Vitamin D receptor polymorphism and susceptibility to type 1 diabetes in Chilean subjects: a case-parent study. Eur J Epidemiol. 2004;19:1085–1087.
35. Faraco JH, Morrison NA, Baker A, et al. ApaI dimorphism at the human vitamin D receptor gene locus. Nucleic Acids Res. 1989;17:2150.
36. Morrison NA, Qi JC, Tokita A, et al. Prediction of bone density from vitamin D receptor alleles. Nature. 1994;367:284–287.
37. Morrison NA, Yeoman R, Kelly PJ, et al. Contribution of trans-acting factor alleles to normal physiological variability: vitamin D receptor gene polymorphism and circulating osteocalcin. Proc Natl Acad Sci U S A. 1992;89:6665–6669.
38. Hardy GH. Mendelian proportions in a mixed population. Science. 1908;28:49–50.
39. Stark AE. A clarification of the Hardy-Weinberg law. Genetics. 2006;174:1695–1697.
40. Banin PF, Rimondi A, De Togni S, et al. Type 1 diabetes (T1DM) in children and adolescents of immigrated families in Emilia-Romagna (Italy). Acta Biomed. 2010;81:35–39.
41. Cnop MN, Welsh JC, Jonas A, et al. Mechanisms of pancreatic beta-cell death in type 1 and type 2 diabetes: many differences, few similarities. Diabetes. 2005;54:97–107.
42.
43. van Etten E, Mathieu C. Immunoregulation by 1,25-dihydroxyvitamin D3: basic concepts. J Steroid Biochem Mol Biol. 2005;97:93–101.
44. Elsayed AM, Mohamed GA. Vitamin D deficiency and its correlation to hemoglobin A1C in adolescent and young adult type 1 diabetes mellitus patients. Aamj. 2016;14:76–80.
45. Abd-Allah SH, Pasha HF, Hagrass HA, et al. Vitamin d status and vitamin D receptor gene polymorphisms and susceptibility to type 1 diabetes in Egyptian children. Gene. 2014;536:430–434.
46. Liu C, Lu M, Xia X, et al. Correlation of serum vitamin d level with type 1 diabetes mellitus in children: a meta-analysis. Nutr Hosp. 2015;32(4):1591–1594.
47. Rasoul MA, Al-Mahdi M, Al-Kandari H, et al. Low serum vitamin-D status is associated with high prevalence and early onset of type-1 diabetes mellitus in Kuwaiti children. BMC Pediatr. 2016;16:95.
48. Liu C, Wang J, Wan Y, et al. Serum vitamin D deficiency in children and adolescents is associated with type 1 diabetes mellitus. Endocr Connect. 2018. Epub 2011 Oct 1.
49. Alshawi SM, Al-Agha AE, Althibiti GA, et al. Clinical presentations, glycemic control, complications, and associated autoimmune diseases among children and adolescents with type 1 diabetes in the western region of Saudi Arabia. Curr Pediatr Res. 2018;22:16–22.
50. Savastio S, Cadario F, Genoni G, et al. Vitamin D deficiency and glycemic status in children and adolescents with type 1 diabetes mellitus. PLoS One. 2016;11:e0162554.
51. de Boer IH, Ioannou GN, Kestenbaum B, et al. 25-Hydroxyvitamin D levels and albuminuria in the Third National Health and Nutrition Examination Survey (NHANES III). Am J Kidney Dis. 2007;50:69–77.
52. Zhang Z, Sun L, Wang Y, et al. Renoprotective role of the vitamin D receptor in diabetic nephropathy. Kidney Int. 2007;73:163–171.
53. Peng Y, Li LJ. Serum 25-hydroxyvitamin D level and diabetic nephropathy in patients with type 2 diabetes mellitus. Int Urol Nephrol. 2015;47:983–989.
54. Albert DM, Scheef EA, Wang S, et al. Calcitriol is a potent inhibitor of retinal neovascularization.. Investig Ophthalmol Vis Sci. 2007;48:2327–2334.
55. Taverna MJ, Selam JL, Slama G. Association between a protein polymorphism in the start codon of the vitamin D receptor gene and severe diabetic retinopathy in C-peptide-negative type 1 diabetes. J Clin Endocrinol Metab. 2005;90:4803–4808.
56. Inukai T, Fujiwara Y, Tayama K, et al. Alterations in serum levels of 1 alpha, 25(OH)2 D3 and osteocalcin in patients with early diabetic nephropathy. Diabetes Res Clin Pract. 1997;38:53–59.
57. Luo BA, Gao F, Qin LL. The association between vitamin D deficiency and diabetic retinopathy in type 2 diabetes: a meta-analysis of observational studies. Nutrients. 2017;9:
58. Anand P, Terenghi G, Warner G, et al. The role of endogenous nerve growth factor in human diabetic neuropathy. Nat Med. 1996;2:703–707.
59. Ozuguz U, Oruc S, Ulu MS, et al. Does vitamin D have any role in the improvement of diabetic peripheral neuropathy in type 1 diabetic patients? J Endocrinol Invest. 2016;39:1411–1417.
60. Shillo P, Selvarajah D, Greig M, et al. Reduced vitamin D levels in painful diabetic peripheral neuropathy. Diabet Med. 2019;36:44–51.
61. Huynh T, Greer RM, Nyunt O, et al. The association between ketoacidosis and 25(OH)-vitamin D levels at presentation in children with type 1 diabetes mellitus. Pediatr Diabetes. 2009;10:38–43.
62. Rødland O, Markestad T, Aksnes L, et al. Plasma concentrations of vitamin D metabolites during puberty of diabetic children. Diabetologia. 1985;28:663–666.
63. Mohammadian S, Fatahi N, Zaeri H, et al. Effect of vitamin d3 supplement in glycemic control of pediatrics with type 1 diabetes mellitus and vitamin d deficiency. J Clin Diagn Res. 2015;9:5–7.
64. Buhary BM, Almohareb O, Aljohani N, et al. Association of glycosylated hemoglobin levels with vitamin D status. J Clin Med Res. 2017;9:1013–1018.
65. Wierzbicka E, Szalecki M, Pludowski P, et al. Vitamin D status, body composition and glycemic control in Polish adolescents with type 1 diabetes. Minerva Endocrinol. 2016;41:445–455.
66. Giri D, Pintus D, Burnside G, et al. Treating vitamin D deficiency in children with type I diabetes could improve their glycaemic control. BMC Res Notes. 2017;10:465.
67. Sharma S, Biswal N, Bethou A, et al. Does vitamin D supplementation improve glycaemic control in children with type 1 diabetes mellitus? - A randomized controlled trial. J Clin Diagn Res. 2017;11:15–17.
68. Dehkordi EH, Dehkordi VH, Fatemi SMR, et al. Effect of vitamin D supplement therapy on HbA1C and IGF1 levels in children with type 1 diabetes mellitus and vitamin D deficiency. Electron J Gen Med. 2018;15:em69.
69. Felício KM, de Souza ACCB, Neto JFA, et al. Glycemic variability and insulin needs in patients with type 1 diabetes mellitus supplemented with vitamin D: a pilot study using continuous glucose monitoring system. Curr Diabetes Rev. 2018;14:395–403.
70. Deda L, Yeshayahu Y, Sud S, et al. Improvements in peripheral vascular function with vitamin D treatment in deficient adolescents with type 1 diabetes. Pediatr Diabetes. 2018;19:457–463.
71. Desy Wulandari HAC, Widjajanto E, Puryatni A. Low levels of vitamin D correlate with hemoglobin A1c and interleukin-10 levels in pediatric type 1 diabetes mellitus patients. J Trop Life Sci. 2014;4:182–186.
72. Hutchinson MS, Figenschau Y, Njolstad I, et al. Serum 25-hydroxyvitamin D levels are inversely associated with glycated haemoglobin (HbA(1c)). The Tromso Study. Scand J Clin Lab Invest. 2011;71:399–406.
73. Pittas AG, Nelson J, Mitri J, et al. Plasma 25-hydroxyvitamin D and progression to diabetes in patients at risk for diabetes: an ancillary analysis in the Diabetes Prevention Program. Diabetes Care. 2012;35:565–573.
74. Forouhi NG, Luan J, Cooper A, et al. Baseline serum 25- hydroxy vitamin D3 is predictive of future glycemic status and insulin resistance: the Medical Research Council Ely Prospective Study 1990–2000. Diabetes. 2008;57:2619–2625.
75. Wang Y, Zhu J, DeLuca HF. Where is the vitamin D receptor? Arch Biochem Biophys. 2012;523:123–133.
76. Kanakaraju K, Ranganathan RS, Shankar R. Correlation of vitamin D3 levels and the blood sugar parameters among the patients with type 2 diabetes mellitus. Int J Contemp Med Res. 2017;4:844–847.
77. Ban Y, Taniyama M, Yanagawa T, et al. Vitamin D receptor initiation codon polymorphism influences genetic susceptibility to type 1 diabetes mellitus in the Japanese population. BMC Med Genet. 2001;2:7.
78. Nejentsev S, Cooper JD, Godfrey L, et al. Analysis of the vitamin D receptor gene sequence variants in type 1 diabetes. Diabetes. 2004;53:2709–2712.
79. Lopera NG, Rodriguez A, Toro M, et al. VDR gene haplotypes associate with type 1 diabetes and suggest interaction with HLA, IL2RA and CTLA4 loci in Colombian Families. Curr Res Diabetes Obes J. 2018;6:555688. doi:10.19080/CRDOJ.2018.06.555688
80. Wang Q, Xi B, Reilly KH, et al. Quantitative assessment of the associations between four polymorphisms (FokI, ApaI, BsmI, TaqI) of vitamin D receptor gene and risk of diabetes mellitus. Mol Biol Rep. 2012;39:9405–9414.
81. Wang G, Zhang Q, Xu N, et al. Associations between two polymorphisms (FokI and BsmI) of vitamin D receptor gene and type 1 diabetes mellitus in Asian population: a meta-analysis. PLoS One. 2014;9:e89325.
82. Lemos MC, Fagulha A, Coutinho E, et al. Lack of association of vitamin D receptor gene polymorphisms with susceptibility to type 1 diabetes mellitus in the Portuguese population. Hum Immunol. 2008;69:134–138.
83. Mohammadnejad Z, Ghanbari M, Ganjali R, et al. Association between vitamin D receptor gene polymorphisms and type 1 diabetes mellitus in Iranian population. Mol Biol Rep. 2012;39:831–837.
84. Bonakdaran S, Abbaszadegan MR, Dadkhah E, et al. Vitamin D receptor gene polymorphisms in type 1 diabetes mellitus: a new pattern from Khorasan Province, Islamic Republic of Iran. East Mediterr Health J. 2012;18:614–619.
85. El-Kafoury AA, Haroun M, Embaby AM, et al. The association of polymorphic sites in some genes with type 1 diabetes mellitus in a sample of Egyptian children. Egypt J Med Hum Genet. 2014;15:265–272.
86. Cheon CK, Nam HK, Lee KH, et al. Vitamin D receptor gene polymorphisms and type 1 diabetes mellitus in a Korean population. Pediatr Int. 2015;57:870–874.
87. Kandala NJ, Abdul Ridha RH. Association of genetic polymorphisms in a sample of Iraqi patients with type1 diabetes mellitus. Int J Curr Microbiol Appl Sci. 2016;5:725–732.
88. Mukhtar M, Batool A, Wajid A, et al. Vitamin D receptor gene polymorphisms influence T1D susceptibility among Pakistanis. Int J Genom. 2017;2017:1–6. doi:10.1155/2017/4171254
 © 2019 The Author(s). This work is published and licensed by Dove Medical Press Limited. The
full terms of this license are available at https://www.dovepress.com/terms
and incorporate the Creative Commons Attribution
- Non Commercial (unported, 3.0) License.
By accessing the work you hereby accept the Terms. Non-commercial uses of the work are permitted
without any further permission from Dove Medical Press Limited, provided the work is properly
attributed. For permission for commercial use of this work, please see paragraphs 4.2 and 5 of our Terms.
© 2019 The Author(s). This work is published and licensed by Dove Medical Press Limited. The
full terms of this license are available at https://www.dovepress.com/terms
and incorporate the Creative Commons Attribution
- Non Commercial (unported, 3.0) License.
By accessing the work you hereby accept the Terms. Non-commercial uses of the work are permitted
without any further permission from Dove Medical Press Limited, provided the work is properly
attributed. For permission for commercial use of this work, please see paragraphs 4.2 and 5 of our Terms.