Back to Journals » Clinical Ophthalmology » Volume 12
Visual evoked potential repeatability using the Diopsys NOVA LX fixed protocol in normal older adults
Authors Trevino RC ![]() , Majcher CE, Henry AM
, Majcher CE, Henry AM ![]() , Rodriguez M
, Rodriguez M ![]() , Sponsel WE
, Sponsel WE
Received 22 February 2018
Accepted for publication 12 June 2018
Published 7 September 2018 Volume 2018:12 Pages 1713—1729
DOI https://doi.org/10.2147/OPTH.S166211
Checked for plagiarism Yes
Review by Single anonymous peer review
Peer reviewer comments 3
Editor who approved publication: Dr Scott Fraser
Richard C Trevino,1 Carolyn E Majcher,1 Adreain M Henry,1 Melinda Rodriguez,1 William E Sponsel1–3
1Rosenberg School of Optometry, University of the Incarnate Word, San Antonio, TX, USA; 2WESMDPA Baptist Medical Center Glaucoma Service, San Antonio, TX, USA; 3Department of Biomedical Engineering, University of Texas San Antonio, San Antonio, TX, USA
Purpose: The purpose of this study was to evaluate the intrasession and intersession repeatability of visual evoked potentials in normal adults over 40 years of age as recorded using the Diopsys NOVA LX fixed protocol.
Methods: Inclusion criteria were adults aged over 40 years with best corrected distance acuity of 20/40 or better in each eye. Subjects underwent three consecutive visual evoked potential examinations using the Diopsys NOVA LX fixed protocol. All examination procedures were carried out in accordance with the manufacturer recommendations. To assess intersession repeatability, nine subjects returned in 2–6 weeks for repeat examination.
Results: A total of 46 subjects were recruited. Mean ± SD age: 53±9 years (range: 40–84 years); 69% of subjects were female and 80% were non-white. Coefficients of variation (CVs) and intraclass correlation coefficients (ICCs) revealed greater repeatability for P100 latency (CV: 3%–7%; ICC: 0.39–0.76) than for P100 amplitude (CV: 21%–33%; ICC: 0.34–0.69) and greater repeatability for recordings made with high contrast stimuli (amplitude CV: 21%–23%; latency CV: 3%–7%) than low contrast stimuli (amplitude CV: 24%–33%; latency CV: 6%–7%). Minimum detectable change values ranged between 4.50 and 9.95 µv for amplitude and 8.16–15.26 ms for latency. Repeatability was not influenced by age, sex, or race.
Conclusion: The Diopsys NOVA LX fixed protocol demonstrated clinically acceptable intrasession and intersession repeatability in these healthy older adults, with latency being more repeatable than amplitude and examinations employing high contrast stimuli being more repeatable than those using low contrast stimuli.
Keywords: electrophysiology, visual evoked potential, glaucoma, repeatability
Introduction
Visual evoked potential (VEP) is an objective measure of visual function that assesses the electrical activity of the cerebral cortex using electrodes placed on the scalp while the subject views standardized visual stimuli.1,2 The amplitude and latency of the VEP waveforms are affected by various pathologic conditions of the visual pathway,3 including glaucoma.4–6 Although the conventional pattern-reversal VEP could be potentially useful for the detection of visual abnormalities, problems such as positioning of electrodes, limited repeatability, subjective analysis of the waveforms, and long test duration have mitigated against its use in clinical practice.5
Recent technological developments have made VEP assessment faster and resulted in a reduction in the overall cost of the necessary instrumentation. One such technological innovation is rapid acquisition of a transient pattern VEP by means of synchronized signal acquisition in combination with a post-processing technique that provides less subjectivity in waveform assessment7 and is sometimes referred to as the short duration transient VEP (SD-tVEP). These innovations include real-time electrode sensor status to measure the quality of the interface between the electrodes and the patients’ scalp and temporally locked data collection to increase the signal-to-noise ratio by preventing contamination of the relevant VEP frequency component from other frequency components in the response.8 In addition, a signal processing algorithm is used to extract the N75-P100-N135 complex from the recording and automate the assessment of P100 amplitude and P100 latency.5,9 This approach decreases test duration substantially and makes interpretation of test results more objective. The Diopsys® NOVA is an example of a device that uses this approach to record the VEP.
There is evidence that this accelerated VEP protocol may be useful in the evaluation of patients with glaucoma. Prata et al evaluated 25 patients with asymmetric glaucoma by using a modified Diopsys Enfant device and found that SD-tVEP results correlated with the level of visual field damage.5 They concluded that SD-tVEP may be a fast and objective method to assess functional damage in glaucomatous eyes. Pillai et al assessed the sensitivity and specificity of the Diopsys NOVA LX system at differentiating between 30 eyes of 30 healthy controls and 45 eyes of 35 patients with glaucoma ranging from mild to severe.8 They reported that the device had an overall sensitivity of 91.1% and specificity of 95.3% and concluded that it may be useful for early diagnosis of glaucoma. Waisbourd et al recently reported on their experience using a modified Diopsys Enfant NOVA system to differentiate between 42 healthy control eyes, 49 eyes with glaucoma, and 45 glaucoma suspect eyes.10 In distinguishing glaucomatous eyes from controls, they found area under the curve (AUC) values of 0.64–0.75 for P100 amplitude and 0.67–0.81 for P100 latency. They conclude that their findings support consideration of the SD-tVEP as an ancillary test in differentiating glaucomatous eyes from normal controls.
Reliability of a measurement tool is related to the degree that measurement error influences its results. The result of any measurement tool is composed of both the subject’s “true” result and measurement error. For a measurement tool to be considered reliable, the measurement error should not be detrimental to interpretation of measurement results.11 Test-retest reliability, also referred to as repeatability, is the degree of variation in repeat measurements made on the same subject under identical conditions. A highly repeatable measurement would indicate the stability of measurement error and facilitate the detection of true change by minimizing random variation.
Previous research has demonstrated clinically acceptable within-session and between-session repeatability of the VEP as recorded by the Diopsys NOVA device in young healthy Caucasian adults.7 As glaucoma is primarily a disease of older and non-Caucasian adults,12 its repeatability in this population is of considerable interest. We are not aware of any prior studies that have reported on the effect of age, sex, or race on VEP repeatability using this device. The purpose of this study was to evaluate the within-session and between-session repeatability of the VEP in predominantly non-Caucasian normal adults over 40 years of age using the Diopsys NOVA device.
Methods
This study was approved by the Institutional Review Board of the University of the Incarnate Word and adhered to the tenets of the Declaration of Helsinki. Written informed consent was obtained from all subjects after explanation of the nature of the study. All data were managed in accordance with the regulations set forth in the Health Insurance Portability and Accountability Act.
Subjects
Subjects for this study were recruited from the eye clinics of the Rosenberg School of Optometry, located in San Antonio, TX, USA. All adult patients over the age of 40 years presenting to our clinic for routine eye examinations were made aware of the study and invited to participate if they had normal ocular health. Forty-six normal subjects were enrolled (Table 1). The mean age was 53±9 years (range: 40–84 years) (Figure 1). There was no significant difference in mean age between male and female subjects (male: 54.9 years; female: 52.4 years, P=0.40). Thirty-one (69%) subjects were female and 35 (80%) were non-white. Hispanic race was reported by 26 (58%) subjects.
 | Table 1 Subject demographics comparing those who had a single examination and those who returned for a second examination |
 | Figure 1 Histogram of age for the entire cohort of subjects at the time of their first examination. |
Procedures
All examinations were performed using the Diopsys NOVA LX protocol VEP on a single Diopsys NOVA instrument (Diopsys Inc., Pine Brook, NJ, USA) running software version 2.18. Each examination was performed in the same clinical setting by one of the study authors by using manufacturer recommended examination protocols. The Diopsys LX protocol is a fixed protocol with multi-contrast stimuli that is designed to record a transient pattern VEP response. All settings were left at their default value. Details regarding the Diopsys LX VEP protocol have been published elsewhere5 and are briefly summarized here. The subject is positioned 1 m from a 17 inch LCD video monitor. All testing is performed monocularly with the subject corrected for the 1 m working distance. The device uses a three electrode setup. Disposable electroencephalogram (EEG) electrodes and commercially available skin preparation and EEG paste were used for recording the VEP. The active electrode is attached to the scalp at Oz (over the occipital cortex), the reference electrode is placed on Fz (at the center of the patient’s forehead), and the ground electrode is placed on Fp1 (on one side of the patient’s forehead just above the temple as close to the hairline as possible). The device software alerts the operator if electrode impedance is greater than 5 kΩ or differ by more than 20% between the electrodes. The electrodes were removed and reattached if impedance was outside the acceptable limits. The stimulus is a black and white checkerboard pattern that completely fills the 17 inch monitor and reverses at a rate of two reversals per second (1 Hz). Each check is a 58.2 minutes of arc square when viewed at 1 m. The examination sequence consists of an 8 s warm-up period followed by 15 s with a 15% Michelson contrast (low contrast) target with a mean luminance of 112 cd/m2, and finally 15 s with an 85% Michelson contrast (high contrast) target with a mean luminance of 66 cd/m2. It has been suggested that a low contrast stimulus may preferentially elicit VEP responses from the magnocellular pathway.13,14 The low contrast stimulus is not part of the ISCEV standard for clinical VEPs,2 but its inclusion may increase the sensitivity of the VEP in early detection of glaucoma.8 Excessive blinking or eye movements are recorded as artifacts. When artifacts are detected, the corresponding data are collected, but not signal averaged. Signal averaging resumes once movements that cause the artifacts cease. Excessive artifacts can result in the failure of the software to identify a P100 wave. Each stage of the examination was repeated once if the software failed to detect a P100 wave. If a P100 wave was not detected on repeat examination, amplitude and latency were assigned a null value for that trial and the next stage of the protocol commenced. The examination sequence was identical for each subject and consisted of testing the right eye first followed by the left eye. This is the instrument’s standard examination sequence for examining both the eyes. The P100 amplitude and latency as reported by the instrument’s intrinsic software were recorded for each trial (Figure 2). No attempt was made to validate these measurements, as our primary goal was to investigate their repeatability.
 | Figure 2 Representative VEP report generated by the Diopsys NOVA device. |
To assess within-session repeatability, the above protocol was repeated in its entirety (right eye followed by left eye) three consecutive times during a single office visit (RLRLRL order). The electrodes remained in place throughout. No rest period was provided between VEP recordings. To assess between-session reproducibility, nine subjects, chosen at random, were invited to return on a different day for a second office visit. At the second visit, which occurred within 2–6 weeks of the first visit, a different study team member repeated the study protocol.
For inclusion in this study, subjects were required to be over 40 years of age at the time of their examination. All subjects had recently undergone a comprehensive eye examination in our clinic and were found to have normal ocular health without evidence of prior eye disease that could affect the VEP. Visual acuity was correctable to at least 20/40 in each eye.
Exclusion criteria included any active ocular disease, intraocular surgery within the past 30 days in either eye, current or past history of glaucoma, history of seizure disorders, anything that could potentially interfere with the subject’s ability to sit still and pay full attention to the test stimulus, and any condition or abnormality that would be expected to influence the VEP or its accurate measurement to include, but not limited to nystagmus, amblyopia, history of retinal detachment, Alzheimer’s disease, multiple sclerosis, head trauma, or stroke.
Statistical analysis
The amplitude and latency of the P100 waveform as reported by the device were recorded for each of the two stimulus conditions (high contrast and low contrast), yielding a total of four outcome parameters for analysis: low contrast amplitude (LCA), low contrast latency (LCL), high contrast amplitude (HCA), and high contrast latency (HCL) for each eye (Figure 2).
Intrasession repeatability
The intrasession repeatability of each outcome parameter was analyzed using repeated measures one-way fixed-effect ANOVA with the Bonferroni correction. Data were examined for suitability for ANOVA using Mauchly’s test of sphericity, and the Greenhouse-Geisser correction was applied where required. The Shapiro–Wilk test was used to evaluate normality. The square root of the residual mean square from the ANOVA is reported as the within-subject standard deviation (Sw). The coefficient of variation (CV) was calculated as the ratio of Sw to the mean of each parameter and is expressed as a percentage of the mean.11 Intraclass correlation coefficients (ICC2,1) were calculated using a two-way mixed effects model for absolute agreement of single measures.15,16 Because ICC confidence intervals (CIs) can be influenced by data that deviate from a normal distribution,17 VEP data underwent log transformation prior to ICC calculation. ICC values ≥0.75 were considered to represent excellent reliability; values between 0.40 and 0.74 represented moderate reliability; and values <0.40 indicated poor reliability.18 Paired t-tests were used to identify significant differences between fellow eyes. Limits of agreement (LOAs) were calculated as the 95% CI (1.96 × SD) for paired right–left eye comparisons and graphed as described by Bland and Altman.19 Robust nonlinear regression with outlier removal (eliminated: Q=1%) was performed to detect the presence of a relationship between the magnitude of the parameter and the magnitude of the interocular difference.20 Unpaired two-sided t-test of the mean of the three trials was used to perform age, sex, and ethnic group comparisons. For purposes of age and racial group analysis, the cohort was partitioned into two groups. For age analysis, the older half of the cohort was compared to the younger half. Because self-reported Hispanic participants comprised over half of our participants, we compared their results to those of non-Hispanics. Two-way mixed model ANOVA was performed to identify differences in parameter repeatability among these participant subgroups.
Intersession repeatability
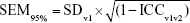
Student’s t-test and chi-squared test were used to test for difference in demographic characteristics and initial visit P100 parameters between those participants who returned for a second visit and those who did not. Paired two-sided t-tests were used to test for significant between-session differences in P100 parameters. Two-factor repeated measures ANOVA was performed to determine whether there was any interaction between the examination trials and the examination sessions. LOAs between the two examination sessions were calculated and graphed. Robust nonlinear regression with outlier removal (eliminated: Q=1%) was performed to detect the relationship between the magnitude of the parameter and the magnitude of the intersession difference.20 Between-session ICC2,1 was calculated using the corresponding examination trial from each session for each participant. For example, parameter values from the first trial at visit 1 were compared to values obtained from the first trial at visit 2. The standard error of measurement (SEM95%)16,21 was calculated as follows to estimate the variance of each parameter:
|
where SDv1 is the SD of the first visit and ICCv1v2 is the between-session ICC. To determine the magnitude of change necessary to provide confidence that an observed change in a parameter is not the result of random variation or measurement error, the minimum detectable change (MDC)16,22 of each parameter was derived as follows:
|
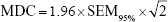
where 1.96 represents the z score associated with the 95% confidence level. We applied the below formula to convert our findings for each participant into decibels:
|
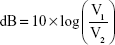
where V1 is the value of the parameter found at visit 1 and V2 is the value found at visit 2. Thus, a decline in the parameter from visit 1 to visit 2 is expressed as a positive decibel value. The SD of the decibel values across subjects for each P100 parameter was calculated as a measure of repeat reliability.
Statistical analyses were performed using SPSS Statistics version 24 (IBM Corporation, Armonk, NY, USA), Excel 2016 (Microsoft Corporation, Redmond, WA, USA), and Prism 6 (GraphPad Software, Inc., La Jolla, CA, USA). Unless otherwise specified, data are presented as mean ± SD deviation. A P-value of ≤0.05 is considered statistically significant.
Results
Intrasession repeatability
A total of 276 fixed protocol examinations were performed (46 subjects × 3 trials × 2 eyes) during the intrasession repeatability phase of the study. The rate of successful identification of a P100 waveform after each fixed protocol examination was 97% (134 of 138 trials) for low contrast examinations and 100% (138 of 138 trials) for high contrast examinations of right eyes. Success rates for left eyes were 95% (131 of 138 trials) and 99% (136 of 138) for low contrast and high contrast examinations, respectively.
Table 2 presents the mean P100 parameters for visit 1. Intrasession repeatability outcomes are reported in Table 3. One-way repeated measures ANOVA revealed two instances of statistically significant difference among the three consecutive trials (Figure 3). CV values were markedly lower for latency parameters (all <10%) than for amplitude parameters (all >20%). Also, CV values tended to be lower under high contrast test conditions than for the same parameter measured under low contrast test conditions. A similar pattern of lower variability under high contrast stimulus conditions was found with ICC2,1 analysis (Figure 4). In Figure 4, the findings from each of the three consecutive trails are plotted by subject. Vertical dotted lines are included for every other subject as a visual aid in segregating the data points by subject. Because ICC2,1 is a measure of within-subject reliability, more tightly clustered data points for each subject will produce higher ICC2,1 values despite significant variation between subjects. By applying the reliability criteria of Fleiss,18 amplitude reliability was found to be poor to moderate while using low contrast stimuli and was moderate while using high contrast stimuli. Latency reliability was poor under low contrast test conditions and excellent with high contrast stimuli.
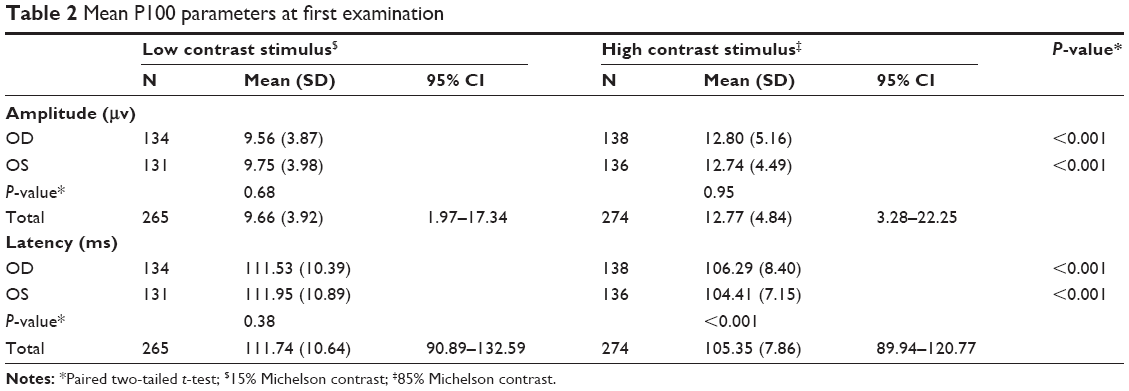 | Table 2 Mean P100 parameters at first examination |
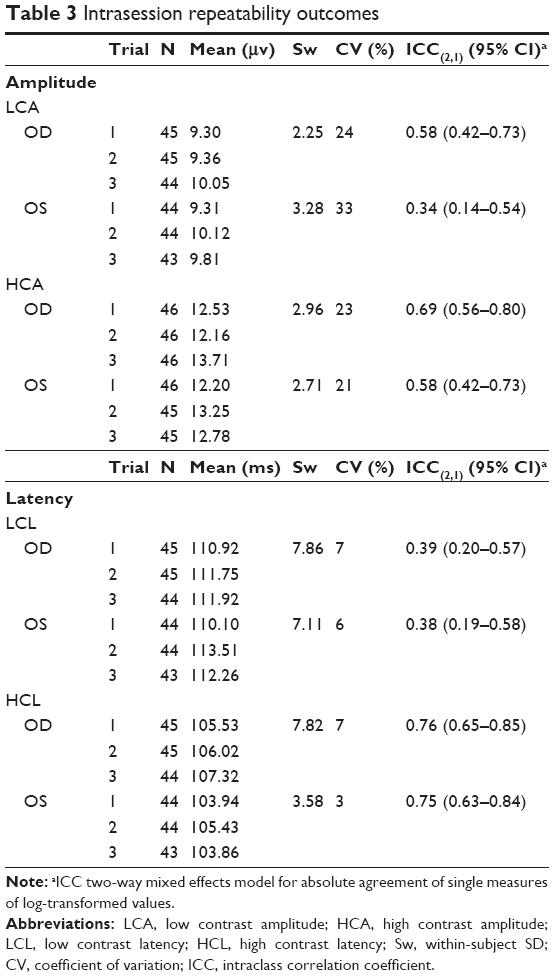 | Table 3 Intrasession repeatability outcomes |
 | Figure 3 Mean P100 parameters for each of the three trials at the first examination session. |
 | Figure 4 (A) Serial P100 amplitude recordings and (B) serial P100 latency recordings for each of the 46 subjects at the first examination. |
Interocular comparison is an important clinical means of detecting VEP abnormality arising from unilateral lesions.2 We found that repeatability measures of the same parameter were similar for left and right eyes (Table 2). LOAs for paired right eye–left eye comparisons are presented in Figure 5. In Figure 5, the value of the P100 parameter obtained for the left eye is subtracted from the corresponding observation for the subject’s right eye. This difference is plotted against the mean of the two observations. The horizontal solid line represents the mean paired eye difference for all 46 subjects. This mean right–left difference approximates 0 for P100 amplitude measures and lies between 1–2 ms for P100 latency measures, indicating strong correlation of both amplitude and latency between fellow eyes of normal subjects. Under low contrast stimulus conditions, amplitude and latency differences between fellow eyes were not significantly related to mean amplitude nor mean latency (LCA: 0 outliers, LCL: two outliers). Under high contrast stimulus conditions, interocular amplitude difference but not latency difference was significantly related to mean parameter value (three outliers were eliminated in each analysis). Amplitude was greater for the right eye at high parameter levels and greater for the left eye at low parameter levels (R2=0.04; F(1,131) =5.59; P=0.02). The dashed line in Figure 5B represent the best fit of the data using regression analysis. The point of absolute agreement between right and left eyes (x-intercept) was at an amplitude of 11.73 μv. Regression analysis of the other parameters did not deviate significantly from horizontal. The horizontal dotted lines in Figure 5 represent the 95% LOAs. The LOAs encompass the range within which 95% of future observations are expected to fall. Any interocular difference outside this range would represent an abnormality with 95% confidence level. The LOAs for P100 amplitude are 6.98 and 8.25 μv for low and high contrast stimuli, respectively. These values represent 72% and 65% of the mean amplitude under low and high contrast test conditions, respectively. The LOAs for P100 latency are 26.44 ms (24% of the mean) and 12.22 ms (12% of the mean) for low and high contrast stimuli, respectively. Because these normal subjects do not have any abnormality that would influence the VEP generated by either eye, the observed LOAs for paired eye differences are attributable to noise and measurement error.
 | Figure 5 Bland–Altman plots of P100 parameter limits of agreement between fellow eyes at visit 1. |
Mean parameter values among various demographic subgroups are presented in Table 4. Older participants tended to have smaller P100 amplitudes and longer latencies than younger participants, but this difference only reached statistical significance with latency parameters. This pattern held for both low contrast and high contrast stimuli. Male participants tended to have smaller P100 amplitudes and prolonged latencies compared to females, but this only reached statistical significance for P100 amplitude under high contrast stimulus conditions. There were no significant P100 differences between Hispanic and non-Hispanic participants. Subgroup CVs for each P100 parameter are presented in Table 5.
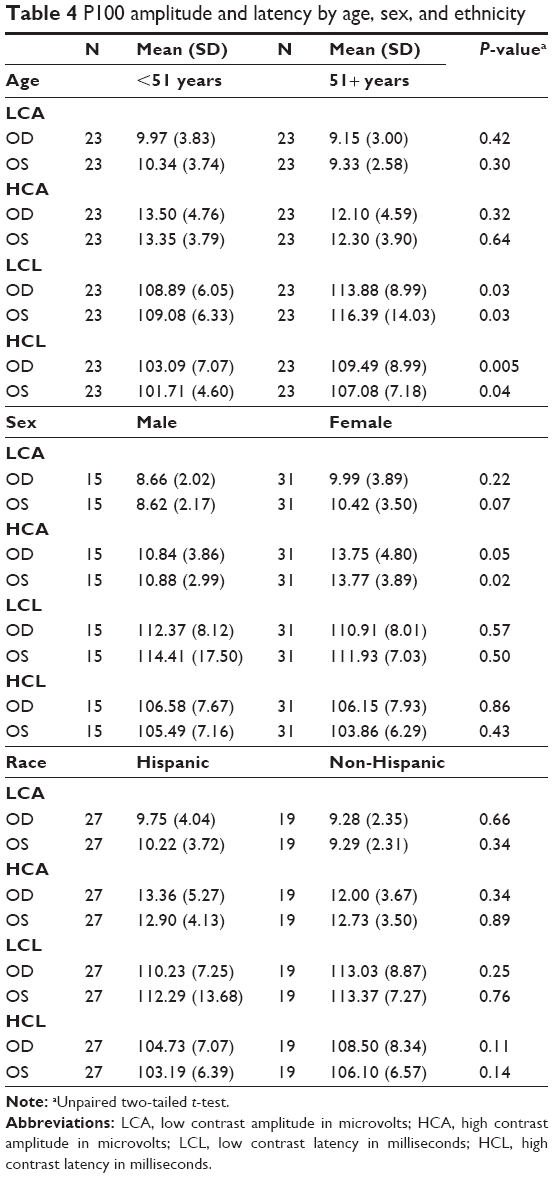 | Table 4 P100 amplitude and latency by age, sex, and ethnicity |
 | Table 5 Coefficient of variation for P100 parameters by age, sex, and ethnicity |
Intersession repeatability
Nine subjects returned for a second examination session to assess intersession reproducibility. A total of 54 fixed protocol examinations were performed (9 subjects × 3 trials × 2 eyes) on these individuals during each of the two examination sessions. The mean age of returning subjects was significantly older than that of the entire cohort (P=0.05, Table 1). One baseline parameter was significantly different among returning participants compared with those participants who did not return. The third trial P100 amplitude under low contrast stimulus conditions for the right eye was significantly smaller among returning participants (not returning: 10.63±4.30 μv; returning: 7.41±1.64 μv; P=0.05).
Table 6 presents first and second visit P100 parameters of the returning subjects. There was a potential maximum of 27 data points (9 subjects × 3 trials) for each of the eight parameters (high/low contrast, right/left eye, visit 1/visit 2). While there were several instances of failure of the instrument to detect a P100 wave during the first visit, there were no such instances during the second visit. Two P100 parameters were statistically significantly different between the first and second test sessions, both pertaining to latency. In addition to the mean and SD, the range of values recorded during each visit are also presented in Table 6. It is noteworthy that each of the second visit data points falls within the normal range established during the initial visit (Table 2). Any finding that falls outside the previously identified 95% CI for each P100 parameter could be considered abnormal for this older adult population with high confidence (P<0.05). Inspection of the CV values in Table 6 reveals similar patterns to what was seen for the entire cohort at visit 1. Amplitude is more variable than latency, but there is little difference in variability between low contrast and high contrast stimuli. On average, the CV for amplitude parameters is more than five times that of latency parameters. Inspection of the CV values for visit 1 and visit 2 reveals no overall pattern of change between the two sessions. Of the eight parameters examined, three experienced an increase in CV from visit 1 to visit 2, four decreased, and one was unchanged. Three of the four amplitude parameters experienced a decrease in CV at the second visit, while two of the four latency parameters increased.
 | Table 6 P100 parameters of the returning subjects |
A two-factor repeated measures ANOVA was performed on the data of the returning subjects to determine whether there is any interaction between the examination trials and the examination sessions. One factor was the three sequential trials that were performed at each visit, and the second factor was the two examination sessions. There was no significant difference among the examination trials for any parameter. Only P100 latency of the left eye under high contrast stimulus conditions was significantly different between the examination sessions (P=0.002). A weak interaction between examination trial and session was found only for P100 amplitude of the left eye under high contrast stimulus conditions (P=0.05). Inspection of the data reveals a trend of decreasing amplitudes from trial 1 to trial 3 during the first session and increasing amplitudes during the second session. No other significant interactions were noted.
LOAs between the first and second visit examinations were calculated for each of the three trials, and the combined right eye–left eye results for each VEP parameter are presented in Figure 6. There was essentially no difference in mean amplitude between visits (mean bias <0.1 μv for both stimulus conditions). Nonlinear regression with outlier elimination found no relationship between the intersession difference and magnitude of the amplitude (elimination of one low contrast data point and two high contrast data points). Amplitude LOAs were smaller under low contrast stimulus conditions (6.61 μv, 76% of mean) than high contrast stimuli (9.92 μv, 82% of mean). These results are generally similar to the interocular LOAs found at visit 1 (72% and 65% for low and high contrast test conditions, respectively). There was a trend for mean latency to be prolonged on the second visit relative to the first under each stimulus condition, albeit by <3% in each case. Nonlinear regression with outlier elimination found no relationship between the intersession difference and the magnitude of the latency (no outliers eliminated). Latency LOAs were larger under low contrast stimuli (16.21 ms, 15% of mean) than high contrast stimulus conditions (8.97 ms, 9% of mean). These are substantially smaller LOAs than that calculated for interocular difference at the initial visit (24% and 12% for low and high contrast stimuli, respectively).
 | Figure 6 Bland–Altman plots of intersession P100 parameter limits of agreement. |
Intersession ICC2,1 values were calculated comparing the corresponding value from each session for each participant and are presented in Table 7 and Figure 7. The amplitude ICC values ranged from poor to moderate reliability, and all latency values reflected moderate reliability. The trend seen in the intrasession data of greater ICC reliability with high contrast stimuli was also present in the intersession data. Inspection of the intrasession and intersession ICC2,1 values reveals some interesting patterns. Of the eight parameters examined, two were more reliable between sessions than they were within the first session, four were less reliable between sessions, and two had essentially equal reliability between sessions as within the first session (difference <0.1). Three of the four amplitude parameters were less reliable between sessions than within the first session, while two of the four latency parameters were more reliable between sessions. One should bear in mind that these ICC values are not directly comparable because the between-session values are from only nine individuals, whereas the within-session values are derived from the entire cohort of 46 individuals. Nonetheless, these comparisons suggest that the between-session reliability of P100 latency is similar to that within-session reliability and is superior to the reliability of P100 amplitude.
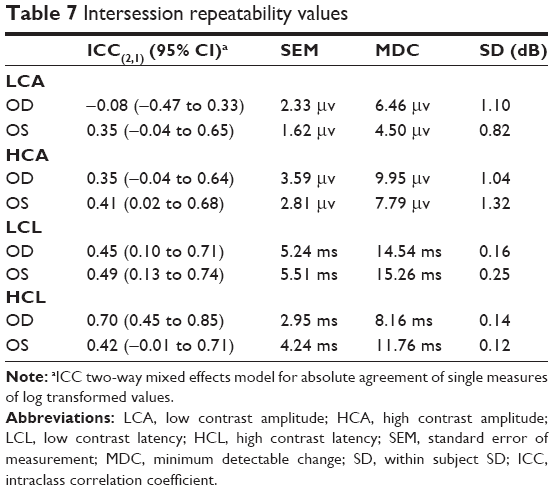 | Table 7 Intersession repeatability values |
 | Figure 7 (A) P100 amplitude recordings and (B) P100 latency recordings for each of the 27 recordings performed on nine returning subjects at the first (circle) and second (square) examination sessions. |
The SEM and MDC for each P100 parameter are presented in Table 7. SEM is a measure of within subject variability and is used in deriving MDC.16,22 A change less than the SEM is more likely a result of measurement error than true change. On the other hand, MDC is the smallest change that can with confidence be considered a true change.16,22 We have chosen a 95% confidence level for the calculation of MDC. Our data indicate that a P100 amplitude change of <2–3 μv is likely a measurement error and a change >5–10 μv is probably a true change. For P100 latency using, a change <5–6 ms is likely a measurement error and >15 ms is probably real. It is noteworthy that 15 (7%) of the 208 parameter recordings (27 recordings of eight parameters minus recording failures) performed on returning subjects fell within the range of true change as defined by the MDC values. Having selected a 95% confidence level for the MDC, we would expect 5% of our recordings to lie above this level. Because our subjects were all healthy adults who had recently undergone comprehensive eye examinations with normal findings, this excess is most likely a statistical anomaly arising from the small number (9) of returning subjects. The distribution of recordings that suggest true change was not even between right and left eyes. Only three of the 15 recordings that exceeded the MDC threshold for true change were recorded in right eyes while 12 (80%) of 15 such recordings were from left eyes. The reason for left eyes to be more prone to larger intersession differences given our RLRLRL trial pattern is unclear, which may serve as additional evidence of the spurious nature of these findings.
To facilitate comparison of our findings with those of standard automated perimetry (SAP), the current gold standard for evaluation of functional change in glaucoma, we converted the data for our returning subjects into decibels. Each of the three paired trials of the nine returning subjects were converted to decibels, yielding a maximum of 54 dB values (9 subjects × 3 trials × 2 eyes) for each parameter. For each eye of each subject, the SD of the three paired trials was calculated and then averaged across subjects, which is presented in Table 7 as the mean within subject SD for each parameter. This value can serve as a metric of the repeat reliability of the VEP that may be directly compared with SAP.
Discussion
Our results indicate that the VEP as performed using the Diopsys NOVA LX protocol offers good repeatability in this racially diverse population of normal older adults. We found that repeatability was generally better for measures of latency than amplitude and that measurements made under high contrast stimulus conditions were more repeatable than measurements made under low contrast stimulus conditions.
Intrasession repeatability
Our intrasession CV values for amplitude ranged from 21% to 33% and for latency ranged from 3% to 7%. This indicates that P100 latency is much more repeatable than amplitude, and hence greater weight should be placed on latency values when interpreting VEP results clinically. Our intrasession ICC2,1 values indicate that low contrast P100 amplitude and latency findings are less reliable than high contrast findings. Under low contrast test conditions, three of the four P100 parameters had ICC2,1 values ≤0.4, whereas under high contrast test conditions, all parameters had moderate or excellent reliability.
The observed pattern of latency being more repeatable than amplitude and of high contrast stimuli producing more consistent findings than low contrast stimuli was revealed in the LOAs between paired left–right eyes. LOAs for amplitude were 72% and 65% of the mean for low and high contrast stimuli, respectively; whereas the corresponding values for latency were 24% and 12% (Figure 5). These findings indicate that a P100 amplitude less than half of the fellow eye would still be within the normal range. This has the potential to make clinical identification of P100 amplitude abnormality challenging. Clinical interpretation is further confounded by our finding that normal interocular HCA difference is related to amplitude magnitude. It is difficult to imagine a physiologic basis for this finding, and we suspect that it is spurious. We are unaware of any similar reports in the literature. On the other hand, interocular latency LOAs, while substantial, are considerably more useful clinically. This is particularly true under high contrast test conditions, where any latency difference between fellow eyes of >10% could be considered abnormal.
We found that P100 parameters varied by age and sex, but did not vary by race (Table 4). Older participants tended to have smaller P100 amplitudes and prolonged latencies, but only latency differences achieved statistical significance. This is consistent with prior reports of an age-related decline in P100 amplitude and increase in latency.23 Our female participants tended to have larger amplitudes and shorter latencies than the male participants, but this achieved statistical significance only with amplitude. This too is consistent with reported VEP sex differences.24 We are not aware of any prior studies investigating racial difference in pattern VEP amplitude and latency parameters. Because there is some controversy regarding whether Hispanic heritage is a matter of race, ethnicity, or both,25,26 it is possible that many of our Hispanic participants may self-identify differently, confounding our ability to detect any between-group differences. There were very few subjects of other racial groups to make meaningful comparisons. We found no evidence that test-retest repeatability was influenced by age, sex, or race (Table 5). There was no difference in test-retest repeatability between the younger (40–50 years) and older (≥51 years) subjects in this study; however, this does not exclude the possibility that age-related differences may exist between elderly subjects and individuals younger than those included in this study.
Intersession repeatability
The intersession repeatability findings are consistent with the general pattern of our within-session results, with amplitude values being less repeatable than latency values, and with high contrast values being more repeatable than low contrast values. Two latency parameters were noted to be significantly different between the first and second test sessions (Table 6). While statistically significant, these differences represent only 2%–4% of the respective means for these parameters. We believe that these differences most likely represent artifacts due to the small number of subjects returning for a second visit (n=9) and the relatively low dispersion of latency values (CV ≤5%).
CV values changed very little from visit 1 to visit 2 (Table 6). Three of four amplitude parameters changed ≤4 percentage points, and three of four latency parameters changed ≤2 percentage points. We found no overall pattern of change in CV values from visit 1 to visit 2. These findings would seem to argue against the presence of a “learning effect” where prior experience with the test procedure influences the variability of future examinations.
LOAs between visit 1 and visit 2 were 76% and 82% of mean amplitude under low and high contrast stimulus conditions, respectively (Figure 6). These values are not much larger than the LOAs between right and left eyes recorded at visit 1 (72% and 65% for low and high contrast test conditions, respectively). While these values are not directly comparable (fellow eyes of the entire cohort at visit 1 vs same eye across visits for nine subjects), if we consider the LOAs for normal fellow eyes to represent the level of noise and error in our measurements, the close agreement between within-session and between-session LOAs suggests that there is only modest day to day variability influencing P100 amplitude in this cohort of normal older adults. LOAs for latency parameters between visit 1 and visit 2 were 15% and 9% of mean latency under low and high contrast stimulus conditions, respectively. This is less than the interocular LOAs found at visit 1 for the entire cohort (24% and 12% for low and high contrast stimuli, respectively). This finding is rather surprising because one would expect that day to day variability would add to and increase the variability of our interocular measurements, as was the case for amplitude parameters. Perhaps this is attributable to the small number of participants returning for a second visit and the low dispersion of latency values. Nonetheless, these findings indicate that there is little day to day variability in P100 latency in this cohort of normal older adults.
The calculation of SEM and MDC yields values that can be clinically useful in monitoring patients for change over time. Our findings indicate that under high contrast test conditions (the most favorable conditions for detecting change using this protocol), an amplitude change of >9 μv and a latency change of >10 ms are required before change can be identified with 95% confidence level. This represents a change of 70% in mean amplitude and a change of about 9% in mean latency. Therefore, any clinician using this device to monitor patients over time should be particularly attentive to changes in P100 latency under high contrast test conditions for early detection of change.
Our results are consistent with previously published studies performed using this device. Tello et al reported on the intrasession and intersession P100 repeatability using a modified Diopsys Enfant System on a series of 30 young, predominantly Caucasian normal subjects.7 They employed a protocol similar to the LX protocol used in the current study and with similar hardware. Their intrasession CV values were 3%–5% for latency and 15%–30% for amplitude. These values are in good agreement with our findings (3%–7% for latency and 21%–33% for amplitude), indicating that test-retest repeatability using this device is not meaningfully influenced by the age of the subject. Ten subjects returned on a different date to assess intersession reproducibility. Intersession ICC values ranged between 0.71 and 0.86 with good agreement shown on Bland–Altman plots. The model that was used to calculate these ICC values is not reported. Our intersession ICC2,1 values are considerably lower (Table 7). This may be due to the use of a different ICC model, differences in software, hardware, and testing environments. It could also reflect real differences in P100 reproducibility introduced by our older and more diverse subject population. Yadav et al used the Diopsys NOVA device to assess changes in the VEP to three stimulus configurations simulating various types of visual field loss.27 They tested five visually normal adult subjects (ages 22–68 years) on five separate days using only high contrast stimulus conditions. CV was calculated for amplitude only and ranged from 11% to 20% (mean: 15%) for the normal, full-field stimulus configuration. These results are somewhat lower than the CV values for our HCA data (20%–28%). This difference may be a consequence of the larger number of subjects and older mean age in our study. While age has been reported to affect P100 amplitude and latency,23 we are not aware of any prior studies that have reported the effect of age, sex, or race on the repeatability of the VEP as recorded using the Diopsys NOVA protocol.
Many researchers have reported on the repeatability of the pattern reversal tVEP using other recording devices. While not directly comparable, these findings may help put our results using the Diopsys NOVA device into context. Recently, Narayanan et al performed VEP recordings on 34 normal subjects twice separated by 1–35 days using the Diagnosys® VEP recording system.28 The age of these subjects was not specified, but they were drawn from a pool of subjects whose mean age was 37.0±15.2 years, indicating that they were on average younger than the subjects in the current study. Reproducibility was assessed using the ICC (model not specified) and LOAs. For a high contrast (95% contrast) 60 minutes of arc stimulus, the ICC for both amplitude and latency was 0.84, and the LOA for both amplitude and latency was 8.19, which represents 59% of mean amplitude and 8% of mean latency for the subjects. Their ICC values are higher than that in our study (amplitude: 0.35 OD, 0.41 OS; latency: 0.70 OD, 0.42 OS). Our HCA LOA was larger (82% of mean amplitude) but is nearly identical for HCL (9% of mean latency).
Many factors may affect intrasession VEP repeatability. These include variations in the subject’s “state of mind,” such as arousal level, and cognitive state.29 Also, with prolonged testing, fatigue may affect the results.7 We attempted to minimize distractions during the examination, and subjects were repeatedly encouraged to mentally focus on the test stimulus. Many variables have the potential to influence between-session VEP variability, including variations in electrode placement, differences in the testing environment, and variation in the subject’s state of mind. To minimize variability, we used the same instrument for all of our examinations and the clinical setting was unchanged between visits. One difference that was introduced between visits was that a different examiner conducted the second examination session. This change reflects what may often occur in normal clinical practice with different technicians conducting the same test over time. All our examiners were trained to perform the examination protocol in an identical fashion, and we therefore do not believe that this difference made a large contribution to intersession variability.
Repeatability of a clinical test has important ramifications for patient management. Longitudinal management of a chronic disease, such as glaucoma, requires repeatedly performing tests over time to monitor disease status and progression.30 High test-retest variability means that an observed change in a test parameter could be due to a change in patient status or a consequence of measurement error. SAP has traditionally been the primary means of assessing visual function in glaucoma. Unfortunately, SAP is notoriously variable, with poor test-retest repeatability.31 Kwon et al reported on the variability of SAP using the 24–2 program of the Humphrey perimeter in 31 normal adults under the age of 50 years over four testing sessions.32 The mean within-subject SD averaged across the visual field was 1.4 dB. Wyatt et al reported on the repeatability of SAP using the 10–2 program of the Humphrey perimeter on 13 normal adults with a mean age of 57 years.33 The within-subject SD averaged across the visual field was 0.87 dB. These values compare very favorably to our data, which yielded a mean within-subject SD of 1.07 dB for amplitude and 0.17 dB for latency. An objective test of visual function, such as VEP, could be extremely valuable in the care of these patients if it can provide a reliable and repeatable measure of visual function. Our findings suggest that VEP as recorded using the Diopsys device is sufficiently repeatable to make it a clinically useful tool in the longitudinal management of glaucoma.
The strength of our study was the relatively large and diverse group of subjects. We specifically excluded subjects under 40 years of age to approximate a patient population typical for primary open-angle glaucoma. In addition, we had a racially diverse group of subjects which may more closely represent patients seen in a typical glaucoma practice. A weakness of our study was the relatively small number of patients that returned for a second examination session, and these individuals were on average significantly older than the original cohort.
Conclusion
We found the Diopsys NOVA LX protocol to have good intrasession and intersession repeatability in this older group of normal adults. We found P100 latency to be more repeatable than amplitude and for high contrast stimuli to generate more repeatable values than low contrast stimuli. Our findings indicate that the transient pattern VEP as recorded using this device may be more repeatable than SAP. The VEP as recorded using this device may be a useful objective test of visual function in the evaluation and management of patients with glaucoma and other disorders of the visual system. Additional studies are needed to evaluate the repeatability and reproducibility of the VEP in subjects with glaucoma and other disorders using this device.
Acknowledgments
This study was presented in part at the 2016 Annual Meeting of the Association for Research in Vision and Ophthalmology (Seattle, WA, USA). This study was supported, in part, by a Rosenberg School of Optometry Faculty Development Grant.
Disclosure
WE Sponsel is a consultant to Diopsys Inc. All other authors certify that they have no affiliations with or involvement in any organization or entity with any financial or non-financial interest in the subject matter or materials discussed in this manuscript. The authors report no other conflicts of interest in this work.
References
Sokol S. Visually evoked potentials: theory, techniques and clinical applications. Surv Ophthalmol. 1976;21(1):18–44. | ||
Odom JV, Bach M, Brigell M, et al. ISCEV standard for clinical visual evoked potentials: (2016 update). Doc Ophthalmol. 2016;133(1):1–9. | ||
Young B, Eggenberger E, Kaufman D. Current electrophysiology in ophthalmology: a review. Curr Opin Ophthalmol. 2012;23(6):497–505. | ||
Hood DC. Objective measurement of visual function in glaucoma. Curr Opin Ophthalmol. 2003;14(2):78–82. | ||
Prata TS, Lima VC, de Moraes CG, et al. Short duration transient visual evoked potentials in glaucomatous eyes. J Glaucoma. 2012;21(6):415–420. | ||
Bach M, Poloschek CM. Electrophysiology and glaucoma: current status and future challenges. Cell Tissue Res. 2013;353(2):287–296. | ||
Tello C, de Moraes CG, Prata TS, et al. Repeatability of short-duration transient visual evoked potentials in normal subjects. Doc Ophthalmol. 2010;120(3):219–228. | ||
Pillai C, Ritch R, Derr P, et al. Sensitivity and specificity of short-duration transient visual evoked potentials (SD-tVEP) in discriminating normal from glaucomatous eyes. Invest Ophthalmol Vis Sci. 2013;54(4):2847–2852. | ||
Derr PH, Meyer AU, Haupt EJ, Brigell MG. Extraction and modeling of the oscillatory potential: signal conditioning to obtain minimally corrupted oscillatory potentials. Doc Ophthalmol. 2002;104(1):37–55. | ||
Waisbourd M, Gensure RH, Aminlari A, et al. Short-duration transient visual evoked potentials and color reflectivity discretization analysis in glaucoma patients and suspects. Int J Ophthalmol. 2017;10(2):254–261. | ||
Portney LG, Watkins MP, editors. Foundations of Clinical Research: Applications to Practice. 3rd ed. Philadelphia, PA: F.A. Davis Company; 2015. | ||
Tham YC, Li X, Wong TY, Quigley HA, Aung T, Cheng CY. Global prevalence of glaucoma and projections of glaucoma burden through 2040: a systematic review and meta-analysis. Ophthalmology. 2014;121(11):2081–2090. | ||
Rudvin I, Valberg A, Kilavik BE. Visual evoked potentials and magnocellular and parvocellular segregation. Vis Neurosci. 2000;17(4):579–590. | ||
Skottun BC. A few observations on linking VEP responses to the magno- and parvocellular systems by way of contrast-response functions. Int J Psychophysiol. 2014;91(3):147–154. | ||
Koo TK, Li MY, My L. A guideline of selecting and reporting intraclass correlation coefficients for reliability research. J Chiropr Med. 2016;15(2):155–163. | ||
Weir JP. Quantifying test-retest reliability using the intraclass correlation coefficient and the SEM. J Strength Cond Res. 2005;19(1):231–240. | ||
Ionan AC, Polley M-YC, McShane LM, Dobbin KK. Comparison of confidence interval methods for an intra-class correlation coefficient (ICC). BMC Med Res Methodol. 2014;14(1):1–11. | ||
Fleiss JL. Design and Analysis of Clinical Experiments. Hoboken, NJ: John Wiley & Sons; 1986. | ||
Bland JM, Altman DG. Statistical methods for assessing agreement between two methods of clinical measurement. Lancet. 1986;1(8476):307–310. | ||
Motulsky HJ, Brown RE. Detecting outliers when fitting data with nonlinear regression – a new method based on robust nonlinear regression and the false discovery rate. BMC Bioinformatics. 2006;7(1):123–20. | ||
Mcmanus IC. The misinterpretation of the standard error of measurement in medical education: a primer on the problems, pitfalls and peculiarities of the three different standard errors of measurement. Med Teach. 2012;34(7):569–576. | ||
Copay AG, Subach BR, Glassman SD, Polly DW, Schuler TC. Understanding the minimum clinically important difference: a review of concepts and methods. Spine J. 2007;7(5):541–546. | ||
Tobimatsu S. Aging and pattern visual evoked potentials. Optom Vis Sci. 1995;72(3):192–197. | ||
Fein G, Brown FF. Gender differences in pattern reversal evoked potentials in normal elderly. Psychophysiology. 1987;24(6):683–690. | ||
Parker K, Morin R, Horowitz J, Lopez MH, editors. The many dimensions of Hispanic racial identity. In: Multiracial in America: Proud, Diverse, and Growing in Numbers. Washington, DC: Pew Research Center; 2015:98–109. | ||
Lombard H, Sen S. What race are Hispanics? StatChat. Available from: http://statchatva.org/2014/11/04/what-race-are-hispanics/. Accessed August 2, 2018. | ||
Yadav NK, Ludlam DP, Ciuffreda KJ. Effect of different stimulus configurations on the visual evoked potential (VEP). Doc Ophthalmol. 2012;124(3):177–196. | ||
Narayanan D, Cheng H, Tang RA, Frishman LJ. Reproducibility of multifocal visual evoked potential and traditional visual evoked potential in normal and multiple sclerosis eyes. Doc Ophthalmol. 2015;130(1):31–41. | ||
Willeford KT, Ciuffreda KJ, Yadav NK. Effect of test duration on the visual-evoked potential (VEP) and alpha-wave responses. Doc Ophthalmol. 2013;126(2):105–115. | ||
Tanna AP, Desai RU. Evaluation of visual field progression in glaucoma. Curr Ophthalmol Rep. 2014;2(2):75–79. | ||
Keltner JL, Johnson CA, Quigg JM, Cello KE, Kass MA, Gordon MO. Confirmation of visual field abnormalities in the Ocular Hypertension Treatment Study. Ocular Hypertension Treatment Study Group. Arch Ophthalmol. 2000;118(9):1187–1194. | ||
Kwon YH, Park HJ, Jap A, Ugurlu S, Caprioli J. Test-retest variability of blue-on-yellow perimetry is greater than white-on-white perimetry in normal subjects. Am J Ophthalmol. 1998;126(1):29–36. | ||
Wyatt HJ, Dul MW, Swanson WH. Variability of visual field measurements is correlated with the gradient of visual sensitivity. Vision Res. 2007;47(7):925–936. | ||
Diopsys. Diopsys NOVA vision testing system software version 2.18. Available from: http://diopsys.com/visual-electrophysiology-products/visual-evoked-potential-vep/. Accessed August 30, 2018. |
 © 2018 The Author(s). This work is published and licensed by Dove Medical Press Limited. The
full terms of this license are available at https://www.dovepress.com/terms
and incorporate the Creative Commons Attribution
- Non Commercial (unported, 3.0) License.
By accessing the work you hereby accept the Terms. Non-commercial uses of the work are permitted
without any further permission from Dove Medical Press Limited, provided the work is properly
attributed. For permission for commercial use of this work, please see paragraphs 4.2 and 5 of our Terms.
© 2018 The Author(s). This work is published and licensed by Dove Medical Press Limited. The
full terms of this license are available at https://www.dovepress.com/terms
and incorporate the Creative Commons Attribution
- Non Commercial (unported, 3.0) License.
By accessing the work you hereby accept the Terms. Non-commercial uses of the work are permitted
without any further permission from Dove Medical Press Limited, provided the work is properly
attributed. For permission for commercial use of this work, please see paragraphs 4.2 and 5 of our Terms.