Back to Journals » Clinical Ophthalmology » Volume 17
Visual Acuity in Aniridia and WAGR Syndrome
Authors Krause MA, Trout KL, Lauderdale JD, Netland PA ![]()
Received 26 January 2023
Accepted for publication 24 April 2023
Published 1 May 2023 Volume 2023:17 Pages 1255—1261
DOI https://doi.org/10.2147/OPTH.S405003
Checked for plagiarism Yes
Review by Single anonymous peer review
Peer reviewer comments 2
Editor who approved publication: Dr Scott Fraser
Michael A Krause,1 Kelly L Trout,2 James D Lauderdale,3 Peter A Netland1
1Department of Ophthalmology, University of Virginia School of Medicine, Charlottesville, VA, USA; 2International WAGR Syndrome Association, Montgomery Village, MD, USA; 3Department of Cellular Biology, University of Georgia, Athens, GA, USA
Correspondence: Peter A Netland, Department of Ophthalmology, University of Virginia School of Medicine, 1300 Jefferson Park Avenue, P.O. Box 800715, Charlottesville, VA, 22908-0715, USA, Tel +1 434-982-1086, Email [email protected]
Purpose: Our purpose was to evaluate visual acuity in aniridia subjects and the more severely affected phenotype in WAGR syndrome subjects, and to assess potential impact on visual function.
Materials and Methods: This was a retrospective comparative study of 25 aniridia subjects with nonsense mutations of PAX6 (50 eyes) and 25 WAGR syndrome subjects with large deletion mutations involving PAX6 (50 eyes). Aniridia subjects were age- and gender-matched with WAGR syndrome subjects in the Coordination of Rare Diseases at Sanford (CoRDS) database. Best-corrected ETDRS visual acuity measurements were converted to LogMAR visual acuity values, which were used to perform statistical analyses.
Results: The age and gender distribution of the subjects was not statistically significantly different. The mean LogMAR values in aniridia and WAGR syndrome subjects were 0.95± 0.53 and 1.51± 0.99, respectively (P< 0.001). In the better-seeing eye, mean LogMAR values were 0.78± 0.15 in aniridia subjects and 1.40± 0.88 in WAGR syndrome subjects (P=0.001). The mean LogMAR values for the better-seeing eye corresponded to Snellen visual acuity of 20/125 in aniridia subjects and 20/500 in WAGR syndrome subjects. This average visual acuity was worse than the threshold for profound visual impairment (WHO criteria) and legal blindness (AAO criteria) in WAGR syndrome but not in aniridia subjects. In analysis of both eyes, the visual efficiency was 34% in aniridia subjects and 2% in WAGR syndrome subjects.
Conclusion: Visual acuity was significantly worse in WAGR subjects with multi-gene deletion mutations compared with aniridia subjects with nonsense mutations, which corresponded to differences in standard visual function thresholds. Our results suggest that visual acuity may indicate severity of ocular involvement and variability of phenotype in aniridia and WAGR syndrome.
Keywords: aniridia, WAGR syndrome, WAGR spectrum, PAX6, visual impairment, blindness
Introduction
Aniridia is a panocular congenital malformation of the eye featuring complete or partial iris hypoplasia and foveal hypoplasia, resulting in reduced visual acuity.1 Glaucoma, cataract and keratopathy also may occur in individuals affected with aniridia, which may be associated with further vision loss.2–5 Nearly all cases of aniridia are caused by mutation or deletion of the paired box 6 (PAX6) gene at 11p13, with resulting haploinsufficiency.6,7 Nonsense PAX6 mutations were identified in about a third of sequence variants from aniridic families, which may be higher than other genetically mediated diseases.7 PAX6 is a critically important gene involved in ocular development, and mutations of PAX6 are associated with aniridia and other congenital anomalies of the eye.1,6,7 Wilms tumor, aniridia, genitourinary anomalies, and cognitive disability (WAGR) syndrome has been associated with large heterozygous genomic deletions at the 11p13 chromosome, which includes deletion of the PAX6 locus and the WT1 locus.8,9 Terminology change from WAGR syndrome to WAGR spectrum has been recommended to incorporate the wide variety of phenotypic variation and various common clinical issues that have been associated with this disorder.10
Visual acuity in aniridia is variable, ranging from logMAR 0.5–1.0 (Snellen equivalent 20/60 to 20/200) or worse.1,11 Little is known about the factors that influence visual function in patients with aniridia due to mutations in PAX6, but the type of mutation (deletion, nonsense, missense, and other variants) may play a role.6 Visual acuity is an accepted metric for severity of ocular disease in many conditions, including diabetic retinopathy12 and age-related macular degeneration.13 Visual acuity is also used in determining level of visual impairment by the World Health Organization (WHO), legal blindness by the American Academy of Ophthalmology (AAO), and disability by the United States Social Security Administration (SSA).14–16 Our hypothesis was that visual acuity may reflect disease severity in aniridia subjects and more severely-affected WAGR spectrum subjects. Our subjects included aniridia subjects with nonsense mutations within the PAX6 gene and WAGR spectrum subjects with multi-gene deletion mutations of the PAX6 gene and adjacent genes. In this study, our objective was to compare the visual acuity of aniridia subjects and WAGR spectrum subjects.
Patients and Methods
The study was approved by the University of Virginia Institutional Review Board (IRB) and performed according to tenets of the Declaration of Helsinki. In this retrospective comparative study, the requirement for consent was waived by the IRB because the information was recorded by the investigator in such a way that the identity of the subjects was not readily ascertained directly or through identifiers linked to the subjects, the investigator did not contact subjects, and the investigator did not re-identify subjects. Aniridia subjects with defined PAX6 mutations, as determined by PAX6 Gene Sequencing and Del/Dup Panel (GeneDx, Gaithersburg, MD), were identified in the electronic medical record at the University of Virginia Department of Ophthalmology. Subjects with congenital aniridia and nonsense mutations of PAX6 were included in the study (traumatic causes of aniridia were excluded).
Visual acuity for these patients was obtained during clinic visits utilizing the Early Treatment Diabetic Retinopathy Study (ETDRS) standardized visual acuity testing chart.12 Visual acuity measurement were best-corrected visual acuity. Visual acuity for subjects old enough to perform subjective vision testing but not old enough to read the ETDRS chart were measured using the LEA vision chart for young children17 Subjects with aniridia and nonsense mutations that were not old enough to perform subjective vision testing were excluded from the study. Personal health information was de-identified to create the final data set used for the aniridia subjects.
Age- and gender-matched WAGR spectrum subjects were included from the Coordination of Rare Diseases at Sanford (CoRDS) database, which was developed in collaboration with the International WAGR Syndrome Association (IWSA).10 The CoRDS Registry allows participants with WAGR spectrum to enroll and provide information about a variety of health conditions, including visual acuity and ocular comorbidities. De-identified visual acuity data for WAGR spectrum subjects from their eye-care providers was obtained from the CoRDS Registry database.
Visual acuities (Snellen Visual Acuity) were converted to logMAR values and vice versa as described previously.18 Visual acuity analyses were performed for both eyes, and the eyes with better or worse vision (if the vision was symmetric, the same value was entered for the better- and worse-vision analyses). Visual impairment was classified as moderate (20/70 to 20/160), severe (20/200 or worse) or profound (20/500 to 20/1000) according to World Health Organization (WHO) criteria.14 Legal blindness was classified as 20/200 or worse and/or 20 degrees or less of visual field, according to the American Academy of Ophthalmology criteria.15 Ability to read a Snellen Chart was based on a standard chart with range from 20/10 to 20/400. Visual efficiency for both eyes was determined as described previously, with a lower number for visual efficiency reflecting lower visual acuity.16 Thresholds for visual efficiency to qualify for disability vary in different states in the US from about 20–60%, but less than 20% visual efficiency would likely qualify for disability in all US states.
Groups were compared using the non-paired t-test, Fisher’s exact test, and the comparison of proportions (z) test. P values less than 0.05 were considered statistically significant. Data were collected and stored in compliance with Health Insurance Portability and Privacy Act (HIPPA) guidelines.
Results
One hundred eyes in 50 subjects were included in the study (Table 1), including 25 aniridia subjects (50 eyes) with nonsense mutations and 25 age- and gender-matched WAGR spectrum subjects (50 eyes) with deletion mutations. Three subjects with aniridia were excluded from the study because they could not perform subjective visual acuity testing due to young age. Most aniridia subjects were measured using ETDRS standardized visual acuity testing (23/25, 92%), while two subjects were measured using standardized LEA vision testing for young children (2/25, 8%). There was no significant difference in the gender distribution between groups (P = 0.571). The median age was 13 years in both groups, while the mean age was 15.4 ± 11.6 and 16.8 ± 13.3 (P = 0.693) for the aniridia and WAGR spectrum subjects, respectively.
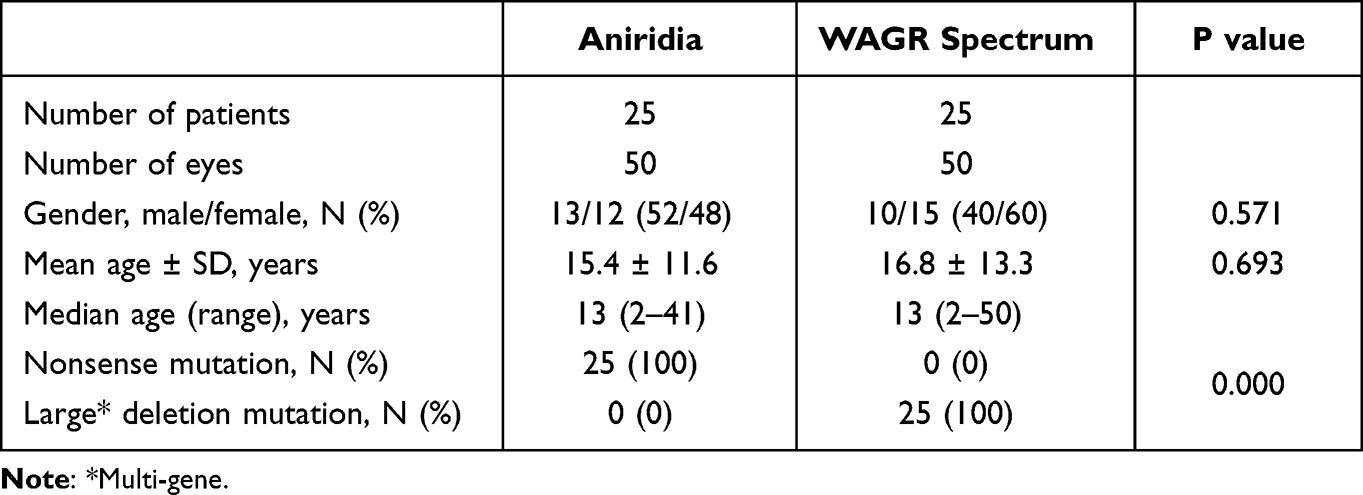 |
Table 1 Characteristics of Aniridia and WAGR Spectrum Subjects |
As shown in Table 2, the intragroup comparison of right and left eyes in aniridia compared with WAGR spectrum subjects was not significantly different (P = 0.287 and 0.526, respectively). Intergroup comparisons of right eyes (P = 0.004) and left eyes (P = 0.035) in aniridia subjects compared with WAGR spectrum subjects were significantly different. The mean LogMAR vision was significantly different between the aniridia and WAGR spectrum subjects (P < 0.001). Intragroup comparison of the better- and worse-seeing eye was significantly different for aniridia subjects (P -= 0.022) but not for WAGR spectrum subjects. Intergroup comparison was significantly different for the better-seeing eye (P = 0.001) but not the worse-seeing eye (P = 0.061) in the aniridia and WAGR spectrum subjects. In Figure 1, scatter plots show the separation of LogMAR values of the two groups, the spread of values in the aniridia group (greater asymmetry of values in the better- and worse-seeing eyes), and the generally worse vision in the WAGR spectrum group.
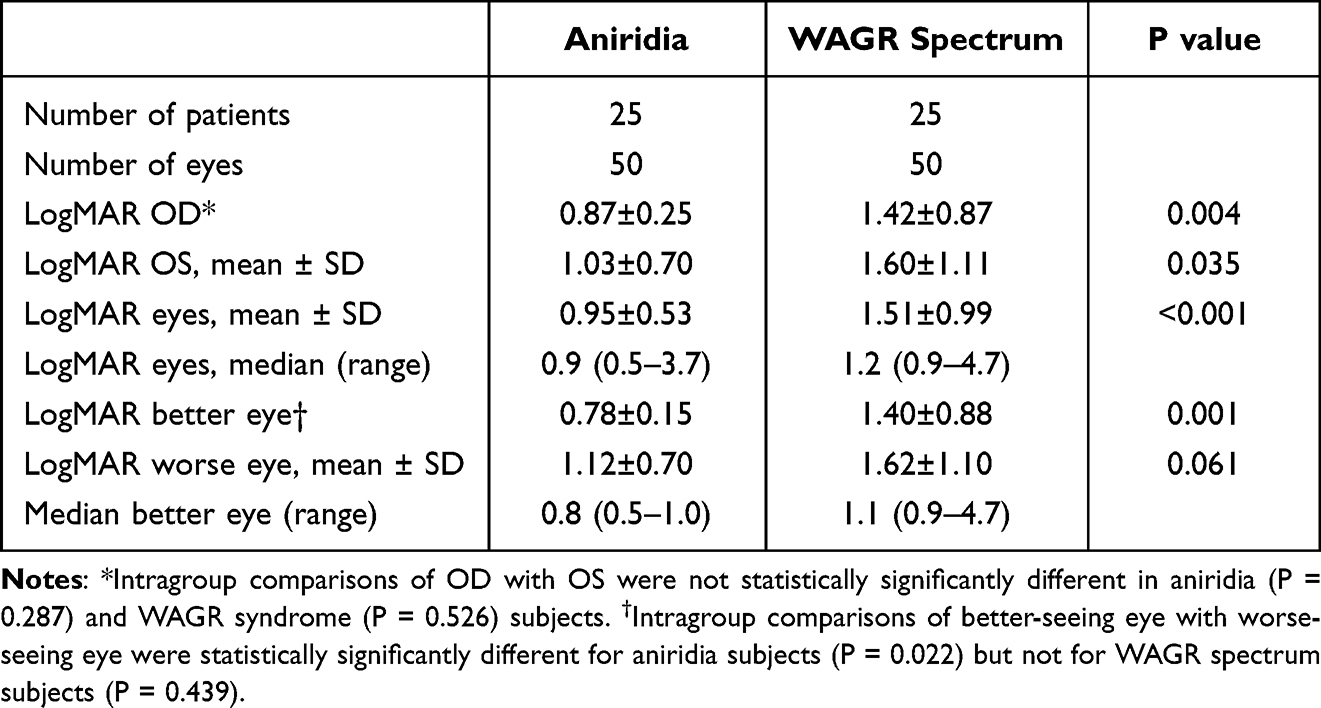 |
Table 2 Visual Acuity in Aniridia and WAGR Spectrum Subjects |
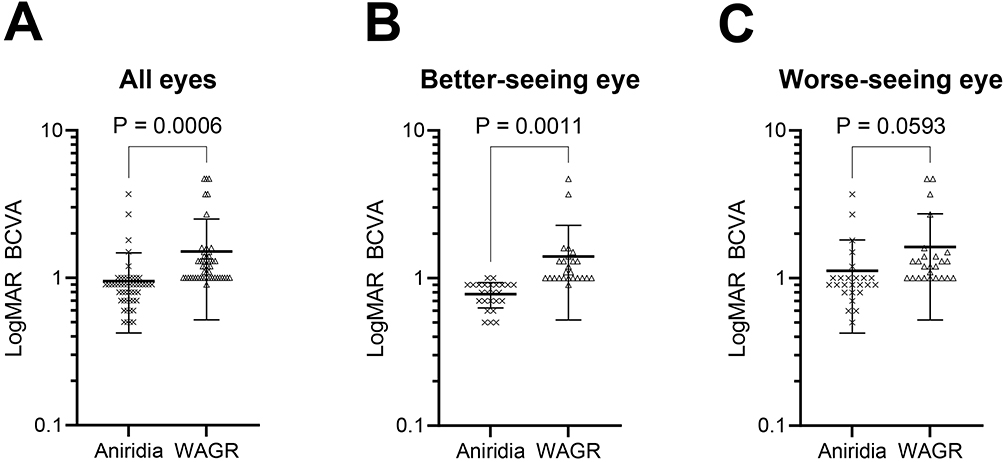 |
Figure 1 Scatter plots for LogMAR values in aniridia and WAGR spectrum subjects. (A) Values for both eyes in aniridia (N=50) and WAGR spectrum (N=50) subjects. (B) Values for the better-seeing eye in aniridia (N=25) and WAGR spectrum (N=25) subjects. (C) Values for the worse-seeing eye in aniridia (N=25) and WAGR spectrum (N=25) subjects. Heavy horizontal lines indicate the mean and lighter horizontal lines indicate the standard deviation for each group. The analyses of all eyes and better-seeing eyes comparing aniridia and WAGR spectrum subjects were statistically significantly different in both analyses. Abbreviations: BCVA, best-corrected visual acuity; WAGR, WAGR spectrum (syndrome) subjects. |
LogMAR values in aniridia subjects and WAGR spectrum subjects were converted to Snellen visual acuity values and evaluated using various vision function thresholds (Table 3). The values for better-seeing eye were used to determine the average vision impairment according to WHO criteria, which was moderate in aniridia subjects and profound in WAGR spectrum subjects. The average LogMAR values were at the level of legal blindness by AAO criteria for WAGR spectrum subjects but not for aniridia subjects. In WAGR spectrum subjects, 49/50 eyes (98%) met the criteria for serious visual impairment (WHO criteria) and legal blindness (AAO criteria). In contrast, in aniridia subjects, 11/50 eyes (22%) met the criteria for serious visual impairment and legal blindness (P < 0.001, compared with WAGR spectrum subjects).
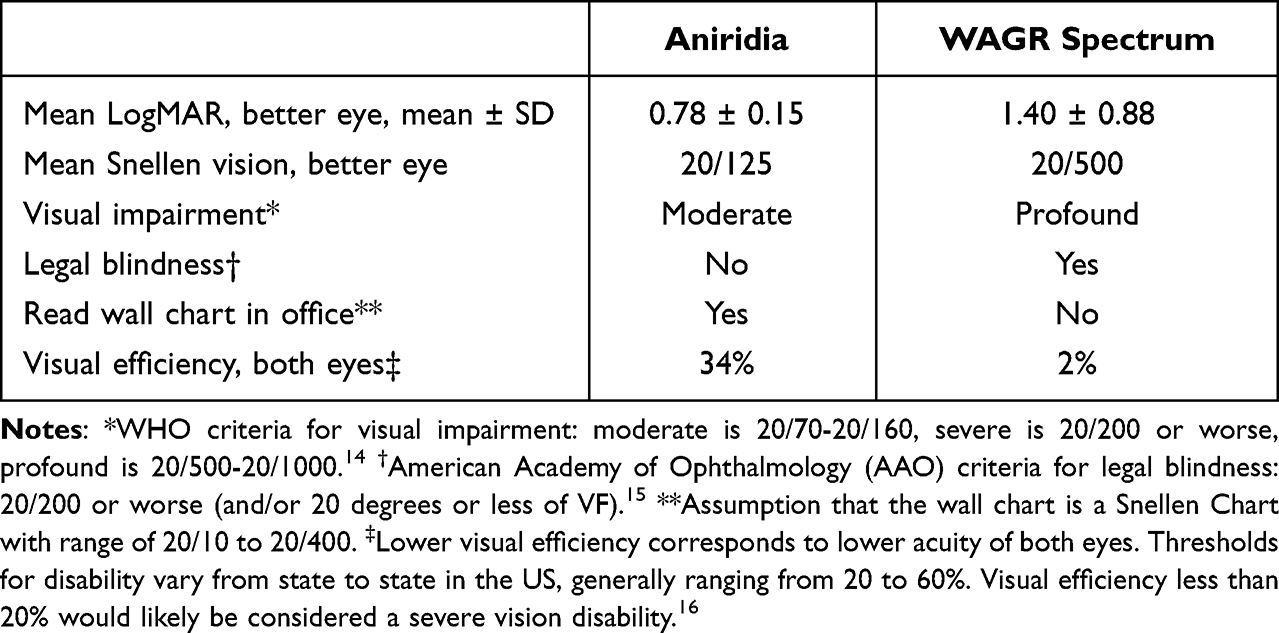 |
Table 3 Average Visual Function Thresholds in Aniridia and WAGR Spectrum Subjects |
Based on the average logMAR value converted to Snellen visual acuity, the average aniridia subject can be tested on a standard wall vision-testing chart, whereas the average WAGR subject likely cannot be tested. With both eyes tested individually, 92% of aniridia eyes and 70% of the WAGR eyes could read the standard wall vision-testing chart (P = 0.011). With the better-seeing eye, all of the aniridia subjects (100%) and 72% of the WAGR subjects could read the standard wall vision-testing chart (P = 0.014). Using both eyes for determination of visual efficiency, which is often used for disability determination, the average WAGR spectrum subject has lower visual efficiency and likely has greater vision disability compared with the average aniridia subject.
Discussion
Aniridia is a panocular congenital malformation resulting from mutation or deletion of the PAX6 gene with significant phenotypic variability. In WAGR spectrum, the phenotype of systemic involvement with Wilms tumor, genitourinary abnormalities, and other abnormalities is attributed to large, multi-gene deletion mutations that involves PAX6 and other genes adjacent to PAX6. In this study, we assessed the visual acuity in aniridia and WAGR spectrum subjects. We found that WAGR spectrum subjects had significantly worse visual acuity compared with aniridia subjects with ocular findings associated with nonsense mutations of PAX6. These visual acuity findings in our subjects corresponded to visual function thresholds that were worse in WAGR spectrum subjects compared with our aniridia subjects.
Due to the panocular abnormalities caused by PAX6 mutations and the phenotypic variability, genotype–phenotype associations in aniridia are difficult. In one study, the authors assigned a severity grade (mild, moderate, or severe) to each patient based on the extent of ocular anatomic changes, the occurrence of complications, and the degree of visual impairment.19 Patients with nonsense and C-terminal mutations had a more severe phenotype than those with missense mutations. Another study assigned severity of iris hypoplasia (mild or severe) and foveal hypoplasia (mild or severe), and included surgical history for cataract, glaucoma, and aniridia-related keratopathy.20 In this study, patients with missense mutations had a milder phenotype.20
When optical coherence tomography was used to grade foveal hypoplasia in patients with aniridia, more severe foveal hypoplasia occurred in patients with loss-of-function mutations (prematurely truncating nonsense, frameshift, C terminal extension variants, and whole- or partial-PAX6 coding sequence deletions), and less severe foveal hypoplasia in patients with mutations in the 3’ regulatory region without removing any PAX6 coding sequences.11 Patients with missense mutations exhibited variable grades of foveal hypoplasia depending on the location of the mutation.11 In our study, all subjects had clinical findings of foveal hypoplasia, although we did not stratify the subjects according to the optical coherence tomography grading of this anomaly. Vasilyeva and co-workers assessed genotype–phenotype correlations by assigning up to six characteristic features of aniridia to subjects with different mutations. In this study there was no statistical difference between patients with 11p13 rearrangements and those with nonsense mutations.21 Consistent with other studies, patients with mutations in the 3’ regulatory region had the mildest phenotype.21
These studies illustrate the challenges of finding metrics for assessing genotype–phenotype correlations for mutations in a single gene like PAX6.22 This challenge is compounded when trying to assess the impact on the eye of multi-gene deletions causal for WAGR spectrum compared to PAX6 mutations associated with aniridia. Genotype–phenotype correlations have been described for PAX6 mutations, WAGR syndrome, non-aniridia phenotypes, and other developmental eye disorders.23 Visual acuity has been used as a metric for disease severity in a number of other ocular conditions. For diabetic retinopathy, change in visual acuity was a main outcome measure in ETDRS in assessing the effectiveness of interventions undertaken during the study.12 Visual acuity was also a main outcome measure in studies of treatment for exudative age-related macular degeneration.13,24 In our study, we compared visual acuity in ocular aniridia due to nonsense mutations with vision in WAGR spectrum associated with large deletion mutations. While vision may be reduced due to multiple variables, including foveal hypoplasia, amblyopia, cataract, glaucoma, and keratopathy,2,22 our findings suggest that visual acuity may be a simplified metric to assess the severity of ocular involvement and phenotypic variability in aniridia and its related conditions involving PAX6 mutation.
In this study, we identified statistically significant asymmetry of vision when we compared both eyes in our aniridia subjects, likely due to phenotypic variability and other variables in this group. Strabismus has been associated with aniridia in 31%2 and 40%25 of the subjects, suggesting that amblyopia could contribute to the asymmetry of vision in our aniridia subjects. In the WAGR subjects, there was a trend toward asymmetry, but the difference was not statistically significant, probably due to the generally worse vision in both eyes in this group. We used the better-seeing eye to determine the best vision for these subjects for comparison to standard vision function thresholds. We used both eyes to calculate visual efficiency, which is a metric used to assess overall vision function for disability determinations. We found that the average WAGR spectrum subject had lower visual efficiency values, which would likely qualify for severe visual disability in the United States.
The WHO and the United States Social Security Administration (SSA) use visual acuity to categorize the level of visual impairment and disability, with the financial burden of severe visual impairment reaching as high as $16.5 billion per year in the United States.26 A visual acuity threshold of logMAR 1.0 (20/200 equivalent) in the better-seeing eye is used to define “serious” vision impairment by WHO criteria and legal blindness in the United States by American Academy of Ophthalmology (AAO) criteria. In this study, the majority (98%) of subjects with WAGR spectrum and the minority of aniridia subjects (22%) met the criteria for serious visual impairment (WHO) and legal blindness (AAO), which was statistically significantly different (P<0.001). Jacobson, Mian, and Bohnsack found a higher proportion of aniridia patients with legal blindness at presentation (38%), perhaps due to inclusion of WAGR subjects and more heterogeneous mutations of PAX6 in their subjects.27 Our subjects with PAX6 deletions associated with WAGR spectrum disorder had worse visual efficiency values than aniridia subjects with nonsense mutations, with the majority of the WAGR spectrum subjects likely qualifying for SSA disability based on the severity of the vision loss in both eyes combined.
Limitations of this study include potential for investigator bias in selection and review of subjects, which is a general problem in retrospective studies and was likely reduced by de-personalizing the data. The search of electronic records may not have identified all eligible subjects, and the number of patients may not have been sufficiently large to detect all differences between groups. We did not determine the causes of reduced vision, which may have been due to multiple variables, including foveal hypoplasia, strabismus, amblyopia, cataract, glaucoma, aniridic keratopathy, and other abnormalities. Further characterization of these potential causes of decreased visual acuity would be needed for genotype–phenotype correlations of ocular malformations in these subjects. While we did not assess cognitive function or impairment in this study, all subjects were able to perform visual acuity testing. Although we used standard metrics for visual function, we did not perform any individual functional testing or occupational testing in our subjects.
Conclusion
Visual acuity was significantly worse in WAGR spectrum subjects with multi-gene deletion mutations compared with aniridia subjects with nonsense mutations in PAX6. These differences in vision corresponded to differences in standard visual function thresholds including visual impairment, legal blindness, and visual efficiency, which were worse in WAGR spectrum subjects. Our results indicate that visual acuity reflects the severity of ocular disease and phenotypic variability in aniridia and WAGR spectrum disorder.
Disclosures
The authors have no potential conflicts of interest in this study.
References
1. Landsend ECS, Lagali N, Utheim TP. Congenital aniridia – a comprehensive review of clinical features and therapeutic approaches. Surv Ophthalmol. 2021;66:1031–1050. doi:10.1016/j.survophthal.2021.02.011
2. Netland PA, Scott ML, Boyle JW, Lauderdale JD. Ocular and systemic findings in a survey of aniridia subjects. JAAPOS. 2011;15:562–566.
3. Netland PA. Management of glaucoma in congenital aniridia. In: Parekh M, Poli B, Ferrari S, Teofili C, Ponzin D, editors. Aniridia: Recent Developments in Scientific and Clinical Research. London: Springer; 2015:27–37.
4. Bajwa A, Burstein E, Grainger RM, Netland PA. Anterior chamber angle in aniridia with and without glaucoma. Clin Ophthalmol. 2019;13:1469–1473. doi:10.2147/OPTH.S217930
5. Shiple D, Finklea B, Lauderdale JD, Netland PA. Keratopathy, cataract, and dry eye in a survey of aniridia subjects. Clin Ophthalmol. 2015;9:291–295.
6. Hingorani M, Hanson I, Van Heyningen V. Aniridia. Eur J Hum Genet. 2012;20:1011–1017. doi:10.1038/ejhg.2012.100
7. Bobilev AM, McDougal ME, Taylor WL, Geisert EE, Netland PA, Lauderdale JD. Assessment of PAX6 alleles in 66 families with aniridia. Clin Genet. 2016;1–9. doi:10.1111/cge.12708
8. Riccardi VM, Sujansky E, Smith AC, Francke U. Chromosomal imbalance in the aniridia-Wilms’ tumor association: 11p interstitial deletion. Pediatrics. 1978;61:604–610. doi:10.1542/peds.61.4.604
9. Fischbach BV, Trout KL, Lewis J, Luis CA, Sika M. WAGR syndrome: a clinical review of 54 cases. Pediatrics. 2005;116:984–988. doi:10.1542/peds.2004-0467
10. Duffy KA, Trout KL, Gunckle JM, Krantz SM, Morris J, Kalish JM. Results from the WAGR syndrome patient registry: characterization of WAGR spectrum and recommendations for care management. Front Pediatr. 2021;9:733018. doi:10.3389/fped.2021.733018
11. Daruich A, Robert MP, Leroy C, et al. Foveal hypoplasia grading in 95 cases of congenital aniridia: correlation to phenotype and PAX6 genotype. Am J Ophthalmol. 2022;237:122–129. doi:10.1016/j.ajo.2021.12.007
12. The Early Treatment Diabetic Retinopathy Study Research Group. Early photocoagulation for diabetic retinopathy. ETDRS Report Number 9. Ophthalmology. 1991;98:766–785. doi:10.1016/S0161-6420(13)38011-7
13. Rosenfeld PJ, Brown DM, Heier JS, et al. Ranibizumab for neovascular age-related macular degeneration. N Engl J Med. 2006;355:1419–1431. doi:10.1056/NEJMoa054481
14. World Health Organization World Report on Vision; 2019. Available from: https://www.who.int/publications/i/item/9789241516570.
15. Saaddine JB, Venkat N, Vinicor KM. Vision loss: a public health problem? Ophthalmology. 2003;110:253–254. doi:10.1016/S0161-6420(02)01839-0
16. Disability Evaluation Under Social Security. Section 2: special Senses and Speech – adult. Available from: https://www.ssa.gov/disability/professionals/bluebook/2.00-SpecialSensesandSpeech-Adult.htm.
17. Hyvarinen L, Nasanen R, Laurinen P. New visual acuity test for pre‐school children. Acta Ophthalmol. 1980;58:507–511. doi:10.1111/j.1755-3768.1980.tb08291.x
18. Holladay J. Proper method for calculating average visual acuity. J Refractive Surg. 1997;13:388–391. doi:10.3928/1081-597X-19970701-16
19. Hingorani M, Williamson KA, Moore AT, van Heyningen V. Detailed ophthalmologic evaluation of 43 individuals with PAX6 mutations. Investig Ophthalmol Vis Sci. 2009;50:2581–2590. doi:10.1167/iovs.08-2827
20. Kit V, Cunha DL, Hagag AM, Moosajee M. Longitudinal genotype-phenotype analysis in 86 patients with PAX6-related aniridia. JCI Insight. 2021;6:1–16. doi:10.1172/jci.insight.148406
21. Vasilyeva TA, Marakhonov AV, Voskresenskaya AA, et al. Analysis of genotype-phenotype correlations in PAX6 -associated aniridia. J Med Genet. 2021;58:270–274. doi:10.1136/jmedgenet-2019-106172
22. Daruich A, Duncan M, Robert MP, et al. Congenital aniridia beyond black eyes: from phenotype and novel genetic mechanisms to innovative therapeutic approaches. Prog Retin Eye Res. 2022:101133. doi:10.1016/j.preteyeres.2022.101133
23. Cunha DL, Arno G, Cortono M, Moosajee M. The spectrum of PAX6 mutations and genotype-phenotype correlations in the eye. Genes. 2019;10:1050. doi:10.3390/genes10121050
24. Brown DM, Michels M, Kaiser PK, Heier JS, Sy JP, Ianchulev T. Ranibizumab versus verteporfin photodynamic therapy for neovascular age-related macular degeneration: two-year results of the ANCHOR study. Ophthalmology. 2006;116:57–65. doi:10.1016/j.ophtha.2008.10.018
25. Alafaleq M, Sordello L, Bremond-Gignac D. Congenital aniridia and ocular motility. Am J Ophthalmol. 2023;247:145–151. doi:10.1016/j.ajo.2022.11.003
26. Eckert KA, Carter MJ, Lansingh VC, et al. A simple method for estimating the economic cost of productivity loss due to blindness and moderate to severe visual impairment. Ophthalmic Epidemiol. 2015;22:349–355. doi:10.3109/09286586.2015.1066394
27. Jacobson A, Mian SI, Bohnsack BL. Clinical outcomes and visual prognostic factors in congenital aniridia. BMC Ophthalmol. 2022;22:235. doi:10.1186/s12886-022-02460-5
 © 2023 The Author(s). This work is published and licensed by Dove Medical Press Limited. The
full terms of this license are available at https://www.dovepress.com/terms
and incorporate the Creative Commons Attribution
- Non Commercial (unported, 3.0) License.
By accessing the work you hereby accept the Terms. Non-commercial uses of the work are permitted
without any further permission from Dove Medical Press Limited, provided the work is properly
attributed. For permission for commercial use of this work, please see paragraphs 4.2 and 5 of our Terms.
© 2023 The Author(s). This work is published and licensed by Dove Medical Press Limited. The
full terms of this license are available at https://www.dovepress.com/terms
and incorporate the Creative Commons Attribution
- Non Commercial (unported, 3.0) License.
By accessing the work you hereby accept the Terms. Non-commercial uses of the work are permitted
without any further permission from Dove Medical Press Limited, provided the work is properly
attributed. For permission for commercial use of this work, please see paragraphs 4.2 and 5 of our Terms.
Recommended articles
Prevalence and Causes of Blindness and Visual Impairment Among Nigerian Children: A Systematic Review
Eze UA, Obasuyi OC, Salihu DV, Bature M, Yeye-Agba OO, Kanmodi KK
Clinical Ophthalmology 2024, 18:289-301
Published Date: 1 February 2024
The Underutilization of Mental Health Care Services in the Lives of People with Blindness or Visual Impairment: A Literature Review on Rehabilitation Factors Toward Provision

Richardson CG
Clinical Ophthalmology 2024, 18:953-980
Published Date: 29 March 2024
Visual Prostheses in the Era of Artificial Intelligence Technology
Sarbout I, Gungor A, Ounissi M, Zaher S, Ptito M, Kupers R, Racoceanu D, Milea D
Eye and Brain 2025, 17:95-113
Published Date: 29 August 2025