Back to Journals » Clinical Ophthalmology » Volume 15
Vessel Evaluation in Patients with Primary Open-Angle Glaucoma, Normal Tension Glaucoma and Healthy Controls
Authors Kortuem C ![]() , Dietter J
, Dietter J ![]() , Bozkurt Y, Kortuem FC, Abaza A
, Bozkurt Y, Kortuem FC, Abaza A ![]() , Wahl S
, Wahl S ![]() , Ivanov IV, Ueffing M
, Ivanov IV, Ueffing M ![]() , Voykov B
, Voykov B ![]()
Received 20 May 2021
Accepted for publication 31 August 2021
Published 21 October 2021 Volume 2021:15 Pages 4269—4280
DOI https://doi.org/10.2147/OPTH.S320505
Checked for plagiarism Yes
Review by Single anonymous peer review
Peer reviewer comments 2
Editor who approved publication: Dr Scott Fraser
Constanze Kortuem,1,* Johannes Dietter,2,* Yagmur Bozkurt,2 Friederike Charlotte Kortuem,1 Annegret Abaza,1 Siegfried Wahl,2,3 Iliya V Ivanov,2,3 Marius Ueffing,2 Bogomil Voykov1
1Department of Ophthalmology, University Eye Hospital, Eberhard Karls University Tuebingen, Tuebingen, Germany; 2Department of Ophthalmology, Institute for Ophthalmic Research University of Tuebingen, Tuebingen, Germany; 3Carl Zeiss Vision International GmbH, Aalen, Germany
*These authors contributed equally to this work
Correspondence: Constanze Kortuem
Department of Ophthalmology, Eberhard Karls University Tuebingen, Elfriede-Aulhorn-Str. 7, Tuebingen, 72076, Germany
Tel +49 7071 29-88687
Fax +49 7071 293749
Email [email protected]
Purpose: To compare changes in central retinal arterial equivalent (CRAE), central retinal vein equivalent (CRVE), arteriovenous ratio (AVR), tortuosity and fractal dimension in primary open-angle glaucoma (POAG), normal-tension glaucoma (NTG) and in a control group (CG) on fundus photographs. Further, to provide further evidence of vascular change in glaucoma patients using a novel method of tortuosity.
Patients and Methods: The primary endpoint was the change in CRAE, CRVE, AVR, fractal dimension and tortuosity of the retinal vasculature from baseline, retrospectively analyzed from 2011 to 2017 at the University Eye Hospital Tuebingen. Fundus photos of POAG (N = 49), NTG (N = 38) and CG (N = 18) were computer evaluated and analyzed in the quantities mentioned above.
Results: CRAE in NTG and POAG and CRVE in NTG significantly decreased (P = 0.02, P = 0.01; P = 0.03) whereas CRVE in POAG increased insignificantly (P = 0.72). In NTG, AVR decreased significantly (P = 0.05), but to a lesser extent than in POAG (P < 0.001). In CG, CRAE decreased insignificantly (P = 0.10), CRVE decreased significantly (P = 0.03) and AVR increased insignificantly (P = 0.77). In POAG tortuosity calculated using standard methods as well as our novel method, increased significantly (P = 0.015– 0.04), whereas it did not occur in NTG (P = 0.18– 0.57) and CG (P = 0.11– 0.21). Fractal dimensions in POAG decreased significantly (P = 0.001– 0.002), whereas in NTG and CG changes were insignificant (P = 0.33– 0.92).
Conclusion: Based on a retrospective analysis of fundus photographs, specific retinal vasculature features of the retinal vasculature display significant alterations associated with NTG and POAG. The assessment of tortuosity using our novel method was consistent with previously established methods for analyzing tortuosity.
Keywords: AVR, CRAE, CRVE, tortuosity of vessels, fractal dimensions
Introduction
Since the arterial and venous vasculature is visible as a feature of the retinal fundus, retinal vessels have already been examined for cardiovascular risk factors. The best-known example is the narrowing of arteries with increasing blood pressure,1 which is reflected by the central retinal artery equivalent (CRAE) and by a low arteriovenous ratio (AVR).2 Studies have demonstrated that wider retinal venular calibers can be useful in predicting strokes,3,4 and low values in retinal vessels’ fractal dimension increase coronary heart disease mortality.5
When evaluating glaucomatous structural damage, it has been demonstrated that only a low correlation between retinal ganglion cell counts (RGC) and cup-to-disc ratios (CDR) exists,6 suggesting that CDR is an inadequate method for evaluating structural alterations in the retina associated with glaucoma and that other methods are therefore needed.
Changes of retinal vasculature may be critical for our understanding of glaucoma pathogenesis and progression. General narrowing of the retinal vessels is not only a characteristic of non-glaucomatous optic atrophies7,8 but also of advanced glaucomatous optic nerve damage.9 In glaucoma, the impaired perfusion and blood flow autoregulation are thought to precede the atrophy.10,11 Increased intraocular pressure (IOP) is the most important risk factor for glaucoma incidence and progression. Studies have shown that an IOP lowering treatment can slow or even stop the progression in both primary open-angle glaucoma (POAG) and normal-tension glaucoma (NTG).12–18 Further, perfusion has been shown to have an important role in both POAG and NTG19,20 and is assumed to be crucial in NTG.21 Vasospastic symptoms such as migraine, Raynaud’s phenomenon as well as low systemic blood pressure and nocturnal dips in blood pressure and hypertension play an important role in the pathogenesis of NTG22 and are already routinely checked for. Several studies have demonstrated the importance of the AVR, CRAE, central retinal vein equivalent (CRVE), tortuosity and fractal dimension in glaucoma.23 Tortuosity is a measure of how curved a single vessel is with tortuosity of a complete fundus-picture being defined as the average over the single vessels. Fractal dimension is a measure of the complexity of the complete vessel structure. These parameters are currently not part of the routine clinical work-up of glaucoma patients, even though several static and dynamic devices for the automated measurement are currently available.24
Our study’s goal was to test a possible association of alterations in AVR, CRAE, CRVE, tortuosity and fractal dimension in glaucoma and progression of glaucoma using easily accessible fundus photographs. Additionally, we wanted to describe and test the coherence of a novel method of tortuosity detection with the existing methods in glaucoma patients and test the fractal dimensions in the aforementioned groups. We hypothesized that both tortuosity and fractal dimensions would decrease in glaucoma patients.
Materials and Methods
This study was approved by the ethics commission of Tuebingen in March 2020 (project number: 048/2020BO2) and followed the tenets of the Declaration of Helsinki. Due to the retrospective nature of this analysis and its practicability, written informed consent of patients was waived. The medical records of 307 patients of the Department of Ophthalmology, Tuebingen, were retrospectively reviewed.
All patients had their full medical and ocular history taken, and the following ophthalmologic examinations were performed: best-corrected visual acuity, slit-lamp biomicroscopy, Goldmann applanation tonometry, central corneal thickness (CCT) measured with optical low coherence reflectometry measurement (Haag-Streit), gonioscopy, and standard automated perimetry using static or kinetic perimetry in case of advanced visual field defects were performed. For the static 30°-perimetry the Octopus 101 device (Haag Streit) with the fast-thresholding algorithm “German Adaptive Thresholding Estimation (GATE)” was used. Worsening of visual field was defined as a difference of ≥3 neighboring locations with a difference of ≥5 dB to the baseline examination or ≥2 neighboring locations with a difference of ≥10 dB, apparent in at least 2 visual field measurements till the end of observation period.
Measurements of peripapillary retinal nerve fiber layer (RNFL) thickness with spectral-domain optical coherence tomography (SD-OCT, Heidelberg Engineering), dilated 30° stereoscopic photography (Kowa Nonmyd (Retinal Camera) WX 3D or Zeiss Camera FF450IR, Carl Zeiss Meditec AG, Jena, Germany) were also conducted. A worsening in OCT was assumed if the retinal nerve fiber layer showed a significant decline on at least two consecutive OCT measurements (8µm in one sector or 5µm in average).
Patients included in this study met the following criteria for POAG and NTG: (I) patients with a typical visual field (VF) defect for POAG or NTG25 with a mean deviation greater than −10 decibels. In patients without a VF defect, the optic disc photo had to show the typical appearance of a glaucomatous optic disc (neuroretinal rim thinning, notching, and excavation) or a nerve fiber layer defect in SD-OCT; (II) presence of a normal anterior chamber and an open angle; (III) proven high intraocular eye pressure (IOP) in patients with POAG; (IV) patients with NTG with known low arterial blood pressure or nocturnal dips if arterial hypertension was treated; (V) follow-up examination within 3–5 years. Patients were excluded if they met any of the following criteria: (I) history of any retinal diseases such as diabetic retinopathy, retinal vessel occlusion, or epiretinal membrane; (II) provided fundus photos were of low quality; (III) optic neuropathy other than glaucomatous; (IV) history of a cerebrovascular event in the temporal, parietal or occipital lobe; (V) any other type of glaucoma than POAG or NTG.
Patients of the CG included in this study met the following criteria: (I) presence of good quality fundus photos with follow-up examination of at least 2 years; (II) no VF defect; (III) presence of a normal anterior chamber and an open angle; (IV) follow-up examination within 3–5 years. Patients were excluded from the CG if they met any of the following criteria: (I) history of any retinal diseases such as diabetic retinopathy, retinal vessel occlusion, or epiretinal membrane (II) provided fundus photos were of low quality; (III) history of a cerebrovascular event in the temporal, parietal or occipital lobe. The control group included patients with ocular hypertension (OHT), which was defined as IOP higher than 21mmHg in at least three consecutive measurements in the absence of glaucomatous visual field defects or optic disc changes in SD-OCT during the observation time.
Either one or both eyes were evaluated according to the quality of the fundus photos. The photo with the best quality available was selected for baseline and follow-up. Progression of visual field defect had to be confirmed in at least two consecutive visual field tests. All patients were either on medication or had surgical treatment if IOP was not otherwise manageable, to ensure appropriate treatment during observation time.
A fully automated workflow for the vessel analysis of fundus photos was established. In particular, the CRAE, CRVE, AVR, the fractal dimension, and the retinal vasculature’s tortuosity were estimated.
The CRAE and the CRVE represent the average artery or vein diameter, respectively. They were estimated according to the procedure proposed by Knudtson et al.26 The procedure was algorithmically implemented as given by Niemeijer et al.27 The AVR was then defined as AVR=CRAE/CRVE. According to Knudtson et al26 the CRAE and CRVE were estimated by taking into account the six largest veins and arteries within the circular region around the optic disc, as indicated in Figure 1. Specifically, this region was between 1 and 1.5 disk diameters from the optic disk center. The vessels inside this region were segmented with the method presented by Bankhead et al.28 The width of the vessels was also estimated as in Bankhead et al.28 Vessel classification was performed by using the algorithm by Ivanov et al.29 For the necessary optic disk detection and segmentation of the optic disk border, the method of Dietter et al was used.30
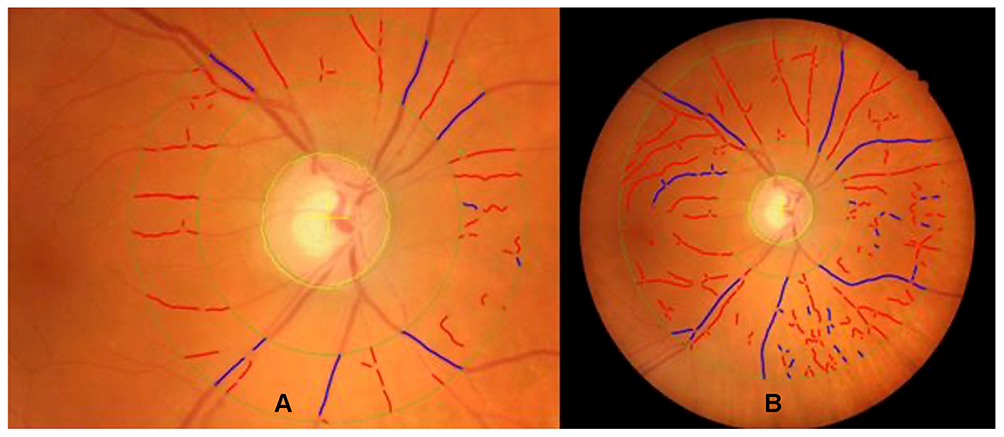 |
Figure 1 Example of an analyzed fundus photo. Notes: Vessels as classified by the algorithm are marked as red or blue in case of arteries and veins, respectively. The border and center of the optic disk as detected by our algorithm is marked. (A) Shows the region of interest for central retinal arterial equivalent (CRAE), central retinal venous equivalent (CRVE) and arteriovenous ratio (AVR) calculation. (B) Shows the region of interest for the estimation of tortuosity and fractal-dimension. |
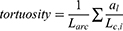
The retinal vessel tree’s geometric structure can be characterized by its fractal dimension31 and tortuosity.32 More specific, we have estimated the Renyi or generalized dimensions.31 These depend on an exponent q. If the calculation of the Renyi dimensions for an object gives different results when the value of q changes, this indicates a structure with substructures of different complexities, as in case of the retinal vasculature. Usually, one chooses q = 0,1,2. Choosing q = 0 yields the “box counting” dimension, q = 1 the “information” dimension, and q = 2 the “correlation” dimension. In the case of tortuosity, three different measures were employed based on the vessel’s different mathematical properties: The distance factor formula is the ratio between the arc-length and the chord length of a vessel-segment between two branches. The second measure is the total curvature of a vessel-segment divided by its arc-length. For the formula and discussion of these definitions for tortuosity see Kalitzeos et al, Table 1.32 Third, a new algorithm to assess tortuosity was used (1). Here, the areas ai which are given by the connecting line Lc,i between two successive inflection points i and i−1 of the vessel-curve and the vessel curve itself were considered:
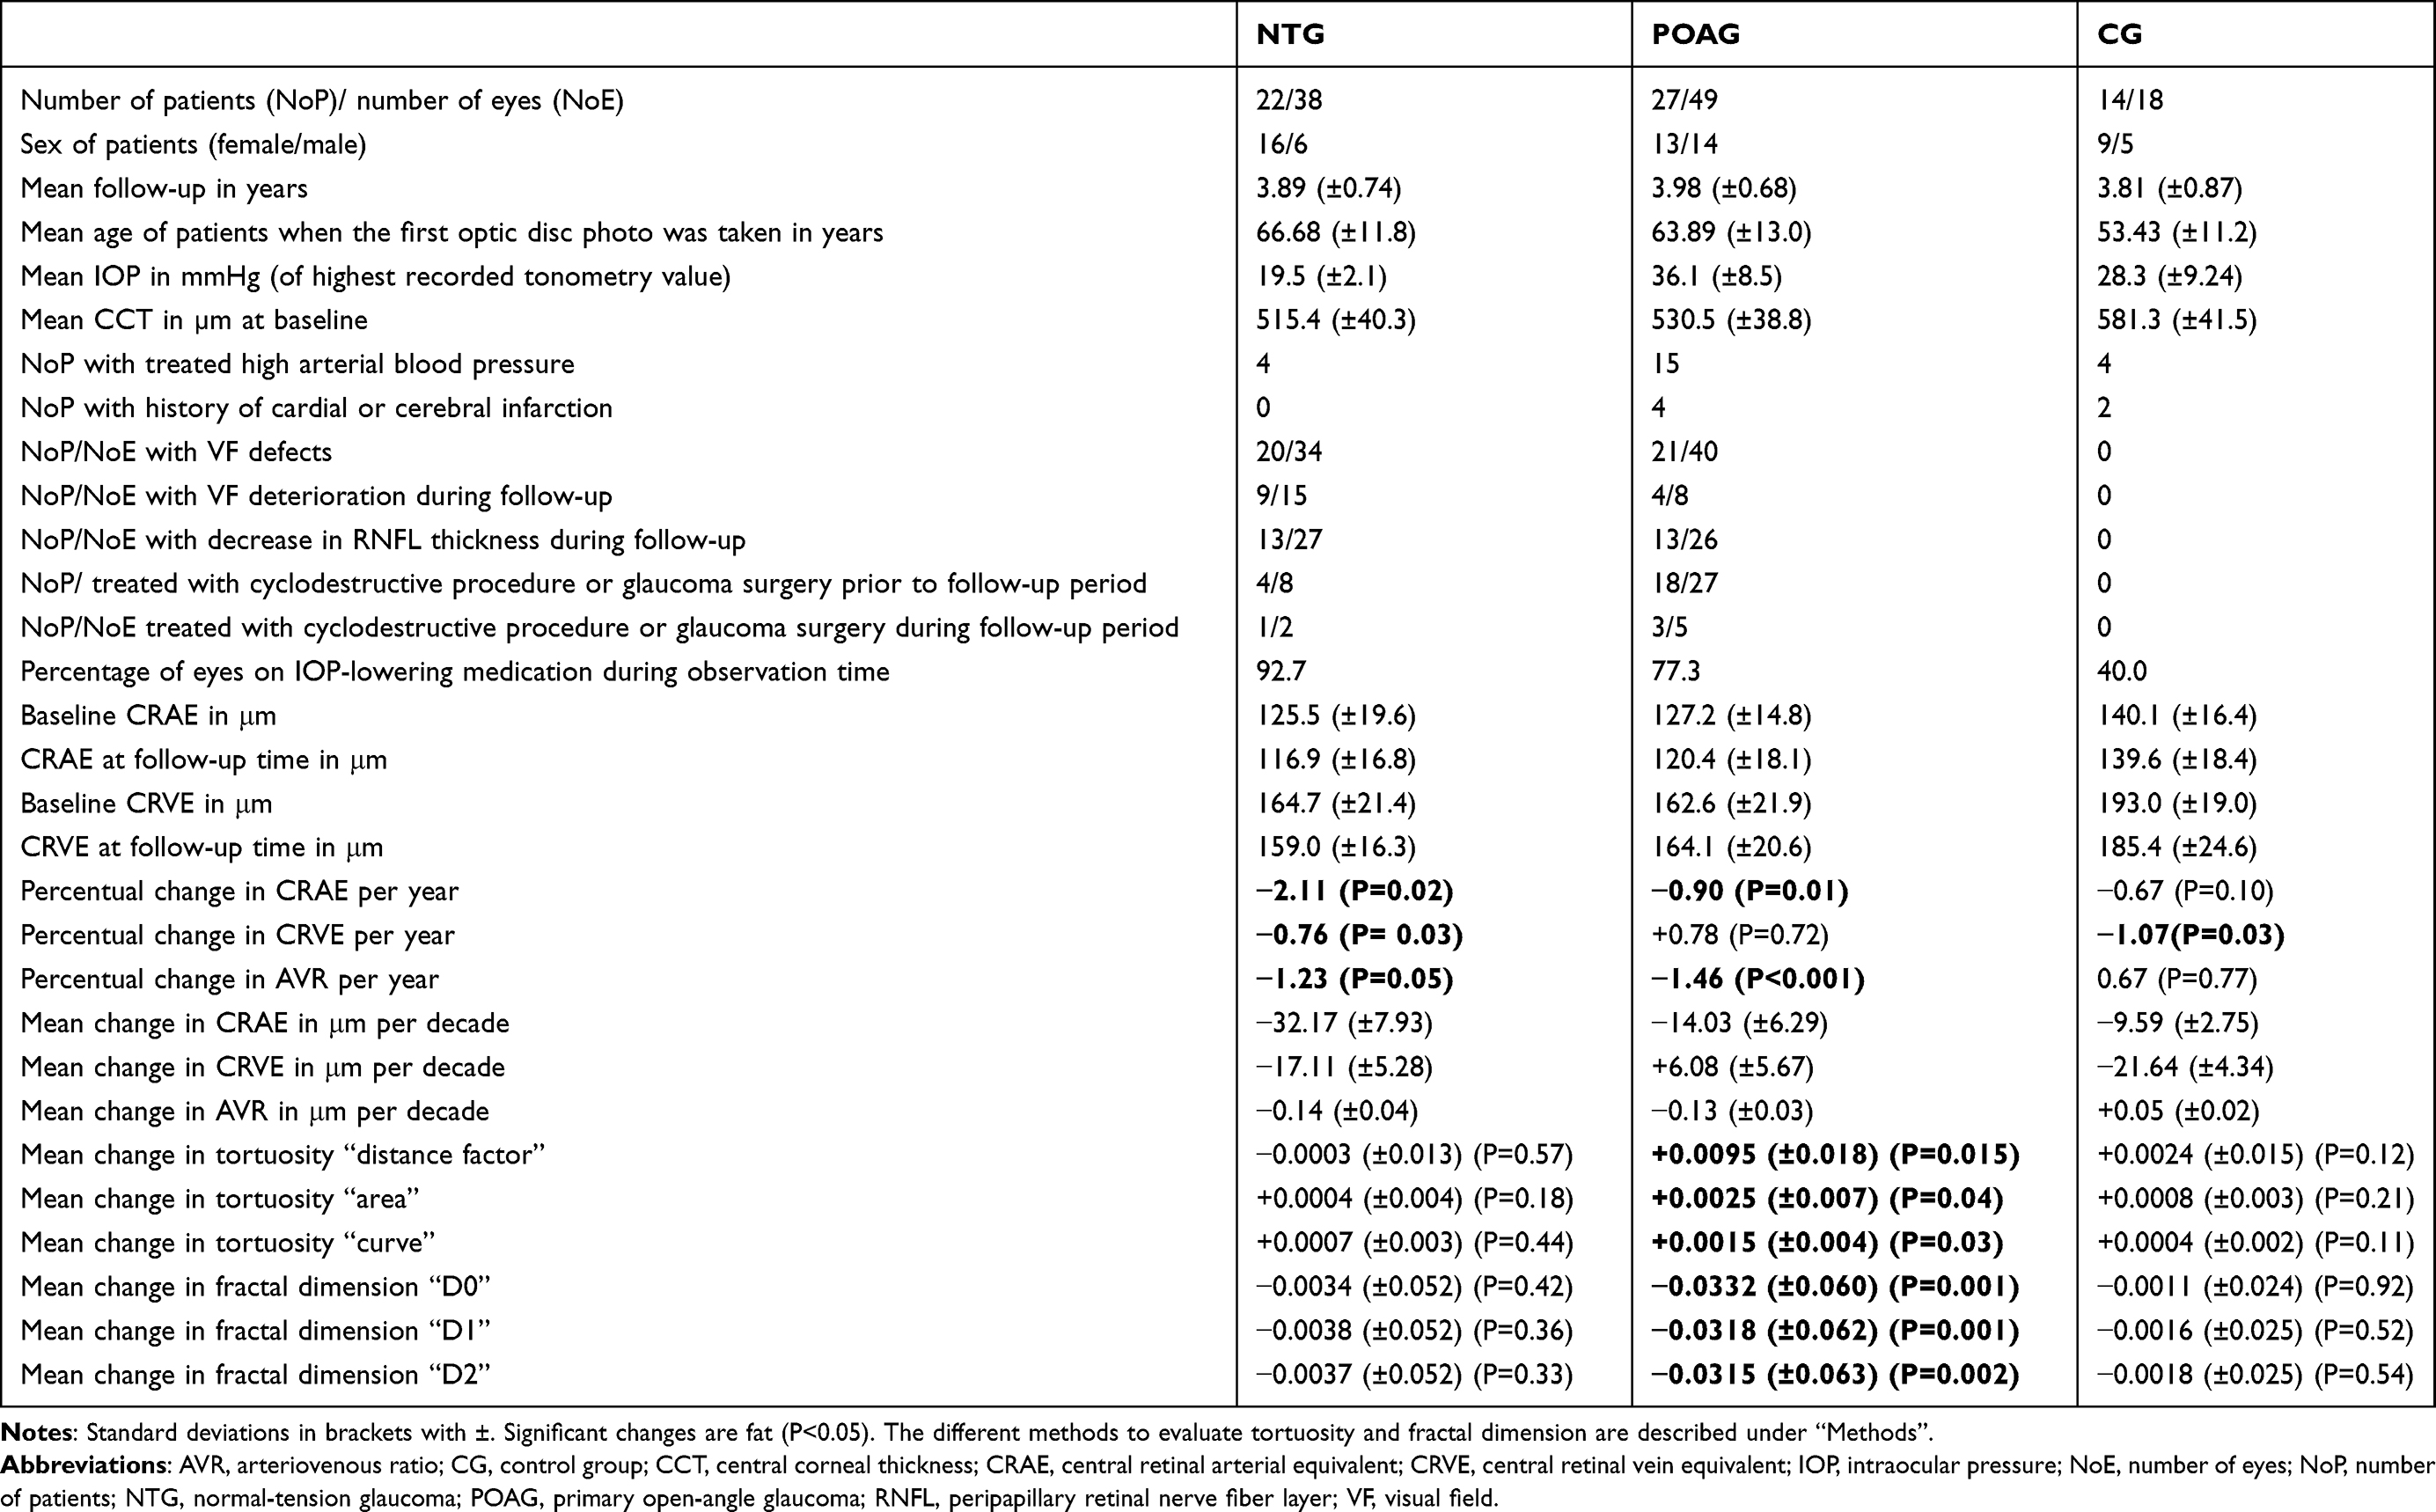 |
Table 1 Descriptive Statistics of Patients Included in the Study |
By using these three different approaches to estimate the tortuosity, a more stable measurement of tortuosity was ascertained. Tortuosity and fractal dimension were calculated within the same region of interest as indicated in Figure 1 (right panel). Our algorithms were implemented into the publicly available software package ARIA.28
Since all our measured quantities related to the optic disk position (and its segmented border), only photos have been taken into account where the position of the optic disk was confined to a prescribed area. The size of the photos has been scaled to 2144 × 1424 pixels. According to this size and the position of the fundus within the photo, only photos were included where the center of the optic disk was located within a rectangular area extending horizontally from 750 to 1550 pixels and vertically from 200 to 1200 pixels.
Statistical Analysis
The fundus photos stemming from the right eyes and left eyes were analyzed separately. The change in CRAE, CRVE, AVR, tortuosity and fractal dimension between 2 visits of the patient-groups NTG, POAG and CG was calculated. Also, the average change per year of the aforementioned quantities was estimated. To improve statistics, data of merged data sets consisting of right and left eyes were also analyzed. In detail: for NTG 17 left eyes and 21 right eyes were eligible, for POAG 25 left eyes and 24 right eyes and for the control group, 11 left eyes and 7 right eyes. The one-tailed paired t-test, to estimate the p-value for changes in the aforementioned quantities and to compare independent variables, the independent-samples t-test were used, both only if the data was distributed normally, otherwise the Wilcoxon signed rank test, Mann–Whitney U-test and the Kruskal–Wallis test by ranks with the Bonferroni correction was used. The p-values were calculated with MATLAB [Release R2018b, The MathWorks, Inc., Natick, Massachusetts, United States. 2018] and SPSS statistical software (IBM Corp. Released 2017. IBM SPSS Statistics for Mac, Version 25.0. Armonk, NY: IBM Corp). Pearson correlation coefficient was used to compare the methods for tortuosity evaluation.
Results
At the end of the screening process (see Figure 2), patients as outlined in Table 1 could be included in the study. In the NTG group, 4 patients were treated for arterial hypertension, but in those patients, long-period blood pressure measuring showed diastolic dips below 55 mmHg. The patients with NTG and POAG were comparable in age (Kruskal–Wallis test: P = 0.29) but older than in the CG (P = 0.006), so that age-related vascular changes could have played a more significant role in those groups. The follow-up time was comparable between all examined groups (P = 0.94).
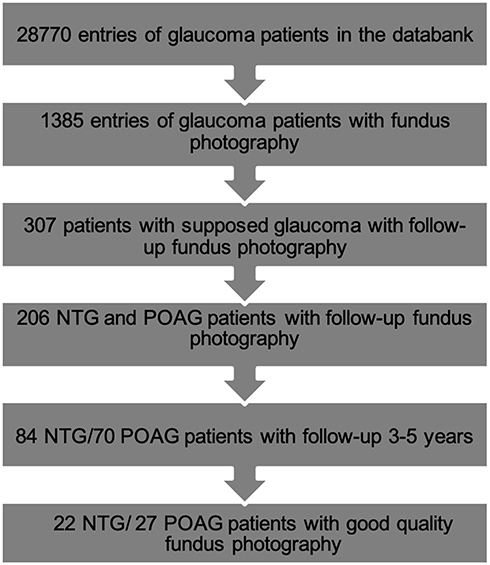 |
Figure 2 Screening of patients for the study. |
AVR, CRAE, and CRVE
When comparing baseline CRAE (see Table 1) in the different groups, we could show that eyes with glaucoma had narrower CRAE on average than eyes without optic neuropathy. The differences were significant for POAG compared to CG (P = 0.038) and NTG to CG (P = 0.001), but not for POAG and NTG (P = 0.328). The same could be observed for CRVE (P = 1.00/ P = 0.001/ P = 0.001). CRAE was in both NTG and POAG, significantly decreasing throughout the study. The difference of the change in CRAE between NTG and POAG was not significant (P = 0.33), but in NTG to CG (P = 0.04). The CRVE decreased significantly in NTG (0.76%/year) and even more pronouncedly in CG (1.07%/year). In patients with NTG the AVR was significantly decreasing with time, but to a lesser extent than in POAG due to the non-significant increase in CRVE (see Table 1).
If a linear change in retinal vessels’ diameter of over time is assumed, changes in AVR, CRAE and CRVE in micrometer per decade (see Table 1) were much higher in our groups than observed in the cross-sectional population-based cohort study by Leung et al,33 measuring a decrease of 4.8 μm in CRAE, 4.1 μm in CRVE, and 0.01 in AVR per decade of increasing age. The mean decrease in CRAE per decade in our groups was most prominent for NTG and least for CG. The change in CRVE differed more between the groups.
In the different groups, not all patients had a proven deterioration in SD-OCT or VF during the observation time. 72.7% of NTG, but only 48.2% POAG showed a decrease in RNFL thickness. This could explain why NTG eyes had a higher decrease in CRAE and CRVE. To prove this hypothesis, eyes with VF deterioration were examined for CRAE, CRVE and AVR separately (see Table 2): Decrease in CRAE, CRVE, AVR was more pronounced in eyes with VF deterioration, as well for POAG (8 eyes examined) as for NTG (15 eyes examined). The difference of CRAE and CRVE between VF deterioration and no VF deterioration was significant in POAG, but not in NTG (see Table 2).
 |
Table 2 Comparing Vessel Parameters of Eyes with Visual Field (VF) Deterioration to No VF Deterioration |
The difference between female and male patients for all vessel parameters was not significant in any group (P = 0.140–0.912).
The mean change of RNFL thickness in SD-OCT during the observation time in the different groups can be found in Table 3. The difference in change in RNFL thickness between glaucoma and control eyes was significant for the global RNFL thickness (P = 0.013) and in the temporal-superior sector (P = 0.005), but no in the temporal-inferior sector (P = 0.289). The difference between POAG and NTG was not significant for any parameter (P = 0.07–0.82). A statistical correlation between AVR, CRAE, CRVE and any of the named RNFL parameters could not be found.
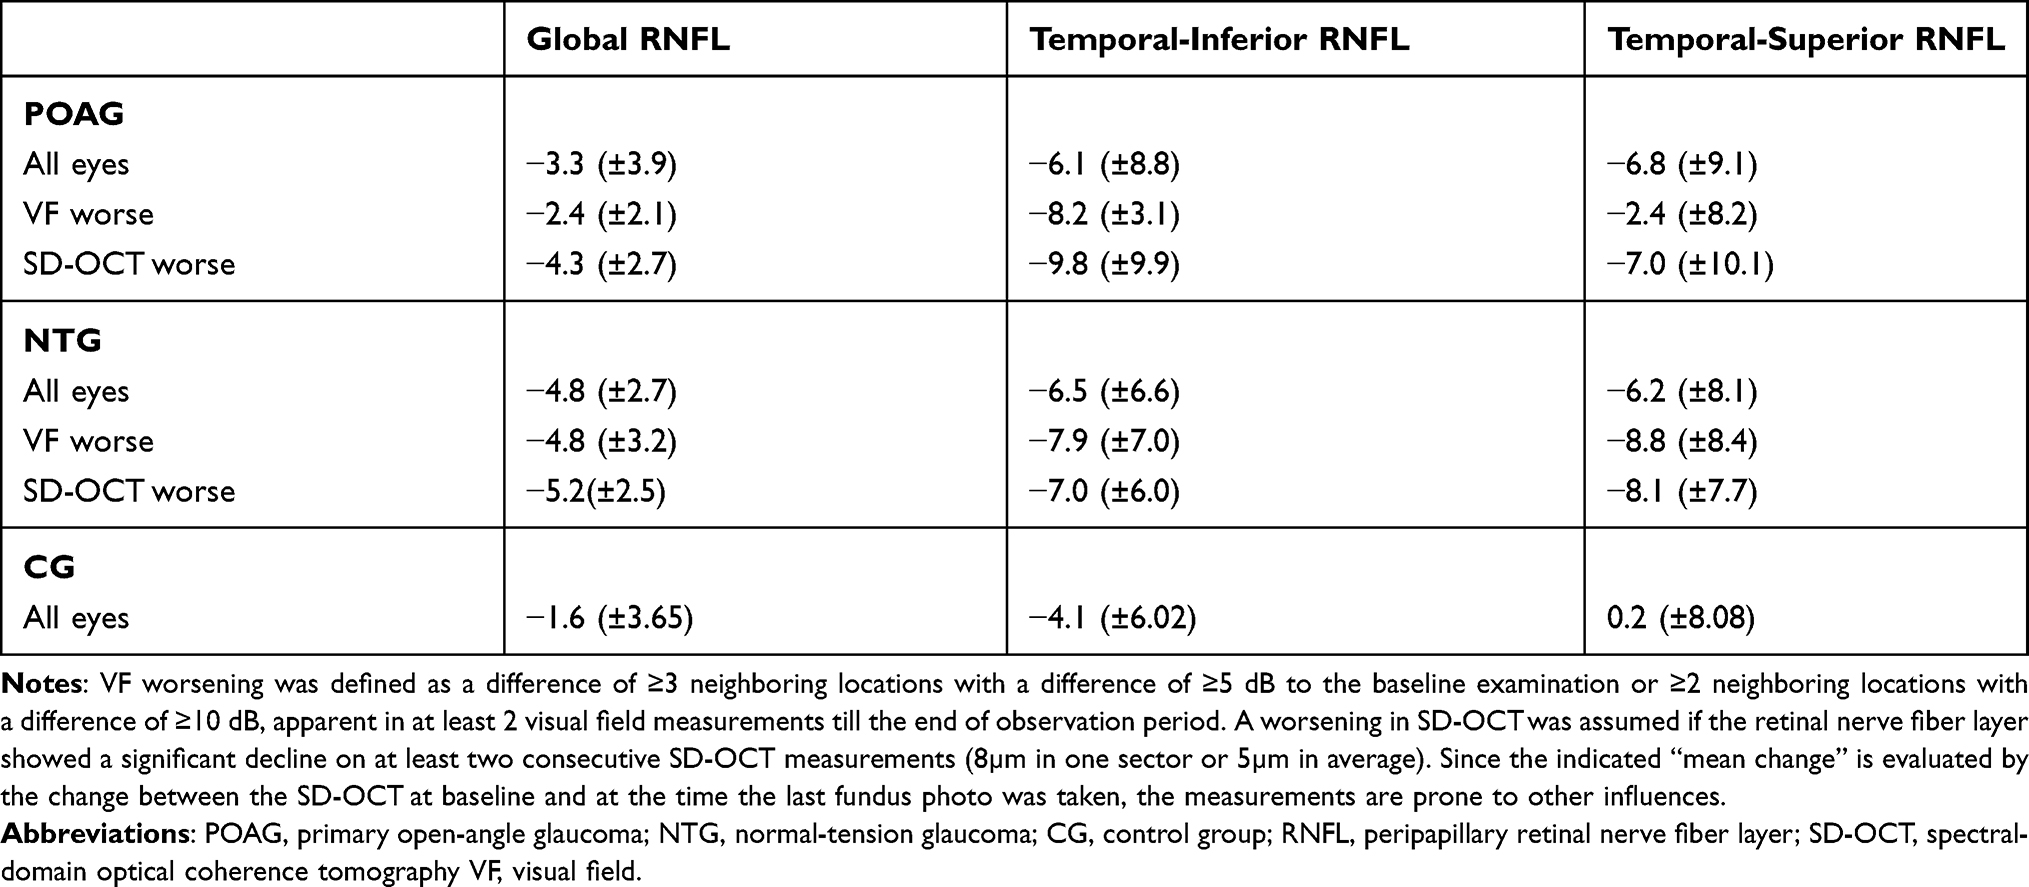 |
Table 3 Mean Change in Micrometer (±Standard Deviation) During Observation Time in Peripapillary Retinal Nerve Fiber Layer (RNFL) Thickness |
Tortuosity and Fractal Dimensions
In POAG, the tortuosity calculated with the “distance factor” method as well as the “curve” and the “area” method increased significantly during follow-up. The tortuosity did not change significantly in NTG and CG, although a mean increase was partly observed (see Table 1). The correlation coefficient between “distance factor”, “area” and “curve” was evaluated using every photo analyzed and was highest between “area” and “curved” (r = 0.82–0.98, M = 0.93, SD = 0.06, all p < 0.01) and lowest between “distance factor” and “area” (r = 0.77–0.94, M = 0.82, SD = 0.06, all p < 0.01). Therefore, correlations between the different methods to evaluate tortuosity were strong.
If the POAG data was corrected for patients with VF loss, the increase in tortuosity was partly less (see Table 4), but the differences were not significant. Since just 5 eyes with visual field loss could only be analyzed for tortuosity change, the data might not be reliable.
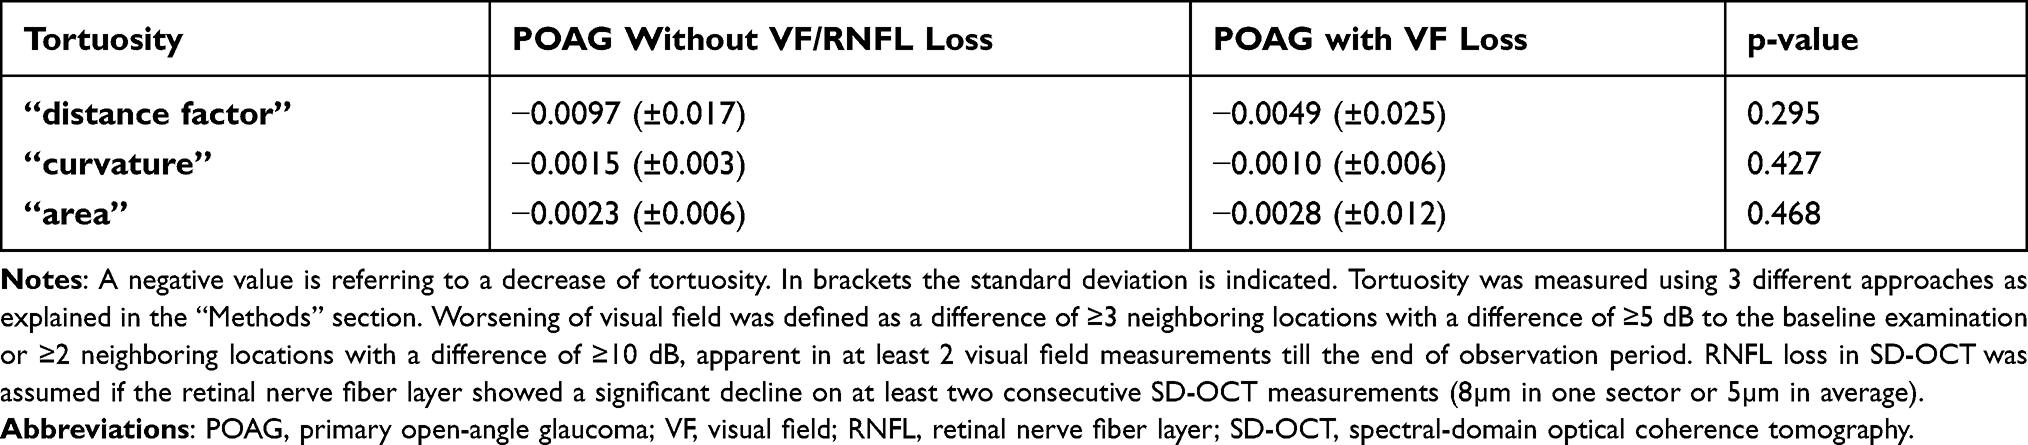 |
Table 4 Mean Change in Tortuosity in POAG with VF Loss and Without VF Loss or Decrease of RNFL in SD-OCT |
With regards to the fractal dimensions, in POAG a significant decrease was shown, in NTG and the CG the change was insignificant. The fractal dimensions were decreasing in average, in NTG more than in CG (see Table 1).
Discussion
AVR, CRAE, and CRVE
As arterial vessels provide nutrients and oxygen, they are an essential prerequisite for the survival of the cells comprising the optic nerve. Therefore, CRAE might be the most exciting part to evaluate in glaucoma. In our study, patients with NTG and POAG showed a significant decrease in CRAE, but the CG did not. This supports the theory that vascular changes are decisive for the pathogenesis of glaucoma. The decrease in CRAE was higher for eyes with visual field (VF) deterioration than for eyes with stable VF, but only significantly in POAG. This might reflect impaired perfusion in POAG where IOP has been controlled because all patients included were routinely checked for elevated IOP and treated accordingly. Lee et al showed that patients with NTG who had progressing RNFL defects on red-free photographs within about 2 years had a significant decrease of CRAE whereas those without progression did not.34 Inclusion criteria might have contributed to the different results observed in our study, as well as the state of the disease of patients. We assume that the chronic change in vessel narrowing in NTG precedes the atrophy of RNFL and VF deterioration.10,11 We looked at the vessels in the course of the patients’ disease that were not selected explicitly for VF changes but for having NTG. Our assumption was that vessel change in NTG may be a chronic process, and VF change thus likely to occur at a progressed state of atrophy of the RNFL. Also, our study’s small sample size might have influenced the value of significance, as a higher mean decrease in NTG with progressed VF defects was seen. Besides, automated segmentation does need a cross-check by the examiner, potentially introducing further data variance.
When comparing baseline CRAE (see Table 1) in the different groups, both our study and Kawasaki’s,19 could show that eyes with glaucoma or eyes that were going to develop open-angle glaucoma had a significantly narrower CRAE on average than eyes without (future) optic neuropathy. In Kawasaki’s study,19 the mean baseline CRAE of patients that did not develop open-angle glaucoma was 160.6 μm (±14.9) and those who did 156.1 μm (±15.1). Similar associations were also seen in subjects with IOP under 20mmHg, but no difference between POAG and NTG, or change of CRVE was described. The Rotterdam Eye Study could not find an association between baseline CRAE and glaucoma incidence in their follow-up time of 6.5 years.35 Whereas Lee et al found a significantly smaller diameter of CRAE in a young age-matched group of NTG than in POAG with a similar functional and cup-to-disc ratio, and no difference in CRVE,36 our results showed no significant difference at baseline between NTG and POAG and a significant narrowing of CRAE over time in both groups, although the narrowing CRAE was higher in NTG (see Table 1).
In our study, CRVE decreased significantly in NTG, but not in POAG. This was surprising because CRVE also decreased in CG. The difference might be due to random variation of small sample size or confounding variables like cerebral pressure and blood pressure that were not taken into account. Having wider venules might be a sign for hypertension,37,38 male sex, diabetes, current smoking, obesity, or systemic inflammation.39–41 Follow-up times and relative ages were comparable to NTG.
In the cross-sectional Gutenberg Study of a healthy population CRVE decreased up to 2 μm per decade (mean), especially in their older population, whereas CRAE decreased up to 4 μm per decade and more linearly than CRVE.2 They showed significant larger CRAE and CRVE in females. Interestingly, incidence of normal tension glaucoma in women is higher than in men though.42 We could not find a significant difference between sexes in the change of vessel parameters. CRAE and CRVE tended to be higher in all female groups in our study, but the results were not statistically significant. Different from us, the Gutenberg Study had a much higher number of observed individuals. Leung et al found for every 10 mmHg-increase in mean arterial blood pressure, AVR decreased by 0.012, and CRAE and CRVE decreased by 3.5 μm and 0.96 μm, respectively.33 Differently to Leung et al ratios for age, sex, smoking, arterial blood pressure and body mass index were not adjusted. The decrease in CRAE in CG was in line with Leung et al, but to a higher degree than in Leung et al, which is probably due to inconsistent methods between studies. Leung et al33 and the Gutenberg Study2 compared data cross-sectionally, not like us, longitudinally. Even if our data had been adjusted to account for blood pressure, age and the other aforementioned variables, the extrapolated decrease in CRAE for the NTG in comparison to the other groups is apparent (see Table 1), which supports the vascular component in the pathogenesis of NTG.
Per decade, the CRVE of CG decreased much more than in Leung et al.33 Naturally high blood pressure constricts arterial vessels more. The standard deviation was not very high so that even in the small sample, the data might be reliable. A random variation due to the small sample size cannot be excluded though. A reason for the rapid decrease could be the relatively large mean vessel diameter in this group at the beginning of the follow-up period of 193.0 μm, so assuming a linear decrease is incorrect and a percentual decrease more appropriate as outlined in Table 1.
The cross-sectional studies of Wang et al and Amerasinghe et al found differing results in CRVE for glaucoma patients.43,44 Whereas Amerasinghe et al found narrower retinal arteriolar and venular caliber changes with glaucomatous optic neuropathy, Wang et al only found a significant decrease in CRAE, but not in CRVE for glaucoma patients. The only significant decrease of CRVE in our glaucomatous patients was in NTG. Both named studies had large numbers of participants. This shows that the measured venous retinal system is dependent on many variables and not as indicative as the arterial retinal system for glaucoma.
Since AVR is the quotient of CRAE and CRVE, the AVR for glaucoma patients was, as expected, significantly decreasing but not in CG. It has been shown that AVR also significantly decreases with age in cross-sectional studies.2,43 Here again, larger sample sizes were evaluated.
The thickness of the RNFL depends on several factors: Vascular diameter, segmentation of the retinal layers, detection of the macula, tractive lesions, epiretinal proliferations, and positioning of the ring. In evaluating change of the RNFL vascular diameter and segmentation of the layers are crucial for the interpretation. RNFL measurements are less reliable in moderate and advanced glaucoma than VF examinations.45 Due to these facts, many patients had to be excluded from the evaluation and a correlation between vessel and RNFL could not be shown.
Kuroda et al showed in an experimental monkey model that retinal blood vessels were pulled towards the optic nerve head as cupping increased.46 On the other hand, Lesk et al have demonstrated that vessels’ distance from the nerve head increased upon lowering eye pressure.47 Radcliffe et al showed shifts of retinal vessels in non-specific directions with progressing glaucoma.48 Our patients had controlled eye pressure at both times of photo acquisition and loss of retinal nerve fiber layer if occurring was small and although not measured approaching and therefore “false-positive” narrowing was not eminent within our fundus photos.
Tortuosity and Fractal Dimensions
The strong correlation between the “area” evaluation and the two already existing methods to evaluate tortuosity makes the new method a helpful tool.
Our results showed a significant increase in tortuosity and a significant decrease in fractal dimension in POAG. The change in the other groups was not significant. Since increasing tortuosity is thought to promote perfusion,49,50 an increase in tortuosity in POAG is not logical. Higher measured values for fractal dimension indicate a better supply of the retina and optic disc. For example, it was shown that high blood pressure51 and diabetic microvasculopathy52,53 display a lower fractal dimension. Wu et al found a significantly lower retinal arteriolar tortuosity, retinal venular tortuosity, and fractal dimension (all p < 0.001) of glaucomatous eyes compared to eyes without glaucoma.9 Also, the arteriolar and venular tortuosity significantly decreased with age. They showed as well that in ocular hypertension (OHT) fractal dimension was significantly lower. Different from Wu et al,9 our study was longitudinal and not cross-sectional, so a comparison cannot be directly made. Koh et al correlated decreased vessel tortuosity with a thinner neuroretinal rim, which was more significant in arterioles.54 Since tortuosity in our study was an average of both arteries and veins, the difference to Koh et al54 could be explained. Our control group consisted mainly of patients with OHT, but the fractal dimension did not decline significantly in this group either.
Cheung et al showed that retinal venules were significantly more tortuous than retinal arterioles (P < 0.001).55 In their study, less arteriolar tortuosity was independently associated with older age, higher blood pressure, higher body mass index, and narrower retinal arteriolar caliber (all P < 0.05); greater venular tortuosity was independently associated with younger age, higher blood pressure, lower high-density lipoprotein cholesterol level, and broader retinal venular caliber (all P < 0.05).1 Since wider retinal venular caliber was associated with greater venular tortuosity, our significantly increasing tortuosity in POAG would be explained since we also found a non-significant increase in CRVE in this population if not corrected for patients with visual field loss. Mean Age in POAG was comparable to NTG, so age did not contribute to the difference in tortuosity in those groups. Tortuosity increases with arterial hypertension and other factors that were not checked for at the time of acquisition of the photos.
Tham et al showed in the Singapore Malay Eye Study, as in our POAG population, a significant decrease in vascular fractal dimension and a narrower retinal arteriolar caliber (P = 0.001) with thinner average RNFL thickness.56 Differing from our results, the venular caliber (P < 0.001) narrowed in their study. Also, in the Singapore Malay Eye Study decreased retinal vascular fractal dimension (P = 0.017) and decreased retinal venular tortuosity (P = 0.042) were independently associated with thinner average Ganglion Cell-Inner Plexiform Layer thickness after adjusting for age, sex, hypertension, diabetes, axial length, and OCT signal strength.
Since Wu et al9 and Tham et al56 had corresponding results in vascular fractal dimensions and tortuosity, it can be concluded that our results especially in NTG and for tortuosity in POAG, were questionable, most likely due to the low number of eyes evaluated. However, Li et al showed that racial differences could be attributed to differing results in retinal vessel geometric characteristics within Asian ethnicities.57 Ciancaglini et al demonstrated in a European population (Italy) in patients with advanced glaucoma that fractal dimension D was significantly lower than in controls, whereas, in the early stage of the disease, its value was similar.58 Since in the study by Ciancaglini et al, a Heidelberg Doppler flowmetry confocal scanning laser was used to define the fractal dimension, the results are not directly comparable to ours. In addition, very few of the patients with POAG in our population had advanced glaucoma, but the mean decrease in fractal dimension was significant in this group, although less than half of them showed a deterioration of RNFL in SD-OCT. Looking at those few patients with advanced glaucoma in NTG, a significant decrease in fractal dimension could not be proven either.
Limitations in our study were the hospital-based population with possible selection bias and the unknown blood pressure when the fundus photo was taken, as well as the unconsidered effect of systemic medications,2 obesity,40 and the refractive impact on the caliber of vessels,33 although none of the patients were highly myopic (<−6.0 diopters). Additionally, only one photo was selected (the best quality available of various photos taken) for baseline and follow-up vessel analysis. Our study’s strengths lie within the longitudinal evaluation of clinical patients and the evaluation of the easily accessible fundus photographs. The contrasting findings in the literature, especially for CRVE, may be explained by the complex interactions between various mediators for vasodilation and vasoconstriction on arterioles and venules and the many confounding variables. With real-life glaucoma patients, the AVR, CRAE and CRVE are rarely taken into account, yet fundus photographs of the optic disc are broadly available. Automated analysis software for fundus features as used for this study has the advantage, that once adequately validated, robust and certified, it can be used on the basis of fundoscopy without any additional static and dynamic devices.24 This makes it a potentially useful diagnostic tool in the future. Yet, data interpretation remains a challenge. Once advanced, automated, and artificial intelligence-based analytical tools are likely to have a huge impact on cohort stratification, clinical study set-up, and everyday clinical practice.
Conclusions
To conclude, the arterial narrowing can be considered as a pathological feature of glaucoma. We observed a decrease over time in CRVE and CRAE in glaucomatous patients (POAG and NTG) associated with VF deterioration. There are indications that in NTG patients CRVE, CRAE and AVR decreases even before or without VF loss. A significant decrease in fractal dimension was only observed for POAG and is less specific for glaucoma patients than a decrease in CRAE. For retinal tortuosity evaluation arteriolar and venular tortuosity should be distinguished. As the measurement of tortuosity using our newly developed algorithm proved consistent with an established automated measurement of tortuosity in patients with glaucoma, we can now offer a properly validated tool to assess the tortuosity of ophthalmological patients.
Data Sharing Statement
For code availability of the vessel-segmentation, vessel-classification and optic-disc-detection/segmentation algorithm we refer to the respective original publications [28, 29, 30].
Ethics Approval and Consent to Participate
This study was approved by the ethics commission of Tuebingen in March 2020 (project number: 048/2020BO2) and followed the tenets of the Declaration of Helsinki. In this retrospective study, data was evaluated anonymously after its collection by one person, complying with medial confidentiality.
Acknowledgments
The authors acknowledge support by the High Performance and Cloud Computing Group at the Zentrum für Datenverarbeitung of the University of Tübingen, the state of Baden-Württemberg through bwHPC and the German Research Foundation (DFG) through grant no INST 37/935-1 FUGG. Part of the work concerning the development of algorithms for fundus analysis was supported by a grant of the Charlotte and Tistou Kerstan Foundation.
Author Contributions
All authors made a significant contribution to the work reported, whether that is in the conception, study design, execution, acquisition of data, analysis, and interpretation, or in all these areas; took part in drafting, revising or critically reviewing the article; gave final approval of the version to be published; have agreed on the journal to which the article has been submitted; and agree to be accountable for all aspects of the work.
Funding
The Department of Ophthalmology and Ueffing Marius received partial financial support from the Tistou und Charlotte Kerstan Foundation.
Disclosure
Siegfried Wahl and Iliya V Ivanov are employees of Carl Zeiss Vision International GmbH. Siegfried Wahl reports salary from Carl Zeiss Vision International GmbH, during the conduct of the study. The authors report no other potential conflicts of interest for this work.
References
1. Sharrett AR, Hubbard LD, Cooper LS, et al. Retinal arteriolar diameters and elevated blood pressure: the Atherosclerosis Risk in Communities Study. Am J Epidemiol. 1999;150(3):263–270. doi:10.1093/oxfordjournals.aje.a009997
2. Ponto KA, Werner DJ, Wiedemer L, et al. Retinal vessel metrics: normative data and their use in systemic hypertension: results from the Gutenberg Health Study. J Hypertens. 2017;35(8):1635–1645. doi:10.1097/HJH.0000000000001380
3. McGeechan K, Liew G, Macaskill P, et al. Meta-analysis: retinal vessel caliber and risk for coronary heart disease. Ann Intern Med. 2009;151(6):404–413. doi:10.7326/0003-4819-151-6-200909150-00005
4. McGeechan K, Liew G, Macaskill P, et al. Prediction of incident stroke events based on retinal vessel caliber: a systematic review and individual-participant meta-analysis. Am J Epidemiol. 2009;170(11):1323–1332. doi:10.1093/aje/kwp306
5. Liew G, Mitchell P, Rochtchina E, et al. Fractal analysis of retinal microvasculature and coronary heart disease mortality. Eur Heart J. 2011;32(4):422–429. doi:10.1093/eurheartj/ehq431
6. Tatham AJ, Weinreb RN, Zangwill LM, et al. The relationship between cup-to-disc ratio and estimated number of retinal ganglion cells. Invest Ophthalmol Vis Sci. 2013;54(5):3205–3214. doi:10.1167/iovs.12-11467
7. Frisen L, Claesson M. Narrowing of the retinal arterioles in descending optic atrophy. A quantitative clinical study. Ophthalmology. 1984;91(11):1342–1346. doi:10.1016/S0161-6420(84)34144-6
8. Rader J, Feuer WJ, Anderson DR. Peripapillary vasoconstriction in the glaucomas and the anterior ischemic optic neuropathies. Am J Ophthalmol. 1994;117(1):72–80. doi:10.1016/S0002-9394(14)73017-X
9. Wu R, Cheung CY, Saw SM, et al. Retinal vascular geometry and glaucoma: the Singapore Malay Eye Study. Ophthalmology. 2013;120(1):77–83. doi:10.1016/j.ophtha.2012.07.063
10. Grieshaber MC, Flammer J. Blood flow in glaucoma. Curr Opin Ophthalmol. 2005;16(2):79–83. doi:10.1097/01.icu.0000156134.38495.0b
11. Papastathopoulos KI, Jonas JB. Follow up of focal narrowing of retinal arterioles in glaucoma. Br J Ophthalmol. 1999;83(3):285–289. doi:10.1136/bjo.83.3.285
12. VanVeldhuisen P, Ederer F, Gaasterland D, et al. The Advanced Glaucoma Intervention Study (AGIS): 7. The relationship between control of intraocular pressure and visual field deterioration.The AGIS Investigators. Am J Ophthalmol. 2000;130(4):429–440.
13. Drance SM. The Collaborative Normal-Tension Glaucoma Study and some of its lessons. Can J Ophthalmol. 1999;34(1):1–6.
14. Feiner L, Piltz-Seymour JR. Collaborative Initial Glaucoma Treatment Study: a summary of results to date. Curr Opin Ophthalmol. 2003;14(2):106–111. doi:10.1097/00055735-200304000-00010
15. Leske MC, Heijl A, Hyman L, et al. Predictors of long-term progression in the early manifest glaucoma trial. Ophthalmology. 2007;114(11):1965–1972. doi:10.1016/j.ophtha.2007.03.016
16. Oie S, Ishida K, Yamamoto T. Impact of intraocular pressure reduction on visual field progression in normal-tension glaucoma followed up over 15 years. Jpn J Ophthalmol. 2017;61(4):314–323. doi:10.1007/s10384-017-0519-8
17. Quigley HA. European Glaucoma Prevention Study. Ophthalmology. 2005;112(9):1642. doi:10.1016/j.ophtha.2005.05.024
18. Heijl A, Leske MC, Bengtsson B, et al. Reduction of intraocular pressure and glaucoma progression: results from the Early Manifest Glaucoma Trial. Arch Ophthalmol. 2002;120(10):1268–1279. doi:10.1001/archopht.120.10.1268
19. Kawasaki R, Wang JJ, Rochtchina E, et al. Retinal Vessel Caliber Is Associated with the 10-year Incidence of Glaucoma The Blue Mountains Eye Study. Ophthalmology. 2013;120(1):84–90. doi:10.1016/j.ophtha.2012.07.007
20. Mitchell P, Leung H, Wang JJ, et al. Retinal vessel diameter and open-angle glaucoma: the Blue Mountains Eye Study. Ophthalmology. 2005;112(2):245–250. doi:10.1016/j.ophtha.2004.08.015
21. Galassi F, Giambene B, Varriale R. Systemic vascular dysregulation and retrobulbar hemodynamics in normal-tension glaucoma. Invest Ophthalmol Vis Sci. 2011;52(7):4467–4471. doi:10.1167/iovs.10-6710
22. Shields MB. Normal-tension glaucoma: is it different from primary open-angle glaucoma? Curr Opin Ophthalmol. 2008;19(2):85–88. doi:10.1097/ICU.0b013e3282f3919b
23. Chan KKW, Tang F, Tham CCY, et al. Retinal vasculature in glaucoma: a review. BMJ Open Ophthalmol. 2017;1(1):e000032. doi:10.1136/bmjophth-2016-000032
24. Nagel E, Vilser W, Fink A, et al. Static vessel analysis in nonmydriatic and mydriatic images. Klin Monbl Augenheilkd. 2007;224(5):411–416. doi:10.1055/s-2007-963093
25. Araie M. Pattern of visual field defects in normal-tension and high-tension glaucoma. Curr Opin Ophthalmol. 1995;6(2):36–45. doi:10.1097/00055735-199504000-00007
26. Knudtson MD, Lee KE, Hubbard LD, et al. Revised formulas for summarizing retinal vessel diameters. Curr Eye Res. 2003;27(3):143–149. doi:10.1076/ceyr.27.3.143.16049
27. Niemeijer M, Xu X, Dumitrescu AV, et al. Automated measurement of the arteriolar-to-venular width ratio in digital color fundus photographs. IEEE Tans Med Imaging. 2011;30(11):1941–1950. doi:10.1109/TMI.2011.2159619
28. Bankhead P, Scholfield CN, McGeown JG, et al. Fast retinal vessel detection and measurement using wavelets and edge location refinement. PLoS One. 2012;7(3):e32435. doi:10.1371/journal.pone.0032435
29. Ivanov IV, Leitritz MA, Norrenberg LA, et al. Human Vision-Motivated Algorithm Allows Consistent Retinal Vessel Classification Based on Local Color Contrast for Advancing General Diagnostic Exams. Invest Ophthalmol Vis Sci. 2016;57(2):731–738. doi:10.1167/iovs.15-17831
30. Dietter J, Ivanov I, Norrenberg L, et al. Optic disc detection in the presence of strong technical artifacts. Biomed Signal Process Control. 2019;53:101535. doi:10.1016/j.bspc.2019.04.012
31. Stosic T, Stosic BD. Multifractal analysis of human retinal vessels. IEEE Tans Med Imaging. 2006;25(8):1101–1107. doi:10.1109/TMI.2006.879316
32. Kalitzeos AA, Lip GY, Heitmar R. Retinal vessel tortuosity measures and their applications. Exp Eye Res. 2013;106:40–46. doi:10.1016/j.exer.2012.10.015
33. Leung H, Wang JJ, Rochtchina E, et al. Relationships between Age, Blood Pressure, and Retinal Vessel Diameters in an Older Population. Invest Ophthalmol Vis Sci. 2003;44(7):2900–2904. doi:10.1167/iovs.02-1114
34. Lee TE, Kim YY, Yoo C. Retinal vessel diameter in normal-tension glaucoma patients with asymmetric progression. Graefes Arch Clin Exp Ophthalmol. 2014;252(11):1795–1801. doi:10.1007/s00417-014-2756-6
35. Ikram MK, de Voogd S, Wolfs RC, et al. Retinal vessel diameters and incident open-angle glaucoma and optic disc changes: the Rotterdam study. Invest Ophthalmol Vis Sci. 2005;46(4):1182–1187. doi:10.1167/iovs.04-1459
36. Lee JY, Yoo C, Park JH, et al. Retinal vessel diameter in young patients with open-angle glaucoma: comparison between high-tension and normal-tension glaucoma. Acta Ophthalmol. 2012;90(7):e570–1. doi:10.1111/j.1755-3768.2011.02371.x
37. Kawasaki R, Cheung N, Wang JJ, et al. Retinal vessel diameters and risk of hypertension: the Multiethnic Study of Atherosclerosis. J Hypertens. 2009;27(12):2386–2393. doi:10.1097/HJH.0b013e3283310f7e
38. Wong TY, Shankar A, Klein R, et al. Prospective cohort study of retinal vessel diameters and risk of hypertension. BMJ. 2004;329(7457):79. doi:10.1136/bmj.38124.682523.55
39. Myers CE, Klein R, Knudtson MD, et al. Determinants of retinal venular diameter: the Beaver Dam Eye Study. Ophthalmology. 2012;119(12):2563–2571. doi:10.1016/j.ophtha.2012.06.038
40. Ikram MK, Janssen JA, Roos AM, et al. Retinal vessel diameters and risk of impaired fasting glucose and diabetes: the Rotterdam Study. Diabetes. 2006;55:506–510. doi:10.2337/diabetes.55.02.06.db05-0546
41. Wang JJ, Taylor B, Wong TY, et al. Retinal vessel diameters and obesity: a population-based study in older persons. Obesity. 2006;14(2):206–214. doi:10.1038/oby.2006.27
42. Drance S, Anderson DR, Schulzer M. Risk factors for progression of visual field abnormalities in normal-tension glaucoma. Am J Ophthalmol. 2001;131(6):699–708. doi:10.1016/S0002-9394(01)00964-3
43. Wang S, Xu L, Wang Y, et al. Retinal vessel diameter in normal and glaucomatous eyes: the Beijing eye study. Clin Exp Ophthalmol. 2007;35(9):800–807. doi:10.1111/j.1442-9071.2007.01627.x
44. Amerasinghe N, Aung T, Cheung N, et al. Evidence of retinal vascular narrowing in glaucomatous eyes in an Asian population. Invest Ophthalmol Vis Sci. 2008;49(12):5397–5402. doi:10.1167/iovs.08-2142
45. Zhang X, Dastiridou A, Francis BA, et al. Comparison of Glaucoma Progression Detection by Optical Coherence Tomography and Visual Field. Am J Ophthalmol. 2017;184:63–74. doi:10.1016/j.ajo.2017.09.020
46. Kuroda A, Enemoto N, Ishida K, et al. Movement of retinal vessels toward the optic nerve head after increasing intraocular pressure in monkey eyes with experimental glaucoma. Exp Eye Res. 2017;162:110–115. doi:10.1016/j.exer.2017.07.012
47. Lesk MR, Spaeth GL, Azuara-Blanco A, et al. Reversal of optic disc cupping after glaucoma surgery analyzed with a scanning laser tomograph. Ophthalmology. 1999;10:1013–1101. doi:10.1016/S0161-6420(99)00526-6
48. Radcliffe NM, Smith SD, Syed ZA, et al. Retinal Blood Vessel Positional Shifts and Glaucoma progression. Ophthalmology. 2014;121(4):842–848. doi:10.1016/j.ophtha.2013.11.002
49. Tomita Y, Kubis N, Calando Y, et al. Long-term in vivo investigation of mouse cerebral microcirculation by fluorescence confocal microscopy in the area of focal ischemia. J Cereb Blood Flow Metab. 2005;25(7):858–867. doi:10.1038/sj.jcbfm.9600077
50. Goldman D, Popel AS. A computational study of the effect of capillary network anastomoses and tortuosity on oxygen transport. J Theor Biol. 2000;206(2):181–194. doi:10.1006/jtbi.2000.2113
51. Liew G, Wang JJ, Cheung N, et al. The retinal vasculature as a fractal: methodology, reliability, and relationship to blood pressure. Ophthalmology. 2008;115(11):1951–1956. doi:10.1016/j.ophtha.2008.05.029
52. Grauslund J, Green A, Kawasaki R, et al. Retinal vascular fractals and microvascular and macrovascular complications in type 1 diabetes. Ophthalmology. 2010;117(7):1400–1405. doi:10.1016/j.ophtha.2009.10.047
53. Broe R, Rasmussen ML, Frydkjaer-Olsen U, et al. Retinal vascular fractals predict long-term microvascular complications in type 1 diabetes mellitus: the Danish Cohort of Pediatric Diabetes 1987 (DCPD1987). Diabetologia. 2014;57(10):2215–2221. doi:10.1007/s00125-014-3317-6
54. Koh V, Cheung CY, Zheng Y, et al. Relationship of retinal vascular tortuosity with the neuroretinal rim: the Singapore Malay eye study. Invest Ophthalmol Vis Sci. 2010;51(7):3736–3741. doi:10.1167/iovs.09-5008
55. Cheung CY, Zheng Y, Hsu W, et al. Retinal vascular tortuosity, blood pressure, and cardiovascular risk factors. Ophthalmology. 2011;118(5):812–818. doi:10.1016/j.ophtha.2010.08.045
56. Tham YC, Wong T, Aung T, et al. Relationship between Retinal Vascular Parameters and Optic Nerve/Ganglion Cell-Inner Plexiform Layer Parameters in Non-Glaucomatous Eyes. Invest Ophth Vis Sci. 2013;54:15.
57. Li X, Wong WL, Cheung CY, et al. Racial differences in retinal vessel geometric characteristics: a multiethnic study in healthy Asians. Invest Ophthalmol Vis Sci. 2013;54(5):3650–3656. doi:10.1167/iovs.12-11126
58. Ciancaglini M, Guerra G, Agnifili L, et al. Fractal dimension as a new tool to analyze optic nerve head vasculature in primary open angle glaucoma. Vivo. 2015;29(2):273–279.
 © 2021 The Author(s). This work is published and licensed by Dove Medical Press Limited. The
full terms of this license are available at https://www.dovepress.com/terms
and incorporate the Creative Commons Attribution
- Non Commercial (unported, 3.0) License.
By accessing the work you hereby accept the Terms. Non-commercial uses of the work are permitted
without any further permission from Dove Medical Press Limited, provided the work is properly
attributed. For permission for commercial use of this work, please see paragraphs 4.2 and 5 of our Terms.
© 2021 The Author(s). This work is published and licensed by Dove Medical Press Limited. The
full terms of this license are available at https://www.dovepress.com/terms
and incorporate the Creative Commons Attribution
- Non Commercial (unported, 3.0) License.
By accessing the work you hereby accept the Terms. Non-commercial uses of the work are permitted
without any further permission from Dove Medical Press Limited, provided the work is properly
attributed. For permission for commercial use of this work, please see paragraphs 4.2 and 5 of our Terms.