Back to Journals » Clinical Ophthalmology » Volume 13
Vessel Density in Glaucoma of Different Entities as Measured with Optical Coherence Tomography Angiography
Authors Lommatzsch C ![]() , Rothaus K
, Rothaus K ![]() , Koch JM, Heinz C
, Koch JM, Heinz C ![]() , Grisanti S
, Grisanti S ![]()
Received 7 September 2019
Accepted for publication 14 November 2019
Published 17 December 2019 Volume 2019:13 Pages 2527—2534
DOI https://doi.org/10.2147/OPTH.S230192
Checked for plagiarism Yes
Review by Single anonymous peer review
Peer reviewer comments 3
Editor who approved publication: Dr Scott Fraser
C Lommatzsch,1 K Rothaus,1 JM Koch,1 C Heinz,1,2 S Grisanti3
1Department of Ophthalmology, St. Franziskus Hospital, Muenster 48145, Germany; 2Department of Ophthalmology, University of Essen, Essen, Germany; 3Department of Ophthalmology, University of Luebeck, Luebeck, Germany
Correspondence: C Lommatzsch
Department of Ophthalmology, St. Franziskus Hospital, Hohenzollernring 74, Muenster 48145, Germany
Tel +49 2519352711
Fax +49 2519352719
Email [email protected]
Purpose: To compare papillary and macular vessel density (VD), as measured by optical coherence tomography angiography (OCTA), in eyes with primary open-angle glaucoma (POAG), normal-tension glaucoma (NTG) and exfoliation glaucoma (XFG).
Methods: The papillary and macular VD of 40 eyes with POAG, 19 with NTG and 21 with XFG were examined using OCTA (AngioVue™). The VD was measured at two different layers of segmentation (optic nerve head: radial peripapillary capillary [RPC] and nerve head [NH]; macula: superficial [SL] and deep [DL] retinal vascular plexus) with a 4.5×4.5mm papillary and 6×6-mm macular scan. VD was calculated by an automated density measuring tool in the AngioVue™ software.
Results: There were no significant differences in the total value of the papillary, peripapillary and macular VD. A significantly higher VD could be measured for NTG compared to POAG, as well as for XFG in the inferior nasal peripapillary sector at RPC-segmentation and at the NH-level between NDG and XFG.
Conclusion: OCTA can detect a difference in VD in the nasal inferior peripapillary sector in NTG compared with POAG and XFG. These findings may help to improve the understanding of further pathophysiological mechanisms.
Keywords: OCT angiography, glaucoma entities, blood flow, vessel density
Introduction
Glaucoma is a multifactorial disease and one of the most common causes of blindness in the world.1 The pathogenesis is still not fully understood. As a major risk factor for the development of glaucoma, an increased intraocular pressure is known. Other causative factors such as an altered intracranial pressure,2 influence of scleral rigidity3 can contribute to glaucoma damage. Also, a vascular genesis must be considered as a triggering factor in the development of glaucoma.4,5 The vascular hypothesis is favored especially with regard to eyes that develop glaucoma-specific changes despite a low intraocular pressure. Normal-tension glaucoma (NTG), a subtype of primary open-angle glaucoma (POAG) is the cause of 25–32% of all cases of POAG.6,7 Vascular changes are also known in exfoliation glaucoma (XFG). The changes in this glaucoma type comprise vasculopathy of iris vessels with degeneration of the smooth muscle cells, pericytes, and endothelial cells as well as abnormalities of the endothelial basement membrane and obliteration of the lumen.8
In order to substantiate the vascular hypothesis of glaucoma, many studies with different examination devices have been conducted on blood flow in healthy and glaucomatous eyes. These investigations have found reduced optic nerve head (ONH) and peripapillary blood flow dynamics in glaucoma.9,10 For various reasons (e.g. lack of practicability in everyday routine, inconstant results, absence of reproducible methods of quantification), the different examination techniques used have found no entry into the daily practice of glaucoma diagnosis.
Optical coherence tomography angiography (OCTA) first described for glaucoma detection by Jia et al11 in 2012, is a novel examination technique for imaging the density of blood vessels (called vessel density, VD). The exact technique has been described previously.12 The advantage of OCTA is that the examination is non-invasive can be conducted very quickly, and above all provides a reproducible quantification of VD.13 In glaucoma disease, VD has been shown to be reduced in the area of the ONH and the macula.11,14–16 To ascertain whether the vascular phenomenon is more profound in certain entities of glaucoma, we investigated the VD of the ONH and the macula by OCTA in POAG, NTG, and XFG.
Methods
Study Design
This is a prospective monocentric study conducted at the Department of Ophthalmology, St. Franziskus Hospital Muenster (Germany) and approved by the ethics committee of the Medical Association of Westfalen-Lippe, Germany. The study adhered to the tenets of the Declaration of Helsinki. Eighty eyes were included in the study. All patients provided written informed consent before study entry.
Subjects
Subjects were considered to have POAG if it was diagnosed by an ophthalmologist and showed characteristic optic nerve changes consistent with glaucoma:
Inclusion criteria for all three groups:
- Open drainage angles on gonioscopy;
- Absence of any secondary cause for a glaucomatous optic neuropathy apart from pseudoexfoliation material – for example, a previously raised IOP following trauma, a period of steroid administration, or an episode of uveitis;
- IOP ≤ 21 mmHg on the day of examination, with- or without antiglaucomatous eye drop;
- Glaucomatous optic neuropathy, defined as the presence of at least two of the following characteristics:
- Open drainage angles on gonioscopy,
- Absence of any secondary cause for a glaucomatous optic neuropathy – for example, a previously raised IOP following trauma, a period of steroid administration, or an episode of uveitis,
- Vertical cup-to-disc ratio (VCDR) ≥0.5 (based on HD-OCT measurements) with corresponding reduced RNFL thickness, ganglion cell complex (GCC) defects on OCT analysis consistent with glaucoma,
- VCDR asymmetry ≥0.2.
The POAG group included all subjects who met not criteria for NTG or XFG.
We have included the following criteria for the definition of NTG:
- A mean IOP off treatment consistently equal to or less than 21 mmHg on diurnal testing, with no single measurement greater than 23 mmHg
The diagnosis of XFG was made on the basis of clinically visible criteria on slit-lamp examination: white, flaky material on the pupillary border of the iris or on the anterior surface of the lens and/or the “three-ring sign” on the anterior lens capsule.
Exclusion criteria:
- Significant media opacity preventing high-quality imaging,
- Age <18 years,
- Refractive error >±6 D sphere and ±2 D cylinder,
- Previous intraocular surgery except for uncomplicated cataract extraction with IOL implantation in the bag, at least 6 months ago,
- Any ocular disease other than glaucoma or cataract,
- Arterial hypertension, hypotension, diabetes or any other vascular diseases such as status post heart failure, apoplexy or thrombosis,
- Systemic drugs with an effect on vascular diameter either dilation or construction.
Examination
Prior to OCTA measurement all patients underwent detailed ophthalmic examination including best-corrected visual acuity (BCVA), slit-lamp biomicroscopy with indirect ophthalmoscope and Goldmann applanation tonometry and visual field examination (mode 30-2, Humphrey Field Analyzer (HFA); SAP, 30-2 SITA standard test, Zeiss, Jena, Germany).
The relevant medical history and the current glaucoma medication were documented. The thickness of the peripapillary retinal nerve fiber layer (RNFL) and ganglion cell complex (GCC) were measured with spectral-domain optical coherence tomography (SD-OCT, RTVue-XR; Optovue, Inc., Fremont, California, USA; software version 2016.2.035).
Optical Coherence Tomography Angiography
AngioVue™ (RTVue-XR; Optovue, Fremont, CA, USA, software version 2016.2.035), was used to capture the OCTA images. All participants underwent SD-OCT and OCTA imaging on the same day. Poor-quality images – defined by a signal strength index (SSI) ≤40 – were excluded from analysis. A series of two OCT volumes are obtained from the same region, first scanning acquiring B-scans in the horizontal direction, followed by scanning in the vertical (orthogonal) direction to decrease motion artifacts and fixation changes.17 A 6 × 6 mm grid centered on the fovea was chosen to scan the macular region while a 4.5 × 4.5 mm grid centered on the optic disc was used to scan the nerve head. The ONH scans were automatically segmented into two layers with the following boundaries: the “nerve head” (NH) had its inner boundary at 2000 µm beneath the internal limiting membrane (ILM) and its outer boundary at 150 µm beneath the inner plexiform layer (IPL). The “radial peripapillary capillary” (RPC) segment is a slab from the ILM to the RNFL posterior boundary. The macular scan is also split into two segments: a superficial layer (SL = ILM 3µm to IPL 15µm) and a deep layer (DL = 15µm to IPL 71µm below the IPL). We did not use the 3 × 3-mm macula scan because the area of the macula is most vulnerable to glaucomatous damage outside the central 3 × 3-mm zone.18 Perhaps detectable reduced VD is outside the 3 × 3mm zone and therefore could not be measured. VD was measured using the automated density measure tool in the AngioVue™ software. At the optic disc, it was divided into six sectors based on the Garway-Heath map centered on the optic disc. At the macular region, there were two circles measured. The inner circle (fovea) was 1 mm and the outer circle was 6 mm (parafovea) in diameter. The bigger circle was subdivided into four quadrants.
Statistical Analysis
MedCalc® Version 18.9 (MedCalc Software bvba, Ostend, Belgium; 2018) and R Version 3.2.5 (Dormagen, Germany) were used for all statistical analysis. Normal distribution of the data was checked by means of the Kolmogorov–Smirnov test and data were expressed as mean ± standard deviation (range) for Gaussian distributed values (t-test), and medians (interquartile range) for nongaussian distribution (Wilcoxon rank-sum test).
To determine whether the medians of the three groups are different we used the Kruskal–Wallis test and, if appropriate, the Conover test in order to localize established significances in the sense of post-hoc analysis between the groups.
Results
A total of 102 eyes were included in the study. We adhere to the signal quality limits specified by the device manufacturer for assessing good recordings. The mean image quality (SSI) was 55 in our measurements in the area of the optic nerve and the macula.
In 22 eyes, the image did not show sufficient image quality, so they had to be excluded. Eighty eyes were analyzed, of which 40 had POAG, 21 had XFG, and 19 had NTG. The patients in the NTG group were significantly younger, and for that reason, the duration of their illness was shorter. The NTG group was significantly more myopic, and the POAG group had less ONH excavation and a slightly thicker GCC layer, whereas there was no significant difference in the RNFL thickness between the three groups. However, the difference between the groups in terms of the only minimal significant difference in the GCC and CDR with a p-value of 0.04 is negligible. Mean defect was higher in NTG group. It has been reported that visual field defects are more likely to be deeper, steeper, and closer to fixation in NTG compared to high-tension glaucoma.19,20 For this reason, this also reflects a change typical of the disease (Table 1).
 |
Table 1 Demographic and Ocular Characteristics of the Study Population |
The papillary VD (pVD) in the RPC layer is shown in Table 2 and the NH layer is described in Table 3.
 |
Table 2 OCTA Results for ONH Vessel Density in the RPC Layer |
 |
Table 3 OCTA Results for ONH Vessel Density in the NH Layer |
At the optic nerve head, there was no significant difference between the three groups either at the RPC level or at the NH level apart from the inferior nasal peripapillary area. In this sector, at the more superficial RPC level, the VD is highest in NDG-group and differs significantly from the PEX and POAG groups. The ratio is similar at the NH segmentation level: the NDG group has a significantly higher VD than the PEX group.
Looking at the macular results of the VD, there were no significant differences, either in the superficial (Table 4) or in the deep vascular plexus (Table 5).
 |
Table 4 OCTA (AngioVue™) Parameters for Macular VD Segmentation of the Superficial Layer (SL) |
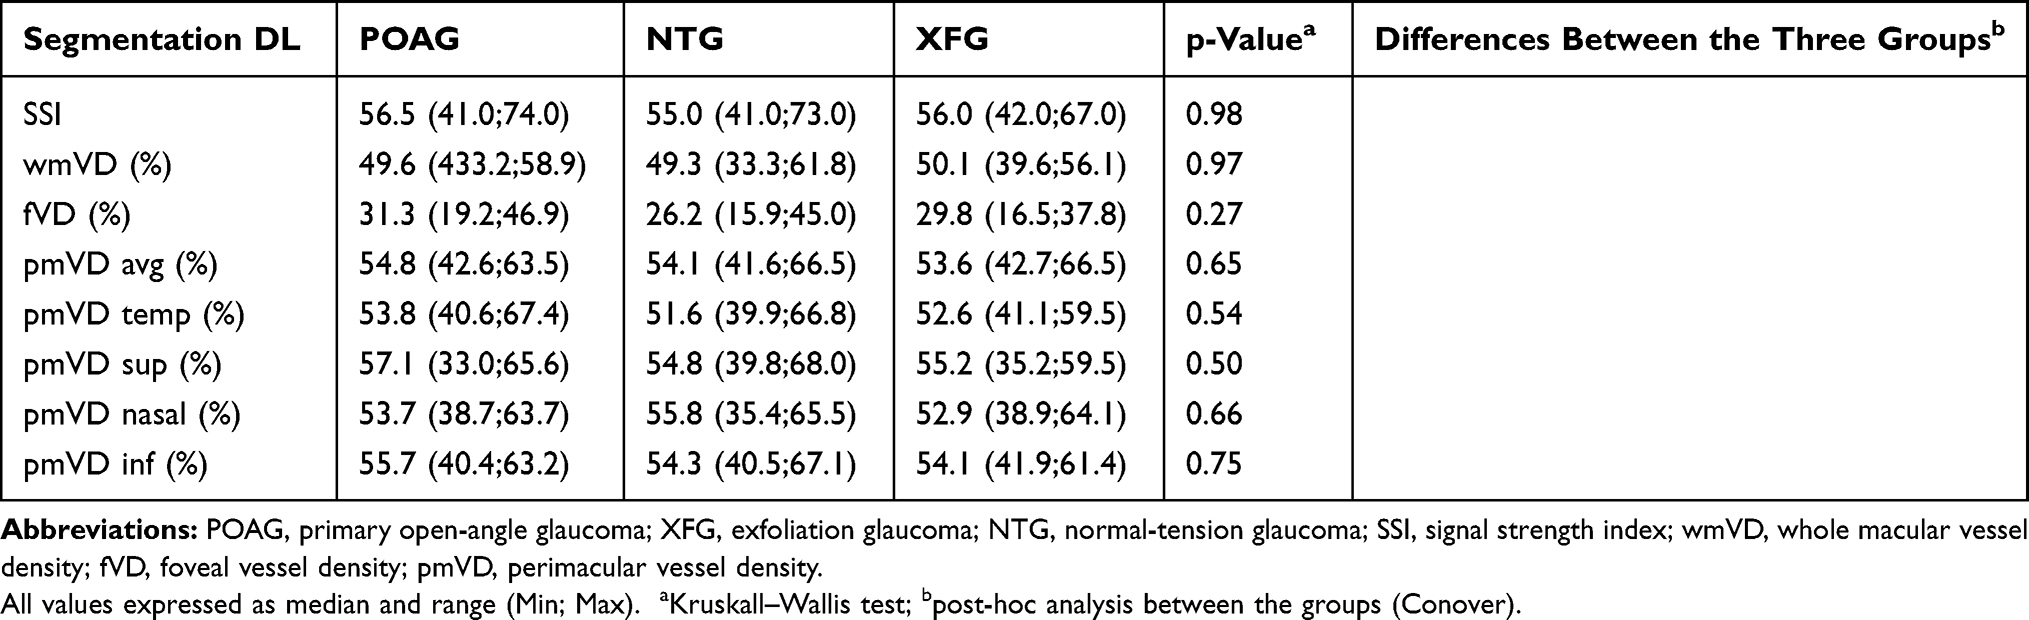 |
Table 5 OCTA (AngioVue™) Parameters for Segmentation for Macular VD of the Deep Layer (DL) |
Discussion
The fact that intraocular pressure is not the only factor playing a role in the pathophysiology of glaucoma is now established knowledge.21 For example, Doppler sonography, fluorescein angiography, or laser Doppler flowmetry (LDF) can be used to measure potential circulatory abnormalities. Most research on ocular blood flow and glaucoma has been carried out with LDF and confocal scanning LDF (cSLDF) on decreased nerve head blood flow in POAG patients.22,23 These techniques have also been used to investigate differences among glaucoma entities. Kaiser et al demonstrated by means of color Doppler imaging that there is a significant reduction of retrobulbar blood flow in NTG.24 Chung and coworkers showed that NTG is characterized by reduced blood flow in the peripapillary retina as measured by cSLDF.25 Impaired retrobulbar hemodynamics have been identified in exfoliation syndrome and exfoliation glaucoma.26–28 However, these methods have not been established in everyday clinical practice for various reasons, e.g., due to invasiveness (fluorescein angiography) or, especially, because an individual diagnosis is not possible on the basis of circulatory abnormalities alone or because of a lack of quantifiable parameters. Owing to these difficulties, the diagnosis of perfusion disorders is often based on the presence of indirect signs such as vasospastic syndrome, arterial hypotension, migraine, or tinnitus.
OCTA, on the other hand, provides a noninvasive three-dimensional quantification of retinal blood flow (vessel density, VD) based on measurement of erythrocyte movement over time. The details of this technique have been extensively described.11 VD can be examined at various capillary network levels and, above all, can be quantified reproducibly.13 It has been reported previously that papillary and macular VD is lower in glaucomatous eyes than in age-matched normal eyes.11,14
We were able to learn from our preliminary work that in glaucomatous eyes vessel density is significantly reduced in comparison to healthy eyes15,29 and that on average in healthy eyes there is a papillary vessel density of more than 50%.29 Most of the research using OCTA has compared the VD of healthy eyes and eyes with POAG, with few publications considering different glaucoma entities in detail. Rao et al have looked at the VD in narrow-angle glaucoma (NAG) and other narrow-angle situations. Eyes with NAG were found to have significantly lower VD, both peripapillary and macular, than healthy control eyes,30 whereas those with narrow-angle anatomy without glaucomatous lesions did not have lower VD. Two papers examined persons with a narrow-angle situation in both eyes who had suffered an acute angle-closure attack in one eye. Comparison between the two eyes showed that the eyes with a condition post-acute primary angle closure had significantly lower peripapillary VD than the contralateral eyes.31,32
Suwan and coworkers33 deal with the topic of peripapillary blood flow measured by OCTA in exfoliation syndrome, XFG and POAG compared with healthy eyes. The blood flow was calculated using MATLAB software (The Mathworks, Inc., Natick, MA, USA) and perfused capillary density (PCD). The results showed that PCD decreased from healthy persons through exfoliation syndromes and POAG to XFG. The investigators subdivided the peripapillary area into four quadrants and found constant significant differences among them. In our comparison between XGF and POAG, we could not find any significant difference.
Three studies investigated the blood flow in NTG. Shin et al34 compared eyes with NTG (n = 52) to a healthy control group (n = 51) using AngioPlex OCTA (Carl Zeiss, Jena, Germany). To calculate the peripapillary VD at in two layers (superficial and deep), a MATLAB software was used. In this study, the average peripapillary vessel density (VD) of NTG patients was decreased in both superficial (10.5% reduction) and deep retinal (5.6% reduction) retinal layers, compared to with healthy eyes.
Scripsema et al35 compared POAG (n = 40) with NTG (n = 26) and healthy eyes (n = 26). This was a retrospective evaluation of peripapillary PCD with two different diameters of 3.5 and 4.5mm as measured by RTVue OCTA (Optovue, Fremont. CA, USA). The network of capillaries was determined from the ILM to the posterior boundary of the RNFL. A comparison was made with perimetry (Humphrey Field Analyzer II) and RNFL (Cirrus HDT OCT 500, Carl Zeiss Meditech, Inc.). The PCD was significantly lower in the two glaucoma groups than in the healthy eyes, with no difference between the two circular scan sizes. The POAG group had a significantly lower PCD than the NTG group (p <0.01).
Bojikian et al,36 in contrast, found no difference in optic disk perfusion between POAG (n=30) and NTG (n=31).
Our patient collective is similar to those of Scripsema et al35 and Bojikian et al.36
In contrast to Scripsema et al, we found no significant difference for the total value of peripapillary VD (wpVD) between POAG and NTG/XFG neither at the RPC layer nor at the NH layer. The reason for this discrepancy may lie in the retrospective nature of the data of Scripsema et al. Furthermore, they carried out no further subdivision of the annular PCD.
When dividing the peripapillary VD our results into six sectors, we found a significantly higher VD in the NDG group in the inferior nasal peripapillary area, at RPC level compared to POAG and XFG group (p=0.017), at NH level compared to XFG (p=0.04). The significant change we did not expected in the nasal quadrant, but rather in the temporal area because it corresponds to the main pathway followed by radial parapapillary capillaries, which run mainly superior-temporal and inferior-temporal 6–7 mm from the optic disc.37 In larger group numbers, the difference in the nasal inferior sector must be observed. Furthermore, it is noticeable that especially in the NDG group, where a vascular cause is suspected, the peripapillary VD is highest in the inferior nasal sector. This too must be questioned in the following work. In our study, we not only examined the macular VD in the superficial layer, but also evaluated the capillary mesh at a deeper segmentation, because the RPCs, which are the most superficial layer of capillaries, lying in the inner part of the RNFL, anastomose with deep capillaries.37 However, differences between the individual entities could not be found in either segmentation level.
Our study has several limitations. First, the sample size is relatively small, which may lead to selection bias.
The study participants were receiving local antiglaucomatous therapy. Although there was no significant difference between the groups in terms of number of agents, there may have been differences between the substances used. The exact effect of antihypertensive eyedrops on VD is not yet known and should be explored in further studies. For ethical reasons, we did not discontinue medication before OCTA. Furthermore, we did not measure blood pressure, but excluded all patients who had known arterial hypertension or hypotension, other vascular diseases, or were taking vasoactive medications. An association of blood pressure with ocular blood flow is likely, although a previous study found no significant correlation between blood pressure and ONH VD.38
With regard to various ocular characteristics of the study population, we included aberrant glaucoma groups. The NTG group was younger and had more advanced visual field defects (MD). As already mentioned in “Results” section, an NTG is subject to special features. The affected patients are younger at the time of the disease and visual field defects are more likely to be deeper.19,20 For these reasons, we represent with our work a normal patient collective. There is also a significant difference in the age and the time since first diagnosis of glaucoma of the group of primary open-angle glaucomas compared to XFG. A possible influence on the results can not be safely excluded.
In conclusion, our spectral-domain OCTA study did not show decreased overall values for the peripapillary or macular VD at different segmentation layers. In the subanalysis of the peripapillary values, inferior nasal sector VD at RPC-level was significantly higher in NTG eyes than in POAG- and XFG-eyes and NDG-VD was significantly higher than XFG-VD at NH-level. More long-term studies with larger case numbers are required to further investigate whether vascular dysfunction has a causal link to different glaucoma entities.
Ethics Approval
This study was approved by the ethics committee of the Medical Association of Westfalen-Lippe, Germany (2016-148-f-S).
Acknowledgement
The contents of this paper were presented as a lecture at the Congress of the German Ophthalmological Society (DOG) on September 30, 2017, in Berlin.
Disclosure
CL reports lecturing for Optovue. The authors report no other conflicts of interest in this work.
References
1. Flaxman SR, Bourne RRA, Resnikoff S, et al. Global causes of blindness and distance vision impairment 1990–2020: a systematic review and meta-analysis. Lancet Glob Health. 2017;5(12):e1221–e1234. doi:10.1016/S2214-109X(17)30393-5
2. Jonas JB. Role of cerebrospinal fluid pressure in the pathogenesis of glaucoma. Acta Ophthalmol (Copenh). 2011;89(6):505–514. doi:10.1111/j.1755-3768.2010.01915.x
3. Ebneter A, Wagels B, Zinkernagel MS. Non-invasive biometric assessment of ocular rigidity in glaucoma patients and controls. Eye Lond Engl. 2009;23(3):606–611. doi:10.1038/eye.2008.47
4. Cherecheanu AP, Garhofer G, Schmidl D, Werkmeister R, Schmetterer L. Ocular perfusion pressure and ocular blood flow in glaucoma. Curr Opin Pharmacol. 2013;13(1):36–42. doi:10.1016/j.coph.2012.09.003
5. Wang L, Cull GA, Fortune B. Optic nerve head blood flow response to reduced ocular perfusion pressure by alteration of either the blood pressure or intraocular pressure. Curr Eye Res. 2015;40(4):359–367. doi:10.3109/02713683.2014.924146
6. Klein BE, Klein R, Sponsel WE, et al. Prevalence of glaucoma. The beaver dam eye study. Ophthalmology. 1992;99(10):1499–1504. doi:10.1016/S0161-6420(92)31774-9
7. Thomas R, Muliyil J. Egna-Neumarkt glaucoma study. Ophthalmology. 2001;108(9):1514. doi:10.1016/S0161-6420(01)00666-2
8. Harju M, Kurvinen L, Saari J, Vesti E. Blood flow in the peripapillary retina in exfoliation glaucoma. Clin Experiment Ophthalmol. 2008;36(8):738–743. doi:10.1111/j.1442-9071.2008.01884.x
9. Piltz-Seymour JR. Laser Doppler flowmetry of the optic nerve head in glaucoma. Surv Ophthalmol. 1999;43(Suppl 1):S191–S198. doi:10.1016/S0039-6257(99)00053-3
10. Tobe LA, Harris A, Hussain RM, et al. The role of retrobulbar and retinal circulation on optic nerve head and retinal nerve fibre layer structure in patients with open-angle glaucoma over an 18-month period. Br J Ophthalmol. 2015;99(5):609–612. doi:10.1136/bjophthalmol-2014-305780
11. Jia Y, Morrison JC, Tokayer J, et al. Quantitative OCT angiography of optic nerve head blood flow. Biomed Opt Express. 2012;3(12):3127–3137. doi:10.1364/BOE.3.003127
12. Jia Y, Tan O, Tokayer J, et al. Split-spectrum amplitude-decorrelation angiography with optical coherence tomography. Opt Express. 2012;20(4):4710–4725. doi:10.1364/OE.20.004710
13. Manalastas PIC, Zangwill LM, Saunders LJ, et al. Reproducibility of optical coherence tomography angiography macular and optic nerve head vascular density in glaucoma and healthy eyes. J Glaucoma. 2017;26(10):851–859. doi:10.1097/IJG.0000000000000768
14. Xu H, Kong XM. [Study of retinal microvascular perfusion alteration and structural damage at macular region in primary open-angle glaucoma patients]. Zhonghua Yan Ke Za Zhi. 2017;53(2):98–103.
15. Lommatzsch C, Rothaus K, Koch JM, Heinz C, Grisanti S. OCTA vessel density changes in the macular zone in glaucomatous eyes. Graefes Arch Clin Exp Ophthalmol. 2018;256:1499–1508. doi:10.1007/s00417-018-3965-1
16. Lommatzsch C, Koch JM, Claußnitzer H, Heinz C. [OCT angiography of the glaucoma optic nerve]. Klin Monatsbl Augenheilkd. 2018;235(2):205–211. doi:10.1055/s-0042-123830
17. Kraus MF, Potsaid B, Mayer MA, et al. Motion correction in optical coherence tomography volumes on a per A-scan basis using orthogonal scan patterns. Biomed Opt Express. 2012;3(6):1182–1199. doi:10.1364/BOE.3.001182
18. Hood DC, Raza AS, de Moraes CGV, Liebmann JM, Ritch R. Glaucomatous damage of the macula. Prog Retin Eye Res. 2013;32:1–21. doi:10.1016/j.preteyeres.2012.08.003
19. Araie M. Pattern of visual field defects in normal-tension and high-tension glaucoma. Curr Opin Ophthalmol. 1995;6(2):36–45. doi:10.1097/00055735-199504000-00007
20. Thonginnetra O, Greenstein VC, Chu D, Liebmann JM, Ritch R, Hood DC. Normal versus high tension glaucoma: a comparison of functional and structural defects. J Glaucoma. 2010;19(3):151–157. doi:10.1097/IJG.0b013e318193c45c
21. Flammer J, Orgül S, Costa VP, et al. The impact of ocular blood flow in glaucoma. Prog Retin Eye Res. 2002;21(4):359–393. doi:10.1016/s1350-9462(02)00008-3
22. Findl O, Rainer G, Dallinger S, et al. Assessment of optic disk blood flow in patients with open-angle glaucoma. Am J Ophthalmol. 2000;130(5):589–596. doi:10.1016/S0002-9394(00)00636-X
23. Grunwald JE, Piltz J, Hariprasad SM, DuPont J. Optic nerve and choroidal circulation in glaucoma. Invest Ophthalmol Vis Sci. 1998;39(12):2329–2336.
24. Kaiser HJ, Schoetzau A, Stümpfig D, Flammer J. Blood-flow velocities of the extraocular vessels in patients with high-tension and normal-tension primary open-angle glaucoma. Am J Ophthalmol. 1997;123(3):320–327. doi:10.1016/S0002-9394(14)70127-8
25. Chung HS, Harris A, Kagemann L, Martin B. Peripapillary retinal blood flow in normal tension glaucoma. Br J Ophthalmol. 1999;83(4):466–469. doi:10.1136/bjo.83.4.466
26. Yüksel N, Karabaş VL, Demirci A, Arslan A, Altintaş O, Cağlar Y. Comparison of blood flow velocities of the extraocular vessels in patients with pseudoexfoliation or primary open-angle glaucoma. Ophthalmologica. 2001;215(6):424–429. doi:10.1159/000050902
27. Martinez A, Sanchez M. Ocular haemodynamics in pseudoexfoliative and primary open-angle glaucoma. Eye Lond Engl. 2008;22(4):515–520. doi:10.1038/sj.eye.6702676
28. Kocaturk T, Isikligil I, Uz B, Dayanir V, Dayanir YO. Ophthalmic artery blood flow parameters in pseudoexfoliation glaucoma. Eur J Ophthalmol. 2016;26(2):124–127. doi:10.5301/ejo.5000671
29. Lommatzsch C, Rothaus K, Koch JM, Heinz C, Grisanti S. Vessel density in OCT angiography permits differentiation between normal and glaucomatous optic nerve heads. Int J Ophthalmol. 2018;11(5):835–843. doi:10.18240/ijo.2018.05.20
30. Rao HL, Pradhan ZS, Weinreb RN, et al. Vessel density and structural measurements of optical coherence tomography in primary angle closure and primary angle closure glaucoma. Am J Ophthalmol. 2017;177:106–115. doi:10.1016/j.ajo.2017.02.020
31. Zhang S, Wu C, Liu L, et al. Optical coherence tomography angiography of the peripapillary retina in primary angle-closure glaucoma. Am J Ophthalmol. 2017;182:194–200. doi:10.1016/j.ajo.2017.07.024
32. Wang X, Jiang C, Kong X, Yu X, Sun X. Peripapillary retinal vessel density in eyes with acute primary angle closure: an optical coherence tomography angiography study. Graefes Arch Clin Exp Ophthalmol. 2017;255(5):1013–1018. doi:10.1007/s00417-017-3593-1
33. Suwan Y, Geyman LS, Fard MA, et al. Peripapillary perfused capillary density in exfoliation syndrome and exfoliation glaucoma versus POAG and healthy controls: an OCTA study. Asia-Pac J Ophthalmol Phila Pa. 2017. doi:10.22608/APO.2017318
34. Shin JW, Sung KR, Lee JY, Kwon J, Seong M. Optical coherence tomography angiography vessel density mapping at various retinal layers in healthy and normal tension glaucoma eyes. Graefes Arch Clin Exp Ophthalmol. 2017;255(6):1193–1202. doi:10.1007/s00417-017-3671-4
35. Scripsema NK, Garcia PM, Bavier RD, et al. Optical coherence tomography angiography analysis of perfused peripapillary capillaries in primary. Glaucoma O-A, Glaucoma N-T. Invest Ophthalmol Vis Sci. 2016;57(9):OCT611–OCT620. doi:10.1167/iovs.15-18945
36. Bojikian KD, Chen C-L, Wen JC, et al. Optic disc perfusion in primary open angle and normal tension glaucoma eyes using optical coherence tomography-based microangiography. PLoS One. 2016;11(5):e0154691. doi:10.1371/journal.pone.0154691
37. Zhang H, Scanning electron-microscopic study of corrosion cats on retinal and choroidal angioarchitecture in man and animals. Prog Retin Eye Res. 1994;13:243–270. doi:10.1016/1350-9462(94)90012-4
38. Liu L, Jia Y, Takusagawa HL, et al. Optical coherence tomography angiography of the peripapillary retina in glaucoma. JAMA Ophthalmol. 2015;133(9):1045–1052. doi:10.1001/jamaophthalmol.2015.2225
 © 2019 The Author(s). This work is published and licensed by Dove Medical Press Limited. The
full terms of this license are available at https://www.dovepress.com/terms
and incorporate the Creative Commons Attribution
- Non Commercial (unported, 3.0) License.
By accessing the work you hereby accept the Terms. Non-commercial uses of the work are permitted
without any further permission from Dove Medical Press Limited, provided the work is properly
attributed. For permission for commercial use of this work, please see paragraphs 4.2 and 5 of our Terms.
© 2019 The Author(s). This work is published and licensed by Dove Medical Press Limited. The
full terms of this license are available at https://www.dovepress.com/terms
and incorporate the Creative Commons Attribution
- Non Commercial (unported, 3.0) License.
By accessing the work you hereby accept the Terms. Non-commercial uses of the work are permitted
without any further permission from Dove Medical Press Limited, provided the work is properly
attributed. For permission for commercial use of this work, please see paragraphs 4.2 and 5 of our Terms.