Back to Journals » Vascular Health and Risk Management » Volume 18
Ventricular Function and Cardio-Ankle Vascular Index in Patients With Pulmonary Artery Hypertension
Authors Radchenko GD ![]() , Botsiuk YA, Sirenko YM
, Botsiuk YA, Sirenko YM ![]()
Received 30 August 2022
Accepted for publication 18 November 2022
Published 28 December 2022 Volume 2022:18 Pages 889—904
DOI https://doi.org/10.2147/VHRM.S385536
Checked for plagiarism Yes
Review by Single anonymous peer review
Peer reviewer comments 2
Editor who approved publication: Prof. Dr. Pietro Scicchitano
Ganna Dmytrivna Radchenko, Yurii Anatoliiovych Botsiuk, Yuriy Mykolaiyovich Sirenko
State Institution “National Scientific Center “The M.D. Strazhesko Institute of Cardiology, Clinical and Regenerative Medicine of the National Academy of Medical Science of Ukraine”, Kyiv, Ukraine
Correspondence: Ganna Dmytrivna Radchenko, State Institution National Scientific Center “The M.D. Strazhesko Institute of Cardiology, Clinical and Regenerative Medicine of the National Academy of Medical Science of Ukraine”, 5, Svyatoslava Khorobroho str., Kyiv, 03151, Ukraine, Tel +38-0667128405, Email [email protected]
Abstarct:
Aim: This study aims to evaluate the left ventricle (LV) systolic and diastolic function in patients with idiopathic pulmonary arterial hypertension (IPAH) and its correlation with systemic arterial stiffness assessed by cardio-ankle vascular index (CAVI).
Patient and methods: We included 37 patients with IPAH and 20 healthy people matched by age. All patients were assessed: vital signs, 6-minute walk test, NT-proBNP level, the CAVI, the right ventricular (RV) and LV function parameters, including ejection time (ET), tissue speckle-tracking values – global longitudinal strain (GLS) and strain rate (SR).
Results: The groups were matched by age, gender, BMI, office SBP and DBP. Patients with IPAH had higher heart rate, NT-proBNP level and lower ferritin level, GFR (CKD-EPI), SaO2 than healthy people. The mean CAVIleft was higher in IPAH patients than in the control group- 8.7± 1.1 vs 7.5± 0.9, P=0.007. Healthy people had significantly less E/e’ and lower IVRT. LVET and RVET were shorter in IPAH patients. Patients with IPAH had mean LVGLS –(− 17.6± 4.8%) and 35.1% of them were with LVGLS ≤ 16% compared to healthy people –(− 21.8± 1.4%) and 0%, respectively. LVSR was significant less in IPAH patients, but in the normal range. We found significant correlations of CAVI with age, history of syncope, bilirubin, uric acid, total cholesterol, cardiac output, cardiac index, RVET, LVET and E/A. Multiple linear regression confirmed the independent significance for age (β=0.083± 0.023, CI 0.033– 0.133) and RVET (β=-0.018± 0.005, CI -0.029 to − 0.008) only. The risk to have CAVI ≥ 8 increased in 5.8 times in IPAH patients with RVET < 248 ms (P=0.046). CAVI did not correlate with LVGLS and LVSR.
Conclusion: Significant worse systolic and diastolic LV functions were stated in pulmonary hypertensive patients compared to the control group. No LV GLS, no LV SR had significant associations with arterial stiffness evaluated by CAVI.
Keywords: pulmonary artery hypertension, cardio-ankle vascular index, left and right ventricle ejection time, global longitudinal strain of right and left ventricles, left ventricular systolic and diastolic function
Introduction
The idiopathic pulmonary arterial hypertension (IPAH) is a rare disease assessed by increasing of the mean pulmonary artery blood pressure (mPAP) >20 mmHg and the pulmonary vascular resistance (PVR) >240 dynes*s*cm−5 (3 Woods) with pulmonary artery wedge pressure (PAWP) ≤15 mmHg and without known reasons for this.1,2 Pathogenesis included the pulmonary arteriopathy with intima-media hypertrophy, plexiform remodeling and thrombosis in situs. The narrowing and the number reduction of the pulmonary small arteries lead to the increasing of the PVR.3 The right ventricle (RV) starts to be overloaded and enlarged in accordance with Frank–Starling’s mechanism. At the same time, the left ventricle (LV) is underloaded because of the less blood returning via pulmonary veins and the compressing by the enlarged hypertrophic RV. This resulted in a small stroke volume, especially during physical exercise. At the beginning of the disease, cardiac output may be supported by compensatory heart rate increasing, but progressive RV enlargement, myocardial ischemia, metabolic disorders could lead to LV function attenuation. First of all, diastolic LV dysfunction could be detected and then systolic function violations could be diagnosed too.
Traditionally, the researcher’s attention was concentrated on the right heart morphology and functional changes in IPAH patients. However, in the last years, a lot of studies have been devoted to the LV function and geometry assessments.4–9 It became possible with the development of the new technics of the heart visualization – the speckle-tracking tissue echocardiography and 3-D magnetic resonance tomography. These methods help to discover the early impairment of myocardial function and to provide the assessments of factors associated with this worsening that stimulated to the organization of new studies dedicated to searching of new approaches.
Some studies demonstrated the correlation of arterial pulse wave velocity or cardio-ankle vascular index (CAVI) with LV diastolic and systolic parameters.10 Pulse wave velocity is a gold standard for the aorta stiffness evaluation, but it depends on the blood pressure. The CAVI is a blood pressure-independent marker of the arterial stiffness. In our previous studies, we determined the CAVI was significantly increased compared to healthy individuals and not significantly different from the one in systemic hypertensive patients.11 It was considered patients with vascular diseases (the pulmonary or the systemic hypertension) have the same mechanisms of vascular damage, including endothelium dysfunction, systemic inflammation and metabolic disorders. These infringements could not be presented isolated in only one systemic or pulmonary circulation circle, but in both simultaneously. Arterial stiffness attenuation could be observed in both diseases.
Previously, we demonstrated only CAVI, but not pulse wave velocity, had a correlation with RV function and a poor prognosis in patients with newly diagnosed IPAH patients.11,12 Explaining these relationships we supposed the CAVI may attenuate the LV strain, but we did not verify this hypothesis. We did not meet any other studies devoted to this.
Thus, it was previously shown patients with IPAH had not only RV, but LV dysfunction and increased systemic arterial stiffness, but it is still unknown if LV dysfunction could be explained only by RV enlargement or by deterioration of arterial stiffness too. The aim of this study was to evaluate LV systolic and diastolic function in patients with IPAH in comparison with healthy people and to find if there are any correlations between LV function parameters and systemic arterial stiffness assessed by CAVI. The results could be used for planning larger size study to confirm our hypothesis about the pathogenetic role of arterial stiffness worsening in pulmonary hypertensive patients.
Patients
We included 37 patients with IPAH and 20 healthy people matched by age. IPAH was diagnosed after right heart catheterization (RHC) and exclusion of any secondary reasons for pulmonary hypertension development. The precapillary pulmonary hypertension was assessed in appliance with sixth Word Pulmonary hypertension symposium criteria: mPAP ≥20 mmHg, PVR ≥240 dyn*s/cm5, pulmonary artery wedge pressure (PAWP) ≤15 mmHg at rest.1,2 Inclusion criteria were a newly diagnosed IPAH, age ≥18 and the signing of informed consent form for personal data analysis. Patients were excluded if they had concomitant diseases or states, which could influence on the systemic arterial stiffness: diabetes mellitus, severe chronic kidney diseases, coronary heart disease, peripheral vascular diseases, obesity, systemic arterial hypertension, history of stroke or other systemic artery or autoimmune diseases.
The control group included people without any clinical and instrumental signs of cardiovascular, endocrine or systemic diseases, who signed informed consent forms for personal data processing.
Unacceptable transthoracic echocardiography (TTE) images were exclusion criteria for both groups.
The study protocol was approved by the local ethics committee of the State Institution “National Scientific Center “The M.D. Strazhesko Institute of Cardiology, Clinical and Regenerative Medicine of the National Academy of Medical Science of Ukraine”. and the study has been provided in compliance with the Good Clinical Practice guidelines and the Declaration of Helsinki.
The Study Design
This study was designed as a pilot smaller-sized research in the preliminary verification of the feasibility of our hypothetical approach (the increased arterial stiffness is associated with the deterioration of the LV function in IPAH patients) to be used in a larger study. In case of positive results, we would provide the multicentral study with calculations of sample sizes based on these pilot research results. We selected all patients with newly diagnosed IPAH and with inclusion/without exclusion criteria who were treated in our department in period between January 2019 and December 2021. Then, we found healthy subjects matched by age. We provided almost the same examinations for both groups and compared their characteristics for the demonstration that IPAH patients had the real abnormal parameters. Special attention was paid to TTE characteristics and to the evaluation of LV and RV function.
The primary endpoints in the study were 1) comparison of RV and LV strain between the IPAH patient subgroups with abnormal (CAVI ≥8) and normal (CAVI <8) arterial stiffness and 2) the comparison of CAVI between the IPAH subgroups with abnormal (LVGLS ≤16%) and normal (LVGLS >16%) LV systolic function evaluated by strain. The secondary endpoints were as follows: 1) the comparison of TTE parameters between the IPAH and control groups; 2) the assessment of variables correlated significantly with CAVI; and 3) the evaluation of variables correlated significantly with LV strain in IPAH patients.
Methods
A routine vital sign evaluation was conducted in all patients. Systolic (SBP) and diastolic (DBP) arterial blood pressure (BP) were measured three times on both arms by the Omron M-10 (Omron Healthcare Co., Ltd., Kyoto, Japan) in a sitting position after 10 minutes of rest. The mean of three measurements at arm with higher values was included in the database. Heart rate (HR) was assessed after the second BP measurement. Body weight and height were evaluated with SECA 220 (Seca GmbH & Co, Hamburg, Germany). Body mass index was calculated using the following formula: weight/(height in m)2. Ambulatory blood pressure monitoring device ABPM-04 was provided by Meditech (Budapest, Hungary) for exclusion of systemic arterial hypertension.
In appliance with American Thoracic Society guidelines and routine local standards, a 6-minute walking test (6MWT) in all included in the study individuals was conducted twice with at least 2 hours between tests, and the best result was used in our analysis.13,14 SBP, DBP, HR, oxygen saturation (SaO2) and dyspnea score (Borg Dyspnoea Score) were fixed at rest and just after the test.
TTE was provided using standard measurements (Imagic Agile Kontron, Kontron Medical SAS, Plaisir Cedex, France) in accordance with the American Society of Echocardiography and European Association of Cardiovascular Imaging recommendations.15 Participants were asked to abstain from smoking, heavy exercise, and drinking alcohol or caffeine-containing beverages for at least 3 h before TTE.
We evaluated LV/RV and left (LA)/right (RA) atrial sizes and volumes (by modified biplane Simpson method), ejection fraction (EF) and ejection time (ET), stroke volume (SV), pulmonary valve velocity values, tricuspid annular plane systolic excursion (TAPSE), tricuspid regurgitation velocity, calculated systolic pulmonary BP (SPBP), and inferior vena cava size. RVET was measured from the RV outflow pulsed-wave Doppler signal as the interval from the onset of forward flow to the pulmonic valve closure.16 LV diastolic function assessment included the ratio between early (E) and late (A) left ventricle filling (E- and A-wave – mitral E/A ratio); time of the rapid flow velocity declines in early diastole (E-wave deceleration time = DT); the velocity of filling of the ventricle to start after the ventricle relaxes (length of the isovolumetric relaxation time = IVRT), the ratio between the maximum velocity of the E-wave of mitral valve inflow and the maximal velocity of E (E/eʹ ratio) at septal and lateral positions. The eccentricity indices (systolic and diastolic) for evaluation of the right ventricular overload were measured by standard method.17
Global longitudinal strain (GLS) and strain rate (SR) of LV and right ventricle (RV) were measured in IPAH patients and in the healthy group using dedicated software for extracting of GLS and SR curves off-line.18–21 Echocardiograms were stored in a digital format (DICOM). The investigations were retrieved in DICOM format with preserved frame rate and transferred to and analysed in an offline system. The off-line speckle-tracking analysis of the raw ultrasound data was provided using MSI (Myocardial Strain Imaging) software for apical four chamber images. Myocardial strain was defined as a fractional change in length between 2 time points, end-diastole (l0) and end-systole (l) and calculated as: (l-l0)/l or ∆l/l0. Strain is presented as percent change (%). Negative values of strain indicated the myocardial contraction. A mean frame rate was 44 ± 3 frames/s. To compute the end-systolic GLS and peak-systolic SR, three consecutive cycles were used. Peak LV strain and SR were fixed for each of the segments defined by the 2D strain algorithm and averaged. Segments that could not be tracked were excluded from the analysis. Usually, we analysed 6–8 segments, but 4 were accepted too. If we had less than four visible segments, we excluded these patients from analysis. For LV GLS and SR evaluation, we averaged the measurements at the inferolateral and inferior walls and used their absolute values. The beginning and ending of the ejection phase were defined from the simultaneously recorded ECG and the continuous-wave Doppler velocity trace at the level of the aortic valve. For RV GLS quantification by 2D STE, we used the RV-focused apical four-chamber view as indicated by Badano et al.21
During the study, some patients were excluded (3 in the IPAH group and 2 in the control group) due to unacceptable echocardiographic images for the tissue speckle-tracking analysis. Two independent specialists performed the strain analysis recorded in the same patient. The mean value of the two measurements was included in the database. If the differences between the same values were more than 2SD of mean, the third specialist was involved in the strain parameter assessments.
The arterial stiffness was evaluated by CAVI measurement that was done by standard methods using Sphygmomanometer and Sphygmograph VaSera-1500N (Fukuda, Tokyo, Japan) by standard methods.10,22 The CAVI reflects the stiffness of the aorta, femoral and tibial arteries as the whole. Pulse wave velocity, SBP, DBP measurements and arterial pulse waveform analysis were provided after the fixing of electrocardiogram, cardiac phonogram and putting pressure cuffs on the testing subject at reference points. The distance between the level of aortic valve (brachial level) and measuring point (the ankle) and the time of delaying between the closing of aortic valve and identified change in arterial pressure wave at the set point were obtained. The automatic CAVI calculation on the left and right sides by the dedicated device software was used.10,23 For the correlation analysis, we used the highest value from the right or left side measurements. The normal value of CAVI was supposed <8.0.10,24
RHC was performed in all IPAH patients via jugular venous access, with zero reference leveled at the mid-chest in the supine position. We evaluated the pulmonary circulation parameters: mean right atrial (RAP), right ventricular (RVP), pulmonary artery (PAP), and wedge (PWP) pressures, cardiac output (thermodilution method with Swan–Ganz catheter). The calculations of stroke volume (SV), cardiac index (CI), PVR, systemic vascular resistance (SVR), and total pulmonary resistance (TVR) were done by standard formulas.25 The vasoreactivity test with inhaled iloprost was conducted in all IPAH in compliance with ESC-2015 guideline.3 The only one patient, included in the group of IPAH, had acute vasoreactivity.
The biochemical analysis included such parameters as glucose, total cholesterol, creatinine, bilirubin, electrolytes, and uric acid serum levels measured by an automatic photometer (Cormay Livia Chemistry Analyzer, Lublin, Poland). The glomerular filtration rate (GFR) was calculated by the CKD-EPI (Chronic kidney disease Epidemiology) 2021 formula. N-terminal pro-B-type natriuretic peptide (NT-proBNP), ferritin and thyroid-stimulating hormone (TSH) levels were assessed in patients and in control groups.
Almost all examinations were done by specialists who were not directly involved in the study. All procedures were done before the administration of the specific PAH therapy. The diuretics (n=4) and mineralocorticoid receptor blockers (n=6) were used in some patients with signs of the fluid retention before RHC for euvolemic state achievement.
Statistical Methods
All variables are presented as mean and standard deviation (SD) or as a proportion. Statistic Package for Social Sciences (IBM SPSS Statistics, version 22.0, SPSS Inc, Armonk, New York, USA) was used for statistical analyses. For comparisons of means, the one-way ANOVA test was used for normally distributed continuous variables. Taking into consideration many comparisons between two small groups and subgroups, Mann–Whitney U-Test (significance level P<0.05, the confidence interval 95%) was used to confirm or decline the “null hypothesis”. The Spearman correlation analysis was done for the evaluation of the relationships between the CAVI and other parameters. Multiple regression analysis was provided for evaluation of independency of significant correlations.
Results
The baseline characteristics of IPAH patients and control group are presented in Table 1. The groups were matched by age, gender, BMI, main biochemical parameters, office SBP and DBP. However, patients with IPAH had higher HR baseline and at the end of 6MWT, NT-proBNP level and lower ferritin level, GFR, baseline and at the end 6MWT SaO2 than healthy people. Tolerance to physical exercise (the 6 MWT distance and Borg score) was significantly better in the control group. Most patients in the IPAH group were in the WHO functional class III – 81.1%. Signs of ascites and a history of syncope were reported in 3 and 7 IPAH patients, respectively. According to the RHC data (Table 1), the IPAH patients had a precapillary pulmonary hypertension with high enough mean level of mPAP (57.0±11.1 mmHg), PVR (951.2±434.6 dynes*c/cm5) and normal PWAP (9.1±3.4 mmHg). Most of them saved their cardiac output (mean 4.54±1.48 L/min) with mean cardiac index - 2.44±0.86 L/min/m2. Mean right arterial pressure (RAP) was not much high – 9.8±4.8 mmHg.
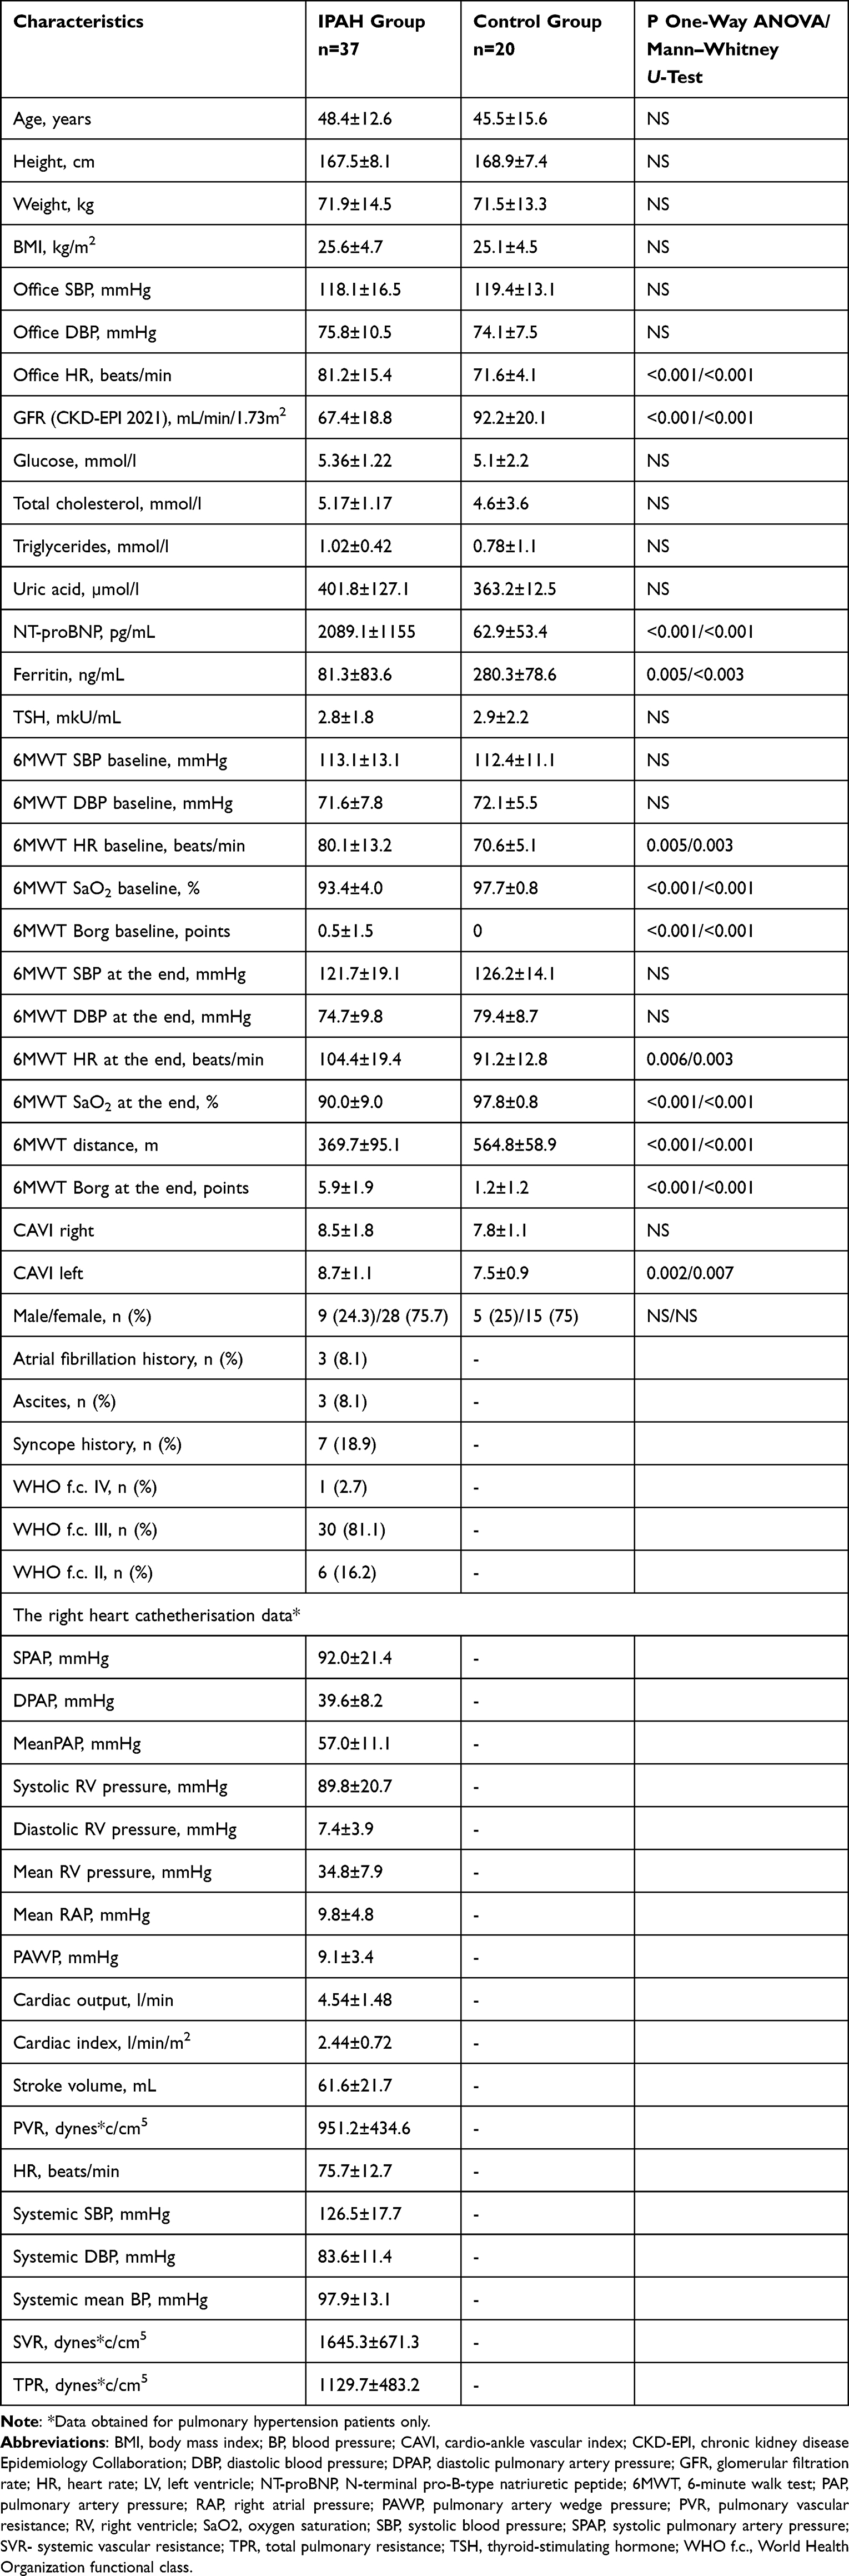 |
Table 1 Vital Signs, Baseline Characteristics of Pulmonary Arterial Hypertension Patients and Control Group (M±SD, n (%)) |
Mean CAVI was higher in IPAH patients than in the control group with reaching of the significant differences for CAVI at the left side - 8.7±1.1 vs 7.5±0.9, P=0.002 (P=0.007 at Mann–Whitney U-test).
The TTE characteristics of both groups are presented in Table 2. As expected, the IPAH patients had significantly higher RV and RA sizes, lower LA and LV volumes, and deceased RV function assessed by TAPSE. LV EF was within the normal range in both groups and did not differ significantly between groups (P=0.06 at Mann–Whitney U-test). The mean calculated systolic PAP was higher in the IPAH group and comparable with RHC data. Eccentricity indices were significantly higher in IPAH patients, which reflects the prominent RV overload. The mean diastolic LV function parameters were within the normal range in both groups, but healthy people had significantly lower IVRT, the less E/e’ ratio at septal and lateral positions. In 17 (45.9%) patients of the IPAH group the E/A ratio was less than the lowest limit of the normal range - 0.8 that could reflect the starting of the LV diastolic dysfunction in these patients. Although mean E/A was lower in the IPAH group than in the control group, the differences it did not achieve the statistical significance. The LVET and RVET were shorter in IPAH patients. LV and RV GLS and SR were better in healthy persons. While the normal LV systolic function limit assessed by GLS is > −18%, patients with IPAH had mean value −17.6±4.8%. Thirteen (35.1%) IPAH patients had the LV systolic dysfunction (LV GLS < −16%) compared to healthy people who had these parameters: −21.8±1.4% and 0%, respectively. LV SR was significantly less in IPAH patients, but in the normal range.18 The impaired RV function assessed by strain was found in IPAH patients as expected.
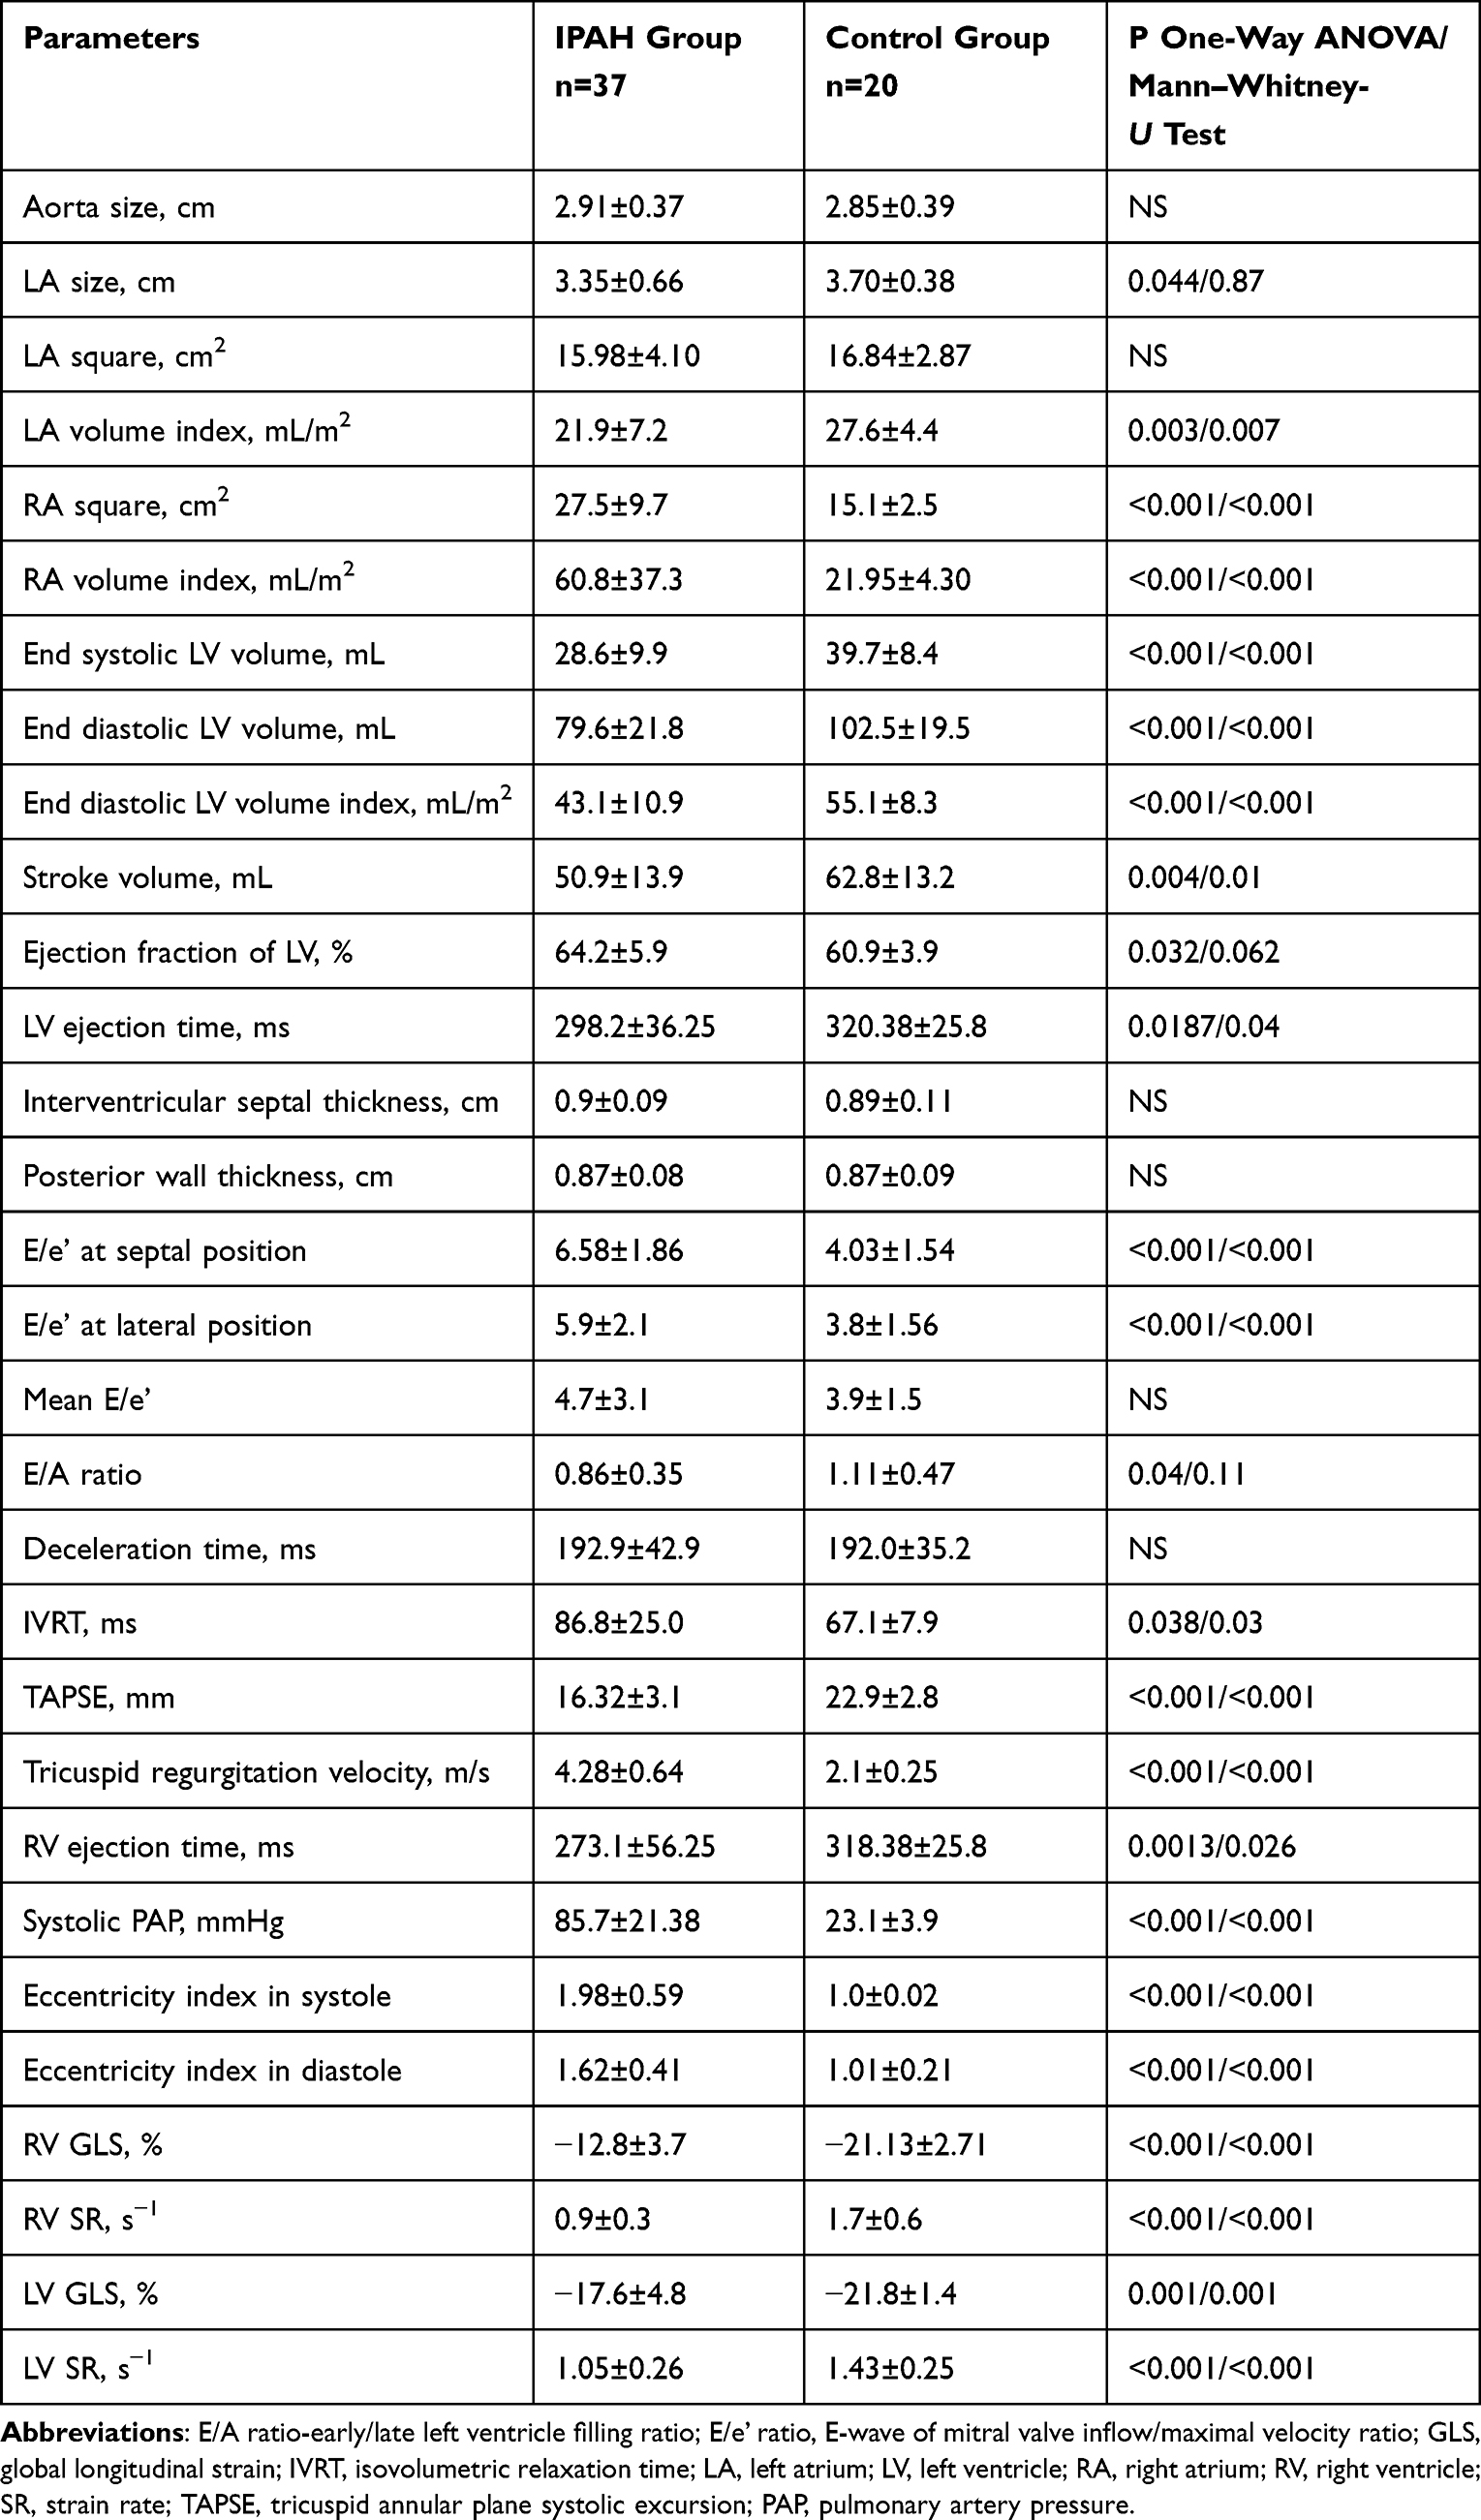 |
Table 2 Echocardiographic Parameters in Observed Groups (M±SD) |
For assessment of the independent differences in LV and RV function between IPAH patients with normal/abnormal arterial stiffness, we divided all patients with IPAH in two subgroups – with CAVI <8 (the normal arterial stiffness) and ≥8 (abnormal arterial stiffness). Then, we provided the Spearman correlation and multiple regression analysis between CAVI, baseline characteristics and EchoCG parameters in pulmonary hypertensive patients. The results of subgroup comparisons are presented in Table 3. IPAH patients with abnormal CAVI were significantly older and with higher bilirubin. The other parameters did not differ significantly between subgroups except the shorter RVET and LVET in patients with abnormal arterial stiffness. The LV and RV GLS did not differ significantly between groups.
 | 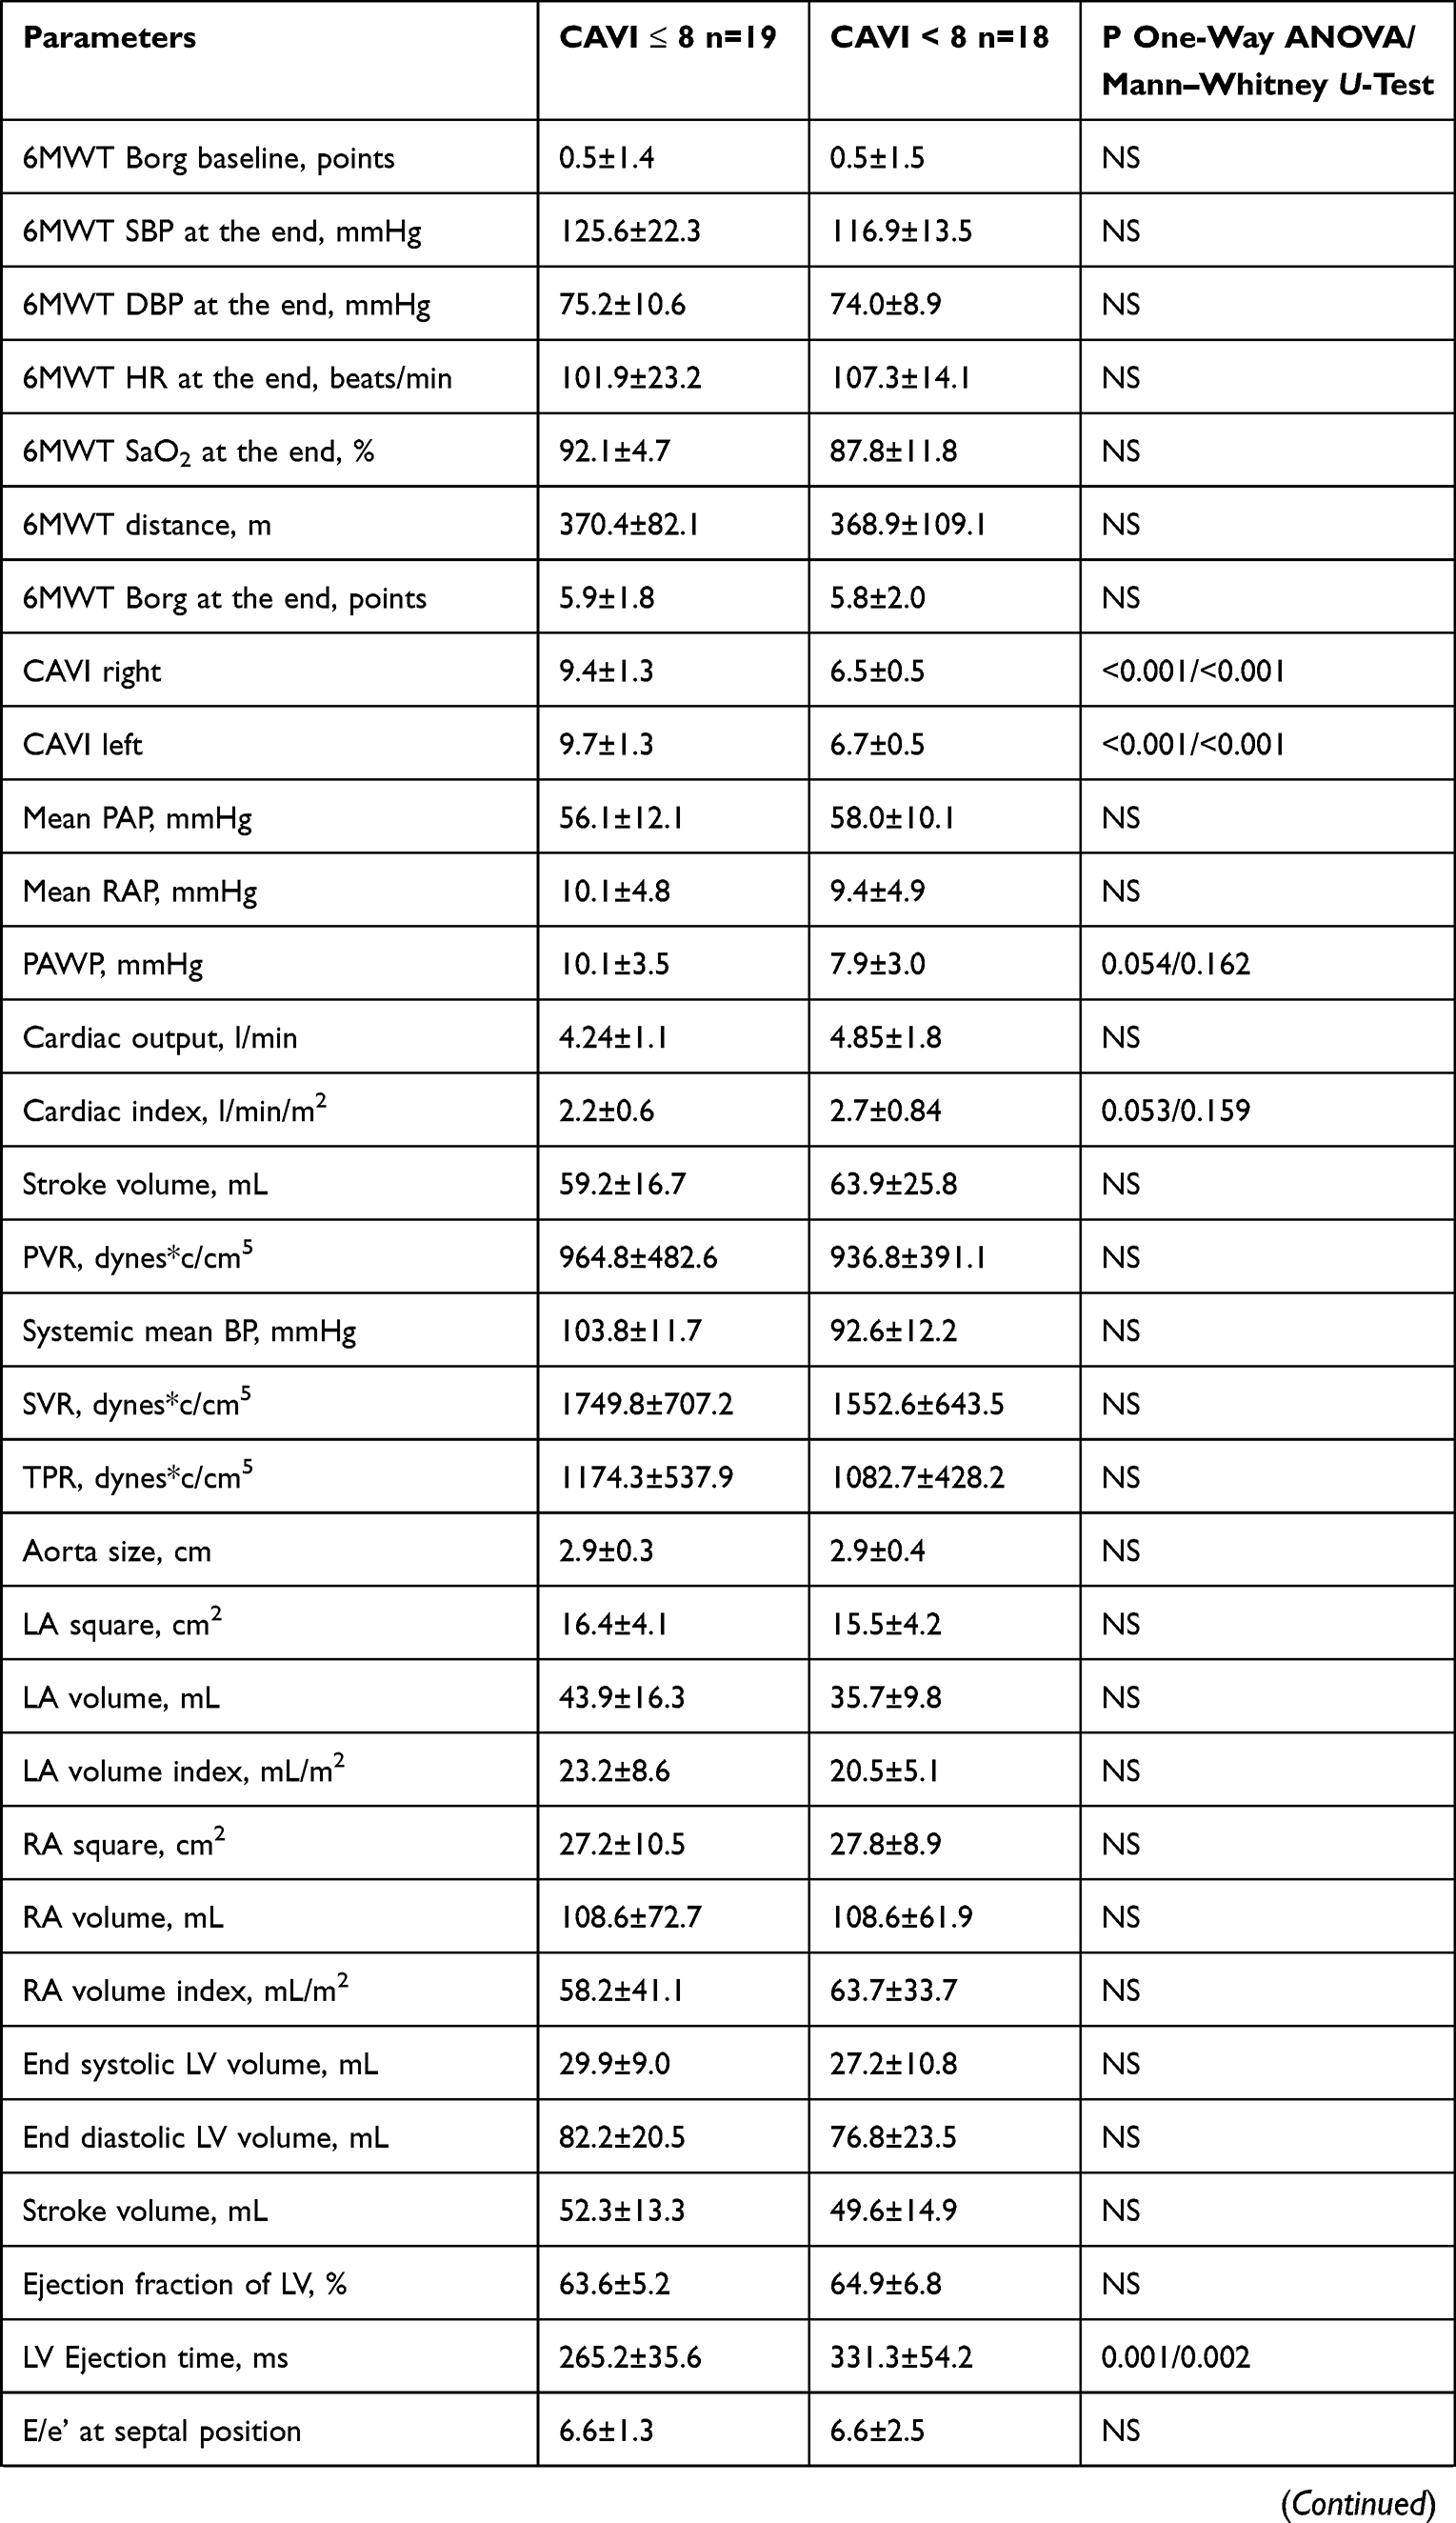 | 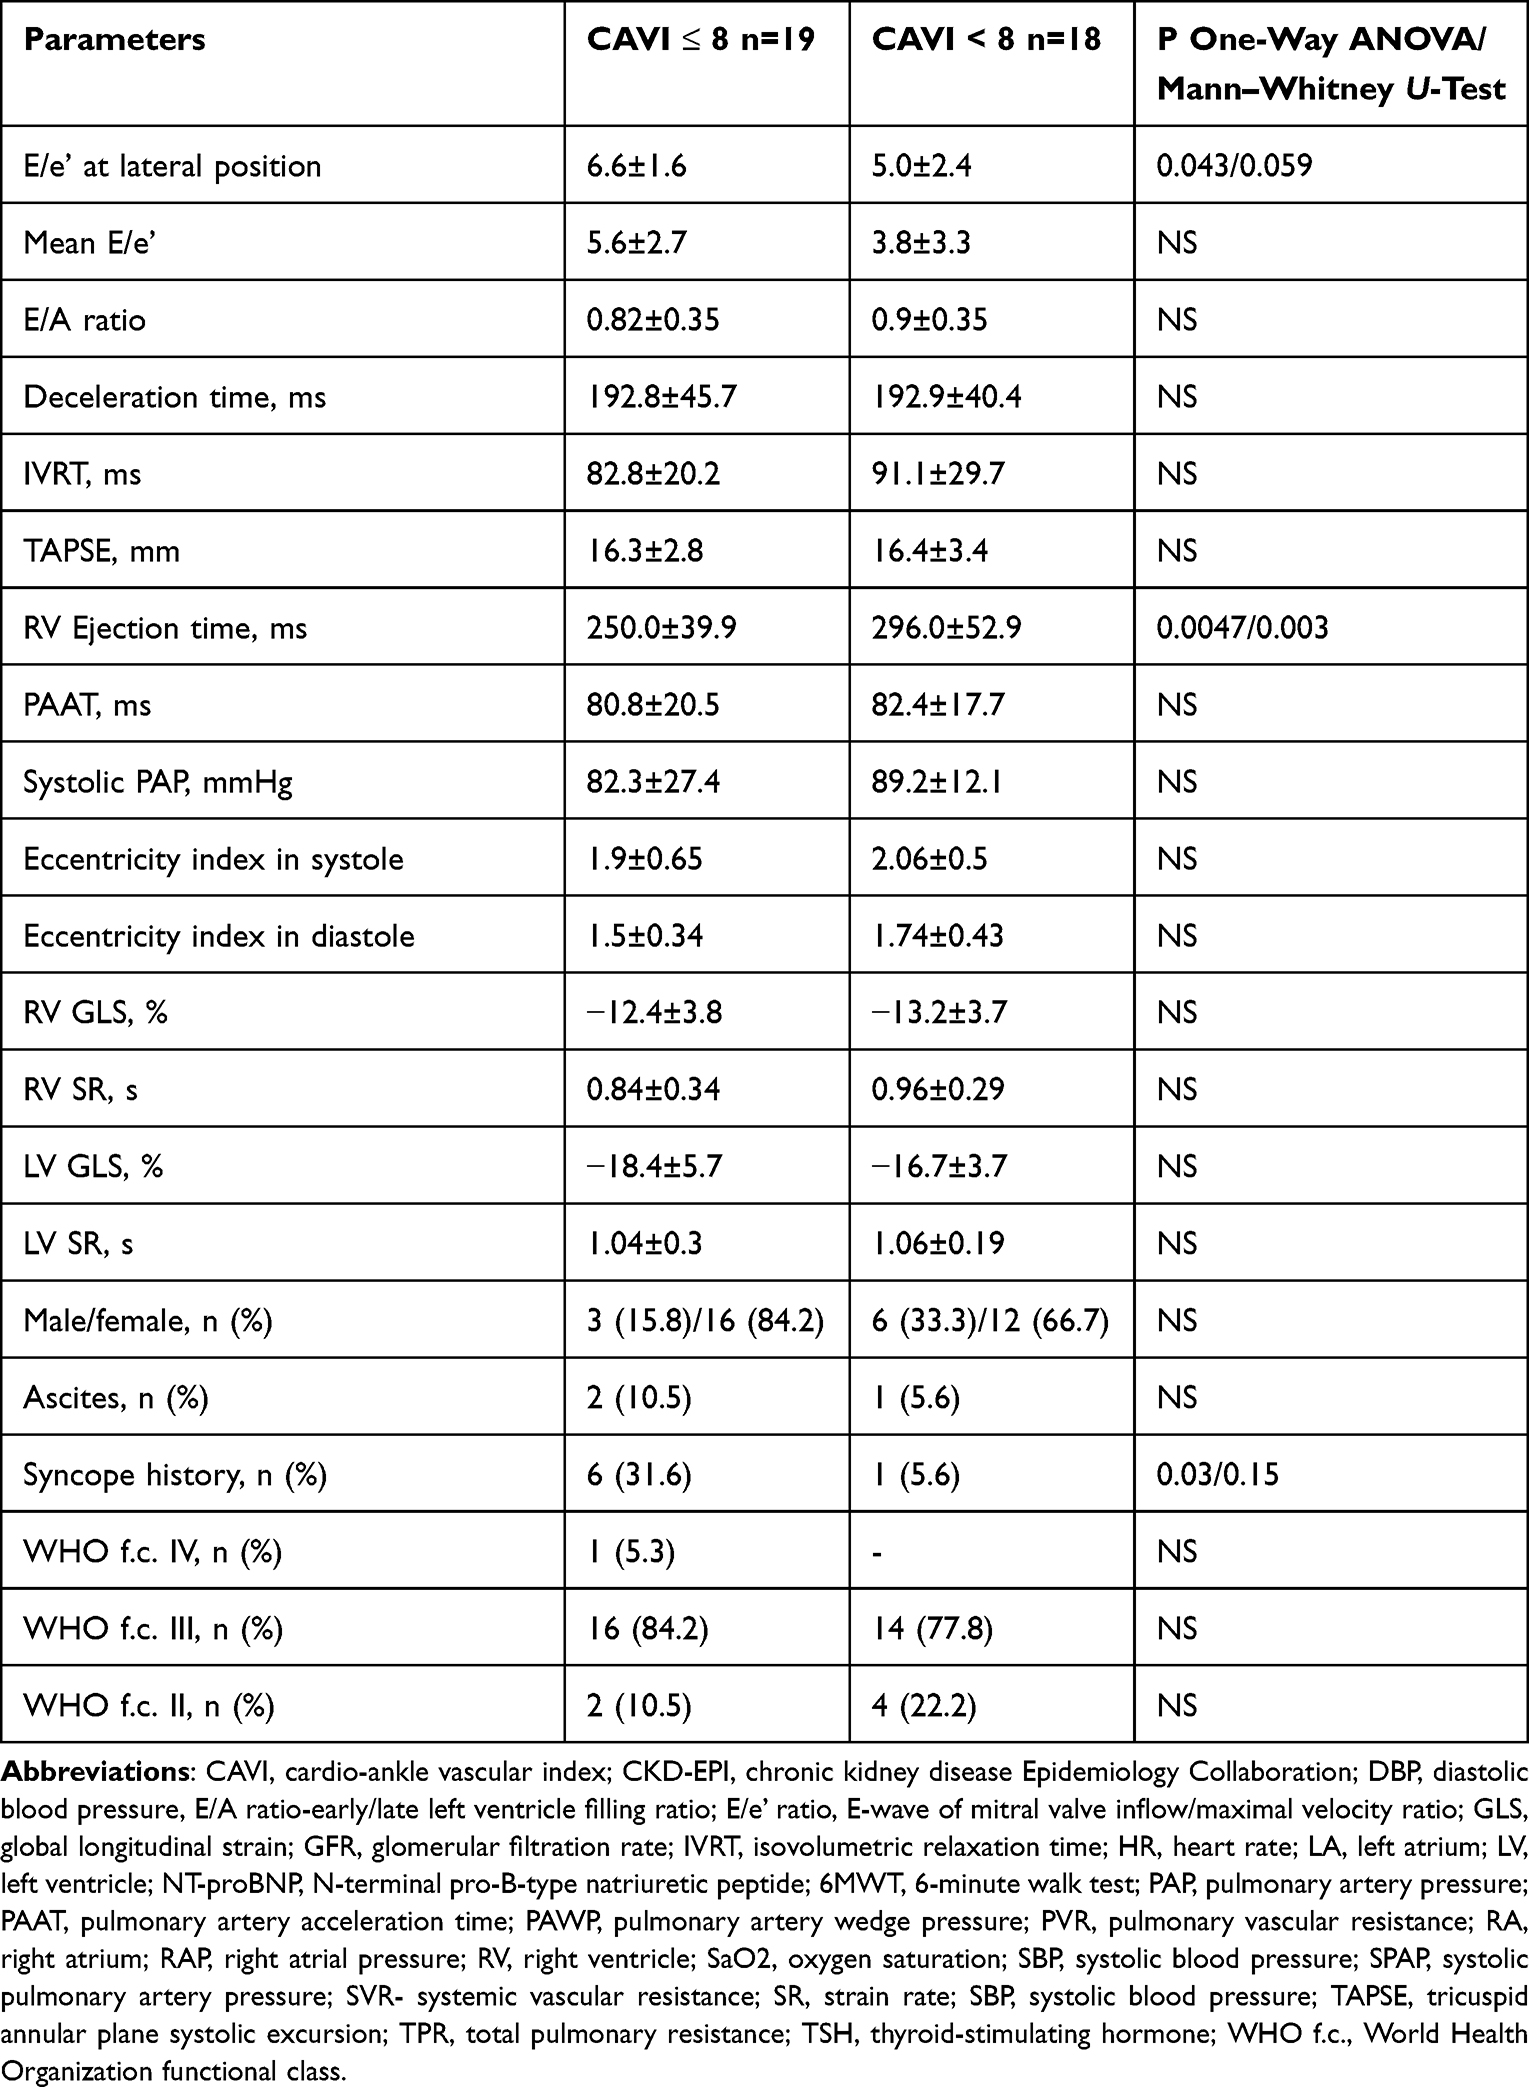 |
Table 3 The Characteristics of Idiopathic Arterial Hypertensive Patients in Subgroup CAVI> or < 8 (M±SD, n (%) |
The Spearman analysis showed the significant correlations of CAVI with age (r=0.57, P=0.001), the history of the syncope (r=0.51, P=0.006), the bilirubin level (r=0.38, P=0.048), the uric acid level (r=0.38, P=0.047), the total cholesterol level (r=0.38, P=0.044), the cardiac output (r=−0.38, P=0.49), the cardiac index (r=−0.41, P=0.029), SVR (r=0.35, P=0.08), RV ET (r=−0.61, P=0.01), LV ET (r=−0.45, P=0.04) and E/A (r=−0.43, P=0.039). The multiple linear regression confirmed the independent significance for age (β= 0.083±0.023, CI 0.033–0.133) and RV ET (β= - 0.018±0.005, CI −0.029- −0.008) only. After providing the step-by-step logistic regression with dependent variant CAVI ≥8 =1 and CAVI<8 =0. we found the risk to have CAVI ≥8 increased by 5.8 times in IPAH patients with RVET ≤248 ms (CI 1.032–32.79, P=0.046).
The comparison of IPAH patient subgroups without (LVGLS ≥16%, n=24) or with (LVGLS ≤16%, n=13) LV systolic dysfunction did not show any discrepancies in CAVI between subgroups −8.6±1.6 vs 8.8±2.8 with P=0.73 for CAVIleft and 8.4±1.4 vs 8.6±2.3 with P=0.76 for CAVIright. The LV GLS correlated with age (r=−0.40, P=0.013), IMT (r=0.53, P=0.001), NT-proBNP (r=−0.44, P=0.006) and ferritin (r=0.51, P=0.021) levels, RA volume index (r=−0.43, P=0.008), LVET (r=−0.44, P=0.03), mean E/e’ (r=−0.45, P=0.016) and RV GLS (r=0.38, P=0.02). LV SR had significant relationships with RHC parameters: stroke volume (r=−0.52, P=0.006), cardiac output (r=−0.37, P=0.05), PVR (r=0.53, P=0.003), TPR (r=0.50, P=0.007) and SVR (r=0.53, P=0.007).
Discussion
This study confirmed our previously obtained data about the higher arterial stiffness in patients with pulmonary hypertension, in spite of matching with the main parameters that could influence in healthy persons.11 Furthermore, in our previous study, IPAH patients did not differ significantly from systemic hypertensive patients. We proposed it could be explained by the endothelial dysfunction which takes place as in PAH as in systemic hypertension and is the main reason for the vascular remodeling in both pulmonary and systemic circulation. In some studies,26–30 there were discovered the increasing of the proinflammation markers (interleukin-1 receptor family member ST2, IL-32, tumor necrosis factor-α, interferon-γ) in IPAH patients, which may lead to the more prominent pulmonary arteriopathy and be the reason for systemic arterial changes. The genetic abnormalities (eg, BMPR2 mutation) and metabolic disorders (for the worsening of exercise capacity or right heart failure) may be associated with the systemic artery damage too. There are some evidences of the systemic artery dysfunction in the pulmonary hypertension: the increasing of prevalence of the coronary heart disease among PAH patients, the reduction in brachial vasodilation in IPAH and PAH due to scleroderma, the worsening of the cerebral blood flow evaluated by measuring of mean flow velocity in the middle cerebral artery at rest and exercise in PAH patients, the increased albumin excretion (as marker of the endothelial dysfunction) in patients with PAH without known kidney disease and traditional CV risk factors, the morphological violations in nailfold capillaries and sublingual vessels.31–36 We demonstrated the only CAVI as the arterial stiffness parameter that is independent of the blood pressure level, in contrast to pulse wave velocity, and correlated with functional capacity and was a significant independent poor prognosis marker in newly diagnosed IPAH patients. We suppose that the significance of CAVI for IPAH patient prognosis was connected with the increasing of the LV afterload. In IPAH patients, LV suffers substantially from the compression by RV and any additional strain could lead to further impairing of its work.
Some studies demonstrated the CAVI was associated with worse diastolic relaxation in individuals without atherosclerotic diseases,37 in patients with hypertension,38 cardiovascular diseases,39 cardiovascular risk factors,40 in patients with reduced EF and heart failure.41 Also, the higher CAVI has relationships with the worse LV longitudinal movement that may be explained by the deviated arterial elastance to ventricular elastance ratio.37 That is why we tried to find any correlations of CAVI with the systolic (EF, ET, GLS, SR) and diastolic (E/e’, E/A) LV function parameters.
The ET is a well-known simple parameter of the ventricle systolic function. The reason why the ET could be a marker of the ventricular function is: the ventricular dysfunction produces the impairing of the contractility force and it leads to the pressure rising during the isovolumic contraction, resulting in a prolongation of the isovolumic contraction time and respectively in shortening of the ET.42–44 Furthermore, the attenuation of the ventricle contractility makes impossible to maintain the high intraventricular pressure during the long time and ET shortens. A lot of literature data demonstrated the significance of the LV ET for evaluation of left heart function or prognosis. In the past studies, the LV ET that was obtained with phonocardiography and Doppler TTE44–48 and characterized the impaired cardiac function in patients with coronary heart disease,49 systemic50, pulmonary51,52 and heart failure.53,54 This simple hemodynamic parameter was a predictor of cardiovascular outcomes in patients with coronary heart disease55–58 and with IPAH.51 For the middle-aged African-Americans included in the ARIC community study (Jackson cohort, n=1980) and had the results of TTE, LV ET was an independent predictor of the heart failure development.47 In patients with amyloidosis, LVET was an independent predictor of death.59
However, the evaluation of RVET was less frequently provided in clinical studies, but the interest to this parameter and, especially, to its derivatives (the pulmonary artery acceleration time/RVET ratio, the myocardial performance index) has increased during the last years. There are some evidences of its significance in patients with acute respiratory distress syndrome60 in children and adults with pulmonary hypertension,61,62 in asthmatic patients,63 in patients with cardiomyopathy,64 and heart failure with preserved EF.65 In most of these studies, the shortening of the RVET was associated with worsening of other RV systolic function parameters. In spite of the distinctions in the duration of the LVET and RVET differences in healthy and chronic pulmonary hypertensive patients,66 there is a significant correlation between them.
In IPAH, the RV suffered more and earlier than LV, because of the overload by increased pulmonary resistance. But with time, the worsening of LV work is going too. At the end stage of PAH, the lung transplantation to support exact LV function becomes extremely important.
Traditionally in pulmonary hypertension, the investigators concentrated their attention on studying of RV work, but during the last years, it has moved to the evaluation of LV function too. There are some reasons for LV attenuation: diastolic and systolic overload by enlarged RV, ischemia supported by increased HR, decreased SaO2 and low stroke volume, metabolic disorders provoked by fluid retention, renal and hepatic dysfunction. One of the simple parameters correlated with prognosis in pulmonary hypertension and characterized LV function was LVET. In the study of Gunther et al, both intensive care unit and 90-day mortality were significantly higher in patients with a decreased LVET on admission.67 Freed and Gomberg-Maitland analyzed the results of some studies that concluded LV ET cloud reflect the dynamic interplay between the right, left heart and the lung.68 But they indicated it is still unknown if the LV ET is a real marker of poor prognosis because 1) it could be influenced by the different factors (age, sex, thyroid abnormalities, valvular disease, etc), 2) there are no any large trials confirmed the independent significance of ET for such specific and rare population like pulmonary hypertension (the international trials should be organized), and 3) there are no any data about the changing of the prognosis if the LVET would change with time.
In our study, RVET LVET were shorter in IPAH patients than in the healthy group, indicating both ventricle systolic dysfunction. The other parameters (GLS and SR) of the LV systolic function obtained by speckle-tracking tissue image, confirmed the worsened LV contractility in IPAH patients and emphasized the importance of further researches on explaining the LV role in the course of pulmonary hypertension. Also, in the IPAH group, we found LV diastolic function (the higher E/e’ ratio) was attenuated compared to healthy individuals. Moreover, E/A ratio had a negative correlation with CAVI (r=−0.43, P=0.039), but it was not an independent correlation. At multiple regression analysis, no any LV systolic (LV EF, LV GLS, LV SR), no diastolic (E/A, E/e’) function parameters had a significant association with CAVI, in spite of their abnormality in IPAH patients.
At the same time, there was an independent correlation of CAVI with RVET – the shorter RVET was the higher CAVI was registered. In Spearman correlation analysis, but not at multiple regression, the CAVI was associated with cardiac output and cardiac index. We did not find any associations with other TTE RV function parameters. This is somewhat different from our previous data,11 where CAVI correlated with TAPSE in Spearman and multiple regression analyses. However, in our previous study, we did not evaluate the LV function and did not calculate the RVET. TAPSE is a well-known determinate for the RV function assessment that has been used in practice very often. In some studies, it correlated with outcomes in pulmonary hypertensive patients.69–71 But in some others, the TAPSE was not associated with stroke volume72 or had the poor correlation with RV EF, than right ventricular fractional area change,73 or had a poor association with alternative RV function parameters like Tei-index and systolic excursion velocity of lateral tricuspid annulus (S´),74 or correlated with mean pulmonary BP in 10 years, but not in earlier period after pediatric heart transplantation.75 Besides, Chio et al demonstrated the different prognostic value of TAPSE in association with other TTE parameters (LV eccentricity index, tricuspid regurgitation).76 This means some TTE parameters, including time intervals, need to be used for evaluation of the RV function. The TAPSE is a technically easily obtained parameter, but it determines only the longitudinal RV changes. RVET is an early marker of the impaired RV work that reflects a global RV disturbance and might predict the right heart failure development. Our patients had newly diagnosed IPAH and with relatively saved mean cardiac index (2.44±0.72 vs 2.2±0.15 L/min/m2 in the present and previous study respectively) and ET seems to be a more sensitive parameter correlated with CAVI than TAPSE in this newly diagnosed and smaller cohort. However, ET is a very easy and fast measurement with high reproducibility. In contrast to tissue Doppler image and speckle tracking, LVET might be obtained with all conventional echocardiographic machines and software and improves our current risk prediction models.
The absence of relationships between CAVI and LV function parameters, the independent correlation of the CAVI with RV function parameters and the death rate allowed us to speculate if the CAVI was not the cause of the LV worsening work, but only a marker of those global changes which take place in IPAH patients (the endothelial dysfunction, metabolic disorders, the renal dysfunction, aging, etc). In other words, the CAVI might express the degree of the global IPAH patient state disorders. Its death prediction ability could be compared to the 6MWT distance that is a simply obtained parameter too and is a risk stratified determinant, which represents the physical exercise tolerance. However, 6MWT distance depends on many other factors which are not connected with hemodynamic parameters only: the patient motivation and mood, comorbidities (eg, obesity, arthropathy), age, height and weight, training, etc. The CAVI is an easy obtained parameter and may be an independent indicator for risk stratification in IPAH patients, like the 6MWT distance. Of course, this suggestion was not verified in the present study and needs the further multicenter trial confirmation.
Limitations
Our study results should be interpreted with some limitations. First of all, our study was single centered and included not many participants. According to the Corrêa et al’s data, patients with PAH had the significant (P<0.001) lower LVGLS (−17.9±2.8%) than healthy subjects (−20.5±1.9%).77 In this study, the calculated delta/SD was 1.09. Taking into consideration a power 0.80 and P level <0.05, the sample size in our study should be at least 36 patients in both groups (16 in one group). We included total 62 subjects: 57 included in our analysis and additional 5 were excluded because of the poor quality of TTE images. This means our sample size was acceptable for providing the statistic analysis between groups of IPAH patients and healthy persons. We did not find any data in literature about the LVGLS in IPAH patients with abnormal/normal arterial stiffness or about comparisons of the CAVI in patients with normal/abnormal LVGLS. That is why it was not possible to calculate the sample size for the evaluation of the primary endpoints and we defined this study as a pilot. TTE specialists were not directly involved in the study, and they performed imaging to all pulmonary hypertensive patients, including those with newly diagnosed IPAH accepted for this study. The CAVI measurement is a simple and almost operator-independent method for arterial stiffness evaluation. The statistical methods are acceptable for this quantity of patients, and we provided the verification of “the null hypothesis” for two samples. Second, the tissue speckle-tracking method for systolic ventricular function evaluation is a modern and a very popular in the last years.78 It was considered that tissue Doppler image is more variable than tissue tracking. However, the derivation of GLS from speckle-tracking is slightly different from the software of different manufacturers. In our center, we used MSI software integrated in Imagic Agile Kontron, which is not so popular for strain analysis in other countries. All calculated images need to be at good quality and that is why we excluded some patients and not all newly diagnosed IPAH individuals were included in our analysis. We evaluated the GLS and SR only from the basal segment of the inferior and inferolateral LV free walls and that might lead to underestimation of the full spectrum of longitudinal deformation along the LV wall as well as between the LV walls. We did not analyze the radial and circumferential strains that might be abnormal in IPAH patients and correlated with CAVI. That is why we could not accurately consider that CAVI does not influence on LV function. The CAVI does not have a relationship with LVGLS and LVET only. We need to provide other studies in searching different parameters of the LV function. Third, we do not know if the changes of the CAVI with time, including under the specific therapy, would be associated with risk modification. It isvery important for being identified as the risk stratification determinate. We need more prospective studies to clear it.
Conclusion
The newly diagnosed IPAH patients adjusted to age, gender and blood pressure level had significantly worse exercise tolerance, renal function and arterial stiffness than healthy people. The only two parameters had significant correlations with CAVI – age and ET of the RV, but not LV. The significant worse systolic and diastolic LV functions were stated in pulmonary hypertensive patients compared to the control group. No LV GLS, no LV SR had significant associations with arterial stiffness evaluated by CAVI. This means it is not necessary to provide a larger trial using these LV function parameters for the verification of our hypothesis about the pathogenetic role of systemic arterial stiffness in LV dysfunction worsening and prognosis in IPAH patients.
Acknowledgments
Special thanks to Evgeniy Titov and Olena Torbas for providing TTE and speckle-tracking analysis.
Funding
No special funds were received for this study.
Disclosure
The authors report no conflicts of interest in this work.
References
1. Galiè N, McLaughlin V, Rubi L, Simonneau G. An overview of the 6th world symposium on pulmonary hypertension. Eur Respir J. 2019;53:1802148. doi:10.1183/13993003.02148-2018
2. Simonneau G, Montani D, Celermajer D, et al. Number 4 in the series “Proceedings of the 6th World Symposium on Pulmonary Hypertension” Haemodynamic definitions and updated clinical classification of pulmonary hypertension. Eur Respir J. 2019;53:1801913. doi:10.1183/13993003.01913-2018
3. Galiè N, Humbert M, Vachiery JL, et al. 2015 ESC/ERS Guidelines for the diagnosis and treatment of pulmonary hypertension: the Joint Task Force for the Diagnosis and treatment of pulmonary hypertension of the European Society of Cardiology (ESC) and the European Respiratory Society (ERS): endorsed by: Association for European Paediatric and Congenital Cardiology (AEPC), International Society for Heart and Lung Transplantation (ISHLT). Eur Heart J. 2016;37(1):67–119. doi:10.1093/eurheartj/ehv317
4. Kalogeropoulos A, Georgiopoulou V, Borlaug B, Gheorghiade M, Butler J. Left ventricular dysfunction with pulmonary hypertension. part 2: prognosis, noninvasive evaluation, treatment, and future research. Circ Heart Fail. 2013;6(3):584–593. doi:10.1161/CIRCHEARTFAILURE.112.000096
5. Meng H, Chandrasekaran K, Villarraga H, et al. Right and left ventricular interaction in pulmonary hypertension: insight from velocity vector imaging. Echocardiography. 2019;36(5):877–887. doi:10.1111/echo.14328
6. Hardegree EL, Sachdev A, Fenstad ER, et al. Impaired left ventricular mechanics in pulmonary arterial hypertension: identification of a cohort at high risk. Circ Heart Fail. 2013;6(4):748–755. doi:10.1161/CIRCHEARTFAILURE.112.000098
7. Tantawy S, Shaaban M, Elkafrawy F, et al. Longitudinal RV and LV strain in pulmonary hypertension patients using CMR feature tracking. Eur Heart J Cardiovasc Imaging. 2019;20(Supplement 2):161. doi:10.1093/ehjci/jez117.024
8. Han J-C, Guild S-J, Pham T, et al. Left-ventricular energetics in pulmonary arterial hypertension-induced right-ventricular hypertrophic failure. Front Physiol. 2018;8:1115. doi:10.3389/fphys.2017.01115
9. Sjögren H, Kjellström B, Bredfelt A, et al. Underfilling decreases left ventricular function in pulmonary arterial hypertension. Int J Cardiovasc Imaging. 2021;37(5):1745–1755. doi:10.1007/s10554-020-02143-6
10. Shirai K, Asmar R, Orimo H. Cardio-Ankle Vascular Index: Overview & Clinical Application. Tokyo: COMPASS Co. Ltd; 2021.
11. Radchenko G, Zhyvylo IO, Titov EY, Sirenko Y. Systemic arterial stiffness in new diagnosed idiopathic pulmonary arterial hypertension patients. Vasc Health Risk Manag. 2020;16:29–39. doi:10.2147/VHRM.S230041
12. Radchenko GD, Sirenko YM. Prognostic significance of systemic arterial stiffness evaluated by cardio-ankle vascular index in patients with idiopathic pulmonary hypertension. Vasc Health Risk Manag. 2021;17:77–93. doi:10.2147/VHRM.S294767
13. Guyatt G, Sullivan M, Thompson P, et al. The 6-minute walk: a new measure of exercise capacity in subjects with chronic heart failure. Can Med Assoc J. 1985;132:919–923. PMC1345899.
14. ATS Statement. Guidelines for the six-minute walk test. Am J Respir Crit Care Med. 2002;166:111–117. doi:10.1164/ajrccm.166.1.at1102
15. Lang RM, Badano LP, Mor-Avi V, et al. Recommendations for cardiac chamber quantification by echocardiography in adults: an update from the American Society of Echocardiography and the European Association of Cardiovascular Imaging. J Am Soc Echocardiogr. 2015;28:1–39. doi:10.1016/j.echo.2014.10.003
16. Lindqvist P, Calcutteea A, Henein M. Echocardiography in the assessment of right heart function. Eu J Echocar. 2008;9:225–234. doi:10.1016/j.euje.2007.04.002
17. Ryan T, Petrovic O, Dillon JC, Feigenbaum H, Conley MJ, Armstrong WF. An echocardiographic index for separation of right ventricular volume and pressure overload. J Am Coll Cardiol. 1985;5:918–927. doi:10.1016/s0735-1097(85)80433-2
18. Kuznetsova T, Herbots L, Richart T, et al. Left ventricular strain and strain rate in a general population. Eur Heart J. 2008;29:2014–2023. doi:10.1093/eurheartj/ehn280
19. Burns A, Gerche A, D’hooge J, MacIsaac A, Prior D. Left ventricular strain and strain rate: characterization of the effect of load in human subjects. Eu J Echocar. 2010;11:283–289. doi:10.1093/ejechocard/jep214
20. Kleijn S, Pandian N, Thomas J, et al. Normal reference values of left ventricular strain using three-dimensional speckle tracking echocardiography: results from a multicentre study. Eur Heart J Cardiovasc Imaging. 2015;16:410–416. doi:10.1093/ehjci/jeu21
21. Badano L, Muraru D, Parati G, Haugaa K, Voigt JU. How to do right ventricular strain. Eur Heart J Cardiovasc Imaging. 2020;21:825–827. doi:10.1093/ehjci/jeaa126
22. Cheuk-Kwan S. Cardio-ankle vascular index (CAVI) as an indicator of arterial stiffness Integrated. Blood Pressure Control. 2013;6:27–38. doi:10.2147/IBPC.S34423
23. Yambe T, Yoshizawa M, Saijo Y, et al. Brachio-ankle pulse wave velocity and cardio-ankle vascular index (CAVI). Biomed Pharmacother. 2004;58(Suppl 1):S95–S98. doi:10.1016/S0753-3322(04)80015-5
24. Miyoshi T, Ito H. Assessment of arterial stiffness using the cardio-ankle vascular index. Pulse. 2016;4(1):11–23. doi:10.1159/000445214
25. Silvestry F. Pulmonary artery catheterization: interpretation of hemodynamic values and waveforms in adults; 2022. Available from: https://www.uptodate.com/contents/pulmonary-artery-catheterization-interpretation-of-hemodynamic-values-and-waveforms-in-adults.
26. Anwar A, Ruffenach G, Mahajan A, Eghbali M, Umar S. Novel biomarkers for pulmonary arterial hypertension. Respir Res. 2016;17:88. doi:10.1186/s12931-016-0396-6
27. Benedetto P, Guggino G, Manzi G, et al. Interleukin-32 in systemic sclerosis, a potential new biomarker for pulmonary arterial hypertension. Arthritis Res Ther. 2020;22:127. doi:10.1186/s13075-020-02218-8
28. Luk K, Ip C, Gong M, et al.; International Health Informatics Study (IHIS) Network. A meta-analysis of soluble suppression of tumorigenicity 2 (sST2) and clinical outcomes in pulmonary hypertension. J Geriatr Cardiol. 2017;14(12):766–771. doi:10.11909/j.issn.1671-5411.2017.12.007
29. Nold-Petry CA, Nold MF, Zepp JA, Kim SH, Voelkel NF, Dinarello CA. IL-32-dependent effects of IL-1b on endothelial cell functions. Proc Natl Acad Sci U S A. 2009;106(10):3883–3888. doi:10.1073/pnas.0813334106
30. Nold-Petry CA, Rudloff I, Baumer Y, et al. IL-32 promotes angiogenesis. J Immunol. 2014;192:589–602. doi:10.4049/jimmunol.1202802
31. Shimony A, Eisenberg MJ, Rudski LG, et al. Prevalence and impact of coronary artery disease in patients with pulmonary arterial hypertension. Am J Cardiol. 2011;108:460–464. doi:10.1016/j.amjcard.2011.03.066
32. Anand V, Roy SS, Archer SL, et al. Trends and outcomes of pulmonary arterial hypertension-related hospitalizations in the United States: analysis of the nationwide inpatient sample database from 2001 through 2012. JAMA Cardiol. 2016;1:1021–1029. doi:10.1001/jamacardio.2016.3591
33. Hughes R, Tong J, Oates C, Lordan J, Corris PA. Evidence for systemic endothelial dysfunction in patients and first-order relatives with pulmonary arterial hypertension. Chest. 2005;128(6 Suppl):617S. doi:10.1378/chest.128.6_suppl.617S
34. Malenfant S, Brassard P, Paquette M, et al. Compromised cerebrovascular regulation and cerebral oxygenation in pulmonary arterial hypertension. J Am Heart Assoc. 2017;6:e006126. doi:10.1161/JAHA.117.006126
35. Nickel NP, de Jesus Perez VA, Zamanian RT, et al. Low-grade albuminuria in pulmonary arterial hypertension. Pulm Circ. 2019;9(2):1–9. doi:10.1177/2045894018824564
36. Riccieri V, Vasile M, Iannace N, et al. Systemic sclerosis patients with and without pulmonary arterial hypertension: a nailfold capillaroscopy study. Rheumatology. 2013;52:1525–1528. doi:10.1093/rheumatology/ket168
37. Ye Z, Pellikka P, Kullo I. Sex differences in associations of cardio-ankle vascular index with left ventricular function and geometry. Vasc Med. 2017;22:465–472. doi:10.1177/1358863X17725810
38. Kim H, Kim HS, Yoon HJ, et al. Association of cardio-ankle vascular index with diastolic heart function in hypertensive patients. Clin Exp Hypertens. 2014;36:200–205. doi:10.3109/10641963.2013.804544
39. Namba T, Masaki N, Matsuo Y, et al. Arterial stiffness is significant associated with left ventricular diastolic dysfunction in patients with cardiovascular diseases. Int Heart J. 2016;57:729–735. doi:10.1536/ihj.16-112
40. Mizuguchi Y, Oishi T, Tanaka H, et al. Arterial stiffness is associated with left ventricular diastolic function in patients with cardiovascular risk factors; early detection with the use of cardio-ankle vascular index and ultrasonic strain image. J Card Fail. 2007;13:744–751. doi:10.1016/j.cardfail.2007.05.010
41. Noguchi S, Masugata H, Senda S, et al. Correlation of arterial stiffness to left ventricular function in patients with reduced ejection fraction. Tohoku J Exp Med. 2011;225:145–151. doi:10.1620/tjem.225.145
42. Carluccio E, Biagioli P, Alunni G, et al. Improvement of myocardial performance (Tei) index closely reflects intrinsic improvement of cardiac function: assessment in revascularized hibernating myocardium. Echocardiogr Mt Kisco N. 2012;29:298–306. doi:10.1111/j.1540-8175.2011.01575.x
43. Hodges M, Halpern BL, Friesinger GC, Dagenais GR. Left ventricular preejection period and ejection time in patients with acute myocardial infarction. Circulation. 1972;45:933–942. doi:10.1161/01.cir.45.5.933
44. Boudoulas H. Systolic time intervals. Eur Heart J. 1990;11(Suppl I):93–104. doi:10.1093/eurheartj/11.suppl_i.93
45. Weissler AM, Harris WS, Schoenfeld CD. Systolic time intervals in heart failure in man. Circulation. 1968;37:149–159. doi:10.1161/01.cir.37.2.149
46. Weissler AM, O’Neill WW, Sohn YH, Stack RS, Chew PC, Reed AH. Prognostic significance of systolic time intervals after recovery from myocardial infarction. Am J Cardiol. 1981;48:995–1002. doi:10.1016/0002-9149(81)90311-8
47. Biering-Sørensen T, Roca G, Hegde S, et al. Left ventricular ejection time is an independent predictor of incident heart failure in a community based cohort. Eur J Heart Fail. 2018;20(7):1106–1114. doi:10.1002/ejhf.928
48. Tei C, Dujardin KS, Hodge DO, Kyle RA, Tajik AJ, Seward JB. Doppler index combining systolic and diastolic myocardial performance: clinical value in cardiac amyloidosis. J Am Coll Cardiol. 1996;28:658–664. doi:10.1016/s0140-6736(79)92228-1
49. Lewis RP, Boudoulas H, Welch TG, Forester WF. Usefulness of systolic time intervals in coronary artery disease. Am J Cardiol. 1976;37:787–796. doi:10.1016/0002-9149(76)90376-3
50. Dodek A, Burg JR, Kloster FR. Systolic time intervals in chronic hypertension: alterations and response to treatment. Chest. 1975;68:51–55. doi:10.1378/chest.68.1.51
51. Shigematsu Y, Hamada M, Kokubu T. Significance of systolic time intervals in predicting prognosis of primary pulmonary hypertension. J Cardiol. 1988;18:1109–1114.
52. Sztrymf B, Günther S, Artaud-Macari E, et al. Left ventricular ejection time in acute heart failure complicating precapillary pulmonary hypertension. Chest. 2013;144:1512–1520. doi:10.1378/chest.12-2659
53. Cleland JGF, Teerlink JR, Senior R, et al. The effects of the cardiac myosin activator, omecamtiv mecarbil, on cardiac function in systolic heart failure: a double-blind, placebo-controlled, crossover, dose-ranging Phase 2 trial. Lancet Lond Engl. 2011;378:676–683. doi:10.1016/S0140-6736(11)61126-4
54. Malik FI, Hartman JJ, Elias KA, et al. Cardiac myosin activation: a potential therapeutic approach for systolic heart failure. Science. 2011;331:1439–1443. doi:10.1093/rheumatology/29.3.166
55. Biering-Sørensen T, Mogelvang R, Søgaard P, et al. Prognostic value of cardiac time intervals by tissue Doppler imaging m-mode in patients with acute ST-segment-elevation myocardial infarction treated with primary percutaneous coronary intervention. Circ Cardiovasc Imaging. 2013;6:457–465. doi:10.1161/CIRCIMAGING.112.000230
56. Teodorescu P, Guţiu I, Predescu T, Frîncu P, Cucu N, Carp C. Prognosis of acute myocardial infarction using systolic time intervals recorded on the carotidogram. Médecine Interne. 1981;19:131–136.
57. Northover BJ. Left ventricular systolic time intervals in patients with acute myocardial infarction. Br Heart J. 1980;43:506–513. doi:10.1136/hrt.43.5.506
58. Northover BJ. Estimation of the risk of death during the first year after acute myocardial infarction from systolic time intervals during the first week. Br Heart J. 1989;62:429–437. doi:10.3389/fnagi.2021.755160
59. Migrino R, Mareedu R, Eastwood D, Bowers M, Harmann L, Hari P. Left ventricular ejection time on echocardiography predicts long-term mortality in light chain. Amyloidosis J Am Soc Echocardiogr. 2009;22(12):1396–1402. doi:10.1016/j.echo.2009.09.012
60. Her C, Koike H, O’Connell J. Estimated right ventricular systolic time interval for the assessment of right ventricular function in acute respiratory distress syndrome. Shock. 2009;31(5):460–465. doi:10.1097/SHK.0b013e31818ba1f4
61. Habash S, Laser KT, Moosmann J, et al. Normal values of the pulmonary artery acceleration time (PAAT) and the right ventricular ejection time (RVET) in children and adolescents and the impact of the PAAT/RVET-index in the assessment of pulmonary hypertension. Int J Cardiovasc Imaging. 2019;35(2):295–306. doi:10.1007/s10554-019-01540-w
62. Chang S, Lin C, Hsiao S, et al. Pulmonary hypertension and left heart function: insights from tissue Doppler imaging and myocardial performance index. Echocardiography. 2007;24(4):366–373. doi:10.1111/j.1540-8175.2007.00405.x
63. Mincewicz G, Siergiejko G, Piepiorka M, Świdnicka-siergiejko A, Siergiejko Z, Krzykowski G. Functional assessment of the right ventricle in patients with bronchial asthma of various severity. Postepy Dermatol Alergol. 2021;38(1):52–56. doi:10.5114/ada.2021.104278
64. Ali AA. Ventricular ejection time: a noninvasive echocardiographic parameter for assessment of severity of congestive heart failure in cardiomyopathic patients. Scientific J Al-Azhar Med Facul. 2019;3:722–729.
65. Berglund F, Piña P, Herrera C. Right ventricle in heart failure with preserved ejection fraction. Heart. 2020;106(23):1798–1804. doi:10.1136/heartjnl-2020-317342
66. Lopez-Candale A, Edelman K, Gulyasy B, Candales M. Differences in the duration of total ejection between right and left ventricles in chronic pulmonary hypertension Echocardiography. Echocardiography. 2011;28(5):509–515. doi:10.1111/j.1540-8175.2010.01377.x
67. Günther S, Sztrymf B, Savale L, et al. Relation between left ventricular ejection time and pulmonary hemodynamics in pulmonary hypertension. Int J Cardiol. 2015;184:763–765. doi:10.1016/j.ijcard.2015.02.101
68. Freed B, Gomberg-Maitland M. Pulmonary arterial hypertension with right ventricular failure. The left forgotten ventricle. Chest J. 2013;144:1435. doi:10.1378/chest.13-1193
69. Forfia P, Fisher M, Mathai S, et al. Tricuspid annular displacement predicts survival in pulmonary hypertension. Am J Respir Crit Care Med. 2006;174(9):1034–1041. doi:10.1164/rccm.200604-547OC
70. Alerhand S, Hickey SM. Tricuspid annular plane systolic excursion (TAPSE) for risk stratification and prognostication of patients with pulmonary embolism. Emerg Med. 2020;58(3):449–456. doi:10.1016/j.jemermed.2019.09.017
71. Howard LS. Prognostic factors in pulmonary arterial hypertension: assessing the course of the disease. Eur Respir Rev. 2011;20:236–242. doi:10.1183/09059180.00006711
72. Tousignant C, Kim H, Papa F, Mazer CD. Evaluation of TAPSE as a measure of right ventricular output. Can J Anaesth. 2012;59(4):376–383. doi:10.1007/s12630-011-9659-3
73. Hoette S, Creuzé N, Günther S, et al. RV fractional area change and TAPSE as predictors of severe right ventricular dysfunction in pulmonary hypertension: a CMR study. Lung. 2018;196(2):157–164. doi:10.1007/s00408-018-0089-7
74. Fuertes J, Gomez A, Rivas A, Murga I, Parraza N. Correlation study between three different methods that estimate right ventricular function after an acute pulmonary embolism (PE). Eur Respir J. 2016;48:PA2463. doi:10.1183/13993003.congress-2016.PA2463
75. Michalski M, Haas N, Pozza R, et al. Tricuspid Annular Plane Systolic Excursion (TAPSE) correlates with mean pulmonary artery pressure especially 10 years after pediatric heart transplantation. Clin Transplant. 2022:e14710. doi:10.1111/ctr.14710
76. Ghio S, Klersy C, Magrini G, et al. Prognostic relevance of the echocardiographic assessment of right ventricular function in patients with idiopathic pulmonary arterial hypertension. Int J Cardiol. 2010;140:272–278. doi:10.1016/j.ijcard.2008.11.051
77. Corrêa R, de Oliveira F, Barbosa M, et al. Left ventricular function in patients with pulmonary arterial hypertension: the role of two-dimensional speckle tracking strain. Echocardiography. 2016;33:1326–1333. doi:10.1111/echo.13267
78. Negishi K, Negishi T, Kurosawa K, et al. Practical guidance in echocardiographic assessment of global longitudinal strain. JACC Cardiovasc Imaging. 2015;82015:489–492. doi:10.1016/j.jcmg.2014.06.013
 © 2022 The Author(s). This work is published and licensed by Dove Medical Press Limited. The
full terms of this license are available at https://www.dovepress.com/terms
and incorporate the Creative Commons Attribution
- Non Commercial (unported, 3.0) License.
By accessing the work you hereby accept the Terms. Non-commercial uses of the work are permitted
without any further permission from Dove Medical Press Limited, provided the work is properly
attributed. For permission for commercial use of this work, please see paragraphs 4.2 and 5 of our Terms.
© 2022 The Author(s). This work is published and licensed by Dove Medical Press Limited. The
full terms of this license are available at https://www.dovepress.com/terms
and incorporate the Creative Commons Attribution
- Non Commercial (unported, 3.0) License.
By accessing the work you hereby accept the Terms. Non-commercial uses of the work are permitted
without any further permission from Dove Medical Press Limited, provided the work is properly
attributed. For permission for commercial use of this work, please see paragraphs 4.2 and 5 of our Terms.