Back to Journals » Nature and Science of Sleep » Volume 14
Variation in Gut Microbiota Composition is Associated with Sleep Quality and Cognitive Performance in Older Adults with Insomnia
Authors Haimov I, Magzal F, Tamir S, Lalzar M, Asraf K, Milman U, Agmon M, Shochat T
Received 6 June 2022
Accepted for publication 30 August 2022
Published 6 October 2022 Volume 2022:14 Pages 1753—1767
DOI https://doi.org/10.2147/NSS.S377114
Checked for plagiarism Yes
Review by Single anonymous peer review
Peer reviewer comments 4
Editor who approved publication: Prof. Dr. Ahmed BaHammam
Iris Haimov,1,* Faiga Magzal,2,3,* Snait Tamir,2,3 Maya Lalzar,4 Kfir Asraf,1 Uzi Milman,5 Maayan Agmon,6,* Tamar Shochat6,*
1Department of Psychology and the Center for Psychobiological Research, The Max Stern Yezreel Valley College, Yezreel Valley, Israel; 2Laboratory of Human Health and Nutrition Sciences, MIGAL-Galilee Research Institute, Kiryat Shmona, Israel; 3Nutritional Science Department, Tel Hai College, Kiryat Shmona, Israel; 4Bioinformatics Service Unit, University of Haifa, Haifa, Israel; 5Clinical Research Unit, Clalit Health Services, Haifa, Israel; 6The Cheryl Spencer Department of Nursing, University of Haifa, Haifa, Israel
*These authors contributed equally to this work
Correspondence: Iris Haimov, Department of Psychology and the Center for Psychobiological Research, the Max Stern Yezreel Valley College, Yezreel Valley, 1930600, Israel, Email [email protected]
Purpose: Insomnia, a chronic condition affecting 50% of older adults, is often accompanied by cognitive decline. The mechanism underlying this comorbidity is not fully understood. A growing literature suggests the importance of gut microbiota for brain function. We tested associations between sleep quality and cognitive performance with gut microbiota in older adults with insomnia.
Patients and Methods: Seventy-two older adults with insomnia (age 73.2 ± 5.73 years, 56 females) provided stool samples for gut microbial sequencing. Microbiota profile was determined using the DADA2 bioinformatics pipeline. Cognition was assessed with the Cambridge Neuropsychological Test Automated Battery. Objective sleep quality was monitored by a two-week actigraphic recording, and participants completed the Insomnia Severity Index (ISI). We used partial canonical correspondence analysis (pCCA) to examine the relative contribution of insomnia, based on actigraphic sleep efficiency (SE) and ISI, and of cognitive status, based on the Multitasking test of Median Reaction Latency (MTTLMD) and the Spatial Working Memory Between Errors (SWMBE), to variance in microbiota composition. We used Pearson correlations to correlate insomnia and cognitive status parameters with microbiota amplicon sequence variants, genera, and families.
Results: The pCCA revealed that sleep quality and cognitive performance explained a variation of 7.5– 7.9% in gut microbiota composition in older adults with insomnia. Correlation analysis demonstrated that Lachnoclostridium (genus) correlates positively with SE (r=0.42; P=0.05) and negatively with MTTLMD (r=− 0.29; P=0.03), whereas Blautia (genus) correlates negatively with MTTLMD (r=− 0.31; P=0.01).
Conclusion: Findings demonstrate the associations of sleep quality and cognitive performance with variance in gut microbiota composition and with specific genus abundance in older adults with insomnia. Further studies should validate the findings, determine causal relationships, and evaluate potential interventions for the comorbidity of insomnia and cognitive impairment in older adults with insomnia.
Keywords: actigraphy, cognition, older adults, microbiome, sleep efficiency
Introduction
Late-life insomnia is a common chronic health condition in older adults, affecting around 50% of the adult population over 65 years old.1 It is strongly associated with mental illness, cognitive decline,1–3 poor psychological wellbeing, and health-related quality of life.4–6 Diagnostic criteria for chronic insomnia include difficulty initiating and/or maintaining sleep and early morning awakenings, with significant daytime consequences lasting over three months.3
Changes in sleep quality through the aging process are often associated with cognitive decline. Aging is associated with deteriorating performance on various cognitive tasks under the umbrella of executive function, such as speed of processing information, perceptual speed, concentration and attention, inhibition functioning, and memory.3,6 Several studies have shown that the cognitive impairments observed in older adults with insomnia are far more severe than those observed in older adults without insomnia.7–9 Longitudinal studies have shown an increased risk of mortality in non-demented older adults with cognitive impairments.7,8
The tight interdependence between sleep and cognitive functioning has been investigated extensively in the past three decades. There is extensive evidence demonstrating the central role of sleep in brain plasticity, memory consolidation, and optimal cognitive engagement,9,10 yet the literature on the positive effects of learning on sleep architecture, although consistent, is small.11–17 Studies of both younger and older populations without insomnia have shown that following learning, young adults exhibit increases in sleep continuity;18,19 proportion of REM sleep;17,20,21 number of REMs and REM density;14,17,21 duration of Stage 2 sleep, number of sleep spindles, and spindle density;12,14–16,22 and slow-wave activity (SWA). Older adults displayed an increase in the number of minutes of slow-wave sleep (SWS) and SWS percentage after learning.12,15,23 Studies have shown that pre-sleep learning improves subsequent sleep quality in older individuals, in the areas of continuity, stability, and organization.24 Two studies to date have investigated the beneficial effects of prolonged cognitive training over an 8-week session on the sleep quality of older adults with insomnia.25,26 Haimov and Shatil25 demonstrated the beneficial effects of personalized computerized cognitive training on sleep quality and cognitive function in older adults with insomnia, showing that improved sleep quality is predicted by an improvement in cognitive performance. Keramtinejad et al26 revealed that group cognitive training improved cognitive function and sleep quality in older adults with insomnia and mild cognitive impairment.
Although both insomnia and cognitive impairments are highly prevalent chronic conditions in older adults, the underlying mechanisms of age-related decline in these functions are unclear. Such an understanding may account for the limited efficacy of current treatments and pave the way to better interventions.
A potential explanation of insomnia and cognitive decline in old age lies in the gut microbiota-brain connection, yet to be fully explored. A growing literature suggests the importance of gut microbiota for brain function.27 The brain-gut-enteric microbiota axis is a bi-directional communication system comprised of neural pathways, which includes the autonomic nervous system (ANS), the enteric nervous system (ENS), the neuroendocrine system, and the immune system.27,28 Findings show associations between stress reactivity mechanisms and gut microbiota composition, possibly through CNS plasticity-related serotonergic and GABAergic signaling systems.27,29 Perturbation of these systems results in alterations in the stress response and overall behavior.30 Findings have shown that gut microbiota modulates stress-related mental illness, ie, depression and anxiety.31–33 It has recently been suggested that gut microbiota may underlie the comorbidity of insomnia and depression through their metabolites, including serotonin, dopamine, and GABA, or through pro-inflammatory pathways.34
The gut microbiome is a dynamic entity whose assembly and action are affected by several factors, including genetics,35 diet,36 metabolism,37 geography,38 antibiotics,37 age,37 and stress.37 In the course of aging, deterioration in dentition, salivary function, digestion, and intestinal transit time affect the intestinal microbiota creating dysbiosis, defined as an imbalance in gut microbiota composition that is associated with disease.39 The composition and diversity levels of intestinal microbiota differ markedly between older and younger adults.40 Firmicutes and Bacteroidetes are the two main bacterial phyla in the gastrointestinal tract of healthy adults.41 The ratio between these two phyla (the Firmicutes/Bacteroidetes (F/B) ratio) has been associated with gut microbiota homeostasis, and changes in the ratio could lead to various pathologies.42–44
Only a handful of studies to date have investigated the associations between sleep and gut microbiota in humans, and studies of adults are rare, with inconsistent findings possibly due to small sample sizes. Sleep laboratory studies in healthy adults found changes in microbiota composition following two nights of sleep deprivation.45 A 5-night sleep restriction protocol, however, did not show a significant effect on gut microbiota.46 A study of healthy middle-aged to older adults found associations between self-reported sleep quality and abundances at the phylum level.47
Previous animal experiments48,49 and small clinical studies of healthy adults50 have also shown that changes in cognition may be linked to changes in the gut microbiome. Yet, few studies have investigated gut microbiota and cognition in large samples from community settings. A recent cross-sectional study showed significant associations between specific microorganisms and cognition measurements, such as positive associations of Lachnospiraceae FCS020 with the results of the Digit Symbol Substitution Test (DSST), and negative associations of Sutterella with the results of the Montreal Cognitive Assessment (MoCA).51
The ability of gut microbiota to communicate with the brain and thus modulate behavior is emerging as a promising concept in health and disease, including its effect on mental function and cognitive performance in older age, providing a window for examining the associations between gut microbiota, sleep, and cognition.
The objectives of the present study were to investigate associations between microbiota and two distinct functions that typically show accelerated decline over the aging process, sleep and cognition, in community-based older adults with chronic insomnia. We conducted an exploratory investigation testing associations between microbiota composition (assessed by high-throughput sequencing of 16S rRNA gene amplicons from stools), and sleep quality, based on objective (activity monitoring) and subjective (self-report) measurements, and cognitive functioning (performance monitoring), based on cognitive tests. We hypothesized that in older adults with insomnia, (1) objective and subjective sleep and cognitive performance significantly explain variation in the microbiota community, and (2) gut microbiota members are associated with sleep quality and cognitive performance.
Materials and Methods
The study was carried out in accordance with the Declaration of Helsinki and was approved by the institutional review board (IRB) of the Faculty of Social Welfare and Health Sciences at the University of Haifa (approval number 026/17). All study participants signed informed consent.
Participants
Two hundred and twenty-four potential participants, aged 65 and older, responded to advertisements and calls in community centers for older adult volunteers with a complaint of insomnia and/or sleep dissatisfaction lasting at least several months, together with complaints of daytime impairment. Participants were eligible for inclusion in the study if they met the criteria for insomnia in adults according to the Diagnostic and Statistical Manual of Mental Disorders, 5th edition (DSM-5),52 ie, difficulty initiating sleep, difficulty maintaining sleep, and/or early morning awakening at least 3 times per week, lasting > 3 months, and associated with impaired daytime functioning.52 Insomnia symptoms were diagnosed by self-report and confirmed by actigraphic recordings over a period of two weeks, based on the accepted benchmark criteria for insomnia:53,54 mean sleep onset latency (SOL) or mean wake time after sleep onset (WASO) of ≥30 min, and <85% sleep efficiency (SE, percentage of total sleep time after initial sleep onset) for at least six of 14 nights during the two weeks of actigraphic recording. Potential participants also underwent a short clinical interview conducted by a trained interviewer, in which they were asked about medical conditions, addictions, substance use, and nighttime sleep problems. Exclusion criteria included significant visual or hearing impairment, chronic pain, substantial neurological or psychiatric illness, and alcohol or drug abuse. Also excluded were participants who, based on self-report, had sleep apnea syndrome (SAS), restless legs syndrome (RLS), rapid eye movement (REM) sleep behavior disorder (RBD), or periodic limb movement disorder (PLMD) during sleep, as well as individuals with cognitive impairment who scored < 26 on the Mini-Mental State Examination (MMSE).55 A total of 72 participants were eligible, for whom we recorded gender, age, body mass index (BMI), use of sleep and depression medications, cardiovascular diseases (CVDs), diabetes, blood pressure, and cholesterol levels. All participants provided a fecal sample for microbiome analysis. (Figure 1) shows a flowchart summarizing the study stages. (Table S1) shows participant information and test measurements.
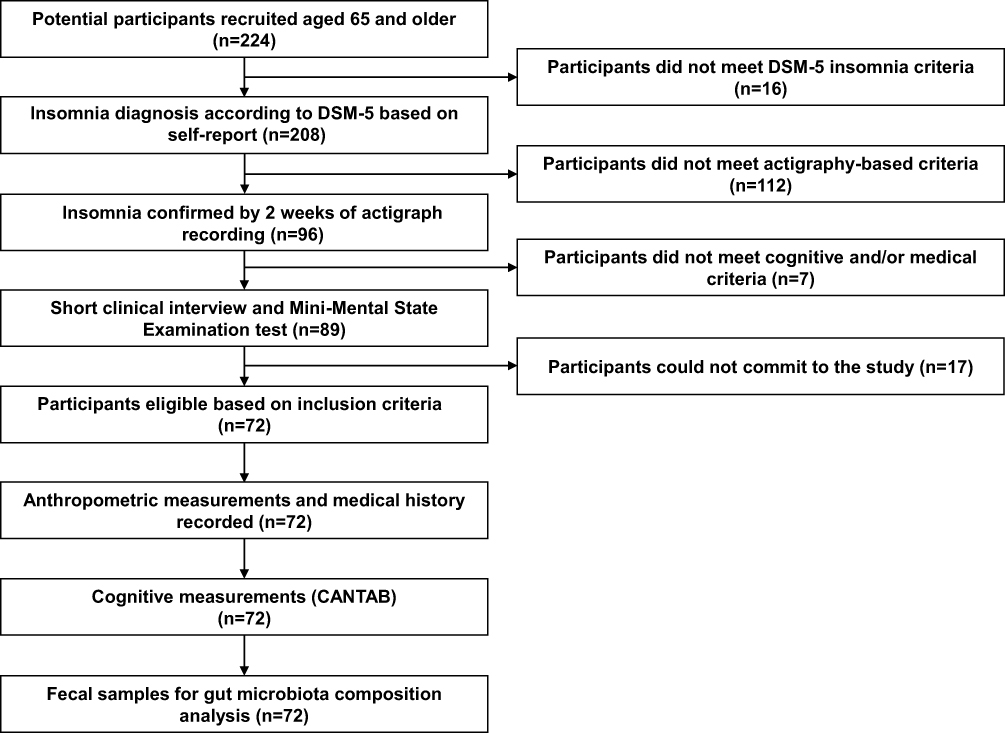 |
Figure 1 Flowchart of the study design. |
Measures
Objective Sleep Measurements
Sleep recordings were performed in one-minute epochs with the Actiwatch activity monitor (Phillips Respironics) and downloaded for analysis to dedicated software (Actiware 6.0.9). Sleep onset and offset were set to the first and last epoch of ten consecutive immobile minutes, respectively. Participants were instructed to press on the event marker, a built-in feature of the Actiwatch, at both bedtime and final awakening. In addition, they were asked to complete a sleep diary each morning upon awakening. Rest intervals were based primarily on event markers and verified by sleep diary records. Actiwatch-derived measures were Total Sleep Time (TST), SOL, SE, and WASO.
Subjective Sleep Measurements
Participants completed an ISI questionnaire.56 A total score was calculated and interpreted according to conventional guidelines (ie, a score > 15 indicates clinical insomnia).57
Cognitive Measurements
Participants performed a battery of cognitive tests on the Cambridge Neuropsychological Test Automated Battery (CANTAB) system. CANTAB has been used in more than 2,500 clinical studies and cited in more than 100,000 papers, supporting its use as a gold standard in cognitive research, including in older adults.58–60 We assembled a battery of 6 tests, representing different domains of cognition: Motor Screening Task (MOT), Reaction Time Task (RTI), and Rapid Visual Information Processing (RVP), which examine attention and psychomotor speed; Multitasking Test (MTT) and Spatial Working Memory (SWM), which examine executive functions; and Paired Associates Learning (PAL), which examine memory. We extracted and processed key measures in each test, as defined by CANTAB.
Fecal Sample Collection and Processing
Sampling
Participants received clear instructions for the collection of samples at their homes. Each participant self-collected a fecal sample during the morning hours, stored it in a screw-capped collection container filled with a DNase and RNase inhibitor solution (DNA/RNA Shield Fecal Collection Tube, Zymo Research, CA, USA), and kept it at room temperature for a maximum of one week, after which it was kept at −80℃ until analysis.
DNA Extraction and 16S rRNA Amplification and Sequencing
DNA was extracted from all fecal samples using the DNeasy PowerSoil Kit (Qiagen, Hilden, Germany) according to manufacturer’s instructions.5 Universal primers 515F61 and 806R,62 targeting the highly conserved V4 region and containing Illumina adapter sequences, were used to amplify the 16S rRNA gene from individual samples. Amplification consisted of 20 cycles of 98℃ for 10 sec, annealing at 55℃ for 10 sec, and 72℃ for 20 sec, followed by 1 min at 72℃. A second PCR was performed using the Access Array primers for Illumina (Fluidigm) sequencers to add the sample barcode and index sequences to the samples for Illumina sequencing. Amplicons were purified using AMPure XP beads (Beckman Coulter, CA, USA) and subsequently quantified using Qubit (Life Technologies, CA, USA); amplicon size was determined by Tapestation (Agilent Technologies, CA, USA). The samples were then loaded on the MiSeq (TermoFisher, MA, USA) and sequenced using the MiSeq V2 (500 cycles) kit to generate paired-end reads of 2×250 bases. Raw sequence data were then demultiplexed and stored as fastq formatted files. Raw sequence data were deposited in the NCBI SRA database under BioProject accession PRJNA843882.
Sequence Data Processing
Sequence data were processed using the DADA2 pipeline.63 A separate analysis was conducted for each run, including quality trimming, barcode and primer removal, error model estimation, sequence correction, Amplicon Sequence Variant (ASV) inference, and quantification. The ASV and count tables of all runs were then merged. Subsequently, suspected chimeras were detected and removed. For each ASV, taxonomy was inferred by alignment to a current version of the SILVA non-redundant small subunit ribosomal RNA database (version 138)64 using the DADA2 command “assignTaxonomy”, and setting the minimum bootstrap confidence value to 80%. The produced ASV-sample count table was filtered to remove sequences of non-relevant origin (unclassified, chloroplast, mitochondria). (Supplementary Table S2) lists the ASVs and counts per sample.
Statistical Analyses
We examined the normality of sleep and cognition variables visually using Q-Q plots, and skewness and kurtosis values, and none of them violated the assumption of normality. Alpha diversity measures, Shannon H’ index of diversity (Shannon), Simpson index of dominance (Simpson) and number of observed species (Sobs) were not statistically significant for the parameters Age, BMI, ISI, SE, Multitasking test of Median Reaction Latency (MTTLMD) and Spatial Working Memory Between Errors (SWMBE) (Table S3).
We applied principal component analysis (PCA) to test the correspondence between the 15 cognitive measurements. We conducted PCA using the “principals” function in the R package Gifi (version 0.3–9). We extracted the first two principal components (PC) based on ranking of the eigenvalues, and recorded and ranked the loadings of each cognitive variable. The highest loadings on the first PC was MTTLMD, and on the second PC it was SWMBE. Together, the first and second PCs accounted for 91.4% of the variance.
We inspected the microbiota counts table and recorded the relative contributions of different phyla. We calculated the Firmicutes/Bacteroidetes ratio based on their relative abundances for each sample. The ratio was plotted as a density plot, and skewness and kurtosis coefficients were calculated in R using the “moments” package (version 0.14). Next, we conducted a partial canonical correspondence analysis (pCCA) to discover the relative contribution of insomnia state represented by ISI and SE, together with cognitive state, represented by MTTLMD and SWMBE, to variance in microbiota composition. To this end, the counts data were normalized by the cumulative sum squares (CSS) method, as implemented in the R package “metagenomeseq” (version 1.36.0).65 pCCA was executed using the R package “vegan” (version 2.5–7); the model (counts data ~ ISI+SE+MTTLMD+SWMBE) also included constraints to control for the effect of nine covariates: gender, age, BMI, use of sleep and depression medications, CVDs, diabetes, high blood pressure, and high cholesterol levels. The same procedure was performed for the normalized counts data at the ASV level, and at the genus and family levels of taxonomy. In all three cases, ASV/taxa were filtered using a prevalence cutoff of ≥ 10 samples. The model and the model terms were tested and considered significant for P-values < 0.05. Goodness of fit between the extracted canonical correspondence factors and specific ASVs or taxonomic groups was calculated using the “goodness.cca” function in the R package “vegan.” Ten top ASVs or taxonomic groups, as ranked by the goodness-of-fit values, were extracted for each canonical correspondence factor and tested for Pearson correlation with each of the four model factors (ISI, SE, MTTLMD, and SWMBE) after counts data were log10 transformed. The FDR procedure was applied to control for false positives.
Results
Demographics, Sleep, and Cognitive Description of Participants
(Table 1) summarizes the descriptive statistics of the demographic parameters of participants in the study, including age, percentage of females, years of education, BMI, and the percentage of participants with high cholesterol, high blood pressure, diabetes, and cardiovascular disease, as well as the percentage of participants who took medications for depression, sleep, or both. Objective and subjective sleep parameters are shown in (Table 2). ISI and SE were chosen as subjective and objective measurements of sleep quality, respectively. Sleep efficiency (SE) was calculated based on the participants’ WASO, TST, and SOL.
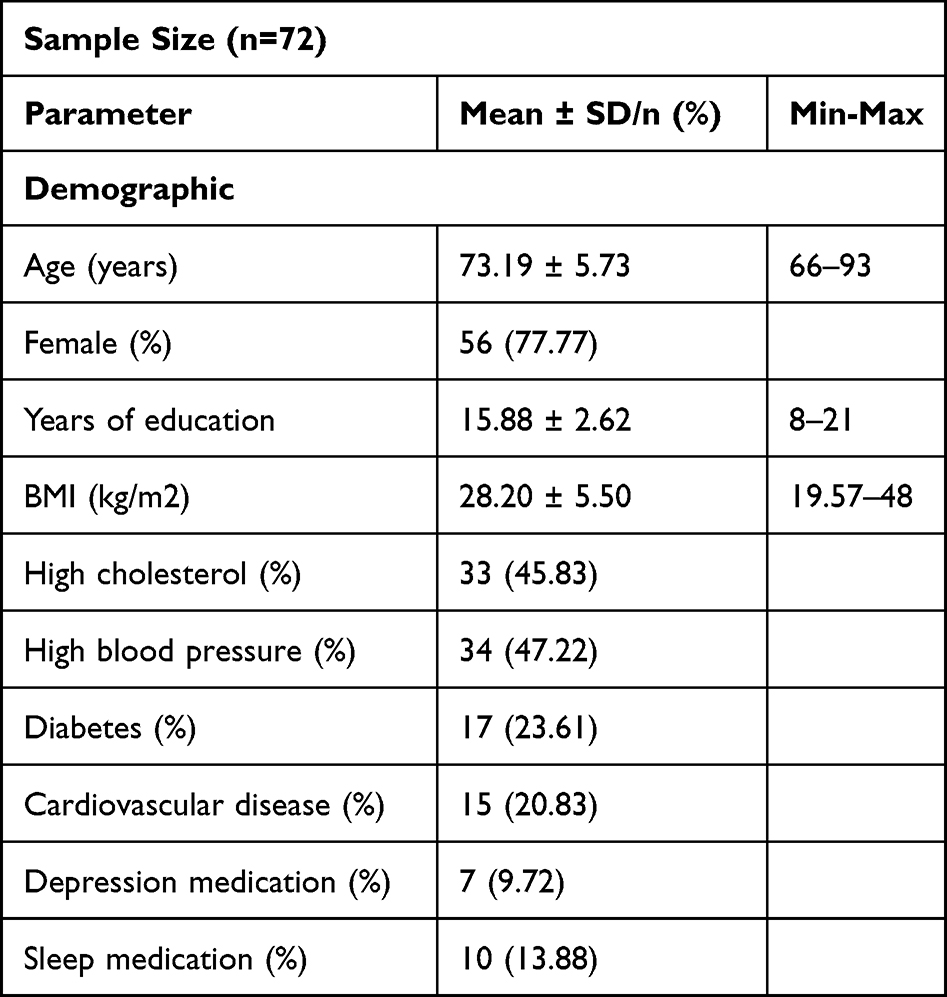 |
Table 1 Demographic Description |
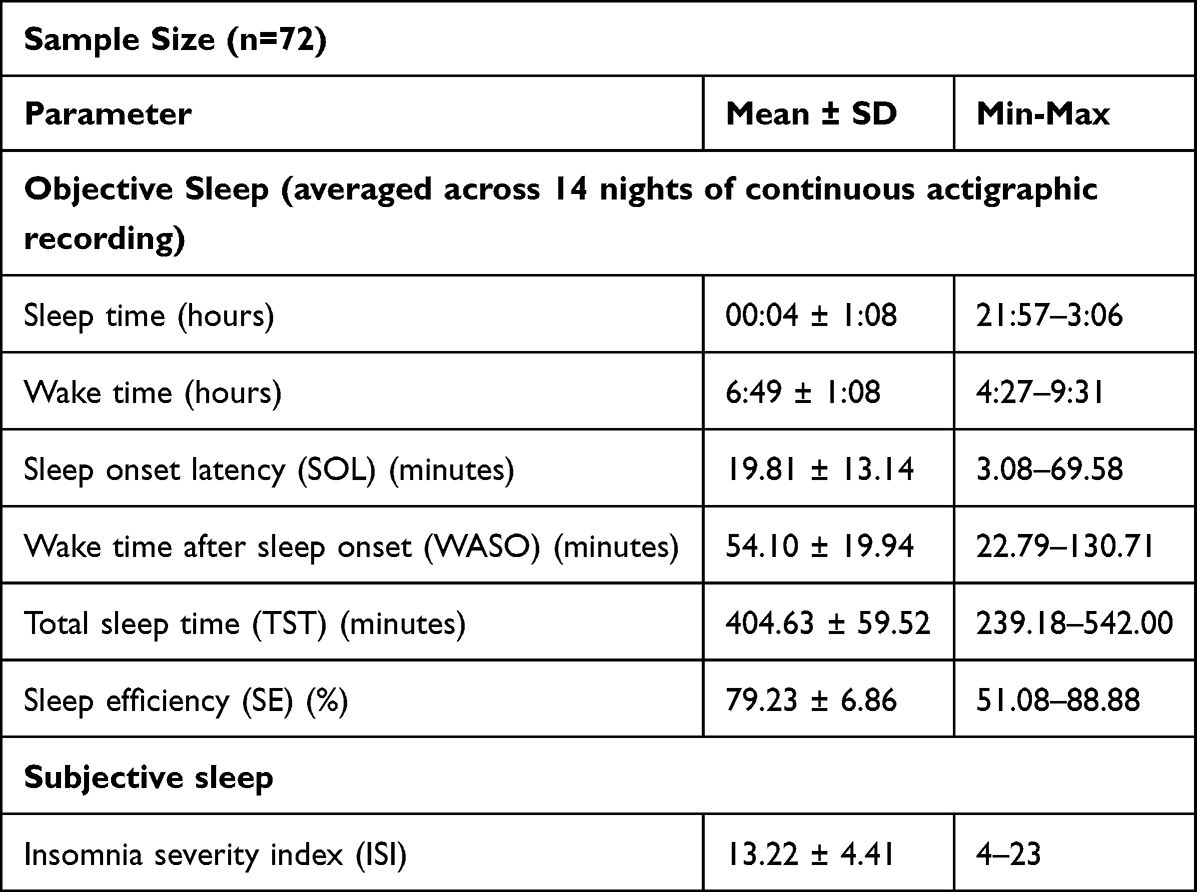 |
Table 2 Sleep Measurements |
(Table 3) describes the descriptive statistics of cognitive measurements collected from CANTAB. These measurements included a Motor Screening test (MOT, ie, MOTML), Multitasking tests (MTT, MTTTIC and MTTLMD), Paired Associates Learning tests (PAL, PALTEA and PALFAMS), Reaction Time Task tests (RTI, RTIFMDRT and RTIFMDMT), Rapid Visual Information Processing tests (RVP, RVPA, RVPPFA, and RVPMDL), and Spatial Working Memory tests (SWM, SWMBE, SWMS, SWMBE4, SWMBE6, and SWMBE8). The table includes a description of each measurement, its mean, standard deviation, median, and minimum and maximum interval.
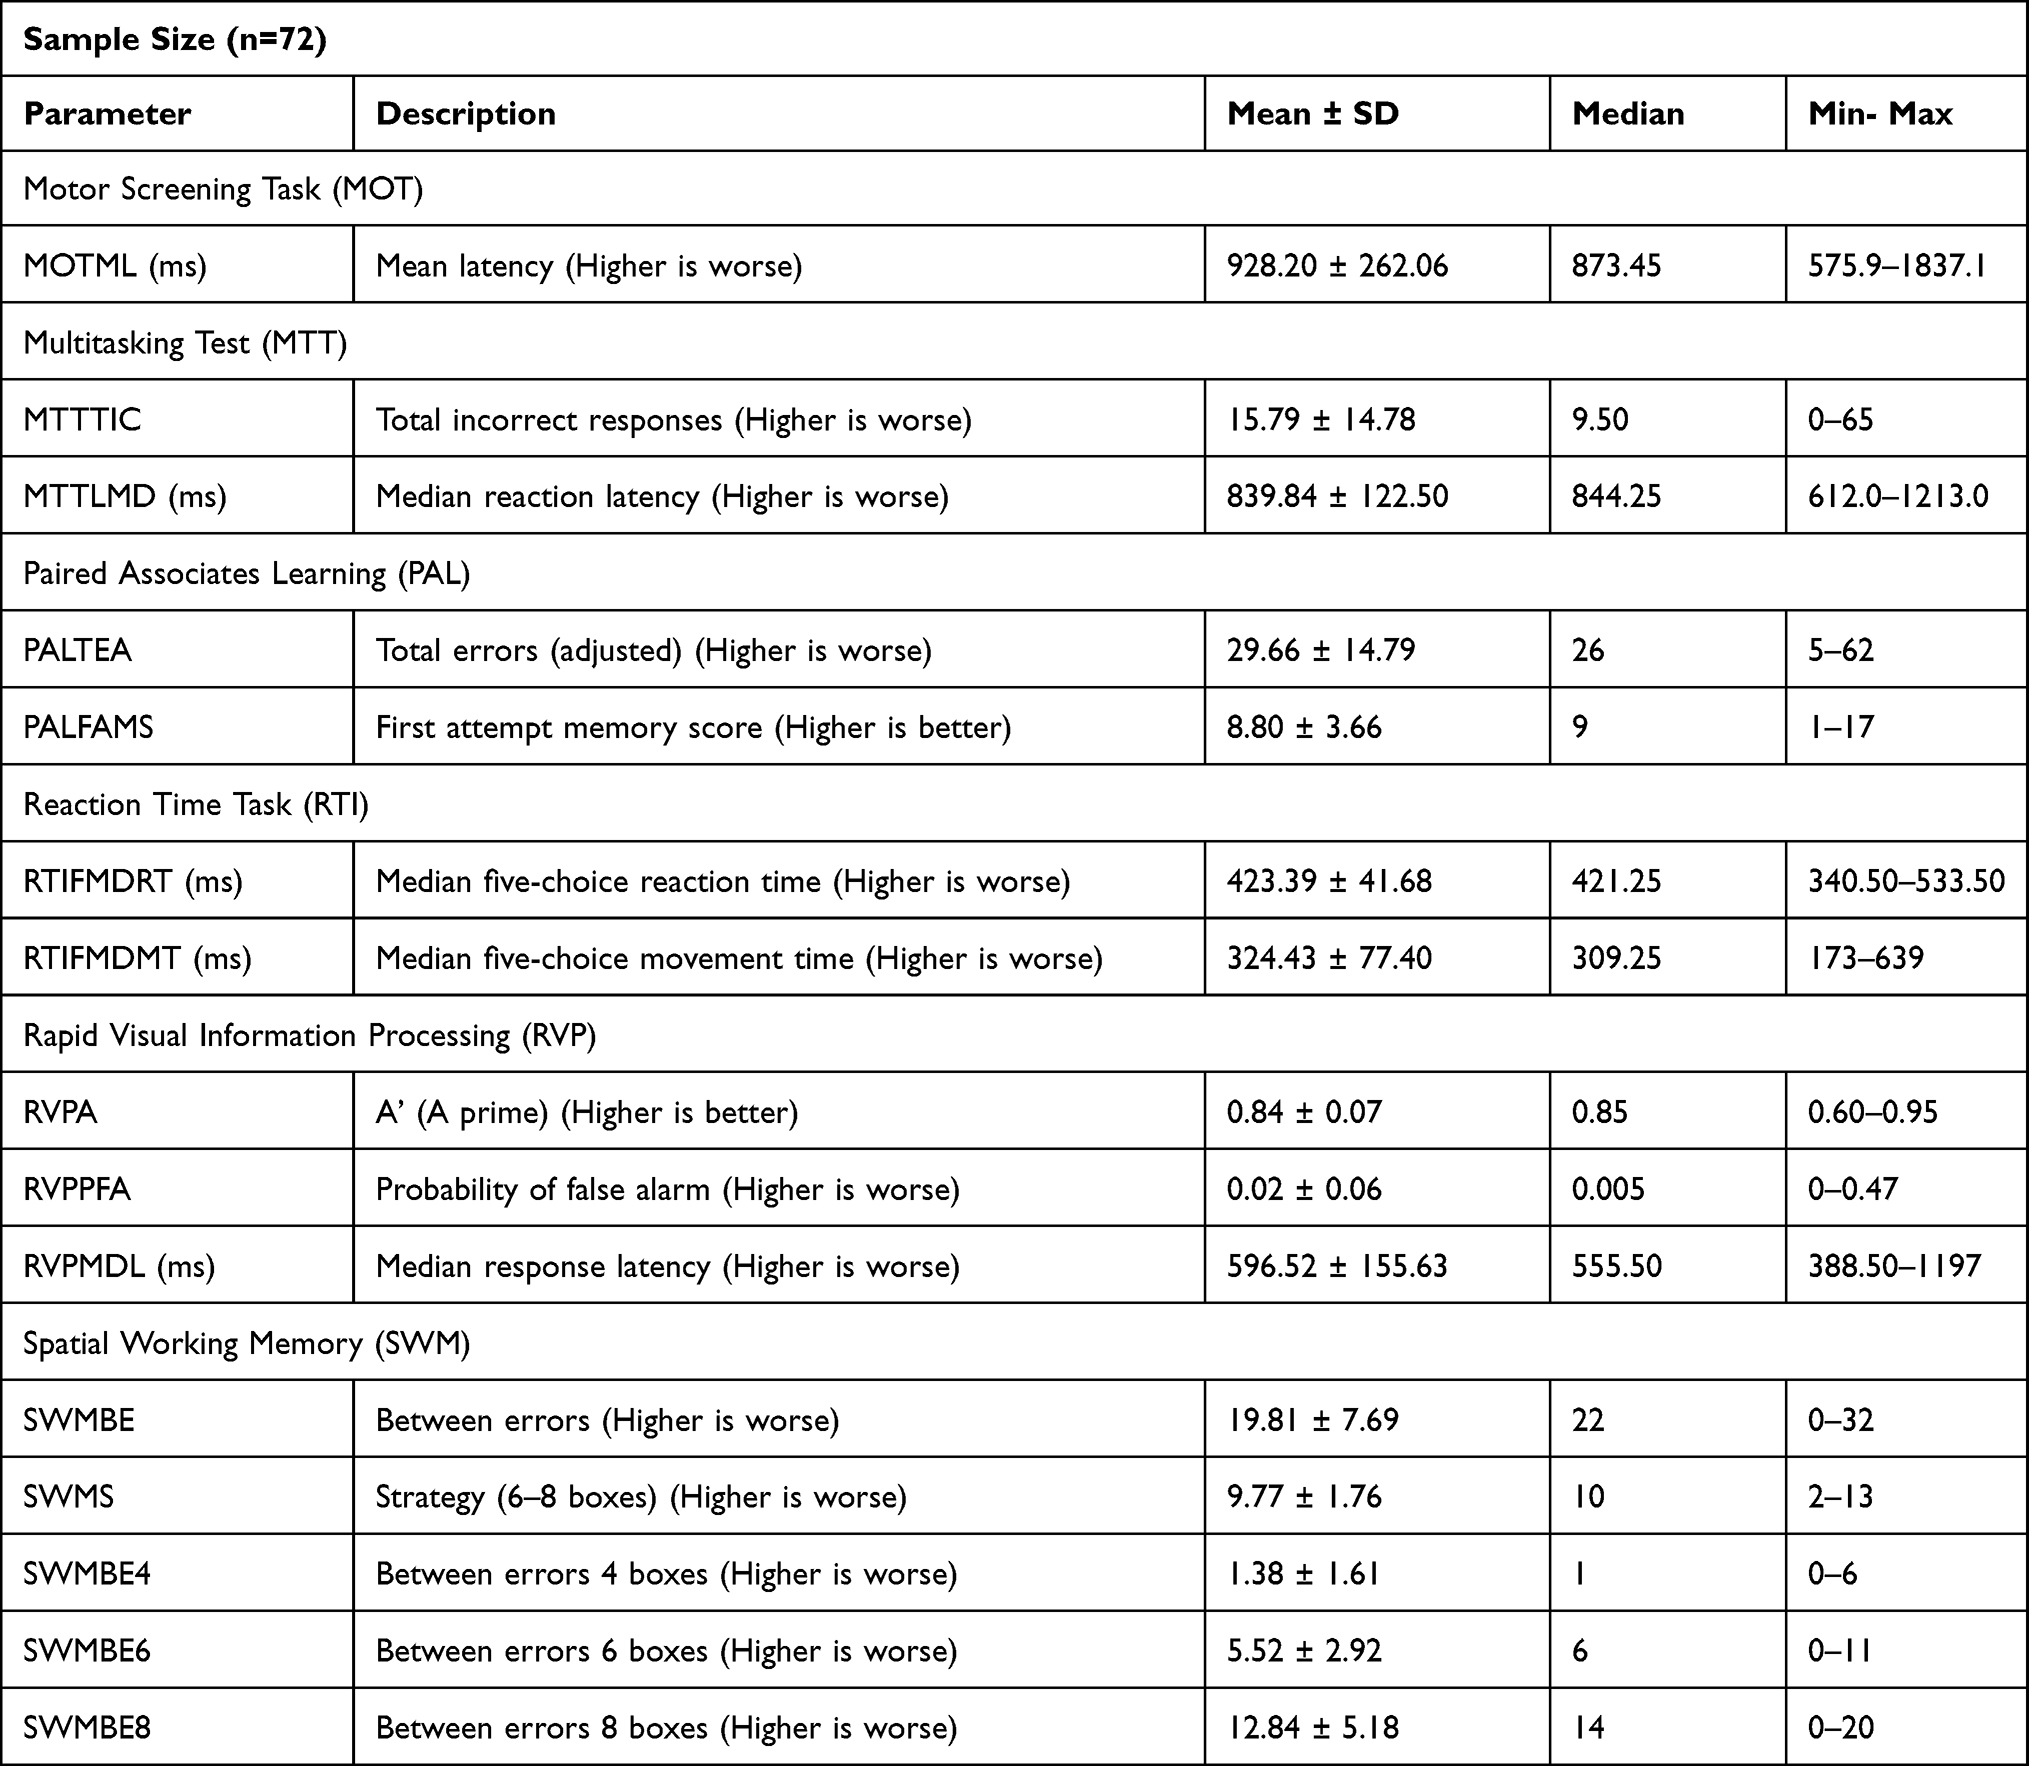 |
Table 3 Cognitive Measurements |
Dimensionality Reduction and Section of Cognitive Variables
To describe the importance and redundancy of the 15 cognitive variables measured, we performed a PCA. The top two PCs cumulatively explained 91.4% of the variance (Figure 2). Based on variable loadings on the first and the second PCs, MTTLMD and SWMBE were selected to represent the cognitive performance of the patients for further analysis, and their correspondence with gut microbiota composition was tested. MTTLMD is a measure of MTT that asks participants to manage conflicting information and ignore task-irrelevant information. SWMBE is a measure of SWM, which requires the use of spatial memory and manipulation of visuospatial information. Both tests require the use of executive functions.
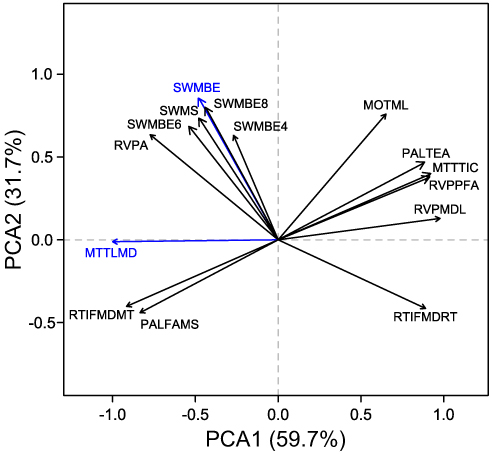 |
Figure 2 Variation in cognitive performance in 67 older adults with insomnia. Principal components analysis (PCA) of scores measured for 15 cognitive tasks. The first two PCs with the highest eigenvalues are presented, together explaining 91.4% of the variance. Colored arrows indicate cognitive measurements with the highest loading on the first and second PC. |
Microbiota Composition
For the fecal microbiota composition of the 72 patients, a total of 3067 bacterial ASVs were determined and assigned to 45 phyla (Table S2). Only three phyla were dominant: Bacteroidetes and Firmicutes were similar in relative abundance and together comprised on average 90.5% ± 7.0% of the total community, and Proteobacteria comprised on average 5.9% ± 6.2% (Figure 3A). Firmicutes to Bacteroidetes ratio distribution was highly positively skewed, with high kurtosis (skewness coefficient = 1.59; kurtosis coefficient = 6.39), and a median of 1.02 (Figure 3B).
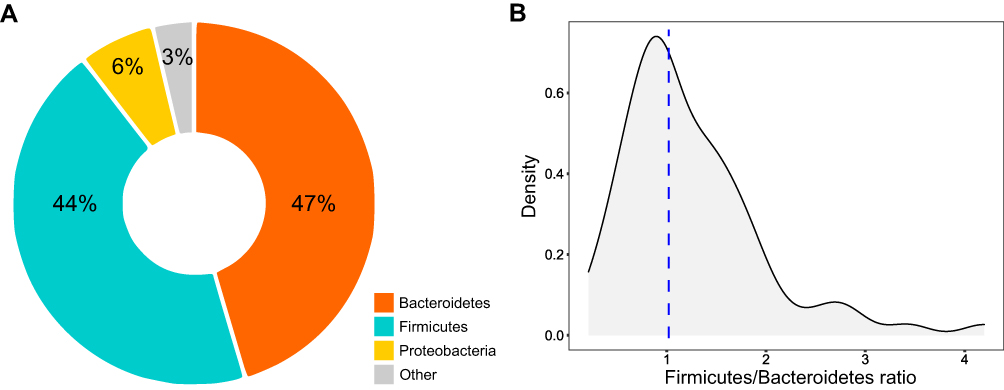 |
Figure 3 Composition of the gut microbiota of older adults with insomnia. Gut microbiota composition was determined by high-throughput sequencing of 16SrRNA gene fragments, PCR amplified from total DNA extracted from fecal samples. (a) Averages of the phyla relative abundances. (b) The density plot represents the distribution of Firmicutes-Bacteroidetes ratio in insomnia patients. The dotted line marks the median value of ratios. |
We examined the correspondence between gut microbiota composition, insomnia, and cognitive performance using partial canonical correspondence analysis (pCCA). SE and ISI represented insomnia, and MTTLMD and SWMBE cognitive performance as explanatory factors. In addition, nine covariates representing demographic and physiological attributes were conditioned to assess the independent effects of the explanatory variables (see Methods). The model was significant when tested at the ASV, the genus, and the family levels of taxonomy (Table 4). In total, they explained 7.6%, 7.5%, and 7.9% of the total variance in community composition for these levels, respectively (Table 4). SE was a significant factor in all tested levels (P<0.05). MTTLMD was significant at the ASV level (P<0.05) and only marginally significant at the genus or family levels (P<0.1). SWMBE was significant at the ASV level (P<0.05). The pCCA ordination plot for the ASV level model (Figure 4) supported the grouping of patients based on ISI categories (1=0–7, absence of insomnia; 2=8–14, sub-threshold insomnia; 3=15–21, moderate insomnia; 4=22–28, severe insomnia).
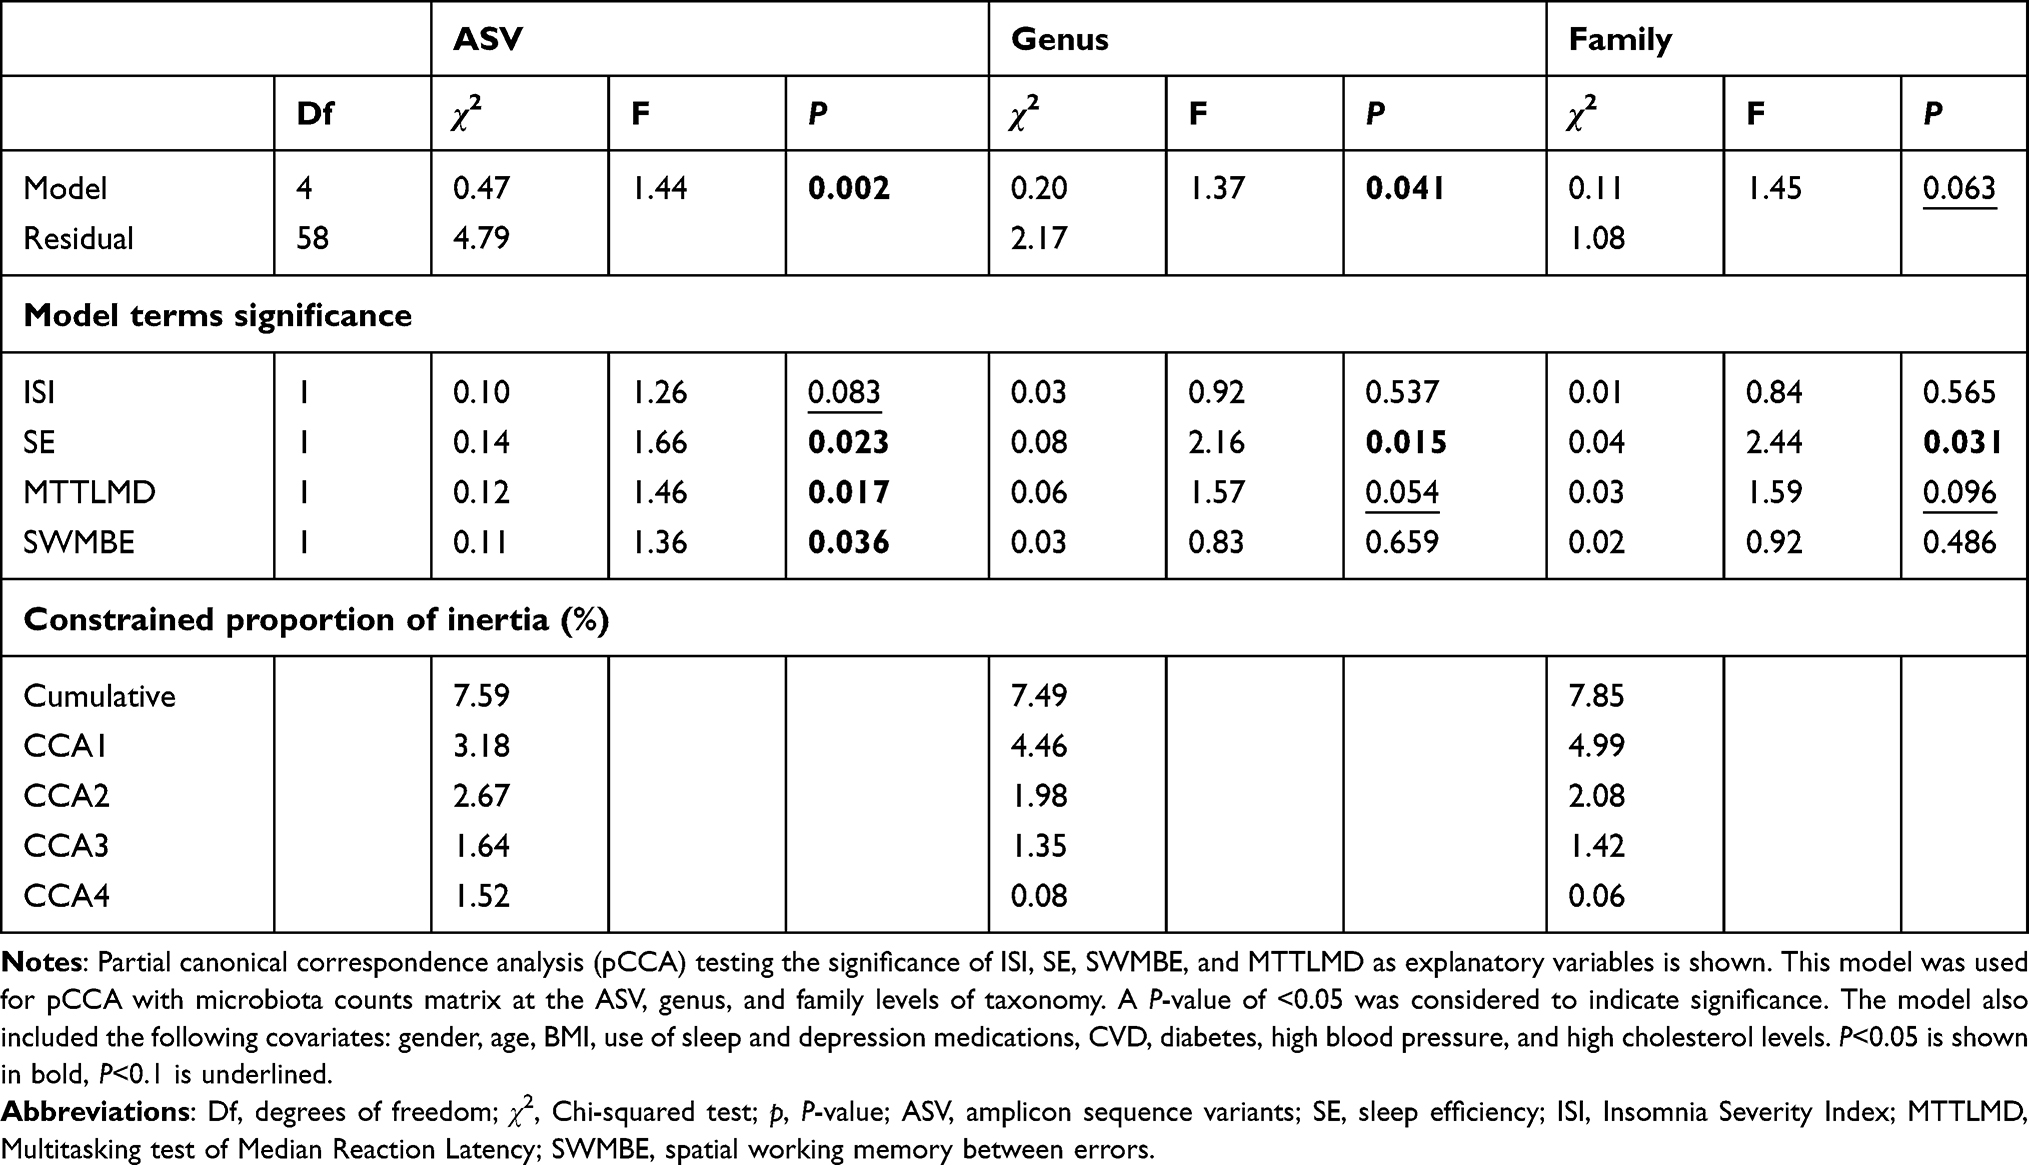 |
Table 4 The Contribution of Insomnia and Cognitive Parameters to the Variance in Gut Microbiota Composition |
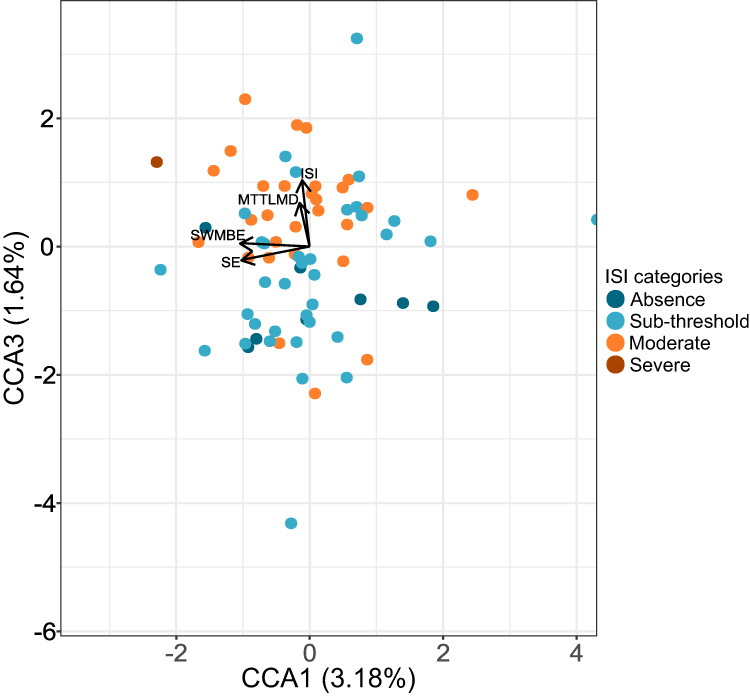 |
Figure 4 Partial canonical correspondence (pCCA) ordination plot. The first and third canonical correspondence axes are shown. Values in brackets represent the percentage of total variance explained by the axis. Each dot represents a sample; colors are assigned according to ISI categories (ISI_cat) (1=0–7, absence of insomnia; 2=8–14, sub-threshold insomnia; 3=15–21, moderate insomnia; 4=22–28, severe insomnia). Abbreviations: SE, sleep efficiency; ISI, Insomnia Severity Index; MTTLMD, Multitasking test of Median Reaction Latency; SWMBE, spatial working memory between errors. |
The goodness-of-fit parameter was calculated between bacterial populations and the pCCA model (Table S4). ASVs, genera, and families with the highest fit to the four pCCA axes were extracted and correlated by the Pearson method to the model explanatory factors. Although some ASVs and families showed a clear correspondence to one or another explanatory factor, none passed the FDR test with a value <0.1, the chosen criterion for significant correlation (Figure 5). However, several genera were found to be significantly correlated with SE and MTTLMD (Table S5). Lachnoclostridium was positively correlated with SE and negatively correlated with MTTLMD.
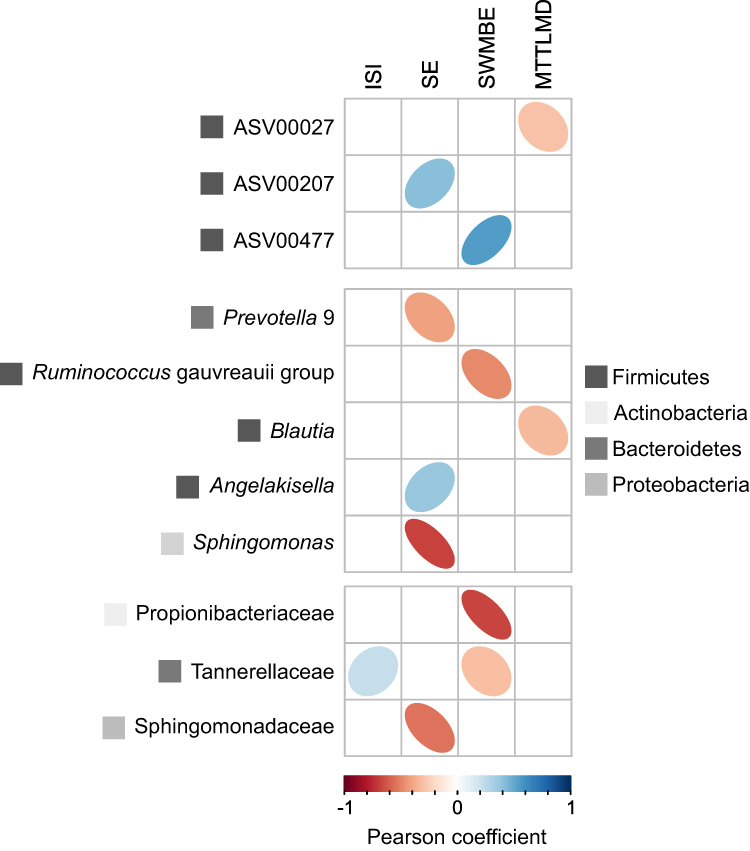 |
Figure 5 Pearson correlations between ASVs or taxonomic groups most associated with the canonical correspondence axis (three top ASVs/taxa for each of the four CCAs) and insomnia and cognitive measurements. ASVs/taxa for which P-values <0.05 are presented for ASV and family levels of classification; taxa for which FDR ajusted P-value <0.1 are presented for the genus level of classification. |
Discussion
The main findings are that in older adults with insomnia, sleep and cognition factors explained 7.5–7.9% of the total variance in the microbiota composition at the ASV and genus levels. Objective sleep efficiency was a significant predictor at the ASV, genus, and family levels, although the omnibus model for that level was only marginally significant, whereas cognition was significant at the ASV level. Medication, blood parameters, bowel, dietary information, health, and anthropometric data explained roughly the same amount of variance in a population-level study66 as explained by sleep and cognition in the current study. The variance explained by sleep and cognition is unique and independent of gender, age, BMI, use of sleep and depression medications, CVD, diabetes, high blood pressure, and high cholesterol levels. The findings suggest that sleep and cognition have a substantial and independent explanative power regarding microbiota composition. Furthermore, significant associations were found between sleep efficiency and cognition parameters and specific microbiota ASVs.
The results reveal that objective sleep efficiency was a significant predictor of the variation in microbiota composition, whereas subjective ISI was not. The discrepancy we found between objective and subjective sleep measures is compatible with previous studies showing that extreme deviations are common between subjective and objective sleep parameters in older adults.67,68
In our study, Bacteroidetes was the dominant phylum, accounting for 48% of relative abundance of all microorganisms. Our results are consistent with a previous study showing that insomnia patients had Bacteroidetes as the dominant taxon in the gut, whereas Firmicutes and Proteobacteria were more prominent in healthy controls.44
Similarly, Grosicki et al69 reported that self-reported sleep quality, assessed by Pittsburgh Sleep Quality Index (PSQI), was found to be associated with F/B ratio in healthy young individuals. The results of their study showed that healthy young individuals diagnosed as “normal” sleepers (characterized by a global PSQI score between 0 and 5) had lower abundances of the phylum Bacteroidetes, and higher abundance of Firmicutes, whereas “poor” sleepers (characterized by a global PSQI score > 5) had higher abundances of the phylum Bacteroidetes, and lower abundance of Firmicutes.
Our results also show that higher sleep efficiency and cognitive performance were associated with higher relative abundances of ASVs 207 and 027, both affiliated with the genus Lachnoclostridium. These results are consistent with previous cross-sectional studies performed in older populations.70,71 Agrawal et al showed a lower relative abundance of Lachnoclostridium in short sleepers than in normal sleepers.70 When compared to a control group, the relative abundance of Lachnoclostridium was higher in the cognitive impairment group.71
This study showed that lower cognitive performance is associated with higher Blautia relative abundances. A previous study also showed higher abundance of Blautia in less physically active adults with insomnia.72 Another study investigating associations between the gut microbiota and Parkinson’s disease showed that decreased abundance of Blautia was associated with cognitive decline.73 Blautia is a member of the Lachnospiraceae family. Lachnospiraceae are present in infants,74 however increases in its abundances are associated with aging.75 The Lachnospiraceae family are major producers of short-chain fatty acids, the principal bacterial metabolites that play a vital role in maintaining colonic integrity and metabolism, and in the development and homeostasis of the central nervous system.76 Although taxa of this family were shown to produce beneficial metabolites for the host, their effect on the host physiology is often scarce and inconsistent across studies. Smith et al showed negative associations between Lachnospiraceae and sleep deprivation, although no correlation was found between Lachnospiraceae and cognitive parameters.77 Further studies are needed to elucidate the role of these microbiota members in sleep and cognition.
To the best of our knowledge, this is the first study to show positive and simultaneous associations between Lachnoclostridium, sleep efficiency, and cognition. The study also presents novel microbiota taxa associated with sleep (eg, Angelakisella and Sphingomonas) and cognition (eg, the Ruminococcus gauvreauii group, Propionibacteriaceae).
The study has several limitations. First, assessment of sleep quality was based on actigraphic recording. Supplemental information from polysomnography (PSG) recording would have enabled us to investigate the association between sleep architecture and gut microbiota composition in older adults with insomnia. Second, because this investigation was part of a larger study on insomnia in older adults, we could not compare gut microbiota abundances and cognitive measurements with a non-insomnia control group. Third, our findings cannot be generalized to other age populations. Fourth, this was a cross-sectional investigation, therefore no causality can be inferred. Last, it is difficult to formulate mechanistic hypotheses based on information derived from amplicon sequencing in general and ribosomal RNA in particular. Further studies using metagenomics or metabolomics could highlight specific mechanisms related to the gut-brain axis concerning insomnia and cognition.
Conclusion
Insomnia and cognitive decline are common chronic conditions in aging and have been associated with changes in the gut microbiota composition. In this exploratory study, objective sleep and cognitive performance significantly explained variation in the gut microbiota composition. Furthermore, specific gut microbiota ASVs were associated with measures of sleep quality and cognitive performance. These findings strengthen the interrelationship between insomnia, cognition, and gut microbiota. Gut microbiota may serve as an important indicator for auxiliary diagnosis of older adults with insomnia and cognitive decline, and provide possible new therapeutic targets in the field of aging.
Acknowledgments
We thank all the participants in this study.
Author Contributions
All authors made a significant contribution to the work reported, whether in the conceptualization, study design, execution, acquisition of data, analysis and interpretation, or in all these areas. All authors took part in drafting, writing, revising, and critically reviewing the article; reviewed and gave final approval for the version to be published; agreed on the journal to which the article has been submitted; and agreed to take responsibility and be accountable for all aspects of the manuscript.
Funding
This research received funding from the Israeli Ministry of Science and Technology grant number 3-13607.
Disclosure
The authors report no conflicts of interest in this work.
References
1. Shochat T, Ancoli-Israel S. Chapter 153 - insomnia in older adults. In: Kryger M, Roth T, Dement WC, editors. Principles and Practice of Sleep Medicine.
2. Haimov I, Hanuka E, Horowitz Y. Chronic insomnia and cognitive functioning among older adults. Behav Sleep Med. 2008;6(1):32–54. doi:10.1080/15402000701796080
3. Riemann D, Nissen C, Palagini L, Otte A, Perlis ML, Spiegelhalder K. The neurobiology, investigation, and treatment of chronic insomnia. Lancet Neurol. 2015;14(5):547–558. doi:10.1016/S1474-4422(15)00021-6
4. Karlson CW, Gallagher MW, Olson CA, Hamilton NA. Insomnia symptoms and well-being: longitudinal follow-up. Health Psychol. 2013;32(3):311–319. doi:10.1037/a0028186
5. Suh S, Yang HC, Kim N, et al. Chronotype differences in health behaviors and health-related quality of life: a population-based study among aged and older adults. Behav Sleep Med. 2017;15(5):361–376. doi:10.1080/15402002.2016.1141768
6. Zaslavsky O, LaCroix AZ, Hale L, Tindle H, Shochat T. Longitudinal changes in insomnia status and incidence of physical, emotional, or mixed impairment in postmenopausal women participating in the Women’s Health Initiative (WHI) study. Sleep Med. 2015;16(3):364–371. doi:10.1016/j.sleep.2014.11.008
7. Bassuk SS, Wypij D, Berkman LF. Cognitive impairment and mortality in the community-dwelling elderly. Am J Epidemiol. 2000;151(7):676–688. doi:10.1093/oxfordjournals.aje.a010262
8. Ostbye T, Steenhuis R, Wolfson C, Walton R, Hill G. Predictors of five-year mortality in older Canadians: the Canadian study of health and aging. J Am Geriatr Soc. 1999;47(10):1249–1254. doi:10.1111/j.1532-5415.1999.tb05207.x
9. Diekelmann S, Born J. The memory function of sleep. Nat Rev Neurosci. 2010;11(2):114–126. doi:10.1038/nrn2762
10. Walker MP, Stickgold R. Sleep-dependent learning and memory consolidation. Neuron. 2004;44(1):121–133. doi:10.1016/j.neuron.2004.08.031
11. Cerasuolo M, Conte F, Giganti F, Ficca G. Sleep changes following intensive cognitive activity. Sleep Med. 2020;66:148–158. doi:10.1016/j.sleep.2019.08.016
12. Fogel SM, Smith CT. Learning-dependent changes in sleep spindles and stage 2 sleep. J Sleep Res. 2006;15(3):250–255. doi:10.1111/j.1365-2869.2006.00522.x
13. Huber R, Felice Ghilardi M, Massimini M, Tononi G. Local sleep and learning. Nature. 2004;430(6995):78–81. doi:10.1038/nature02663
14. Peters KR, Smith V, Smith CT. Changes in sleep architecture following motor learning depend on initial skill level. J Cogn Neurosci. 2007;19(5):817–829. doi:10.1162/jocn.2007.19.5.817
15. Peters KR, Ray L, Smith V, Smith C. Changes in the density of stage 2 sleep spindles following motor learning in young and older adults. J Sleep Res. 2008;17(1):23–33. doi:10.1111/j.1365-2869.2008.00634.x
16. Schabus M, Gruber G, Parapatics S, et al. Sleep spindles and their significance for declarative memory consolidation. Sleep. 2004;27(8):1479–1485. doi:10.1093/sleep/27.7.1479
17. Smith CT, Nixon MR, Nader RS. Posttraining increases in REM sleep intensity implicate REM sleep in memory processing and provide a biological marker of learning potential. Learn Mem. 2004;11(6):714–719. doi:10.1101/lm.74904
18. Arzilli C, Cerasuolo M, Conte F, et al. The effect of cognitive activity on sleep maintenance in a subsequent daytime nap. Behav Sleep Med. 2019;17(5):552–560. doi:10.1080/15402002.2018.1425870
19. Cerasuolo M, Conte F, Cellini N, et al. The effect of complex cognitive training on subsequent night sleep. J Sleep Res. 2020;29(6):e12929. doi:10.1111/jsr.12929
20. de Koninck J, Lorrain D, Christ G, Proulx G, Coulombe D. Intensive language learning and increases in rapid eye movement sleep: evidence of a performance factor. Int J Psychophysiol. 1989;8(1):43–47. doi:10.1016/0167-8760(89)90018-4
21. Smith C, Lapp L. Increases in number of REMS and REM density in humans following an intensive learning period. Sleep. 1991;14(4):325–330. doi:10.1093/sleep/14.4.325
22. Fogel SM, Smith CT, Cote KA. Dissociable learning-dependent changes in REM and non-REM sleep in declarative and procedural memory systems. Behav Brain Res. 2007;180(1):48–61. doi:10.1016/j.bbr.2007.02.037
23. Naylor E, Penev PD, Orbeta L, et al. Daily social and physical activity increases slow-wave sleep and daytime neuropsychological performance in the elderly. Sleep. 2000;23(1):1–9. doi:10.1093/sleep/23.1.1f
24. Conte F, Carobbi G, Errico B, Ficca G. The effects of pre-sleep learning on sleep continuity, stability, and organization in elderly individuals. Front Neurol. 2012;3. doi:10.3389/fneur.2012.00109
25. Haimov I, Shatil E. Cognitive training improves sleep quality and cognitive function among older adults with insomnia. PLoS One. 2013;8(4):e61390. doi:10.1371/journal.pone.0061390
26. Keramtinejad M, Azadi A, Taghinejad H, Khorshidi A. The effectiveness of cognitive training on improving cognitive function and sleep quality in community-dwelling elderly in Iran. Sleep Sci. 2019;12(2):88–93. doi:10.5935/1984-0063.20190065
27. Cryan JF, O’Riordan KJ, Cowan CSM, et al. The microbiota-gut-brain axis. Physiol Rev. 2019;99(4):1877–2013. doi:10.1152/physrev.00018.2018
28. Foster JA, Rinaman L, Cryan JF. Stress & the gut-brain axis: regulation by the microbiome. Neurobiol Stress. 2017;7:124–136. doi:10.1016/j.ynstr.2017.03.001
29. Forsythe P, Sudo N, Dinan T, Taylor VH, Bienenstock J. Mood and gut feelings. Brain Behav Immun. 2010;24(1):9–16. doi:10.1016/j.bbi.2009.05.058
30. Rhee SH, Pothoulakis C, Mayer EA. Principles and clinical implications of the brain-gut-enteric microbiota axis. Nat Rev Gastroenterol Hepatol. 2009;6(5):306–314. doi:10.1038/nrgastro.2009.35
31. Dinan TG, Cryan JF. The microbiome-gut-brain axis in health and disease. Gastroenterol Clin North Am. 2017;46(1):77–89. doi:10.1016/j.gtc.2016.09.007
32. Foster JA, McVey Neufeld KA. Gut-brain axis: how the microbiome influences anxiety and depression. Trends Neurosci. 2013;36(5):305–312. doi:10.1016/j.tins.2013.01.005
33. Jiang H, Ling Z, Zhang Y, et al. Altered fecal microbiota composition in patients with major depressive disorder. Brain Behav Immun. 2015;48:186–194. doi:10.1016/j.bbi.2015.03.016
34. Li Y, Hao Y, Fan F, Zhang B. The role of microbiome in insomnia, circadian disturbance and depression. Front Psychiatry. 2018;9:669. doi:10.3389/fpsyt.2018.00669
35. Hufeldt MR, Nielsen DS, Vogensen FK, Midtvedt T, Hansen AK. Variation in the gut microbiota of laboratory mice is related to both genetic and environmental factors. Comp Med. 2010;60(5):336–347.
36. Turnbaugh PJ, Ridaura VK, Faith JJ, Rey FE, Knight R, Gordon JI. The effect of diet on the human gut microbiome: a metagenomic analysis in humanized gnotobiotic mice. Sci Transl Med. 2009;1(6):6ra14–6ra14. doi:10.1126/scitranslmed.3000322
37. Cho I, Yamanishi S, Cox L, et al. Antibiotics in early life alter the murine colonic microbiome and adiposity. Nature. 2012;488(7413):621–626. doi:10.1038/nature11400
38. Yatsunenko T, Rey FE, Manary MJ, et al. Human gut microbiome viewed across age and geography. Nature. 2012;486(7402):222–227. doi:10.1038/nature11053
39. Appanna VD. What if the workings of the microbiome are fully uncovered? – a revolution in human health, wellness and beyond. In: Appanna VD, editor. Human Microbes - The Power Within: Health, Healing and Beyond. Springer; 2018:123–159. doi:10.1007/978-981-10-7684-8_4
40. An R, Wilms E, Masclee AAM, Smidt H, Zoetendal EG, Jonkers D. Age-dependent changes in GI physiology and microbiota: time to reconsider? Gut. 2018;67(12):2213–2222. doi:10.1136/gutjnl-2017-315542
41. Mariat D, Firmesse O, Levenez F, et al. The Firmicutes/Bacteroidetes ratio of the human microbiota changes with age. BMC Microbiol. 2009;9:123. doi:10.1186/1471-2180-9-123
42. Abenavoli L, Scarpellini E, Colica C, et al. Gut microbiota and obesity: a role for probiotics. Nutrients. 2019;11(11):E2690. doi:10.3390/nu11112690
43. Shen ZH, Zhu CX, Quan YS, et al. Relationship between intestinal microbiota and ulcerative colitis: mechanisms and clinical application of probiotics and fecal microbiota transplantation. World J Gastroenterol. 2018;24(1):5–14. doi:10.3748/wjg.v24.i1.5
44. Liu B, Lin W, Chen S, et al. Gut microbiota as an objective measurement for auxiliary diagnosis of insomnia disorder. Front Microbiol. 2019;10:1770. doi:10.3389/fmicb.2019.01770
45. Benedict C, Vogel H, Jonas W, et al. Gut microbiota and glucometabolic alterations in response to recurrent partial sleep deprivation in normal-weight young individuals. Mol Metab. 2016;5(12):1175–1186. doi:10.1016/j.molmet.2016.10.003
46. Zhang SL, Bai L, Goel N, et al. Human and rat gut microbiome composition is maintained following sleep restriction. Proc Natl Acad Sci USA. 2017;114(8):E1564–E1571. doi:10.1073/pnas.1620673114
47. Anderson JR, Carroll I, Azcarate-Peril MA, et al. A preliminary examination of gut microbiota, sleep, and cognitive flexibility in healthy older adults. Sleep Med. 2017;38:104–107. doi:10.1016/j.sleep.2017.07.018
48. Minter MR, Hinterleitner R, Meisel M, et al. Antibiotic-induced perturbations in microbial diversity during post-natal development alters amyloid pathology in an aged APPSWE/PS1ΔE9 murine model of Alzheimer’s disease. Sci Rep. 2017;7(1):10411. doi:10.1038/s41598-017-11047-w
49. Gareau MG, Wine E, Rodrigues DM, et al. Bacterial infection causes stress-induced memory dysfunction in mice. Gut. 2011;60(3):307–317. doi:10.1136/gut.2009.202515
50. Gareau MG. Cognitive function and the microbiome. Int Rev Neurobiol. 2016;131:227–246. doi:10.1016/bs.irn.2016.08.001
51. Meyer K, Lulla A, Debroy K, et al. Association of the gut microbiota with cognitive function in midlife. JAMA Netw Open. 2022;5(2):e2143941. doi:10.1001/jamanetworkopen.2021.43941
52. Kalmbach DA, Pillai V, Arnedt JT, Drake CL. DSM-5 insomnia and short sleep: comorbidity landscape and racial disparities. Sleep. 2016;39(12):2101–2111. doi:10.5665/sleep.6306
53. Lichstein KL, Durrence HH, Taylor DJ, Bush AJ, Riedel BW. Quantitative criteria for insomnia. Behav Res Ther. 2003;41(4):427–445. doi:10.1016/S0005-7967(02)00023-2
54. Buysse DJ, Ancoli-Israel S, Edinger JD, Lichstein KL, Morin CM. Recommendations for a standard research assessment of insomnia. Sleep. 2006;29(9):1155–1173. doi:10.1093/sleep/29.9.1155
55. Kukull WA, Larson EB, Teri L, Bowen J, McCormick W, Pfanschmidt ML. The mini-mental state examination score and the clinical diagnosis of dementia. J Clin Epidemiol. 1994;47(9):1061–1067. doi:10.1016/0895-4356(94)90122-8
56. Bastien CH, Vallières A, Morin CM. Validation of the insomnia severity index as an outcome measure for insomnia research. Sleep Med. 2001;2(4):297–307. doi:10.1016/s1389-9457(00)00065-4
57. Cho YW, Song ML, Morin CM. Validation of a Korean version of the insomnia severity index. J Clin Neurol. 2014;10(3):210–215. doi:10.3988/jcn.2014.10.3.210
58. Robbins TW, James M, Owen AM, Sahakian BJ, McInnes L, Rabbitt P. Cambridge Neuropsychological Test Automated Battery (CANTAB): a factor analytic study of a large sample of normal elderly volunteers. Dementia. 1994;5(5):266–281. doi:10.1159/000106735
59. Lenehan ME, Summers MJ, Saunders NL, Summers JJ, Vickers JC. Does the Cambridge Automated Neuropsychological Test Battery (CANTAB) distinguish between cognitive domains in healthy older adults? Assessment. 2016;23(2):163–172. doi:10.1177/1073191115581474
60. Soares FC, de Oliveira TCG, de Macedo LDED, et al. CANTAB object recognition and language tests to detect aging cognitive decline: an exploratory comparative study. Clin Interv Aging. 2015;10:37–48. doi:10.2147/CIA.S68186
61. Parada AE, Needham DM, Fuhrman JA. Every base matters: assessing small subunit rRNA primers for marine microbiomes with mock communities, time series and global field samples. Environ Microbiol. 2016;18(5):1403–1414. doi:10.1111/1462-2920.13023
62. Apprill A, McNally S, Parsons R, Weber L. Minor revision to V4 region SSU rRNA 806R gene primer greatly increases detection of SAR11 bacterioplankton. Aquat Microb Ecol. 2015;75(2):129–137. doi:10.3354/ame01753
63. Callahan BJ, McMurdie PJ, Rosen MJ, Han AW, Johnson AJA, Holmes SP. DADA2: high-resolution sample inference from Illumina amplicon data. Nat Methods. 2016;13(7):581–583. doi:10.1038/nmeth.3869
64. Glöckner FO, Yilmaz P, Quast C, et al. 25 years of serving the community with ribosomal RNA gene reference databases and tools. J Biotechnol. 2017;261:169–176. doi:10.1016/j.jbiotec.2017.06.1198
65. Paulson JN, Stine OC, Bravo HC, Pop M. Differential abundance analysis for microbial marker-gene surveys. Nat Methods. 2013;10(12):1200–1202. doi:10.1038/nmeth.2658
66. Falony G, Joossens M, Vieira-Silva S, et al. Population-level analysis of gut microbiome variation. Science. 2016;352(6285):560–564. doi:10.1126/science.aad3503
67. Landry G, Best J, Liu-Ambrose T. Measuring sleep quality in older adults: a comparison using subjective and objective methods. Front Aging Neurosci. 2015;7. doi:10.3389/fnagi.2015.00166
68. Haimov I, Breznitz N, Shiloh S. Sleep in healthy elderly: correlates of the discrepancy between self-report and recorded sleep.
69. Grosicki GJ, Riemann BL, Flatt AA, Valentino T, Lustgarten MS. Self-reported sleep quality is associated with gut microbiome composition in young, healthy individuals: a pilot study. Sleep Med. 2020;73:76–81. doi:10.1016/j.sleep.2020.04.013
70. Agrawal R, Ajami NJ, Malhotra S, et al. Habitual sleep duration and the colonic mucosa-associated gut microbiota in humans—a pilot study. Clocks Sleep. 2021;3(3):387–397. doi:10.3390/clockssleep3030025
71. Lu S, Yang Y, Xu Q, et al. Gut microbiota and targeted biomarkers analysis in patients with cognitive impairment. Front Neurol. 2022;13. doi:10.3389/fneur.2022.834403
72. Magzal F, Shochat T, Haimov I, et al. Increased physical activity improves gut microbiota composition and reduces short-chain fatty acid concentrations in older adults with insomnia. Sci Rep. 2022;12(1):2265. doi:10.1038/s41598-022-05099-w
73. Ren T, Gao Y, Qiu Y, et al. Gut microbiota altered in mild cognitive impairment compared with normal cognition in sporadic Parkinson’s disease. Front Neurol. 2020;11:137. doi:10.3389/fneur.2020.00137
74. Vacca M, Celano G, Calabrese FM, Portincasa P, Gobbetti M, De Angelis M. The controversial role of human gut lachnospiraceae. Microorganisms. 2020;8(4):573. doi:10.3390/microorganisms8040573
75. Xu C, Zhu H, Qiu P. Aging progression of human gut microbiota. BMC Microbiol. 2019;19:236. doi:10.1186/s12866-019-1616-2
76. Silva YP, Bernardi A, Frozza RL. The role of short-chain fatty acids from gut microbiota in gut-brain communication. Front Endocrinol. 2020;11. doi:10.3389/fendo.2020.00025
77. Smith RP, Easson C, Lyle SM, et al. Gut microbiome diversity is associated with sleep physiology in humans. PLoS One. 2019;14(10):e0222394. doi:10.1371/journal.pone.0222394
 © 2022 The Author(s). This work is published and licensed by Dove Medical Press Limited. The
full terms of this license are available at https://www.dovepress.com/terms
and incorporate the Creative Commons Attribution
- Non Commercial (unported, 3.0) License.
By accessing the work you hereby accept the Terms. Non-commercial uses of the work are permitted
without any further permission from Dove Medical Press Limited, provided the work is properly
attributed. For permission for commercial use of this work, please see paragraphs 4.2 and 5 of our Terms.
© 2022 The Author(s). This work is published and licensed by Dove Medical Press Limited. The
full terms of this license are available at https://www.dovepress.com/terms
and incorporate the Creative Commons Attribution
- Non Commercial (unported, 3.0) License.
By accessing the work you hereby accept the Terms. Non-commercial uses of the work are permitted
without any further permission from Dove Medical Press Limited, provided the work is properly
attributed. For permission for commercial use of this work, please see paragraphs 4.2 and 5 of our Terms.