")
Back to Journals » Therapeutics and Clinical Risk Management » Volume 11
Value of serial platelet indices measurements for the prediction of pulmonary embolism in patients with deep venous thrombosis
Authors Sevuk U, Bahadir MV, Altindag R, Baysal E, Yaylak B, Ay N, Ayaz F, Demirtas E
Received 27 May 2015
Accepted for publication 16 July 2015
Published 20 August 2015 Volume 2015:11 Pages 1243—1249
DOI https://doi.org/10.2147/TCRM.S89355
Checked for plagiarism Yes
Review by Single anonymous peer review
Peer reviewer comments 4
Editor who approved publication: Professor Garry Walsh
Utkan Sevuk,1 Mehmet Veysi Bahadir,2 Rojhat Altindag,3 Erkan Baysal,3 Baris Yaylak,3 Nurettin Ay,4 Firat Ayaz,1 Ertan Demirtas5
1Department of Cardiovascular Surgery, Diyarbakir Gazi Yasargil Education and Research Hospital, Diyarbakir, Turkey; 2Department of General Surgery, Dicle University, Diyarbakir, Turkey; 3Department of Cardiology, Diyarbakir Gazi Yasargil Education and Research Hospital, Diyarbakir, Turkey; 4Department of General Surgery, Diyarbakir Gazi Yasargil Education and Research Hospital, Diyarbakir, Turkey; 5Department of Cardiovascular Surgery, Liv Hospital, Ankara, Turkey
Background: To date, no validated biomarkers with high sensitivity and specificity have been established for diagnosis of pulmonary embolism (PE) in patients with deep venous thrombosis (DVT). There is a need to develop simple and reliable noninvasive tests that can accurately identify patients with PE, even in small hospitals or clinics. The aim of this study was to investigate the value of mean platelet volume (MPV) and platelet distribution width (PDW) for predicting occurrence of PE in patients with DVT.
Methods: Records of acute DVT patients were reviewed retrospectively. Group 1 consisted of 50 patients with acute DVT and group 2 consisted of 50 patients with acute DVT who developed PE during follow-up. The control group consisted of patients with uncomplicated primary varicose veins of the lower limbs. Venous peripheral blood samples for measurement of MPV, PDW, and platelet count were drawn on admission, before the treatment, and at the time of PE diagnosis.
Results: MPV and PDW levels at the time of PE diagnosis were higher in group 2 than group 1 (P<0.001 and P=0.026, respectively). Receiver operating characteristics analysis revealed that a 5.2% increase in admission PDW during follow-up provided 70% sensitivity and 82% specificity (area under the curve, 0.80), and a 6.6% increase in admission MPV during follow-up provided 74% sensitivity and 83% specificity (area under the curve, 0.84) for prediction of PE occurrence in patients with DVT. PDW and MPV levels at the time of PE diagnosis were found to be independent risk factors for the occurrence of PE in patients with DVT.
Conclusion: Serial measurements of MPV and PDW, and percent change in MPV and PDW appears to be a useful marker for predicting occurrence of acute PE in patients with a first episode of acute proximal DVT.
Keywords: deep venous thrombosis, pulmonary embolism, platelet indices, mean platelet volume, platelet distribution width
View a Letter to the Editor here
Introduction
Pulmonary embolism (PE) is the most severe complication of deep venous thrombosis (DVT).1 Majority of acute PE is caused by DVT of the lower extremities.2
Thorax computed tomography (CT) scans with contrast agent is regarded as the noninvasive gold standard in the detection of acute PE, but is not available in every hospital. There is, therefore, a need to develop simple and reliable noninvasive tests that can accurately identify patients with acute PE, even in small hospitals or clinics. D-Dimer testing is sensitive, but not specific for diagnosing PE.3 To date, no validated biomarkers with high sensitivity and specificity have been established for diagnosis of PE in patients with DVT.
Platelets play a major role in the pathogenesis, morbidity, and mortality in venous thromboembolism (VTE) and atherosclerosis.4,5 Platelet volume indices are simple low-cost tests, which are measured as part of the complete blood counts and are an easy way of accurately assessing platelet functions.6 Mean platelet volume (MPV) is a simple and accurate marker of platelet activation and platelet function.7,8 Platelet distribution width (PDW) measures the variability in platelet size, and is another marker of platelet activation.9
Previous studies have shown that increased MPV was associated with both arterial and venous diseases such as myocardial infarction, poor coronary collaterals, stroke, and VTE.10–13 Additionally, an elevated level of MPV was shown to be related with different kind of diseases such as infective endocarditis, rheumatoid arthritis, and gestational diabetes.14,15 Increased PDW levels have been reported in myeloproliferative disorders, diabetes mellitus, cerebral venous sinus thrombosis, and various cardiovascular diseases such as coronary artery disease.16–18
The aim of this study was to investigate the value of platelet indices including MPV and PDW for predicting the development of acute PE after a first episode of acute proximal DVT. Reference ranges for MPV, PDW, and platelet count (PC) may differ between laboratories. Therefore, we also investigated the value of percent change in admission MPV and PDW levels at the time of PE diagnosis for predicting development of acute PE in patients with a first episode of acute proximal DVT. To the best of our knowledge, this is the first study to examine the value of percent change in admission MPV and PDW for predicting occurrence of PE in patients with DVT.
Materials and methods
Study population
The study was carried out according to the principles of Declaration of Helsinki and approved by the local ethics committee. Records of acute DVT patients who were admitted to Diyarbakir Education and Research Hospital between January 2008 and December 2012 were reviewed retrospectively. Patients who had a first-time episode of acute proximal DVT (group 1) and patients with a first episode of acute proximal DVT who developed non-high risk acute PE during follow-up (group 2) were included in the study. Patients with conditions that have been considered to influence platelet indices were excluded from the study. The exclusion criteria were as follows: patients with chronic DVT, chronic PE, high risk PE, ventricular systolic dysfunction, trauma, a new previous surgical operation, atrial fibrillation, obesity, malignancy, hematological disorders, pregnancy, arterial stroke, peripheral vascular disease, infection, acute coronary syndromes, chronic renal or hepatic diseases, and diabetes mellitus.
After applying inclusion and exclusion criteria, 50 consecutive patients who had first-time episode of acute proximal DVT (group 1), and 50 consecutive patients with a first episode of acute proximal DVT who developed non-high risk acute PE during follow-up (group 2) were included in the study. The control group comprised 50 consecutive patients with uncomplicated primary varicose veins of the lower limbs.
Diagnosis of DVT was based on direct visualization of the thrombus and lack of compressibility on gray scale and identification of either a persisting filling defect or thrombus in the color column of the vessel lumen or absence of flow on Doppler ultrasonography (US). Proximal DVT was defined as thrombosis of the popliteal, femoral, deep femoral, common femoral and iliac veins, and the inferior vena cava. All testing was performed by radiologists with considerable experience in Doppler US.
Acute DVT was defined as symptoms present for 14 days or less and/or Doppler US indicating the venous thrombosis having occurred within 14 days. Acute PE was diagnosed when symptoms of PE had been present for no longer than 14 days before the diagnosis. Acute PE was confirmed by contrast-enhanced spiral CT. High risk and non-high risk acute PE groups were defined according to the European Society of Cardiology guidelines, based on systemic blood pressure on admission, the presence of right ventricular dysfunction at echocardiography, and elevated plasma troponin levels.
Obesity was defined as a body mass index (BMI) of 30 kg/m2 or higher. Hypertension (HT) was defined as systolic blood pressure >140 mmHg, diastolic blood pressure >90 mmHg, or use of an antihypertensive medication. Hyperlipidemia (HL) was defined as total serum cholesterol ≥200 mg/dL and/or low-density lipoprotein (LDL) cholesterol ≥130 mg/dL and/or history of current use of lipid-lowering regimen.
Blood sampling
Blood samples were drawn from the antecubital vein by venipuncture using a 21-gauge needle and collected in Becton Dickinson Vacutainer tubes containing 3.6 mg of K2EDTA (dipotassium ethylenediaminetetraacetic acid). In group 1, venous peripheral blood samples for measurement of MPV, PDW, and PC were drawn on admission, before the treatment, and 7 days after the initial diagnosis. In group 2, venous peripheral blood samples for measurement of MPV, PDW, and PC were drawn on admission, before the treatment, and at the time of PE diagnosis. According to our laboratory, normal values of MPV are between 6.5 and 11.6 fL, normal values of PDW are between 9 and 15 fL, and normal values of PC are between 150 and 400×103/μL. Glucose, creatinine, and lipid profiles were determined by standard methods. An automatic blood counter (Sysmex XT 2000i Hematology Analyzer; Sysmex, Kobe, Japan) was used for whole blood counts. As a hospital policy, MPV, PDW, and PC were measured within 1 hour after sampling.
Statistical analysis
Statistical analyses were performed using SPSS software version 17 for Windows (SPSS Inc., Chicago, IL, USA). All variables were investigated using visual (histograms, probability plots) and analytic methods (Kolmogorov–Smirnov test) to determine whether or not they were normally distributed. Continuous variables were reported as means and standard deviation (SD) for normally distributed variables and as medians and interquartile range (IQR) for the nonnormally distributed variables. Categorical variables were presented using numbers and percentages. The differences between groups were analyzed with the Kruskal–Wallis test for qualitative variables. Groups were compared by one-way analysis of variance (ANOVA) test for normally distributed continuous variables and by Kruskal–Wallis test for nonnormally distributed continuous variables. When a significant difference between groups was observed using one-way ANOVA test, post hoc Tukey’s honest significant differences test was used to determine the differences between the groups. When a significant difference between groups was observed using Kruskal–Wallis test, Mann–Whitney U-test was used to test the significance of pairwise differences using Bonferroni correction to adjust for multiple comparisons. Correlation coefficients and their significance were calculated using Spearman test for nonnormally distributed and/or ordinal variables and Pearson test for normally distributed variables. The logistic regression analysis test was used to identify the independent predictors of PE in DVT patients. Hosmer–Lemeshow goodness of fit statistics was used to assess model fit. The capacity of percent changes in admission MPV and PDW levels in predicting PE were analyzed using receiver operating characteristics (ROC) curve analysis. Area under the curve (AUC) were calculated as measures of accuracy of the tests. When a significant cutoff value was observed, the sensitivity, specificity, positive predictive value (PPV), and negative predictive value (NPV) were presented. A P-value <0.05 was considered significant.
Results
The study group consisted of 50 consecutive patients who had first-time episode of acute proximal DVT (group 1; n=50; 25 males, 25 females; mean age 40.6±9.0 years) and 50 consecutive patients with a first episode of acute proximal DVT who developed non-high risk acute PE during follow-up (group 2; n=50; 24 males, 26 females; mean age 39.2±12.4 years). Fifty subjects (23 females, 27 males; mean age 39.8±12.5 years) with uncomplicated primary varicose veins of the lower limbs matched for age, sex, BMI, and frequency of concomitant disease served as control group. Patient characteristics and laboratory findings for both groups at the time of admission are presented in Table 1. The mean time from the diagnosis of DVT to PE was 6.2±2.8 days. There were significant differences between the three groups with regard to white blood cell (WBC) count and PC. PC was lower in group 1 and group 2 than control group (P<0.001). WBC was higher in group 1 and group 2 than in the control group (P<0.001) (Table 1).
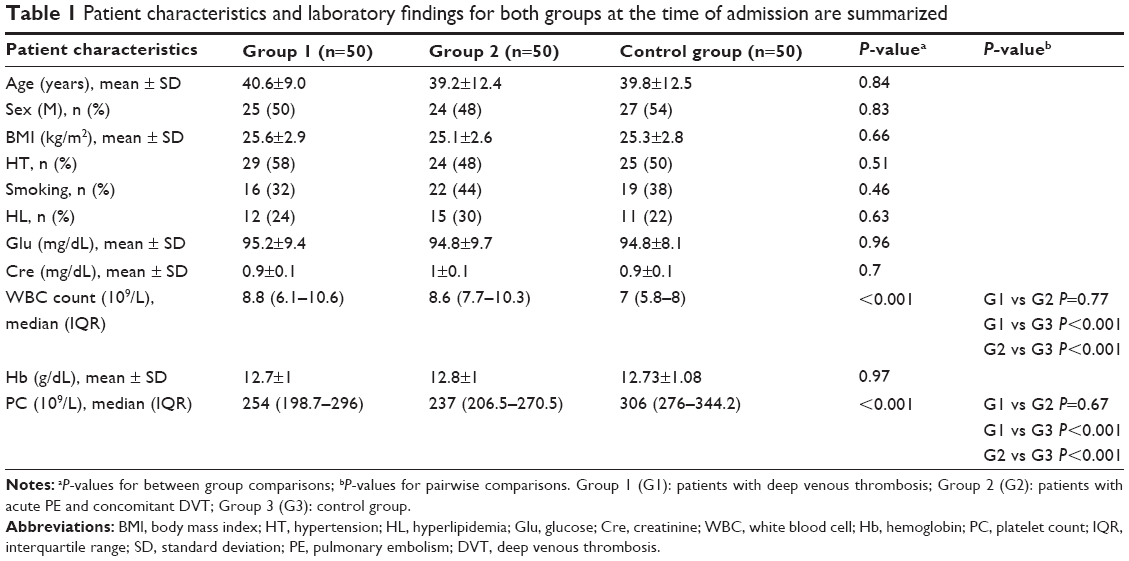 | Table 1 Patient characteristics and laboratory findings for both groups at the time of admission are summarized |
A comparison of platelet indices and percent changes in platelet indices between groups is shown in Table 2. On admission, MPV and PDW levels were significantly higher in group 1 and group 2 than in the control group (P=0.002 and P<0.001 respectively). There was no significant difference in admission MPV (P=0.86) and PDW levels (P=0.8) between group 1 and group 2. MPV (P<0.001) and PDW (P<0.001) levels at the time of PE diagnosis were significantly higher in group 2 than in group 1 and the control group. Percent change for MPV levels (Δ%MPV) and percent change for PDW levels (Δ%PDW) were significantly higher in group 2 than in group 1 and the control group (P<0.001) (Table 2). There was a strong negative correlation between PC and MPV (ρ: −0.66; P<0.001) and a weak negative correlation between PC and PDW (ρ: −0.23; P=0.004). Logistic regression analysis showed that PDW levels at the time of PE diagnosis (odds ratio [OR], 1.3; 95% confidence interval [CI] =1.008–1.7; P=0.04) and MPV levels at the time of PE diagnosis (OR, 1.4; 95% CI =1.007–1.9; P=0.04) were independent risk factors for the occurrence of PE in patients with DVT after adjustment for age, sex, smoking status, BMI, and WBC. PDW (OR, 0.88; 95% CI =1.008–1.7; P=0.43) and MPV (OR, 0.91; 95% CI =0.64–1.3; P=0.62) levels on admission were not risk factors for the occurrence of PE. ROC analysis revealed that a 5.2% increase in admission PDW during follow-up provided 70% sensitivity and 82% specificity (AUC, 0.80; 95% CI =0.71–0.89; PPV, 79.5%; NPV, 84%; P<0.001) and a 6.6% increase in admission MPV during follow-up provided 74% sensitivity and 83% specificity (AUC, 0.84; 95% CI =0.78–0.91; PPV, 92%; NPV, 86.5%; P<0.001) for prediction of development of PE in patients with DVT. The ROC curves of Δ%MPV and Δ%PDW are shown in Figures 1 and 2 respectively.
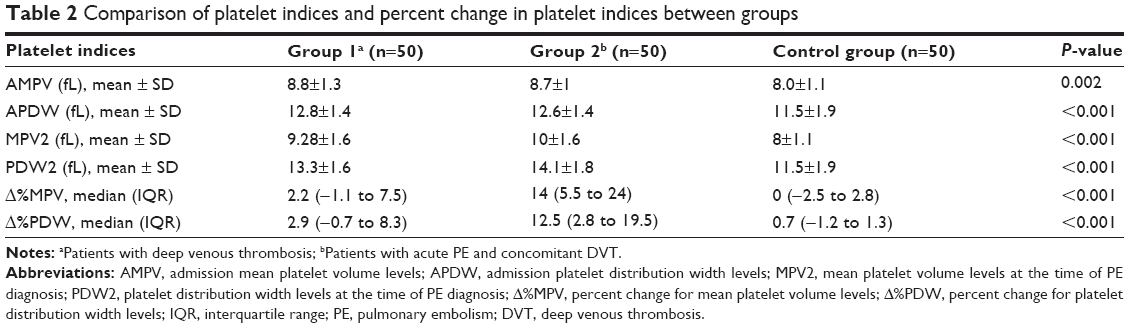 | Table 2 Comparison of platelet indices and percent change in platelet indices between groups |
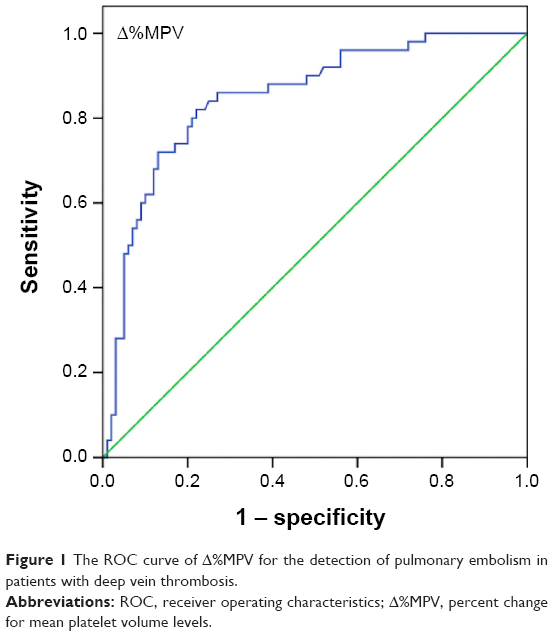 | Figure 1 The ROC curve of Δ%MPV for the detection of pulmonary embolism in patients with deep vein thrombosis. |
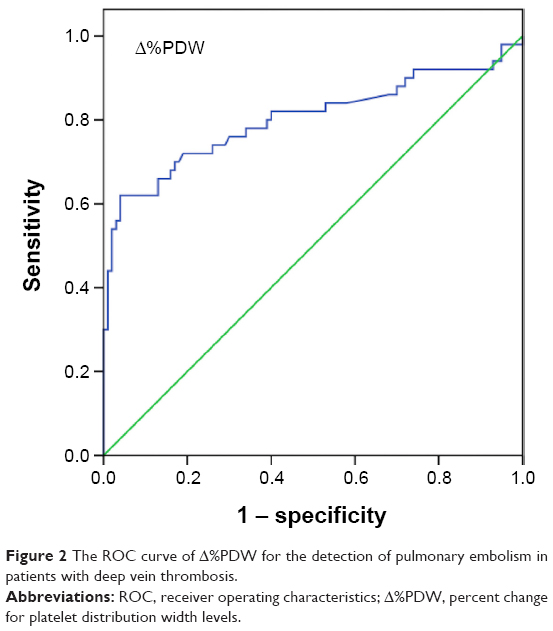 | Figure 2 The ROC curve of Δ%PDW for the detection of pulmonary embolism in patients with deep vein thrombosis. |
Discussion
We demonstrated that MPV and PDW levels at the time of PE diagnosis were significantly higher in patients with DVT and concomitant PE compared with DVT patients. We also found that MPV and PDW levels at the time of PE diagnosis were independent risk factors for the occurrence of PE in patients with DVT. Additionally, we showed that percent change in admission MPV and PDW levels were accurate markers for detecting occurrence of PE in patients with DVT.
Previous studies demonstrated increased platelet activation in patients with PE and DVT.11,12,19,20 Thrombocytes with elevated MPV are metabolically and enzymatically more active than small platelets. They aggregate more rapidly and release greater amounts of vasoactive and prothrombotic factors such as thromboxane A2, serotonin platelet factor 4, adenosine triphosphate, and growth factors. Activated platelets also express a large amount of adhesion molecules such as P-selectin glycoprotein 1b and glycoprotein IIb/IIIa.7,21 Vagdatli et al9 demonstrated that both the PDW and MPV are increased in diseases associated with platelet activation and claimed that PDW was a more specific marker of platelet activation than MPV. On the other hand, Beyan et al22 investigated the relationship between platelet indices (including PC, MPV, PDW, and plateletcrit) and platelet aggregation responses and did not find a correlation between MPV, PDW, and optical aggregation responses in healthy volunteers. In the study, large platelets were not found to have more intense activation in aggregometer. Also, based on earlier findings that platelet shape and volume are variable, even in healthy persons, they suggested that platelet indices should not be used alone as direct indicators of platelet activation.22
A potential mechanism for increased MPV and PDW levels and low PC status in PE patients is increased platelet consumption during the evolution of thrombosis. Large platelets – characterized by a higher MPV – are released from the bone marrow due to thrombopoiesis stimulated by inflammatory cytokines such as interleukin-1, tumor necrosis factor-alpha, and interleukin-6.23,24 Hypoxemia due to PE may be another possible mechanism responsible for platelet activation and PDW and MPV elevation. Braekkan et al11 performed a prospective, population-based study in 25,923 adults with no prior history of VTE and assessed effects of PC and MPV on occurrence of VTE. Participants with a higher MPV (MPV ≥9.5 fL) had a significantly higher risk of unprovoked VTE as compared with those with MPV <8.5 fL. Also, an inverse relationship between PC and MPV was found.11 Varol et al25 investigated the changes in MPV levels and PC in patients with acute PE. They have demonstrated that MPV was significantly elevated and PC was decreased in patients with PE. Kostrubiec et al20 examined whether an elevated MPV level was associated with acute PE. They could not find any relationship between elevated MPV levels and PE. On the other hand, MPV values were higher in high- and intermediate-risk groups compared with low-risk group. Additionally, MPV was shown to be related with right ventricular dysfunction and myocardial injury and was found to be an independent predictor of early death in PE.20 Because we excluded patients with ventricular dysfunction and myocardial injury, we were unable to examine the relationship between MPV, PDW, and ventricular dysfunction. Hilal et al26 investigated the relationship between MPV and the severity of acute PE. Although MPV was found to be increased in nonsurvivors, they concluded that a simple baseline determination of MPV at a single time point was not a good predictor of the severity of PE or for the diagnosis of acute PE. They also could not find any relationship between total PC and disease severity or mortality in acute PE patients.26
Data concerning PDW and PE is limited. Günay et al27 investigated the role of platelet indices and CT scores in predicting severity of PE (massive/submassive) and found that MPV and PDW levels were correlated with the pulmonary artery occlusion level assessed by CT pulmonary arterial obstruction index ratio.27
Several previous studies investigated the role of biomarkers in the context of PE. Winkler et al28 examined the value of N-terminal pro-brain natriuretic peptide (NT-proBNP) as a biomarker for acute PE diagnosis in the postoperative setting. NT-proBNP was found to be a useful biomarker for acute PE diagnosis in the postoperative setting.28 Xiao et al29 reported that plasma microRNA-134 could be an important biomarker for the diagnosis of acute PE.
The current study differs from prior studies in that it was designed to investigate the association between platelet indices and acute PE in patients with acute DVT. Second, the value of serial measurement of platelet indices and the value of percent change in platelet indices in identifying acute PE were evaluated in our study.
The present study has several limitations. The most important limitation of this study was its retrospective design. Moreover, blood samples were collected in EDTA tubes. Timing is important when measuring MPV, and optimal measuring time should be 60 minutes after venipuncture.30 The medical records of our study population did not comprise any information about the processing time. However, our institutional policy dictates that collected bloods should be processed within 1 hour after collection.
Conclusion
Serial measurements of MPV and PDW, and percent change in MPV and PDW appears to be a useful marker for predicting occurrence of acute PE in patients with a first episode of acute proximal DVT. Reference ranges for MPV and PDW may differ between laboratories. Therefore, percent change in admission MPV and PDW levels may be a more accurate marker to identify patients who develop PE after DVT compared to a single measurement of PDW and MPV levels. Further prospective studies are needed to clarify the value of MPV and PDW in identifying the presence of PE in patients with a first episode of acute proximal DVT.
Disclosure
The authors report no conflicts of interest in this work.
References
Monreal M, Ruíz J, Olazabal A, Arias A, Roca J. Deep venous thrombosis and the risk of pulmonary embolism. A systematic study. Chest. 1992;102(3):677–681. | ||
Moser KM. Venous thromboembolism. Am Rev Respir Dis. 1990;141(1):235–249. | ||
Righini M, Perrier A, De Moerloose P, Bounameaux H. D-dimer for venous thromboembolism diagnosis: 20 years later. J Thromb Haemost. 2008;6(7):1059–1071. | ||
Chirinos JA, Heresi GA, Velasquez H, et al. Elevation of endothelial microparticles, platelets, and leukocyte activation in patients with venous thromboembolism. J Am Coll Cardiol. 2005;45(9):1467–1471. | ||
Thaulow E, Erikssen J, Sandvik L, Stormorken H, Cohn PF. Blood platelet count and function are related to total and cardiovascular death in apparently healthy men. Circulation. 1991;84(2):613–617. | ||
Kamath S, Blann AD, Lip GY. Platelet activation: assessment and quantification. Eur Heart J. 2001;22(17):1561–1571. | ||
Bath PM, Butterworth RJ. Platelet size: measurement, physiology and vascular disease. Blood Coagul Fibrinolysis. 1996;7:157–161. | ||
Tsiara S, Elisaf M, Jagroop IA, Mikhailidis DP. Platelets as predictors of vascular risk: is there a practical index of platelet activity? Clin Appl Thromb Hemost. 2003;9:177–190. | ||
Vagdatli E, Gounari E, Lazaridou E, Katsibourlia E, Tsikopoulou F, Labrianou I. Platelet distribution width: a simple, practical and specific marker of activation of coagulation. Hippokratia. 2010;14(1):28–32. | ||
Chu SG, Becker RC, Berger PB, et al. Mean platelet volume as a predictor of cardiovascular risk: a systematic review and meta-analysis. J Thromb Haemost. 2010;8(1):148–156. | ||
Braekkan SK, Mathiesen EB, Njølstad I, Wilsgaard T, Størmer J, Hansen JB. Mean platelet volume is a risk factor for venous thromboembolism: the Tromso Study, Tromso, Norway. J Thromb Haemost. 2010;8:157–162. | ||
Ayhan S, Ozturk S, Erdem A, et al. Hematological parameters and coronary collateral circulation in patients with stable coronary artery disease. Exp Clin Cardiol. 2013;18(1):e12–e15. | ||
Huang J, Chen Y, Cai Z, Chen P. Diagnostic value of platelet indexes for pulmonary embolism. Am J Emerg Med. 2015;33(8):1093–1094. | ||
Yazici S, Yazici M, Erer B, et al. The platelet indices in patients with rheumatoid arthritis: mean platelet volume reflects disease activity. Platelets. 2010;21(2):122–125. | ||
Bozkurt N, Yilmaz E, Biri A, Taner Z, Himmetoglu O. The mean platelet volume in gestational diabetes. J Thromb Thrombol. 2006;22(1):51–54. | ||
Khandekar MM, Khurana AS, Deshmukh SD, Kakrani AL, Katdare AD, Inamdar AK. Platelet volume indices in patients with coronary artery disease and acute myocardial infarction: an Indian scenario. J Clin Pathol. 2006;59(2):146–149. | ||
Kamisli O, Kamisli S, Kablan Y, Gonullu S, Ozcan C. The prognostic value of an increased mean platelet volume and platelet distribution width in the early phase of cerebral venous sinus thrombosis. Clin Appl Thromb Hemost. 2013;19(1):29–32. | ||
Osselaer JC, Jamart J, Scheiff JM. Platelet distribution width for differential diagnosis of thrombocytosis. Clin Chem. 1997;43(6 Pt 1):1072–1076. | ||
Chung T, Connor D, Joseph J, et al. Platelet activation in acute pulmonary embolism. J Thromb Haemost. 2007;5(5):918–924. | ||
Kostrubiec M, Łabyk A, Pedowska-Włoszek J, et al. Mean platelet volume predicts early death in acute pulmonary embolism. Heart. 2010;96(6):460–465. | ||
Giles H, Smith RE, Martin JF. Platelet glycoprotein IIb-IIIa and size are increased in acute myocardial infarction. Eur J Clin Invest. 1994;24(1):69–72. | ||
Beyan C, Kaptan K, Ifran A. Platelet count, mean platelet volume, platelet distribution width, and plateletcrit do not correlate with optical platelet aggregation responses in healthy volunteers. J Thromb Thrombol. 2006;22(3):161–164. | ||
Nelson RB 3rd, Kehl D. Electronically determined platelet indices in thrombocytopenic patients. Cancer. 1981;48(4):954–956. | ||
Gasparyan AY, Ayvazyan L, Mikhailidis DP, Kitas GD. Mean platelet volume: a link between thrombosis and inflammation? Curr Pharm Des. 2011;17(1):47–58. | ||
Varol E, Icli A, Uysal BA, Ozaydin M. Platelet indices in patients with acute pulmonary embolism. Scand J Clin Lab Invest. 2011;71(2):163–167. | ||
Hilal E, Neslihan Y, Gazi G, Sinan T, Zeynep Ayfer A. Does the mean platelet volume have any importance in patients with acute pulmonary embolism? Wien Klin Wochenschr. 2013;125(13–14):381–385. | ||
Günay E, Sarinc Ulasli S, Kacar E, et al. Can platelet indices predict obstruction level of pulmonary vascular bed in patients with acute pulmonary embolism? Clin Respir J. 2014;8(1):33–40. | ||
Winkler BE, Schuetz W, Froeba G, Muth CM. N-terminal prohormone of brain natriuretic peptide: a useful tool for the detection of acute pulmonary artery embolism in post-surgical patients. Br J Anaesthesia. 2012;109(6):907–910. | ||
Xiao J, Jing ZC, Ellinor PT, et al. MicroRNA-134 as a potential plasma biomarker for the diagnosis of acute pulmonary embolism. J Transl Med. 2011;9:159. | ||
Dastjerdi MS, Emami T, Najafian A, Amini M. Mean platelet volume measurement, EDTA or citrate? Hematology. 2006;11(5):317–319. |
 © 2015 The Author(s). This work is published and licensed by Dove Medical Press Limited. The full terms of this license are available at https://www.dovepress.com/terms.php and incorporate the Creative Commons Attribution - Non Commercial (unported, v3.0) License.
By accessing the work you hereby accept the Terms. Non-commercial uses of the work are permitted without any further permission from Dove Medical Press Limited, provided the work is properly attributed. For permission for commercial use of this work, please see paragraphs 4.2 and 5 of our Terms.
© 2015 The Author(s). This work is published and licensed by Dove Medical Press Limited. The full terms of this license are available at https://www.dovepress.com/terms.php and incorporate the Creative Commons Attribution - Non Commercial (unported, v3.0) License.
By accessing the work you hereby accept the Terms. Non-commercial uses of the work are permitted without any further permission from Dove Medical Press Limited, provided the work is properly attributed. For permission for commercial use of this work, please see paragraphs 4.2 and 5 of our Terms.