
Back to Journals » Clinical Interventions in Aging » Volume 20
Value of Conventional Ultrasound Combined with Shear Wave Elastography for Sarcopenia in Patients with Cardiovascular Disease
Authors Shou J, Ouyang C, Lin J, Huang J, Yang H, He Y 
Received 11 July 2025
Accepted for publication 2 December 2025
Published 19 December 2025 Volume 2025:20 Pages 2627—2639
DOI https://doi.org/10.2147/CIA.S553232
Checked for plagiarism Yes
Review by Single anonymous peer review
Peer reviewer comments 2
Editor who approved publication: Dr Maddalena Illario
Jiali Shou,1,* Chenghu Ouyang,2,* Jiaying Lin,1 Jianmei Huang,1 Huihui Yang,1 Yu He1
1Department of Ultrasound Medicine, Guangdong Provincial Key Laboratory of Major Obstetric Diseases, Guangdong Provincial Clinical Research Center for Obstetrics and Gynecology, The Third Affiliated Hospital, Guangzhou Medical University, Guangzhou, People’s Republic of China; 2Department of Nuclear Medicine, Guangdong Provincial Key Laboratory of Major Obstetric Diseases, Guangdong Provincial Clinical Research Center for Obstetrics and Gynecology, The Third Affiliated Hospital, Guangzhou Medical University, Guangzhou, People’s Republic of China
*These authors contributed equally to this work
Correspondence: Yu He; Huihui Yang, Email [email protected]; [email protected]
Purpose: To investigate the value of conventional ultrasound combined with shear wave elastography (SWE) for sarcopenia in patients with cardiovascular disease (CVD).
Methods: 114 CVD patients were enrolled in this study, where CVD was defined as physician-diagnosed heart disease and/or stroke. Appendicular skeletal muscle mass index (ASMI), calf circumference, grip strength, and 6-m walking speed were measured. Patients were categorized into non-sarcopenia (n=78) and sarcopenia (n=36) groups. Conventional ultrasound and SWE features were measured in relaxed and passive stretched states, and the presence of flaky myosteatosis echo (FE) in rectus femoris (RF) was evaluated. The differences in clinical indicators, conventional ultrasound and SWE features between the two group were analyzed. The Spearman correlation analysis was used to assess the relationship between clinical indicators and conventional ultrasound/SWE features. Independent predictors of sarcopenia were subsequently, and a combined diagnostic model was established by binary logistic regression analysis based on these predictors.
Results: The sarcopenia group exhibited significantly lower subcutaneous adipose tissue thickness (T/SATrelaxed), thickness (T/RFrelaxed, T/RFstretched), cross-sectional area (CSA/RFrelaxed, CSA/RFstretched, ΔCSA) of RF, and the thickness of RF and vastus intermedius [T/(RF+VI)relaxed,T/(RF+VI)stretched], but significantly higher presence of FE/RF compared to the non-sarcopenia group. In terms of SWE features, patients with sarcopenia exhibited significantly lower shear wave velocities (SWV) in the RF (SWV/RFrelaxed, SWV/RFstretched) and VI (SWV/VIrelaxed, SWV/VIstretched), as well as the difference in SWV between the two states (ΔSWV/RF, ΔSWV/VI). Finally, the prediction model for sarcopenia in patients with CVD incorporating T/SATrelaxed, T/RFstretched, ΔSWV/RF, and SWV/VIstretched was established, with a sensitivity of 83.3%, specificity of 89.7% and cutoff value of 0.381.
Conclusion: Conventional ultrasound combined with SWE provides a novel and quantitative approach for visualizing alterations in muscle mass and stiffness, facilitating early identification of sarcopenia in CVD patients and offering reliable imaging evidence for clinical intervention.
Keywords: sarcopenia, ultrasound, shear wave elastography, cardiovascular disease
Introduction
Sarcopenia is a geriatric syndrome characterized by age-related loss of muscle mass, plus decline in muscle strength and/or reduced physical performance, recognized as a public health challenge in aging societies.1,2 It has an insidious onset, accompanied by multiple adverse outcomes, primarily including increased risk of falls, disability, reduced quality of life, and high mortality rates.3 Furthermore, sarcopenia increases the risk of developing from chronic diseases, such as chronic kidney disease, type 2 diabetes, and cardiovascular diseases (CVD).4–6 These consequences severely compromise the health and well-being of older adults, imposing significant socioeconomic burdens on individuals, communities, and healthcare systems.
The progression of CVD is strongly associated with aging, and CVD remains a leading cause of mortality in elderly patients.7,8 Studies have shown that the prevalence of sarcopenia is significantly higher in patients with CVD compared to healthy populations.9 Meanwhile, a 3.6-year follow-up study further revealed that patients with sarcopenia have a 33% increased risk of developing new-onset CVD compared to non-sarcopenic peers.10 This bidirectional relationship accelerates disease progression and worsens prognosis. Potential mechanisms underlying this association include increased skeletal muscle catabolic stress in CVD patients, leading to exercise intolerance, impaired ventilatory efficiency, and insulin resistance.11 Additionally, malnutrition driven by elevated proinflammatory cytokines in CVD patients may further contribute to sarcopenia.12 Consequently, early identification and intervention for sarcopenia are critical to improving clinical management and prognosis in CVD populations.
Loss of muscle mass is a critical diagnostic criterion for sarcopenia. According to the Asian Working Group for Sarcopenia (AWGS) 2019 consensus, muscle mass can be assessed using dual-energy X-ray absorptiometry (DXA), bioelectrical impedance analysis (BIA), and ultrasound.2 In Asia, DXA and BIA are the most commonly utilized modalities. However, BIA tends to overestimate muscle mass and is highly susceptible to individual body water content.13 Ultrasound has emerged as a research focus for muscle mass evaluation due to its non-invasive nature, real-time capabilities, and cost-effectiveness. Ultrasound quantifies structural alterations through parameters such as muscle thickness, cross-sectional area (CSA), and echogenicity.14 Shear wave elastography (SWE), a novel ultrasound-based technique enabling quantitative assessment of tissue elasticity, has been widely applied in clinical diagnosis and research across thyroid,15 breast,16 and liver diseases.17,18 Although early-stage muscle mass changes are often subtle and indistinguishable by conventional ultrasound, SWE enhances detection sensitivity by evaluating tissue stiffness and biomechanical properties through shear wave velocity (SWV) measurements.19
Recent studies have explored the value of SWE in skeletal muscle evaluation and sarcopenia assessment. The technique has been applied to detect secondary sarcopenia in patients with chronic obstructive pulmonary disease20 and Parkinson’s disease,21 and has also demonstrated diagnostic utility in type 2 diabetes,5 with SWE parameters consistently correlating with muscle mass and function indicators. However, no research has yet investigated SWE for sarcopenia in patients with CVD, a population with high sarcopenia prevalence.
Therefore, the aim of this study was to explore the value of conventional ultrasound combined with SWE for sarcopenia in patients with CVD by quantifying muscle mass and stiffness. This work addressed a critical gap in the management of CVD patients by evaluating a practical, imaging-based strategy for early identification of sarcopenia, which could enable timely intervention to improve outcomes.
Material and Methods
Study Participants
This study was conducted in accordance with the Declaration of Helsinki. A total of 150 patients with stable cardiovascular disease (CVD) were recruited for this prospective observational study between June 2024 and January 2025. CVD was defined as physician-diagnosed heart disease, including angina pectoris, myocardial infarction, congestive heart failure, and other cardiac disorders, and/or stroke.9,10 The study was approved by the Research Ethics Committee of the Third Affiliated Hospital of Guangzhou Medical University. Based on the following inclusion criteria, 114 patients were selected: (a) signed informed consent; (b) body mass index (BMI) 18.0–28.0 kg/m2; (c) able to cooperate and complete corresponding examinations. 36 patients were excluded according to the following exclusion criteria: (a) severe renal insufficiency or cancer; (b) severe lower limb trauma or surgery; (c) neuromuscular diseases with mobility impairment; (d) long-term use of estrogen, glucocorticoids, and other drugs that may affect skeletal muscle. Based on the Asian Working Group for Sarcopenia (AWGS) 2019 consensus criteria,2 the CVD patients were divided into non-sarcopenia (n=78) and sarcopenia (n=36) groups (Figure 1).
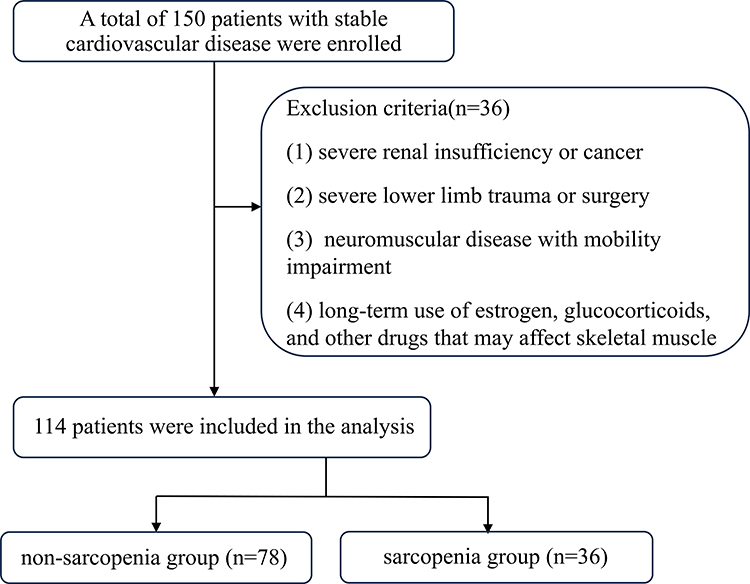 |
Figure 1 The flowchart of study participants selection. |
Assessment of Sarcopenia Status
Calf Circumference
Calf circumference was measured with patients seated in a chair, feet shoulder-width apart, and legs fully exposed. A tape measure was horizontally wrapped around the maximal circumference of each calf. Measurements were performed bilaterally, and the smaller value was recorded for analysis.
Muscle Strength: Handgrip Strength
Handgrip strength was assessed using a CAMRY electronic grip strength meter (EH101, Guangdong, China). Subjects were seated with the forearm and upper arm positioned at a 90° angle. The test was administered twice with a 1-minute interval between measurements, and the higher value was selected as the final result.
Physical Performance: 6-m Walking Speed
Walking speed was evaluated by having subjects walk 6 m at their habitual pace. Timing was initiated when the first foot lifted off the ground and stopped when the first foot completely crossed the finish line. The test was repeated twice, and the faster result was recorded for analysis.
Skeletal Muscle Mass
Dual-energy X-ray absorptiometry (DXA, GE Healthcare, New York, USA) was utilized to analyze total body muscle mass. Measurements including extremity muscle mass, subcutaneous fat volume (SFV), visceral fat volume (VFV), waist-to-hip ratio (WHR), and bone mineral density (BMD) were obtained. The appendicular skeletal muscle index (ASMI) was calculated as extremity muscle mass (kg) divided by height squared (m2). Finally, low muscle mass was defined as the ASMI values of <5.4 kg/m2 in women and <7.0 kg/m2 in men.
Strength, Assistance in Walking, Rise from a Chair, Climb Stairs, Calf Circumference (SARC-Calf)
The SARC-Calf questionnaire was utilized to assess six parameters: strength, walking ability, rising from a chair, stair climbing, falls, and calf circumference. The first five items were scored from 1 to 2 points each, while the final item was scored as 0 or 10 points. A total score of ≥11 points was considered possible sarcopenia.
Nutritional Status Assessment
Nutritional status was evaluated using mini nutritional assessment short-form (MNA-SF) comprising six domains: food intake decline, weight loss, mobility, acute illness/psychological stress, neuropsychological problems, and BMI. The total score ranged from 0 to 14, with scores interpreted as follows: 12–14 (normal), 8–11 (risk of malnutrition), and 0–7 (malnutrition).
Conventional Ultrasound and Shear Wave Elastography (SWE) Measurements
All conventional ultrasound and SWE assessments were performed by a sonographer with extensive experience in musculoskeletal imaging. All examinations were conducted using a Resona 8 ultrasound system (Mindray, Shenzhen, China) equipped with SWE technology and a linear array transducer (5–14 MHz frequency).
The rectus femoris (RF) and vastus intermedius (VI) muscles of the anterior thigh were selected for ultrasound assessment. This selection was based on their anatomical suitability for ultrasonography, being large and superficial enough to allow clear visualization and reproducible measurements in both relaxed and stretched states. Furthermore, these muscles have been established in the literature as reliable surrogates for systemic skeletal muscle mass assessment, with strong correlations between their ultrasound parameters and skeletal muscle mass.20,22,23
Prior to examination, patients were provided with standardized education regarding the procedural protocol and were instructed to maintain full relaxation throughout the assessment. Standardized conventional ultrasound and SWE measurements of the rectus femoris (RF) and vastus intermedius (VI) muscles were performed under two distinct postural conditions: (a) Relaxed state: patients were positioned supine with lower limbs fully extended in a natural resting position. The transducer is placed in the middle and lower third of the distance between the anterior superior spine of the iliac and the lower margin of the patella. The measurement level was marked with a skin marker by the operator during the initial examination to ensure consistent transducer placement. (b) Passive stretched state: patients remained supine with knees flexed at 90°. The measurement site selection criteria and marking methodology remained identical to those described for the straight state.
The transducer was positioned perpendicular to the longitudinal axis of the RF muscle. Muscle thickness and cross-sectional area (CSA) were measured in both relaxed and passive stretched states, and the differences in thickness and CSA between the two states were calculated (Figure 2A and B). The subcutaneous adipose tissue (SAT) thickness was measured and the presence of flaky myosteatosis echo (FE) within the RF was evaluated in the relaxed state. The FE was defined as the presence of flaky hyperechoic areas or the hyperechoic coverage of the entire muscle24 (Figure 2C and D). The region of interest (ROI) was standardized to a diameter of 6 mm and a depth of 4 cm. Vascular, tendinous, or fascial structures were strictly excluded from the ROI. Shear wave velocities (SWV, m/s) of the RF and VI muscles were automatically recorded in both states, and the SWV differences between the two conditions were computed. All measurements were performed in triplicate, and the mean values were utilized for subsequent statistical analysis.
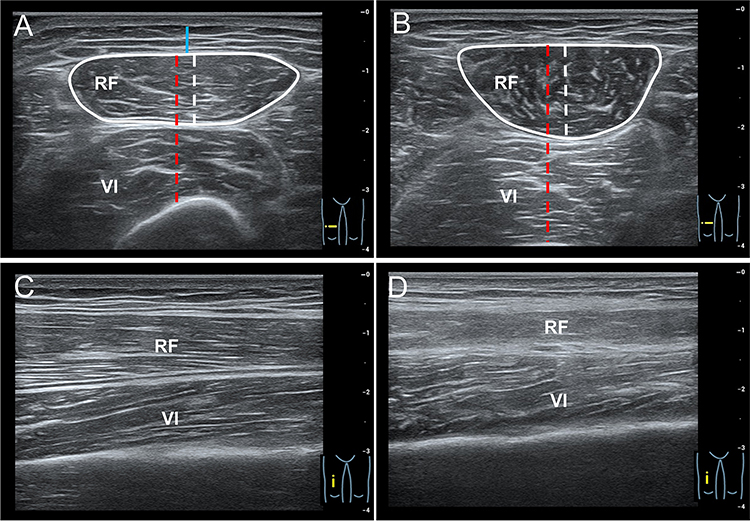 |
Figure 2 The measurement diagram of conventional ultrasonic parameters. (A) Measurement of SAT thickness (blue line), RF thickness (white line) and RF+VI thickness (red line) and CSA of RF in the relaxed state. (B) Measurement of RF thickness (white line), RF+VI thickness (red line) and CSA of RF in the passive stretched state. (C) The normal echo of RF in a 54-year-old man. (D) The flaky myosteatosis echo of RF in a 68-year-old man. Abbreviations: RF, rectus femoris; VI, vastus intermedius; CSA, cross-sectional area; SAT, subcutaneous adipose tissue. |
Statistical Analysis
Statistical analyses were performed using SPSS 26.0 (IBM SPSS Inc., Chicago, USA). Normality of continuous variables was assessed by the Shapiro–Wilk test. Normally distributed data were expressed as means ± standard deviation (SD), and were analyzed using an independent t-test. Skewed distribution data were expressed as median (25th–75th percentile), and were analyzed using the Wilcoxon rank-sum test. Categorical variables were presented as numbers (percentages), and were analyzed using the chi-square test or Fisher’s exact test, as appropriate. Spearman correlation analysis was utilized to evaluate associations between ultrasonographic parameters and clinical indicators. The intraclass correlation coefficient (ICC) was used to evaluate the intra-observer reliability of the ultrasound parameter measurements. To explore the diagnostic efficacy of combined ultrasound markers for sarcopenia in CVD, a binary logistic regression model was established. The diagnostic performance of the model was assessed by receiver operating characteristic (ROC) curve analysis, with results expressed as the area under the ROC curve (AUC). The best cutoff value was used the Youden index, and was calculated as maximum (sensitivity + specificity) − 1. P <0.05 was considered statistically significant.
Results
Patient Characteristics
Compared to the non-sarcopenia group, the sarcopenia group exhibited significantly older age (68.00 ± 9.05 years vs 63.85 ± 6.98 years, P = 0.008), but significantly lower body weight (55.28 ± 8.27 kg vs 62.60 ± 7.50 kg, P < 0.001) and BMI [20.85 (19.95–22.30) kg/m2 vs 24.85 (23.60–26.70) kg/m2, P < 0.001]. The non-sarcopenia group was predominantly female (67.95%), whereas the sarcopenia group had a male predominance (55.56%). The sarcopenia group demonstrated significantly lower calf circumference (32.03 ± 2.50 cm vs 35.36 ± 2.28 cm, P < 0.001), 6-meter walking speed (0.89 ± 0.21 m/s vs 1.00 ± 0.19 m/s, P = 0.007), ASMI [5.84 (5.25–6.67) kg/m2 vs 6.88 (6.20–7.48) kg/m2, P < 0.001], and SAV [699.00 (497.00–855.00) cm3 vs 1012.50 (810.00–1279.00) cm3, P < 0.001] compared to the non-sarcopenia group. Additionally, the sarcopenia group showed significantly lower SARC-CalF scores and poorer nutritional status (P < 0.001). No significant differences were observed between the two groups in height, smoking, drinking, handgrip strength, VAV, WHR, or BMD (P > 0.05 for all) (Tables 1 and 2).
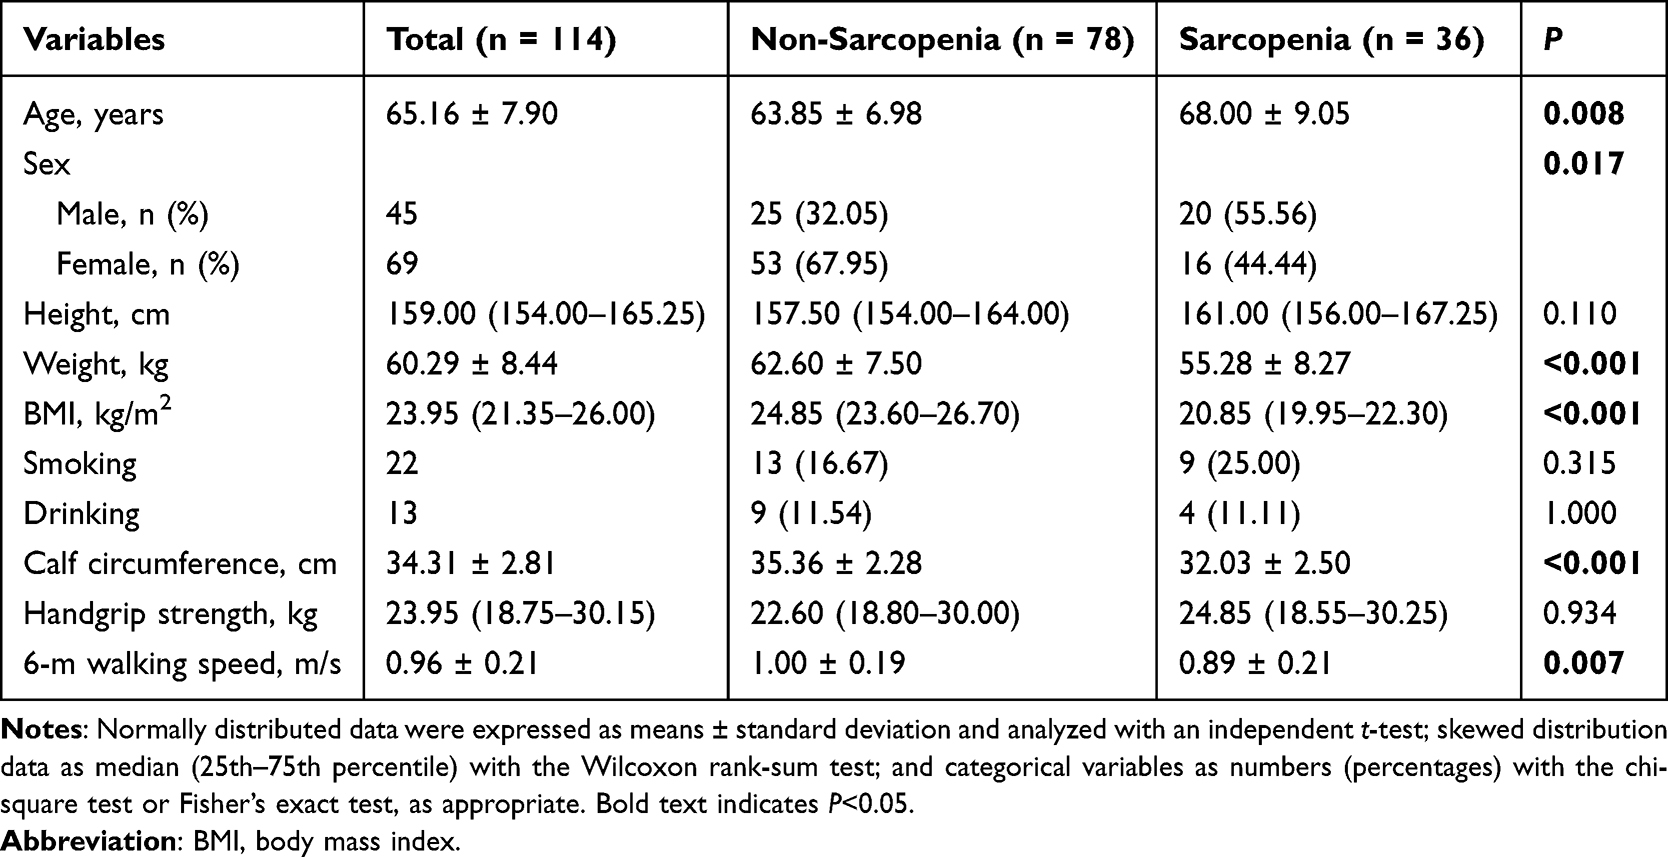 |
Table 1 Basic Clinical Characteristics of the Study Population |
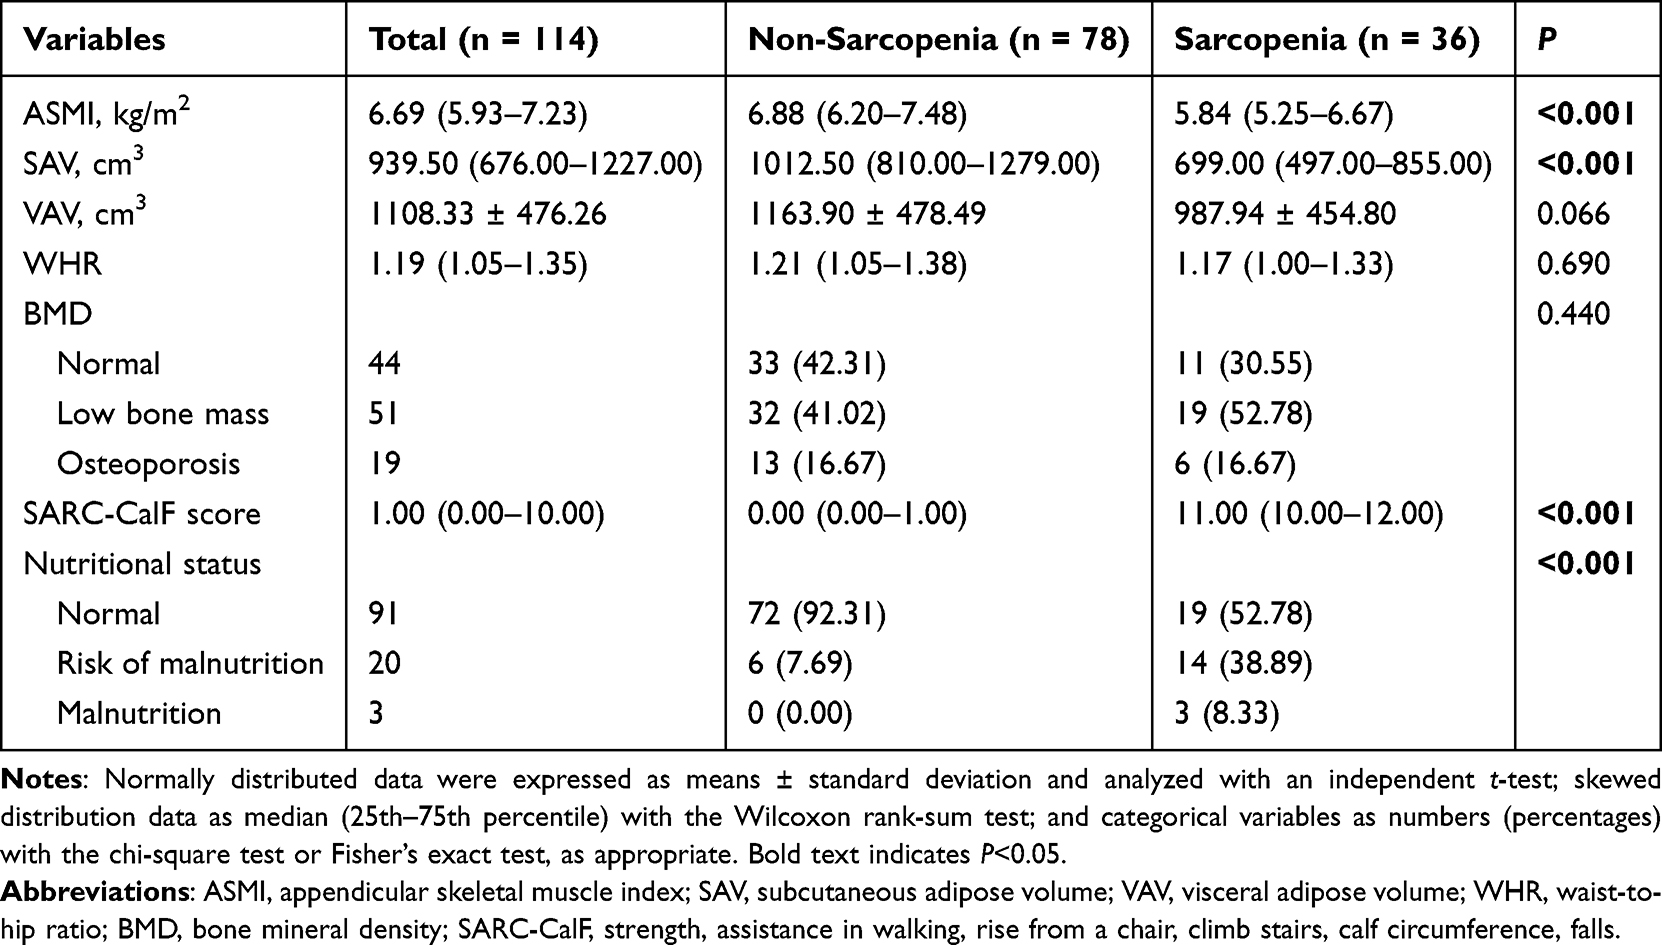 |
Table 2 Clinical and Functional Indicators of the Study Population |
Ultrasound and SWE Characteristics of Patients
The intra-observer reliability analysis showed high consistency for all ultrasound parameters (Supplementary Table 1). In terms of the conventional ultrasound parameters, compared to the non-sarcopenia group, the sarcopenia group exhibited significantly lower T/SATrelaxed, T/RFrelaxed, T/RFstretched, CSA/RFrelaxed, CSA/RFstretched, ΔCSA, T/(RF+VI)relaxed, and T/(RF+VI)stretched (P < 0.001 for all), but significantly higher presence of FE/RF (P = 0.019). In terms of the SWE parameters, patients with sarcopenia exhibited significantly lower SWV/RFrelaxed (1.78 ± 0.15 m/s vs 1.94 ± 0.24 m/s, P < 0.001), SWV/RFstretched [2.95 (2.86–3.17) m/s vs 3.48 (3.37–3.64) m/s, P < 0.001], ΔSWV/RF [1.20 (1.08–1.39) m/s vs 1.55 (1.34–1.69) m/s, P < 0.001], SWV/VIrelaxed [2.13 (1.94–2.20) m/s vs 2.27 (2.17–2.43) m/s, P < 0.001], SWV/VIstretched [3.23 (2.99–3.42) m/s vs 3.64 (3.53–3.73) m/s, P < 0.001], and ΔSWV/VI [1.03 (0.91–1.29) m/s vs 1.31 (1.16–1.43) m/s, P < 0.001] compared to patients without sarcopenia (Table 3 and Figure 3).
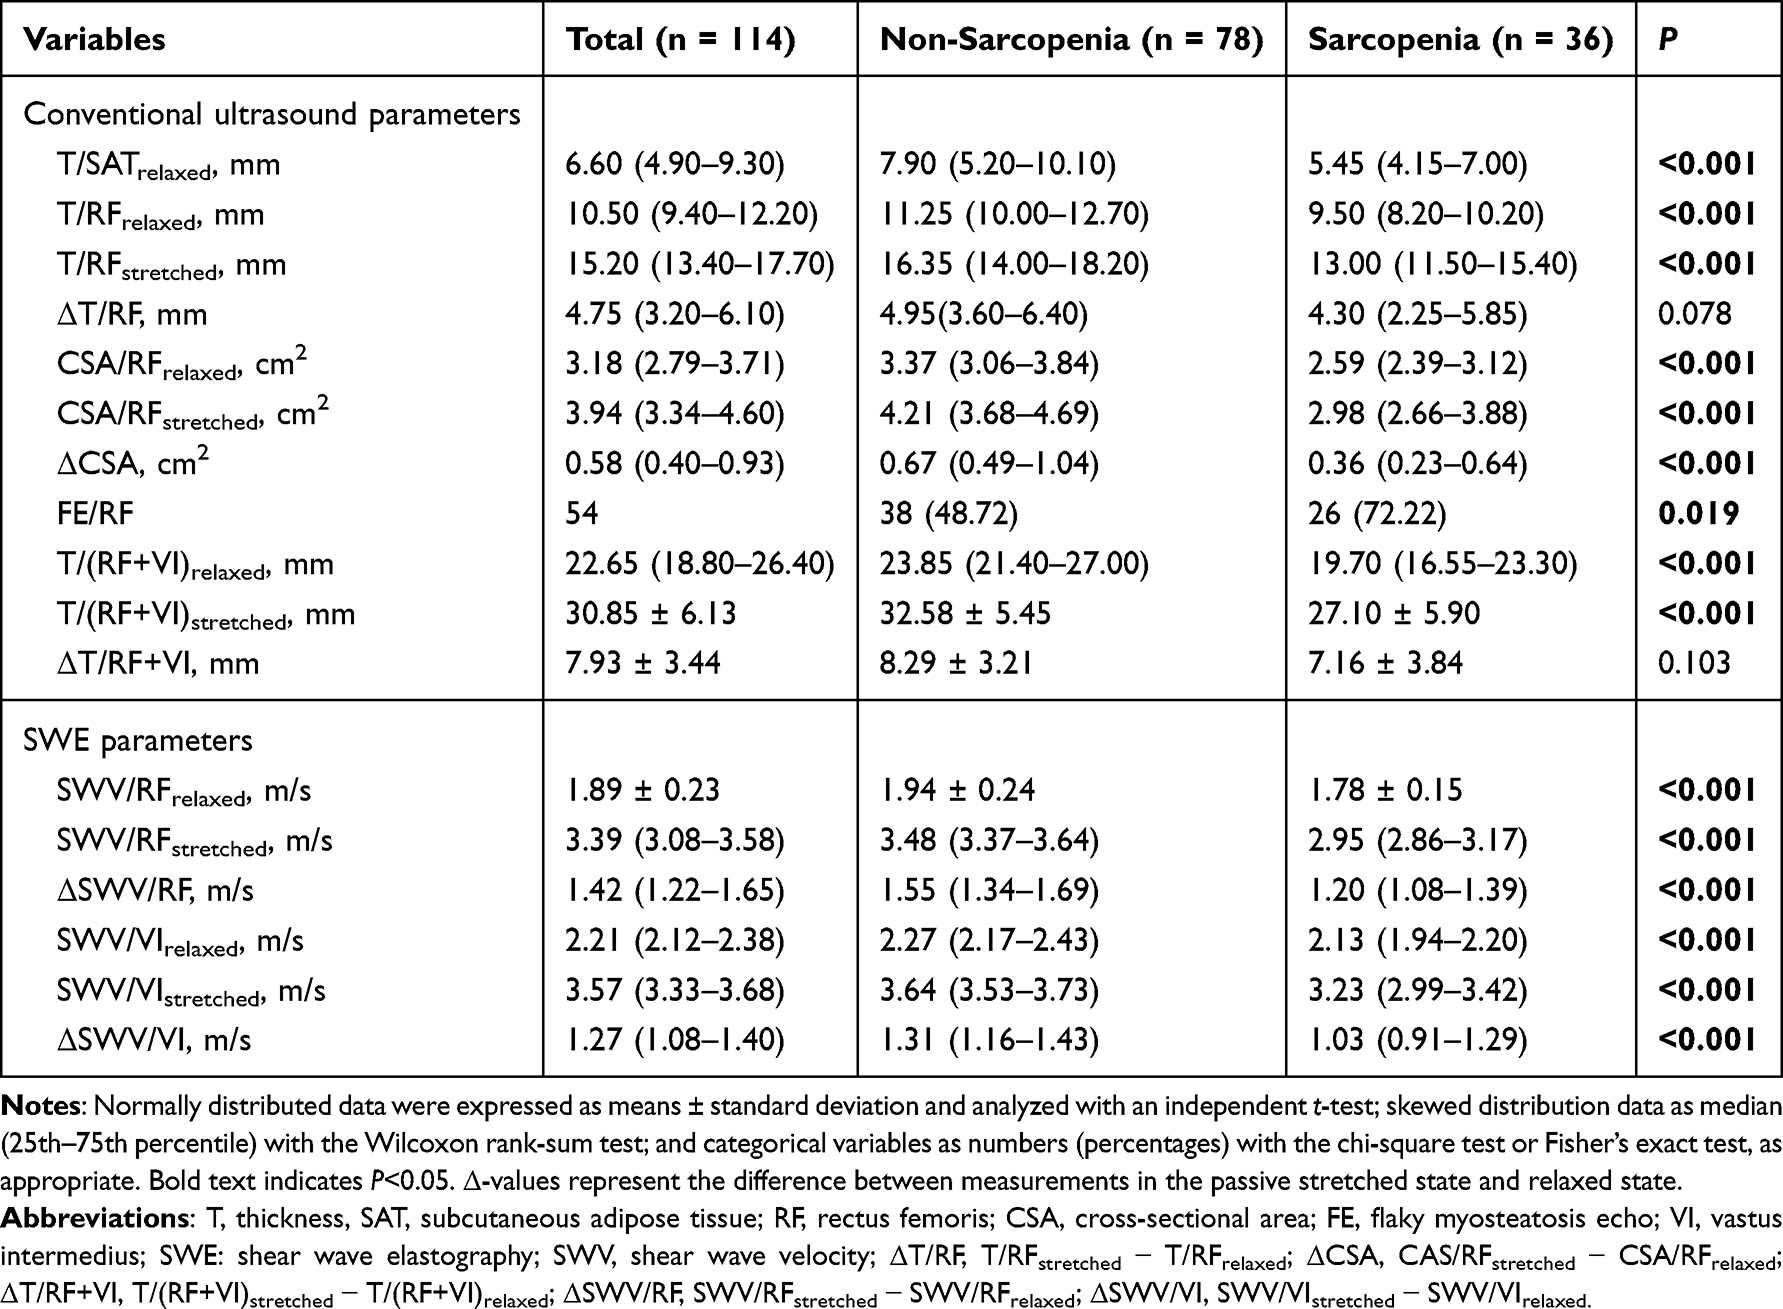 |
Table 3 Comparison of Ultrasound Features Between Non-Sarcopenia and Sarcopenia Patients |
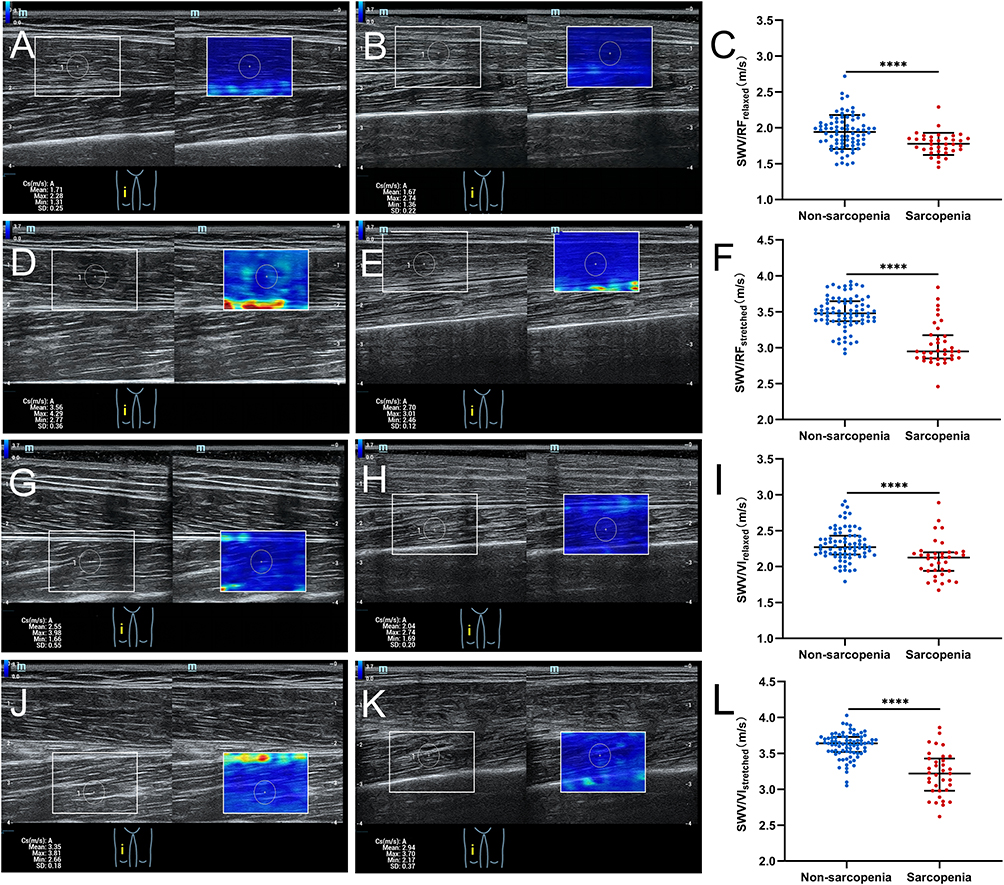 |
Figure 3 SWV of the RF and VI under different states in patients with CVD. (A and B) Representative SWV images of the RF in the relaxed state for patients without/with sarcopenia. (C) Difference in SWV/RFrelaxed between the non-sarcopenia and sarcopenia groups. Error bar, means ± standard deviation. (D and E) Representative SWV images of the RF in the stretched state for patients without/with sarcopenia. (F) Difference in SWV/RFstretched between the non-sarcopenia and sarcopenia groups. Error bar, median with interguartile range. (G and H) Representative SWV images of the VI in the relaxed state for patients without/with sarcopenia. (I) Difference in SWV/VIrelaxed between the non-sarcopenia and sarcopenia groups. Error bar, median with interguartile range. (J and K) Representative SWV images of the VI in the stretched state for patients without/with sarcopenia. (L) Difference in SWV/VIstretched between the non-sarcopenia and sarcopenia groups. Error bar, median with interguartile range. (A, D, G, J) Representative SWV images of patients with non-sarcopenia; (B, E, H, K) Representative SWV images of patients with sarcopenia. ****P < 0.001. White rectangular boxes: the sampling frames for SWV measurement; White circles: the ROI for SWV measurement. Abbreviations: SWV, shear wave velocity; RF, rectus femoris; VI, vastus intermedius; CVD, cardiovascular disease; ROI, region of interest. |
Correlation Between Clinical Measurements and Ultrasound Features
The Spearman correlation matrix analysis revealed that FE/RF was significantly and negatively correlated with calf circumference (r = −0.41, P < 0.01), handgrip strength (r = −0.43, P < 0.01), 6-m walking speed (r = −0.31, P < 0.01), and ASMI (r = −0.48, P < 0.01). T/SATrelaxed was significantly and negatively correlated with handgrip strength (r = −0.58, P < 0.01) and ASMI (r = −0.26, P < 0.01). SWV/RFrelaxed was significantly and negatively correlated with handgrip strength (r = −0.20, P < 0.05). In contrast, the remaining conventional ultrasound and SWE parameters were positively correlated with calf circumference, handgrip strength, 6-m walking speed, and ASMI (Table 4).
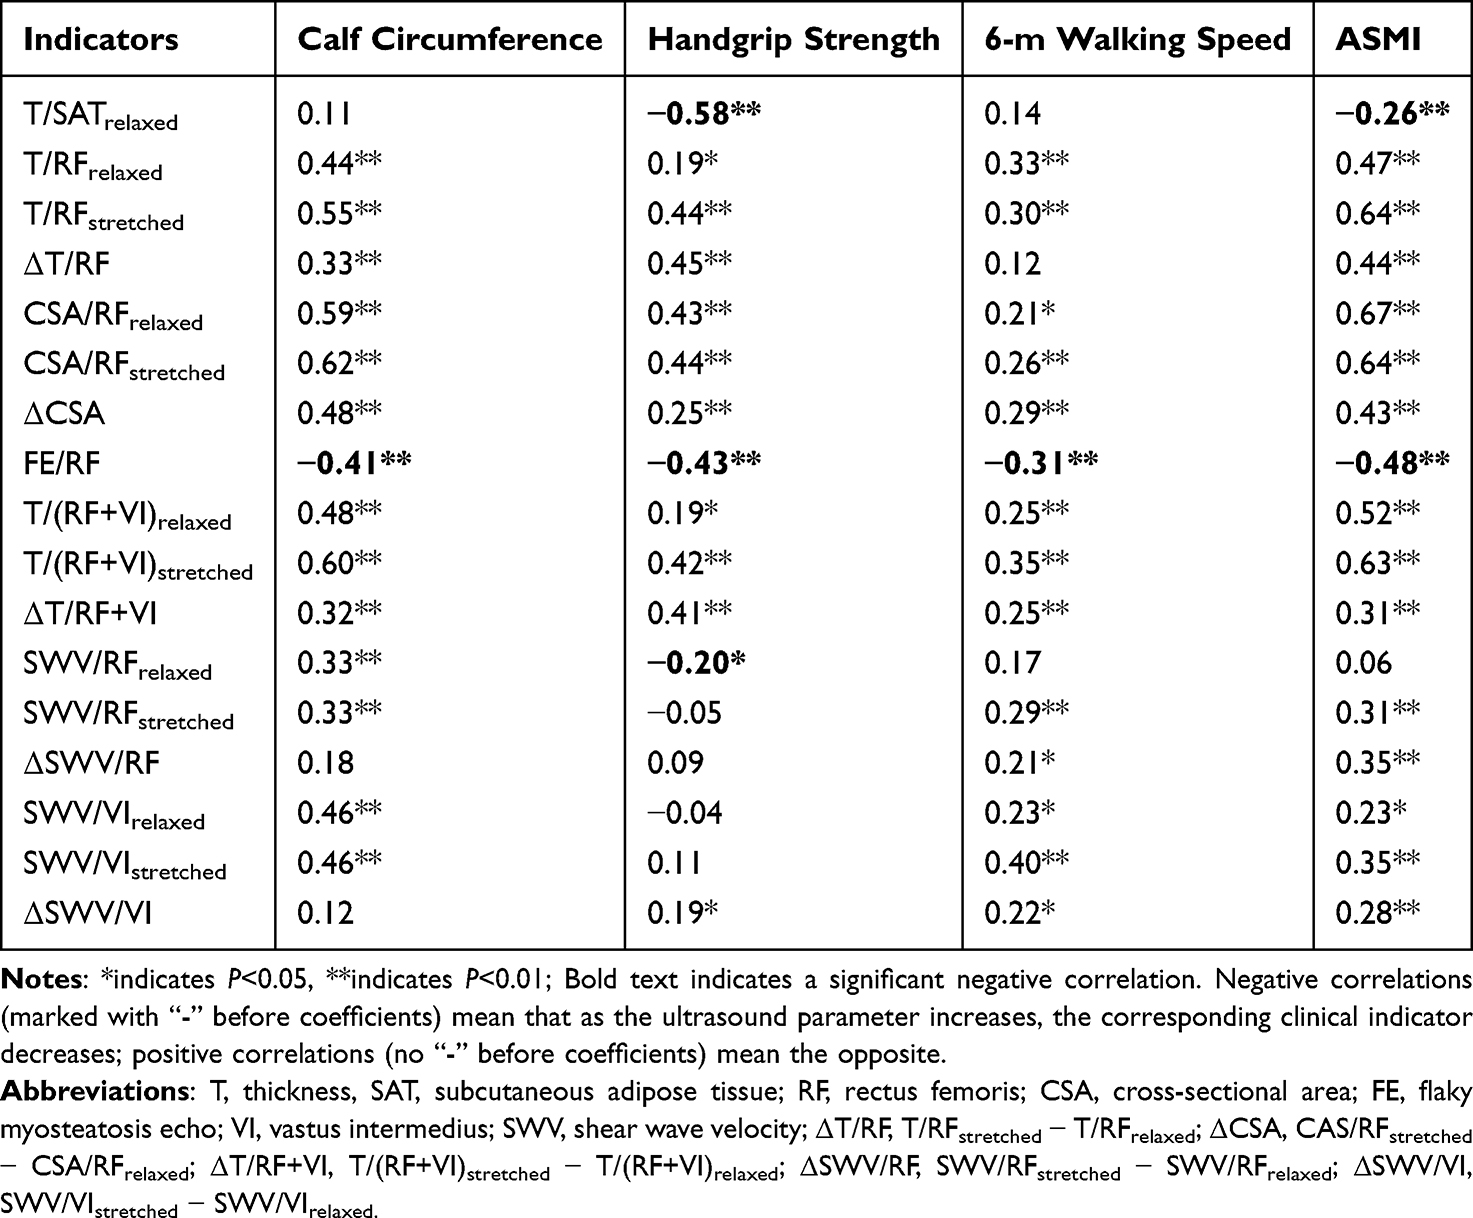 |
Table 4 Correlation Between Clinical Measurements and Ultrasound Features |
Effectiveness of Ultrasound and SWE Screening for Sarcopenia in Patients with CVD
Based on the Spearman correlation matrix results (Supplementary Table 2), variables with a collinearity threshold of |r| ≥ 0.6 were excluded. Patient baseline clinical characteristics (age, weight) and ultrasound parameters (T/SATrelaxed, T/RFstretched, ΔCSA, FE/RF, ΔSWV/RF, SWV/VIstretched, and ΔSWV/VI) were included in the binary logistic regression analysis. The final model identified the following independent predictors of sarcopenia in patients with CVD: T/SATrelaxed, T/RFstretched, ΔSWV/RF, and SWV/VIstretched (Table 5). ROC curve analysis was employed to evaluate the diagnostic performance of T/SATrelaxed, T/RFstretched, ΔSWV/RF, SWV/VIstretched and the combined prediction model for sarcopenia. As illustrated in Figure 4, the AUC values for T/SATrelaxed, T/RFstretched, ΔSWV/RF, SWV/VIstretched, and the prediction model were 0.710, 0.764, 0.778, 0.870, and 0.921, respectively. The prediction model demonstrated a sensitivity of 83.3%, specificity of 89.7% and cutoff value of 0.381 for diagnosing sarcopenia. Sarcopenia was diagnosed only by T/SATrelaxed, or T/RFstretched, or ΔSWV/RF, or SWV/VIstretched. The cutoff value of T/SATrelaxed was 7.45 mm, T/RFstretched was 12.70 mm, ΔSWV/RF was 1.37 m/s, and SWV/VIstretched was 3.48 m/s (Figure 4).
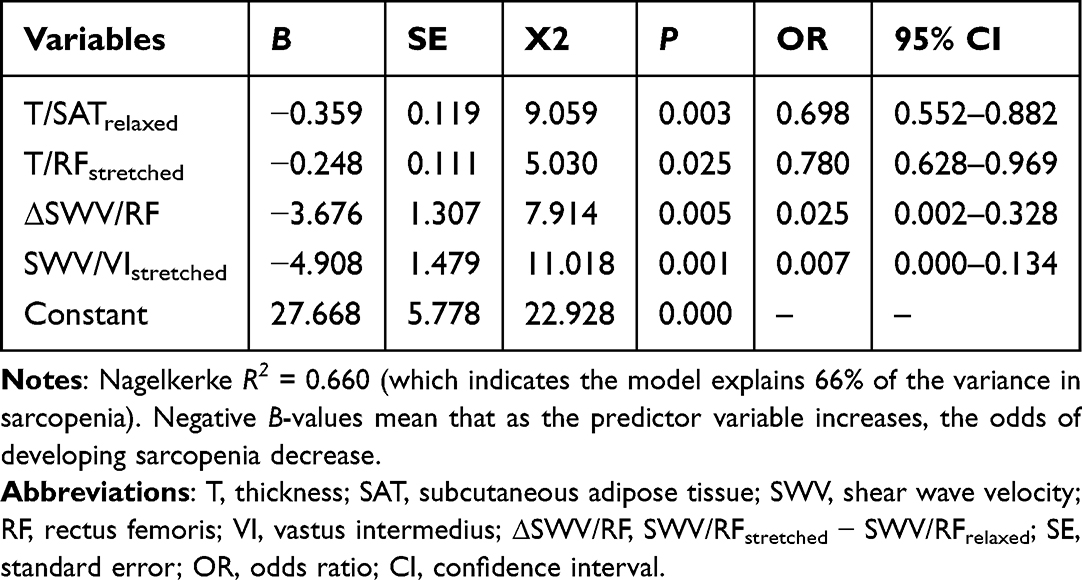 |
Table 5 Multivariable Logistic Regression Analysis for Sarcopenia |
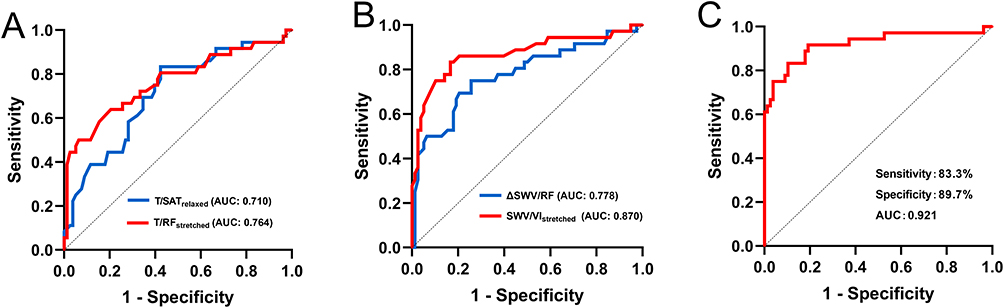 |
Figure 4 ROC curve analysis of T/SATrelaxed, T/RFstretched, ΔSWV/RF, SWV/VIstretched, and the prediction model for diagnosing sarcopenia in patients with CVD. (A) The AUC of T/SATrelaxed and T/RFstretched. (B) The AUC of ΔSWV/RF and SWV/VIstretched.(C) The AUC, sensitivity, and specificity of the prediction model. Abbreviations: T, thickness, SAT, subcutaneous adipose tissue; SWV, shear wave velocity; RF, rectus femoris; VI, vastus intermedius; ΔSWV/RF, SWV/RFstretched-SWV/RFrelaxed; ROC, receiver operating characteristic; AUC, area under the curve; CVD, cardiovascular disease. |
Disscusion
Our study demonstrated that ultrasound combined with SWE could reflect muscle quality by quantifying the muscle volume and stiffness of the RF and VI, and they could be used to assess sarcopenia in patients with CVD. Numerous studies have indicated that the presence of sarcopenia increases the risk of heart disease and stroke.25–28 Gao et al10 proved in 11,863 middle-aged and elderly individuals that sarcopenia was independently and positively correlated with the incidence of CVD. Meanwhile, Alessandra M Campos et al29 found that sarcopenia was associated with subclinical atherosclerosis and endothelial dysfunction. CVD caused low-grade chronic systemic inflammation and metabolic abnormalities in patients, which in turn lead to muscle atrophy, as well as significant declines in physical function, capacity, and performance. Therefore, accurate identification of sarcopenia in CVD patients is of paramount importance.
This study included 114 patients with CVD, among whom the prevalence of sarcopenia was 31.58%. Patients in the sarcopenia group were significantly older and exhibited lower body weight and BMI compared to the non-sarcopenia group, similar to previous studies.30–32 Additionally, the sarcopenia group demonstrated significantly lower SARC-CalF scores and poorer nutritional status. As Damluji et al9 reported, patients with CVD experience disruptions in normal muscle cell metabolism due to factors such as metabolic disorders and inflammatory states, which can trigger or exacerbate sarcopenia. Notably, in terms of grip strength, a conventional indicator used to evaluate muscle strength, there was no statistically significant difference between the two groups in this study. This seems to contradict the results of previous studies.5,33 The reason may be attributable to the high proportion of females (67.95%) in the non-sarcopenic group. Given women’s physiological predisposition to lower grip strength compared to men, this gender imbalance likely masked the underlying between-group differences. The majority of ultrasound paraments in this study were highly correlated with calf circumference, handgrip strength, 6-m walking speed, and ASMI. These indicate that ultrasound can be used as an effective alternative visualization method for evaluating muscle mass and strength, providing a new technical means for the early detection and monitoring of sarcopenia in CVD patients.
In patients with CVD, aging leads to disruption of muscle homeostasis and neuronal degeneration, contributing to satellite cell senescence. Concurrently, the loss of type II fibers and functional motor units results in muscle atrophy and decreased contractile strength, ultimately progressing to sarcopenia.34 Previous studies have predominantly used ultrasound to visualize muscle mass by measuring muscle thickness and CSA.35,36 The thicker the muscle and the greater its CSA, the more muscle fibers it contains, thereby resulting in greater muscle mass. For instance, Han et al33 reported in a study on ultrasound assessment of sarcopenia in hypertensive patients that the thickness and CSA of the RF exhibited favorable predictive capacity for sarcopenia. Our findings also demonstrated that patients with sarcopenia exhibited significantly reduced T/RF, CSA/RF, and T/(RF+VI) compared to non-sarcopenic individuals, both during relaxated and passive stretched states. These suggest that ultrasonic measurements of muscle thickness and CSA may serve as effective predictive indicators for sarcopenia in patients with CVD.
Intramuscular fatty infiltration, referring to ectopic fat deposition within muscle tissue, constitutes one of the significant pathophysiological alterations in patients with sarcopenia.37 Our findings revealed that sarcopenic patients exhibited lower clinical parameter values for SAV and lower ultrasonic parameter values for T/SATrelaxed compared to non-sarcopenic individuals, while demonstrating higher present of FE/RF. A study has shown that an increase in thigh intermuscular fat is an important predictor of walking speed decline.38 In this study, the 6-m walking speed of sarcopenic patients was also significantly lower than that of non-sarcopenic individuals, implying that fat infiltration into muscles leads to loss of mobility. This may be attributed to excessive intramuscular fat accumulation inducing a proinflammatory state. Chronic inflammation was associated with reduced muscle strength and impaired muscle fiber contractility, thereby leading to progressive loss of muscle mass and related functions.9,39
Further, lipid accumulation and muscle fiber atrophy may lead to changes in muscle stiffness in sarcopenic patients. SWE is a portable and radiation-free imaging technique that enables real-time direct quantification of tissue elastic properties.40 The propagation speed of SWE in adipose tissue is lower than that in muscle tissue, leading to a decrease in SWV, which indicates a reduction in muscle stiffness. Previous studies have shown that SWE of the muscle could be used for the diagnosis of sarcopenia in patients with chronic obstructive pulmonary disease,20 type 2 diabetes,41 and maintenance hemodialysis.42 In the present study, we similarly observed that the SWV/RF and SWV/VI in CVD patients with sarcopenia was significantly lower than that in non-sarcopenic patients in both relaxed and passive stretched states, as well as the difference between the two states. These findings provide critical insights beyond structural measurements by conventional ultrasound. The lower SWV primarily reflects the degradation of intrinsic muscle quality due to fat infiltration and fibrosis.43,44 Furthermore, the specifically reduced ΔSWV reveals a loss of the muscle’s elastic response, providing a direct biomechanical explanation for the observed physical decline. Therefore, SWE adds significant functional diagnostic value by linking muscle quality deterioration to functional impairment, offering a potential biomarker for early intervention in CVD patients with sarcopenia.
Narici et al45 reported that the ultrasound sarcopenia index based on muscle geometric proportion changes measured by ultrasound can stratify the severity of sarcopenia. Additionally, Chen et al5 demonstrated that conventional ultrasound combined with SWE can diagnose sarcopenia in type 2 diabetes patients. However, the potential value of ultrasound combined with SWE in diagnosing sarcopenia in CVD patients remains unclear. In this study, we found that T/SATrelaxed, T/RFstretched, ΔSWV/RF, and SWV/VIstretched effectively predicted sarcopenia in CVD patients. The combination of aforementioned conventional ultrasound and SWE parameters showed higher diagnostic value, with a larger area under the curve (AUC=0.921), 83.3% sensitivity, and 89.7% specificity. These findings indicate that ultrasound imaging techniques have potential diagnostic value for sarcopenia in CVD patients. The integration of this combined ultrasound approach into existing CVD management pathways appears feasible, and its cost-effectiveness relative to the substantial burden of sarcopenia-related complications warrants future investigation.
However, this study still has several limitations. First, as a single-center investigation with a relatively small sample size of sarcopenic patients, it may be susceptible to selection bias. Second, the study focused exclusively on the RF and VI, which cannot represent the change trend of systemic muscles. Finally, the study population was limited to stable CVD patients, and it remains unclear whether these results apply to those experiencing acute exacerbation of CVD. Future studies should include larger sample sizes, assess multiple muscle groups, and incorporate diverse populations from multi-center cohorts with varying CVD severity to improve generalizability. Furthermore, establishing standardized SWE parameters cutoff values for sarcopenia and evaluating their prognostic utility in CVD patients would be of great clinical value.
In conclusion, conventional ultrasound combined with SWE provides a novel and quantitative approach for visualizing alterations in muscle mass and stiffness, facilitating early identification of sarcopenia in CVD patients and offering reliable imaging evidence for clinical intervention. While the single-center design and focus on lower-limb muscles represent a limitation, our findings laid a solid foundation for future multi-center studies to explore the value of these ultrasound biomarkers in CVD outcomes.
Data Sharing Statement
The data that support the findings of this study are available from the corresponding author upon reasonable request.
Funding
This work was financially supported by Plan on enhancing scientific research in GMUPlan on enhancing scientific research in GMU (Grant number: 2024SRP113), Guangzhou Municipal Science and Technology Program project (Grant number 2025A03J3763), and the Guangzhou Health Science and Technology Project (Grant number 20241A011092).
Disclosure
The authors report no conflicts of interest in this work.
References
1. Sayer AA, Cooper R, Arai H, et al. Sarcopenia. Nat Rev Dis Primers. 2024;10(1):68. doi:10.1038/s41572-024-00550-w
2. Chen LK, Woo J, Assantachai P, et al. Asian Working Group for Sarcopenia: 2019 Consensus Update on Sarcopenia Diagnosis and Treatment. J Am Med Dir Assoc. 2020;21(3):300–307.e302. doi:10.1016/j.jamda.2019.12.012
3. Alonso-Puyo J, Izagirre-Fernandez O, Crende O, Valdivia A, García-Gallastegui P, Sanz B. Experimental models as a tool for research on sarcopenia: a narrative review. Ageing Res Rev. 2024;101:102534. doi:10.1016/j.arr.2024.102534
4. Vettoretti S, Caldiroli L, Armelloni S, Ferrari C, Cesari M, Messa P. Sarcopenia is Associated with Malnutrition but Not with Systemic Inflammation in Older Persons with Advanced CKD. Nutrients. 2019;11(6):1378. doi:10.3390/nu11061378
5. Chen ZT, Jin FS, Guo LH, et al. Value of conventional ultrasound and shear wave elastography in the assessment of muscle mass and function in elderly people with type 2 diabetes. Eur Radiol. 2023;2023:1.
6. Duarte MP, Almeida LS, Neri SGR, et al. Prevalence of sarcopenia in patients with chronic kidney disease: a global systematic review and meta-analysis. J Cachexia, Sarcopenia Muscle. 2024;15(2):501–512. doi:10.1002/jcsm.13425
7. Roth GA, Mensah GA, Johnson CO, et al. Global Burden of Cardiovascular Diseases and Risk Factors, 1990–2019: update From the GBD 2019 Study. J Am Coll Cardiol. 2020;76(25):2982–3021. doi:10.1016/j.jacc.2020.11.010
8. Yusuf S, Joseph P, Rangarajan S, et al. Modifiable risk factors, cardiovascular disease, and mortality in 155 722 individuals from 21 high-income, middle-income, and low-income countries (PURE): a prospective cohort study. Lancet. 2020;395(10226):795–808. doi:10.1016/S0140-6736(19)32008-2
9. Damluji AA, Alfaraidhy M, AlHajri N, et al. Sarcopenia and Cardiovascular Diseases. Circulation. 2023;147(20):1534–1553. doi:10.1161/CIRCULATIONAHA.123.064071
10. Gao K, Cao LF, Ma WZ, et al. Association between sarcopenia and cardiovascular disease among middle-aged and older adults: findings from the China health and retirement longitudinal study. EClinicalMedicine. 2022;44:101264. doi:10.1016/j.eclinm.2021.101264
11. Nunes-Pinto M, Bandeira de Mello RG, Pinto MN, et al. Sarcopenia and the biological determinants of aging: a narrative review from a geroscience perspective. Ageing Res Rev. 2025;103:102587. doi:10.1016/j.arr.2024.102587
12. Iwakami N, Nagai T, Furukawa TA, et al. Prognostic value of malnutrition assessed by Controlling Nutritional Status score for long-term mortality in patients with acute heart failure. Int J Cardiol. 2017;230:529–536. doi:10.1016/j.ijcard.2016.12.064
13. Potter AW, Nindl LJ, Soto LD, et al. High precision but systematic offset in a standing bioelectrical impedance analysis (BIA) compared with dual-energy X-ray absorptiometry (DXA). BMJ Nutr Prev Health. 2022;5(2):254–262. doi:10.1136/bmjnph-2022-000512
14. Perkisas S, Baudry S, Bauer J, et al. Application of ultrasound for muscle assessment in sarcopenia: towards standardized measurements. Eur Geriatr Med. 2018;9(6):739–757. doi:10.1007/s41999-018-0104-9
15. Zhang Y, Zhang Y, Wang H, Zhu A, Shi H. A Novel Two-dimensional Quantitative Shear Wave Elastography Mode for Differential Diagnosis of Benign and Malignant Thyroid Nodules. Adv Ultrasound Diagnosis Ther. 2020;4(3):195–203. doi:10.37015/AUDT.2020.190039
16. Shi J, Yang S, Niu Q, et al. Correlation of sonographic features with prognostic factors in ductal carcinoma in situ of the breast: an exploratory study using ultrasound and shear wave elastography. BMC Med Imaging. 2024;24(1):327. doi:10.1186/s12880-024-01494-z
17. Zhang Y, Ding H, Wu S, et al. Histological Reference for Shear Wave Elastography in Liver Fibrosis: collagen Quantification and Scoring System. Adv Ultrasound Diagnosis Ther. 2019;3(3):87–96. doi:10.37015/AUDT.2019.190815
18. Tian Y, Zhao Y, Huang Y. The Diagnostic Value of Real-time Shear Wave Ultrasound Elastography in the Differentiation of Hepatic Hemangioma and Hepatocellular Carcinoma. Adv Ultrasound Diagnosis Ther. 2024;8(3):124–129. doi:10.37015/AUDT.2023.230057
19. Creze M, Nordez A, Soubeyrand M, Rocher L, Maître X, Bellin MF. Shear wave sonoelastography of skeletal muscle: basic principles, biomechanical concepts, clinical applications, and future perspectives. Skeletal Radiol. 2018;47(4):457–471. doi:10.1007/s00256-017-2843-y
20. Deng M, Zhou X, Li Y, et al. Ultrasonic Elastography of the Rectus Femoris, a Potential Tool to Predict Sarcopenia in Patients With Chronic Obstructive Pulmonary Disease. Front Physiol. 2021;12:783421. doi:10.3389/fphys.2021.783421
21. Ding CW, Song X, Fu XY, et al. Shear wave elastography characteristics of upper limb muscle in rigidity-dominant Parkinson’s disease. Neurol Sci. 2021;42(10):4155–4162. doi:10.1007/s10072-021-05088-3
22. Fu H, Wang L, Zhang W, Lu J, Yang M. Diagnostic test accuracy of ultrasound for sarcopenia diagnosis: a systematic review and meta-analysis. J Cachexia, Sarcopenia Muscle. 2023;14(1):57–70. doi:10.1002/jcsm.13149
23. Okyar Baş A, Baş H, Ceylan S, et al. Changes in muscle quality identified by shear-wave elastography and association with sarcopenia. JPEN J Parenter Enteral Nutr. 2023;47(2):253–264. doi:10.1002/jpen.2457
24. Xu X, Chen Y, Cai W, et al. A Multivariable Model Based on Ultrasound Imaging Features of Gastrocnemius Muscle to Identify Patients With Sarcopenia. J Ultrasound Med. 2023;42(9):2045–2055. doi:10.1002/jum.16223
25. Lena A, Anker MS, Springer J. Muscle Wasting and Sarcopenia in Heart Failure-The Current State of Science. Int J Mol Sci. 2020;21(18):6549. doi:10.3390/ijms21186549
26. Zhang N, Zhu WL, Liu XH, et al. Prevalence and prognostic implications of sarcopenia in older patients with coronary heart disease. J Geriatr Cardiol. 2019;16(10):756–763. doi:10.11909/j.issn.1671-5411.2019.10.002
27. Kang DO, Park SY, Choi BG, et al. Prognostic Impact of Low Skeletal Muscle Mass on Major Adverse Cardiovascular Events in Coronary Artery Disease: a Propensity Score-Matched Analysis of a Single Center All-Comer Cohort. J Clin Med. 2019;8(5):712. doi:10.3390/jcm8050712
28. Xia MF, Chen LY, Wu L, et al. Sarcopenia, sarcopenic overweight/obesity and risk of cardiovascular disease and cardiac arrhythmia: a cross-sectional study. Clin Nutr. 2021;40(2):571–580. doi:10.1016/j.clnu.2020.06.003
29. Campos AM, Moura FA, Santos SN, Freitas WM, Sposito AC. Sarcopenia, but not excess weight or increased caloric intake, is associated with coronary subclinical atherosclerosis in the very elderly. Atherosclerosis. 2017;258:138–144. doi:10.1016/j.atherosclerosis.2017.01.005
30. Cho MR, Lee S, Song SK. A Review of Sarcopenia Pathophysiology, Diagnosis, Treatment and Future Direction. J Korean Med Sci. 2022;37(18):e146. doi:10.3346/jkms.2022.37.e146
31. Ali S, Garcia JM. Sarcopenia, cachexia and aging: diagnosis, mechanisms and therapeutic options - a mini-review. Gerontology. 2014;60(4):294–305. doi:10.1159/000356760
32. Sayer AA, Cruz-Jentoft A. Sarcopenia definition, diagnosis and treatment: consensus is growing. Age Ageing. 2022;51(10). doi:10.1093/ageing/afac220
33. Han X, Li Q, Zhang G, Zhang Z. Application value of two-dimensional ultrasound and shear-wave elastography parameters in evaluating sarcopenia with essential hypertension. Quant Imaging Med Surg. 2025;15(1):831–842. doi:10.21037/qims-24-1718
34. Prokopidis K, Isanejad M, Akpan A, et al. Exercise and nutritional interventions on sarcopenia and frailty in heart failure: a narrative review of systematic reviews and meta-analyses. ESC Heart Fail. 2022;9(5):2787–2799. doi:10.1002/ehf2.14052
35. Fukumoto Y, Ikezoe T, Taniguchi M, et al. Cut-off Values for Lower Limb Muscle Thickness to Detect Low Muscle Mass for Sarcopenia in Older Adults. Clin Interv Aging. 2021;16:1215–1222. doi:10.2147/CIA.S304972
36. de Luis Roman D, García Almeida JM, Bellido Guerrero D, et al. Ultrasound Cut-Off Values for Rectus Femoris for Detecting Sarcopenia in Patients with Nutritional Risk. Nutrients. 2024;16(11):1552. doi:10.3390/nu16111552
37. Tian Q, Lee PR, Yang Q, et al. The mediation roles of intermuscular fat and inflammation in muscle mitochondrial associations with cognition and mobility. J Cachexia, Sarcopenia Muscle. 2024;15(1):138–148. doi:10.1002/jcsm.13413
38. Beavers KM, Beavers DP, Houston DK, et al. Associations between body composition and gait-speed decline: results from the Health, Aging, and Body Composition study. Am J Clin Nutr. 2013;97(3):552–560. doi:10.3945/ajcn.112.047860
39. Visser M, Pahor M, Taaffe DR, et al. Relationship of interleukin-6 and tumor necrosis factor-alpha with muscle mass and muscle strength in elderly men and women: the Health ABC Study. J Gerontol a Biol Sci Med Sci. 2002;57(5):M326–332. doi:10.1093/gerona/57.5.M326
40. Ličen U, Kozinc Ž. Using Shear-Wave Elastography to Assess Exercise-Induced Muscle Damage: a Review. Sensors. 2022;22(19):7574. doi:10.3390/s22197574
41. Wang S, Xu X, Cao S, Cheng J, Wang Y, Dong Y. Sonographic methods to predict type 2 diabetes patients with sarcopenia: b mode ultrasound and shear wave elastography. Clin Hemorheol Microcirc. 2024;87(1):13–26. doi:10.3233/CH-231822
42. Zeng Y, Chen Y, Yang Y, Qiu Y, Fu P, Yuan H. Bioelectrical impedance analysis-derived phase angle predicts possible Sarcopenia in patients on maintenance hemodialysis: a retrospective study. BMC Nephrol. 2024;25(1):357. doi:10.1186/s12882-024-03787-5
43. Xu J, Fu SN, Hug F. Age-related increase in muscle stiffness is muscle length dependent and associated with muscle force in senior females. BMC Musculoskelet Disord. 2021;22(1):829. doi:10.1186/s12891-021-04519-8
44. Tanaka T, Rosano C, Huang X, et al. Plasma proteomic analysis of intermuscular fat links muscle integrity with processing speed in older adults. Alzheimers Dement. 2025;21(5):e70261. doi:10.1002/alz.70261
45. Narici M, McPhee J, Conte M, et al. Age-related alterations in muscle architecture are a signature of sarcopenia: the ultrasound sarcopenia index. J Cachexia, Sarcopenia Muscle. 2021;12(4):973–982. doi:10.1002/jcsm.12720
 © 2025 The Author(s). This work is published and licensed by Dove Medical Press Limited. The
full terms of this license are available at https://www.dovepress.com/terms
and incorporate the Creative Commons Attribution
- Non Commercial (unported, 4.0) License.
By accessing the work you hereby accept the Terms. Non-commercial uses of the work are permitted
without any further permission from Dove Medical Press Limited, provided the work is properly
attributed. For permission for commercial use of this work, please see paragraphs 4.2 and 5 of our Terms.
© 2025 The Author(s). This work is published and licensed by Dove Medical Press Limited. The
full terms of this license are available at https://www.dovepress.com/terms
and incorporate the Creative Commons Attribution
- Non Commercial (unported, 4.0) License.
By accessing the work you hereby accept the Terms. Non-commercial uses of the work are permitted
without any further permission from Dove Medical Press Limited, provided the work is properly
attributed. For permission for commercial use of this work, please see paragraphs 4.2 and 5 of our Terms.