Back to Journals » Clinical Epidemiology » Volume 7
Validity of self-reported body mass index among middle-aged participants in the Norwegian Women and Cancer study
Authors Skeie G ![]() , Mode N, Henningsen M, Borch K
, Mode N, Henningsen M, Borch K ![]()
Received 3 March 2015
Accepted for publication 16 April 2015
Published 2 July 2015 Volume 2015:7 Pages 313—323
DOI https://doi.org/10.2147/CLEP.S83839
Checked for plagiarism Yes
Review by Single anonymous peer review
Peer reviewer comments 3
Editor who approved publication: Professor Henrik Toft Sørensen
Guri Skeie,1 Nicolle Mode,1,2 Maria Henningsen,3 Kristin Benjaminsen Borch1
1Department of Community Medicine, UiT The Arctic University of Norway, Tromsø, Norway; 2National Institute on Aging, National Institutes of Health, Baltimore, MD, USA; 3Faculty of Medicine, Norwegian University of Science and Technology, Trondheim, Norway
Background: Body mass index (BMI) based on self-reported height and weight has been criticized as being biased because of an observed tendency for overweight and obese people to overestimate height and underestimate weight, resulting in higher misclassification for these groups. We examined the validity of BMI based on self-reported values in a sample of Norwegian women aged 44–64 years.
Methods: The study sample of 1,837 participants in the Norwegian Women and Cancer study self-reported height and weight, and then, within 1 year, either self-reported anthropometric again, or were measured by medical staff. Demographic and anthropometric were compared using t-tests and chi-square tests of independence. Misclassification of BMI categories was assessed by weighted Cohen's kappa and Bland–Altman plot.
Results: On average, the two measurements were taken 8 months apart, and self-reported weight increased by 0.6 kg (P<0.05), and BMI by 0.2 kg/m2 (P<0.05). The distribution of BMI categories did not differ between self-reported and measured values. There was substantial agreement between self-reported values and those measured by medical staff (weighted kappa 0.73). Under-reporting resulting in misclassification of BMI category was most common among overweight women (36%), but the highest proportion of extreme under-reporting was found in obese women (18% outside the 95% limits of agreement). The cumulative distribution curves for the measured and self-reported values closely followed each other, but measurements by medical staff were shifted slightly toward higher BMI values.
Conclusion: While there was substantial agreement between self-reported and measured BMI values, there was small but statistically significant under-reporting of weight and thus self-reported BMI. The tendency to under-report was largest among overweight women, while the largest degree of under-reporting was found in the obese group. Self-reported weight and height provide a valid ranking of BMI for middle-aged Norwegian women.
Keywords: body mass index, Norway, repeated measurements, self-report, validity, women
Background
Overweight and obesity is an increasing problem globally. The prevalence is often estimated by body mass index (BMI; weight in kg divided by squared height in meters). In epidemiological surveys, height and weight are often gathered using self-report questionnaires. This type of data collection is advantageous because it is cost-effective, rapid, and easy to administer when sampling large numbers of individuals, particularly when spread over large areas.1 However, the validity of self-reported data for body measurements has been questioned because some participants overestimate height and underestimate weight, resulting in a lower estimated BMI.1–5
A review including 64 studies published between 1979 and 2005 examined the validity of self-reported BMI and found that the mean errors varied, and the discrepancies were greatest in obese populations.1 Weight status has been shown to predict misreporting of BMI in several large studies, with overweight and obese persons being more likely to under-report BMI.2,6–10 Women have a greater tendency to underestimate BMI than men in many studies,9,11,12 but not all.2 Age has been found to predict misreporting of weight and height, with younger women under-reporting weight more than older women, while the chance of over-reporting height increases with age.6,7,11,12 However, these observed associations of age with misreporting are not universal.5 The amount of discrepancy between self-reported BMI and measured BMI varies between studies, and average discrepancies of 0.67–0.80 kg/m2 among women have been reported.2,5–9
Even though most studies find relatively small differences between self-reported and measured BMI,8,9 there is a risk that even small deviations can lead to misclassification of BMI and incorrectly estimate associations between BMI categories and incidence of disease.10 The World Health Organization classifies BMI into four categories: underweight, BMI <18.5 kg/m2; normal weight, BMI 18.5–24.9 kg/m2; overweight, BMI 25–29.9 kg/m2; and obese, BMI ≥30 kg/m2.13 Inaccurate reporting of weight and height may also result in incorrect estimates of the prevalence of overweight.
For large studies covering geographically scattered participants, self-reported data are paramount, and examinations of the validity of these data are central to interpretation of the results. Validity is a feature of the source population, and cannot be inferred from studies from other countries or groups.14 It might change over time and as social and cultural norms about the phenomenon changes.1 To the best of our knowledge, the validity of self-reported height and weight has not been described in a Norwegian population.
The purpose of this study was to examine whether self-reported weight and height in a sample of women from a large Norwegian cohort are valid indicators of BMI for use in epidemiological studies. Additionally, we wanted to study the impact of overweight status on BMI misclassification.
Subjects and methods
The Norwegian Women and Cancer (NOWAC) study is a large nationally representative prospective cohort study of women aged 30–70 years at recruitment. Started in 1991, the original purpose of the NOWAC study was to explore the relationship between oral contraceptive use and breast cancer, and the cohort currently includes over 172,000 participants (Figure 1). All participants completed an extensive questionnaire, hereafter referred to as the primary questionnaire. The study is described in detail by Lund et al.15 During 2003–2006, the NOWAC study collected blood samples and a new questionnaire (hereafter referred to as the secondary questionnaire) from recent participants born between 1943 and 1957. The blood collection took place via mail, and the women were asked to contact their general practitioners for taking the blood sample.
 | Figure 1 Design of the study. |
We focused on a random subsample of 4,498 of the women who were contacted to donate a sample of blood, and therefore were subject to a second data collection within a relatively short time span. Of the women contacted, 71% complied (n=3,194, Figure 1). To limit the time between repeated questionnaires, this study includes the 1,837 women from the random subsample who were asked for and provided a blood sample within 1 year of their primary questionnaire. The primary questionnaire included questions on hormonal and reproductive factors, smoking, alcohol, diet, height, weight, physical activity, self-reported health and some diseases and medications, socioeconomic factors, and sun tanning habits. Women were also asked to complete an additional two-page questionnaire, which accompanied the blood sample. This secondary questionnaire collected information that could influence biomarker measurements and updated some of the information from the primary questionnaire, eg, fasting status, menstruation/menopausal status, smoking, height, weight, use of dietary supplements, and medications taken in the previous 7 days.
Height and weight were self-reported in the primary questionnaire, but could be either self-reported or measured at the secondary questionnaire, and the participants were asked to indicate whether they had been measured by medical staff on the day of the blood sample. No instructions were given with regard to clothing or weight calibration to the participants or medical staff. Height was reported in centimeters and weight in whole kilograms. Values producing differences between the two measurements of more than 10 cm for height and 5 kg for weight were checked for data entry errors, but values entered on the original paper questionnaires were assumed to be accurate. Missing values for the anthropometric measurements were rare in the primary and secondary questionnaires, with 3% missing for weight and 2% missing for height observed for each questionnaire. There appeared to be a slight tendency to round to the nearest 5 kg for self-reported weight measurements when comparing the frequency of weights ending in 0 or 5 in the primary questionnaire (35%) and secondary questionnaire (31%), compared with weights measured by medical staff (25%). There was no evidence of rounding in the height measurements. BMI was grouped into four categories according to the World Health Organization classification.13
Information about age was based on birth year and provided by the National Population Register at Statistics Norway. Education, marital status, and perceived health were reported as part of the NOWAC study. Total years of education were categorized into basic or primary education (≤9 years), secondary school (10–12 years), and college educated (≥13 years). Marital status was categorized into married/living together, widowed or divorced, and unmarried. Perceived health (“Do you think of your own health as:”) was reported as very good, good, poor, or very poor. Because few women in the blood sampling group reported very poor health (n=3), the categories of poor and very poor were combined.
Statistical analysis
Baseline characteristics of the participants were compared by type of second measurement. Equality of group means was tested with two-sample t-tests with pooled variance, while categorical variables were tested using a chi-square test of independence. Statistical analyses were performed in SAS version 9.4 (SAS Institute, Cary, NC, USA), and statistical significance was defined as a test resulting in a P-value less than 0.05.
Repeated measurements of height, weight, and BMI were tested for equality using paired t-tests with pooled variance. Differences between self-reported values on the primary questionnaire and values measured by medical staff when blood was sampled (secondary questionnaire) represent both changes over time and error. Differences between repeated self-reported values are an estimate of changes in weight over time, assuming reporting bias is constant within 1 year. Two-sample t-tests with pooled variance were used to test if the differences between types of measurements (self-reported followed by medical staff-reported) were larger than repeated self-reported measurements over time. The difference in differences provides an estimate of any self-report bias.
Since BMI is often categorized when used as a risk factor, categories were created for both measurements and cross-classified. The percentage correctly classified was calculated, and the agreement between repeated BMI classifications was assessed using a weighted Cohen’s kappa coefficient.16 This coefficient measures the agreement beyond what is expected by chance. The weighting penalizes errors based upon the level of disagreement; for example, a misclassification of two categories has a greater penalty than a misclassification of only one category.
Bland–Altman analysis was used to compare the agreement between BMI based on self-reporting and values measured by medical staff, as well as between the two self-reported measurements.17 The average difference between the BMI values indicates the overall bias present in the data, while the limits of agreement (mean ± 1.96 standard deviation) indicate the precision of the measurements. For the comparison with values measured by medical staff, negative differences indicate that the BMI using medical staff values was higher than the self-reported BMI values, ie, negative differences indicate under-reporting.
In order to examine representativeness, a comparison was made of basic demographic variables between the study sample group and the independent set of women remaining in the eligible cohort. Specifically, the group of women who donated blood within a year of their questionnaire and supplied information on their anthropometric measurements (n=1,723) were compared with those in the eligible cohort, who were willing to donate a blood sample, minus the random subsample (n=91,828) using chi-square tests of independence and two sample t-tests.
Ethical issues
Participants received mailed information about the study together with the questionnaires, and indicated their consent to participate. The study received approval from the regional committee for medical research ethics for the basic collection and storing of questionnaire information and blood sampling. All data are stored with the permission of the Norwegian Data Inspectorate.15
Results
The study sample consisted of 1,837 women who donated blood within a year of their primary questionnaire. Of those, 280 women had their height and weight measured by medical staff at the time of their blood sample (ie, secondary questionnaire). The rest either self-reported their height and weight (n=1,443) or failed to indicate how the measurement was taken (n=114). The latter were excluded from further analyses. Women who self-reported their weight and height in the secondary questionnaire were similar to those who had their measurements taken by medical staff in terms of demographic characteristics (Table 1). The women had an average age of 53.7 years at the time of their primary questionnaire, with a range of 46–64 years. On average, they donated the blood sample 8 months after their primary questionnaire, with a range of 50–365 days. Comparisons of mean age and days between measurements failed to find any differences between those who self-reported anthropometric measurements at the secondary questionnaire and those who had their measurements taken by medical staff. There were no statistically significant differences between the two groups in terms of education level, marital status, or BMI category from the primary questionnaire. Women who self-reported their weight and height at both questionnaires were more likely to have reported “very good” health status on the primary questionnaire than those who had their values measured at the secondary questionnaire (P=0.05), but both groups had few women reporting poor health. At the secondary measurement, the prevalence of the different BMI categories were: underweight 1% (both groups), normal weight 51% in the self-reported group versus 49% in the measured group, overweight 34% (self-reported) versus 35% (measured), and obesity 14% (self-reported) versus 15% (measured; see data in Tables 3 and 5).
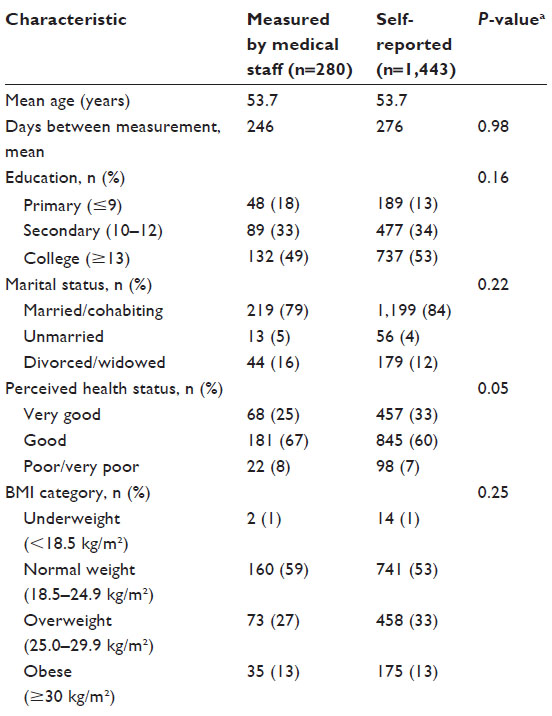 | Table 1 Baseline characteristics of study subjects by type of second measurement |
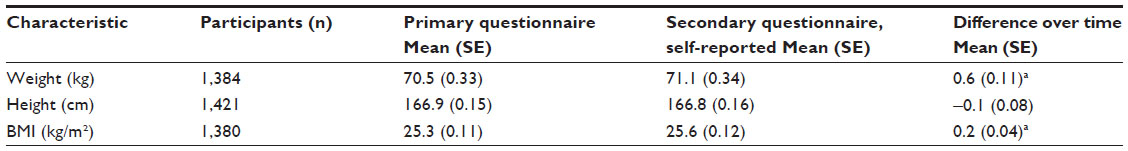 | Table 2 Estimated difference in anthropometric measurements over time, self-reported values |
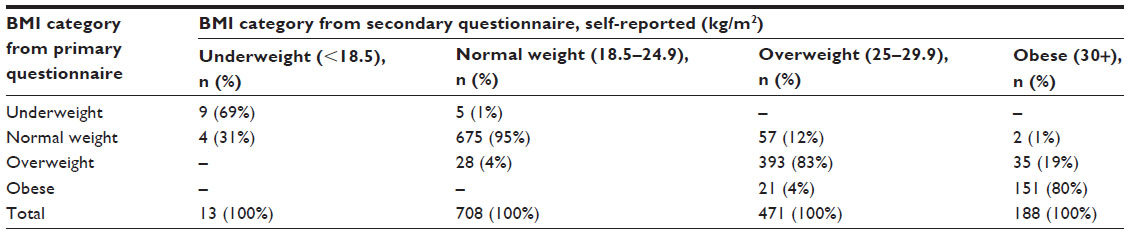 | Table 3 BMI cross-classification based on repeated self-reported values |
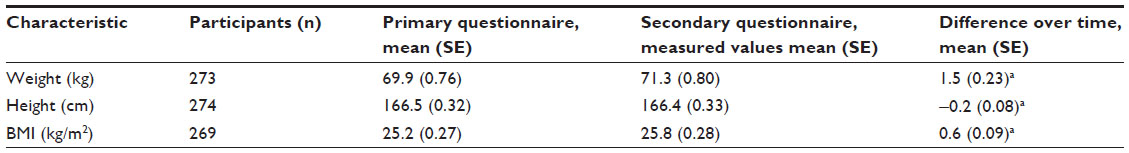 | Table 4 Estimated difference in anthropometric measurements over time between self-reporting and measurement by medical staff |
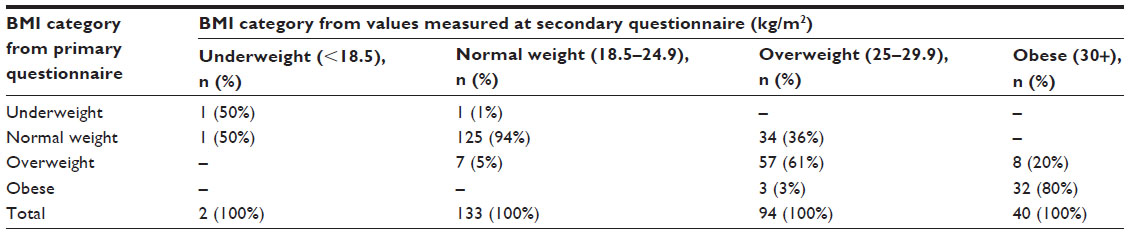 | Table 5 BMI cross-classification of self-reported and objectively measured values |
Variation in self-reported BMI over time
The majority of the study sample (79%) self-reported their height and weight at the secondary questionnaire. The repeated self-measurements provide an estimate of changes over time, assuming any bias in reporting remains equal over the time period. On average, women reported little variation in their weight and height, with average differences of 0.6 kg and –0.1 cm (Table 2). Only 10% of women reported a weight difference of more than 5 kg (gain or loss) and only 10% reported a height difference of more than 1 cm. The average difference in BMI over time was 0.2 kg/m2. The mean differences in weight and BMI, although small in value, were statistically significant.
For the women who self-reported values on both occasions (n=1,380), 11% (n=152) were assigned a different BMI category at the secondary questionnaire when compared with the primary questionnaire (Table 3), with 99% (n=150) changing only one category. Of those who changed category, the majority (n=99, 65%) increased in BMI. When examining the women who changed BMI category either upward or downward, there were no statistically significant differences. Women who increased a BMI category did not differ from those who were classified in the same category on both questionnaires in terms of education level, marital status, perceived health status, mean age, or mean days between measurements. This was also true for those that decreased a BMI category. However, there was a tendency for women who moved to a lower BMI category to report poorer health status (13% poor, 23% very good) when compared with those who did not change in BMI category (7% and 34% respectively, P=0.07). The normal weight BMI group at the secondary questionnaire had the highest percent agreement with the previously calculated BMI (95%), followed by the overweight (83%) and obese (80%) groups. Few women had BMI values that corresponded to the underweight category.
When examining the baseline classification (row percentages) in Table 3, there was not much variation with regard to how many women stayed in the same BMI category at the secondary questionnaire among those who self-reported their weight on both occasions, ie, 91% among the normal weight, 86% among the overweight, and 88% among the obese.
Self-reporting versus measurement by medical staff
When donating blood, 15% of the participating women (n=280) had one of the medical staff measure their height and weight for the secondary questionnaire. Mean weight as reported by medical staff was on average 1.5 kg higher than that self-reported by women in the primary questionnaire (Table 4). Height, on average, was 0.2 cm less than the self-reported values, and BMI calculated from the medical staff values was 0.6 kg/m2 higher than BMI calculated from self-reported values. While the differences are all small in value, they are statistically significant in paired t-tests. Repeated measurements over time can be expected to change, and we estimated these changes for the study sample in the previous section (Table 2). Comparisons of the differences in reporting method (self-reported, measured by medical staff) and changes over time give an indication of self-report bias. Weight measured by medical staff showed a larger increase on average than expected by changes over time (0.9 kg) and the mean difference between reporting methods was significantly larger than that observed between repeated self-reports (P<0.001). Height did not differ significantly more between reporting methods than expected through repeated self-reports. In line with the mean increase in weight, BMI measured by medical staff increased on average by 0.4 kg/m2 more than observed through repeated self-reports, which is a statistically significant increase (P=0.002).
Calculated BMI categories from self-reporting and values measured by medical staff differed for 20% of the women (n=54) by one category (Table 5). Of those who changed category, the majority (n=43, 80%) increased in BMI. Women who increased one BMI category did not differ from those who were classified in the same category on both questionnaires in terms of education level, marital status, perceived health status, mean age, or mean days between measurements. While the majority of women in the sample were married (Table 1), the 11 women who decreased in BMI category between self-reporting and values measured by medical staff were almost evenly split between married/cohabiting and unmarried (Fisher’s exact test, P=0.04). These women did not differ on any other demographic variables. Women with normal weight as measured by the medical staff had the highest agreement with the self-reported measure (94%), followed by obese women (80%). The highest level of misclassification was among overweight women, where 36% had self-reported values that corresponded to normal weight and 3% had self-reported BMI in the obese range (Table 5). The weighted kappa assessing the agreement between values measured by medical staff and self-reported values was 0.73 (95% confidence interval 0.67–0.80) which corresponds to substantial agreement.18 In comparison, the expected agreement was 0.39 (data not shown).
When examining the baseline classification (row percentages) in Table 5, a slightly different picture emerges. Among the self-reported obese, 91% were obese when objectively measured, while among the normal weight (78%) and overweight (79%), this percentage was lower. In the self-reported normal weight group, most of the misreporters belonged to the overweight category when measured by medical staff (21%), while the misreporters among the overweight were fairly evenly spread among normal weight and obese when measured by medical staff (10% and 11%, respectively).
The overall mean difference between the average of self-reported BMI and that measured by medical staff was −0.29 kg/m2, indicating a small bias toward under-reporting of BMI in self-reported values. The 95% limits of agreement (Figure 2) for the differences between the two measurements demonstrate both high overall precision and higher variation between measurements for women in the obese BMI category compared with those in the normal range. Women with an average BMI in the obese range were more likely to have under-reported their BMI beyond the 95% limits of agreement (18%, 6/33) than those with an average BMI in the overweight range (5%, 4/82). Over the entire range of BMI values, the level of agreement between the two measurements was substantial, as demonstrated by very similar cumulative distribution curves (Figure S1). The under-reporting was slightly greater than that observed for repeated self-reports, which also showed greater variation in the obese BMI range, with 12% of women outside the 95% limits of agreement compared with only 6% outside the limits for the remaining women (Figure 2).
 | Figure 2 Difference in BMI between the two measurements versus the average of the two values. |
Representativeness
There were no statistically significant differences between the eligible cohort and those in the study sample in terms of self-reported weight or perceived health status. There were small but statistically significant differences in terms of mean age at the time of the primary questionnaire (53.9 years in the eligible cohort compared with 53.7 years in the study sample P=0.04), marital status (P=0.04), and height (166.8 cm compared with 166.4 cm, P=0.008). Women in the study sample were more likely to be married (83%) than those in the eligible cohort (81%). There was a significant difference between the two groups of women in level of education, with a higher proportion of women in the study sample having a college degree (52%) than those in the comparison group (46%, P<0.001).
Discussion
In this study, we estimated the misreporting of self-reported weight and height by comparing repeated self-reports with self-reported values followed by values measured by medical staff. The two groups did not differ except for better perceived health among those who gave repeated self-reports. The distribution of BMI categories did not differ between self-reported and measured values. Weight and BMI were under-reported more by the repeated self-reporting group, but there was substantial agreement between self-reported values and those measured by medical staff (weighted kappa for BMI 0.73). Under-reporting leading to misclassification of BMI category was most common among overweight women (36%), but the highest proportion of extreme under-reporters was found in the obese women (18% outside the 95% limits of agreement). The highest proportion of correctly classified women based on the primary self-reported measurement was found among the obese women.
Although the design of this validation study differs from that of most other studies, our findings are in accordance with studies comparing self-reported weight and height with weight and height measured by medical staff within a short time period. The difference in self-reported BMI and BMI measured by medical staff in our study was small but statistically significant, ie, −0.4 kg/m2, and lower than what was found in women in the Adventist Health Study (−0.7 kg/m2),2 EPIC-Norfolk (−0.92 kg/m2),19 Multiethnic Cohort (−0.67 kg/m2),8 the Sister Study (−0.7 kg/m2),6 and in the Skaraborg project (−0.8 kg/m2),7 women attending a US family medicine clinic (−0.8 kg/m2),5 and female participants in the National Health and Nutrition Education Survey III (−0.67 kg/m2).9 The results were similar to those found for women in an Austrian study (−0.43 kg/m2),20 but the difference was larger than what was found in Australian women (−0.12 kg/m2).21 An earlier review found mean differences between self-reported and measured BMI of 0.9 to −1.2 kg/m2 in women from the general population.1 As in most other studies, the errors in BMI were due to under-reporting of weight, and there was no significant misreporting of height. In the National Health and Nutrition Education Survey III, high correlations was found between self-reported and measured BMI, and also between self-reported and measured BMI and disease biomarkers.9 The correlations did not differ much by age, sex, or obesity status. Further, the results were the same when the analyses were done with percent body fat rather than BMI as the measure of adiposity.
Stommel et al found that women aged 42–55 years reported BMI more in accordance with direct measures than either their younger or older counterparts,22 and most of our participants were in that age range. A more recent paper found that there have been temporal changes in the precision of self-reported height and weight, leading to more accurate BMI estimations.23 As the opposite has also been found,24 there could be cultural differences in accuracy of self-reported anthropometric values, but we have not found other Norwegian publications for comparison.
Correlations between self-reported and measured BMI are generally high (>0.90 in all ethnic groups9), but they are not adequate for measuring reliability, because they are testing associations rather than agreement, and are not able to identify systematic errors.25 The percentage of agreement includes both the precision of the measurement and the frequency of errors, and has clinical meaning, while graphical presentations are useful for displaying distributions and the magnitude of error.25 In general, substantial agreement between BMI categorizations based on self-reporting and measured values has been found, but self-reported values tend to give a lower BMI category,1,2,7,11,20 especially in overweight and obese subjects.3,4,12,26,27 Kappa values between 0.66 and 0.81 have been reported,2,12,19,21 and our value of 0.73 fits well with this. In our study, 80% of the women were correctly classified, similar to what others have found.2,5,21 Studies vary as to whether the percentage of correctly classified women is lowest among the overweight5,21 or obese.6–8,12,19,20 In our study, the percentage was lowest among the overweight when the underweight group (n=2 measured by medical staff) was disregarded. When examining those who were measured by medical staff based on their self-reported BMI category at baseline, the highest percentage of correctly classified participants was found in the obese group (91%). Hence, the lower percentage of correctly classified obese women based on the measured values was due to misclassification (under-reporting) among those who were self-reported overweight rather than misclassification (over-reporting) among the obese.
The repeated self-reported values indicated a greater range of values for those with an average BMI in the obese range compared with other women. This may indicate errors in measurement or changes in reporting bias, but could also indicate greater variation in weight over time for women in the obese range.
In a large public health study from Spain, after adjusting for predictors of under-reporting of BMI, especially dissatisfaction with body size, the estimated overweight prevalence increased from 15.0% to 18.5%.3 A large validity study of self-reported BMI in the National Health and Nutrition Education Survey concluded that self-reports are sufficient for most epidemiological studies, but not for prevalence studies.9 In our study, the prevalence of overweight and obesity did not differ when using self-reported and measured values. Since the validation subsample was representative, and there was no difference between the self-reported and measured group, except in perceived health status, it seems that the self-reported values may be utilized for estimating prevalence of overweight and, in particular, obesity.
Comparisons failed to find any differences between those whose anthropometric measurements were self-reported in the secondary questionnaire and those who were measured by medical staff, except that women who gave repeated self-reports were more likely to report “very good” health status on the primary questionnaire than those who had their values measured for the secondary questionnaire. It is likely that perceived health influences what kind of questions a woman asks the medical staff (blood sample only, or also anthropometric measurements). Also, women who perceived their health as good might not be interested in receiving feedback from medical staff or in spending any additional time in the office. There was no difference in the prevalence of self-perceived poor health between the two groups.
We have previously shown that participants in the NOWAC study are representative of the female Norwegian population as a whole,28 except for higher education than non-responders, and that cancer rates are the same in our cohort as in the general female population of the same age.15 In the current study, education was the only factor where significant differences were found between women who gave blood and the remaining cohort. Women with higher education seemed to be more willing to contribute to research. There were no significant differences in BMI between the different education groups, so the validity of the present study is not threatened.
The strengths of this study include the representativeness of the study sample and the unbiased study design. Participants were not aware that their anthropometric measurements might be checked when providing their primary height and weight information. Knowledge of future measurement of weight by medical staff may lead to more accurate reporting.27
This study has some limitations. Different measurement instruments were used for different participants; they were not calibrated nor were precise instructions provided. Participants with values measured by medical staff would have used a different scale and measuring tape at home when providing the primary self-reported values. This variation in instruments undoubtedly increased the variability in the measurements and the measurement error. Failure to calibrate instruments has been shown to increase the prevalence of overweight and obesity in population-based samples.29 However, digital home bathroom scales have been shown to provide sufficiently accurate and consistent weights for public health research purposes.30
Further, the mean time lapse between measurements was quite long (8 months), but as the difference was equal in both groups, this complicates only the study design and not the final results. Body weight may naturally shift up and down over time, so we studied differences in excess of what was found with repeated self-reports, assuming constant misreporting over the year. This could be questioned, but since the data collection took place over years, the results should be robust to seasonal variations.
The results of this study show that self-reported data successfully distinguish between the obese and nonobese, and although there were some more misreporters among the overweight, the results are comparable with those of other studies. Being able to correctly classify the obese is important, given that the association between BMI and mortality or morbidity is strongest for this group.31,32
Conclusion
Women who had their weight measured after having self-reported had a significantly higher weight than those who self-reported twice. The tendency of under-reporting was largest among overweight women, while the most extreme under-reporters were found in the obese group. Despite the under-reporting, the discrepancies between self-reported and directly measured BMI in women were small, and the agreement between self-reported and measured values was substantial, as demonstrated by the cumulative distribution of the BMI curves. Our self-reported weight and height data provide a valid ranking of BMI for middle-aged Norwegian women.
Acknowledgments
We thank all the participants in the Norwegian Women and Cancer study, as well as all the scientific and administrative staff that worked on this study over the years.
Author contributions
All authors contributed toward data analysis, drafting and revising the paper and agree to be accountable for all aspects of the work.
Disclosure
This article was prepared while N. Mode was employed at the University of Tromsø. The opinions expressed in this article are the authors’ own and do not reflect the view of the National Institutes of Health, the Department of Health and Human Services, or the United States Government. The authors report no other conflicts of interest in this work.
References
Connor Gorber S, Tremblay M, Moher D, Gorber B. A comparison of direct vs self-report measures for assessing height, weight and body mass index: a systematic review. Obes Rev. 2007;8(4):307–326. | |
Bes-Rastrollo M, Sabate J, Jaceldo-Siegl K, Fraser GE. Validation of self-reported anthropometrics in the Adventist Health Study 2. BMC Public Health. 2011;11:213. | |
Gil J, Mora T. The determinants of misreporting weight and height: the role of social norms. Econ Hum Biol. 2011;9(1):78–91. | |
Larsen JK, Ouwens M, Engels RC, Eisinga R, van Strien T. Validity of self-reported weight and height and predictors of weight bias in female college students. Appetite. 2008;50(2–3):386–389. | |
Brunner Huber LR. Validity of self-reported height and weight in women of reproductive age. Matern Child Health J. 2007;11(2):137–144. | |
Lin CJ, DeRoo LA, Jacobs SR, Sandler DP. Accuracy and reliability of self-reported weight and height in the Sister Study. Public Health Nutr. 2012;15(6):989–999. | |
Nyholm M, Gullberg B, Merlo J, Lundqvist-Persson C, Rastam L, Lindblad U. The validity of obesity based on self-reported weight and height: Implications for population studies. Obesity. 2007;15(1):197–208. | |
Lim U, Wilkens LR, Albright CL, Novotny R, Le Marchand L, Kolonel LN. University of Hawai’i Cancer Center Connection: bias in self-reported anthropometry in relation to adiposity and adulthood weight gain among postmenopausal Caucasian and Japanese American Women. Hawaii J Med Public Health. 2013;72(12):445–449. | |
McAdams MA, Van Dam RM, Hu FB. Comparison of self-reported and measured BMI as correlates of disease markers in US adults. Obesity. 2007;15(1):188–196. | |
Oliveira A, Ramos E, Lopes C, Barros H. Self-reporting weight and height: misclassification effect on the risk estimates for acute myocardial infarction. Eur J Public Health. 2009;19(5):548–553. | |
Merrill RM, Richardson JS. Validity of self-reported height, weight, and body mass index: findings from the National Health and Nutrition Examination Survey, 2001–2006. Prev Chronic Dis. 2009;6(4):A121. | |
Taylor AW, Dal Grande E, Gill TK, et al. How valid are self-reported height and weight? A comparison between CATI self-report and clinic measurements using a large cohort study. Aust N Z J Public Health. 2006;30(3):238–246. | |
World Health Organization. BMI Classification. 2012. Available from: http://www.who.int/features/factfiles/obesity/facts/en/. Accessed May 16, 2015. | |
DeVellis RF. Scale Development: Theory and Applications. Los Angeles, CA, USA: Sage; 2012. | |
Lund E, Dumeaux V, Braaten T, et al. Cohort profile: the Norwegian Women and Cancer Study – NOWAC – Kvinner og kreft. Int J Epidemiol. 2008;37(1):36–41. | |
Agresti A. Categorical Data Analysis. 2nd ed. Hoboken, NJ: John Wiley and Sons, Inc.; 2002. | |
Bland JM, Altman DG. Measuring agreement in method comparison studies. Stat Methods Med Res. 1999;8(2):135–160. | |
Landis JR, Koch GG. The measurement of observer agreement for categorical data. Biometrics. 1977;33(1):159–174. | |
Park JY, Mitrou PN, Keogh RH, Luben RN, Wareham NJ, Khaw KT. Effects of body size and sociodemographic characteristics on differences between self-reported and measured anthropometric data in middle-aged men and women: the EPIC-Norfolk study. Eur J Clin Nutr. 2011;65(3):357–367. | |
Grossschadl F, Haditsch B, Stronegger WJ. Validity of self-reported weight and height in Austrian adults: sociodemographic determinants and consequences for the classification of BMI categories. Public Health Nutr. 2012;15(1):20–27. | |
Burton NW, Brown W, Dobson A. Accuracy of body mass index estimated from self-reported height and weight in mid-aged Australian women. Aust N Z J Public Health. 2010;34(6):620–623. | |
Stommel M, Schoenborn CA. Accuracy and usefulness of BMI measures based on self-reported weight and height: findings from the NHANES and NHIS 2001–2006. BMC Public Health. 2009;9:421. | |
Stommel M, Osier N. Temporal changes in bias of body mass index scores based on self-reported height and weight. Int J Obes (Lond). 2013;37(3):461–467. | |
Shiely F, Hayes K, Perry IJ, Kelleher CC. Height and weight bias: the influence of time. PLoS One. 2013;8(1):e54386. | |
Engstrom JL. Assessment of the reliability of physical measures. Res Nurs Health. 1988;11(6):383–389. | |
May AM, Barnes DR, Forouhi NG, et al. Prediction of measured weight from self-reported weight was not improved after stratification by body mass index. Obesity. 2013;21(1):E137–E142. | |
Flood V, Webb K, Lazarus R, Pang G. Use of self-report to monitor overweight and obesity in populations: some issues for consideration. Aust N Z J Public Health. 2000;24(1):96–99. | |
Lund E, Kumle M, Braaten T, et al. External validity in a population-based national prospective study – the Norwegian Women and Cancer Study (NOWAC). Cancer Causes Control. 2003;14(10):1001–1008. | |
Biehl A, Hovengen R, Meyer HE, et al. Impact of instrument error on the estimated prevalence of overweight and obesity in population-based surveys. BMC Public Health. 2013;13:146. | |
Yorkin M, Spaccarotella K, Martin-Biggers J, Quick V, Byrd-Bredbenner C. Accuracy and consistency of weights provided by home bathroom scales. BMC Public Health. 2013;13(1):1194. | |
Hjartaker A, Adami HO, Lund E, Weiderpass E. Body mass index and mortality in a prospectively studied cohort of Scandinavian women: the Women’s Lifestyle and Health Cohort Study. Eur J Epidemiol. 2005;20(9):747–754. | |
Flegal KM, Kit BK, Orpana H, Graubard BI. Association of all-cause mortality with overweight and obesity using standard body mass index categories: a systematic review and meta-analysis. JAMA. 2013;309(1):71–82. |
Supplementary material
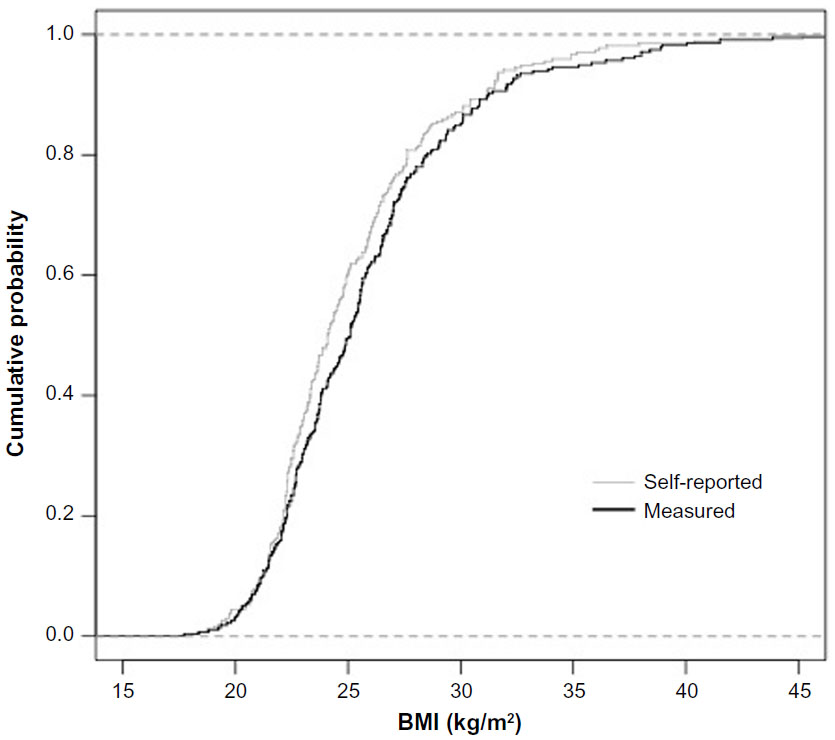 | Figure S1 Cumulative distribution plot of self-reported and measured BMI. |
 © 2015 The Author(s). This work is published and licensed by Dove Medical Press Limited. The
full terms of this license are available at https://www.dovepress.com/terms
and incorporate the Creative Commons Attribution
- Non Commercial (unported, 3.0) License.
By accessing the work you hereby accept the Terms. Non-commercial uses of the work are permitted
without any further permission from Dove Medical Press Limited, provided the work is properly
attributed. For permission for commercial use of this work, please see paragraphs 4.2 and 5 of our Terms.
© 2015 The Author(s). This work is published and licensed by Dove Medical Press Limited. The
full terms of this license are available at https://www.dovepress.com/terms
and incorporate the Creative Commons Attribution
- Non Commercial (unported, 3.0) License.
By accessing the work you hereby accept the Terms. Non-commercial uses of the work are permitted
without any further permission from Dove Medical Press Limited, provided the work is properly
attributed. For permission for commercial use of this work, please see paragraphs 4.2 and 5 of our Terms.